Experimental and numerical study on pressure oscillation in a combustor with rotary valve
Yunzhi XI, Ningfei WANG, Junwei LI, Zhihui ZHANG, Lei HAN
School of Aerospace Engineering, Beijing Institute of Technology, Beijing 100081, China
KEYWORDS Cold gas test;Dynamic mesh;Numerical simulation;Pressure oscillation;Rotary valve
Abstract A rotary valve coupled in a combustor assembly can generate periodic pressure oscillations inside the combustor and can be used to study the combustion instability in the combustion chamber of a rocket engine. This paper proposes a cold gas flow experimental system based on a rotary valve and a corresponding rotation model. A 3D numerical model is proposed to obtain the transient flow inside the rotary valve,and the dynamic mesh technique and User-Defined Functions(UDFs)are adopted to implement a swing motion instead of a rotary motion.Several cold gas flow experiments are carried out at rotating speeds of 75 225, and 375 rpm to verify the validity of the numerical model. The effects of rotating speed, stroke length ratio and radius of the RED(Rotor Exhaust Duct) on the pressure oscillations are studied using this numerical model. The results show that the maximum and peak-to-peak values of the pressure oscillations gradually decrease with increasing rotating speed. The ratio of the corresponding peak-to-peak value to the maximum pressure(pressure amplitude ratio)is reduced from 1.81 to 0.6%.The stroke length ratio affects the pressure waveform because it leads to a change in the time spent in the non-exhaust stage. When the stroke length ratio is 0, the waveform closely resembles a sine wave. With the increase in the stroke length ratio, the pressure waveform exhibits a more square or a triangular wave shape. Finally, a high-frequency and high-amplitude pressure oscillation can be obtained by appropriately increasing the radius of the RED.
1. Introduction
Rotary valves are widely used in various fields of industrial production because of their advantages such as frequent reversing, high reliability, and high working frequency1,2Wu et al.3,4adopted a rotary valve technique to design a downhole drilling tool for real-time transmission data. Brkic et al.5designed and constructed ultrasonic vibratory and rotary valve particle feeders to study the effects of particle residence time and axial and radial dispersion on the operating pressure. Tu et al.1designed a high-speed rotary pulse width-modulation hydraulic valve and quantitatively analyzed the valve efficiency.Peng et al.6studied particle size distribution characteristics using rotary disk centrifugal granulation.For a GM-type pulse tube cryocooler system,the rotary valve is used as a flow control device to generate a pressure wave with the help of a helium compressor.7,8Zhu et al.2,9proposed a new type of double-servo Direct Drive Rotary Valve (DDRV), with characteristics of high reversal frequency and adequate flow. Ren et al.10,11adopted an improved 2D rotary valve to design a horizontal-type electro-hydraulic excitation system with highfrequency performance and investigated its output characteristics in detail.
In addition to the above research fields,the rotary valve has been applied to the study of combustion instability and active combustion control in Pulse Detonation Rocket Engines(PDREs) or Solid Rocket Motors (SRM), because it can generate periodic pressure oscillations.Wang et al.12used a rotary valve assembly for a PDRE to control the periodic supply of the oxidizer and fuel, and investigated the effects of atomization and vaporization of the liquid fuel on the pressure oscillations and velocity deficits inside the PDRE. Barooah et al.13applied a spinning valve actuator in a single-nozzle combustor to control fuel modulation and proved the effectiveness of active instability control using the spinning valve. Brown et al.14,15adopted a rotary valve assembly for SRMs to study the combustion response of a solid propellant to small amplitude pressure and velocity oscillations. They estimated the combustion stability of the SRMs.Kuentzmann and Nadaud16used a modulation nozzle similar to the rotary valve to obtain the pressure-coupled and velocity-coupled response functions of a solid propellant at different working pressures and frequencies. Kathiravan et al.17investigated the effect of lowfrequency acoustic pressure oscillation on the mean burning rate of solid propellant combustion under quasi-steady and unsteady conditions using a window bomb device coupled with a rotary valve assembly, and a follow-up research18put forward a set of equations to calculate pressure oscillation inside a closed volume considering temperature heterogeneity due to combustion. Hafenrichter et al.19investigated the effects of propellant composition, mean pressure, and plateau region on the pressure-coupled response function of solid propellants at frequencies ranging from 20 to 200 Hz. Clearly, the rotary valve is an important tool for studying or actively controlling combustion stability of various power and propulsion systems,including those intended for spacecrafts.
Because of the rotating characteristics of a rotary valve,performing a numerical research has the following drawbacks:handling of motion components, domain division computation,high computational resource consumption,and considerable computing time. Existing studies mainly focused on the above-mentioned experiments, applications, and theoretical models.1,7,10,20Few have carried out a numerical simulation on the 3D internal transient flow field of a rotary valve. Studies20-22showed that the use of rotary valves to generate pressure oscillations for combustion instability research has a limitation in that the amplitude of the pressure decreases with increasing operating frequency, hindering the application of rotary valves to high-frequency fields. To shed more light on this limitation, a cold gas experimental apparatus based on a rotary valve is designed in this study. The apparatus can be used for conducting pressure oscillation tests at different operating frequencies. Moreover, a 3D transient Computational Fluid Dynamics(CFD)numerical model is proposed to obtain the transient flow field inside the rotary valve using a swing model,whereby the rotational motion is replaced with a swing motion based on the dynamic mesh technique23,24and the UDFs.25
2. Experimental method and theoretical model
2.1. Experimental setup
A cold gas flow experimental apparatus is shown in Fig. 1(a).The main components are the high-pressure N2gas vessel,combustor,rotary valve,and Data Acquisition(DAQ)system.Two N2gas vessels are used to supply the gas. The highpressure gas is reduced to the required pressure using a regulation valve and is then passed through the combustor and rotary valve successively through the gas pipeline. Between the pressure regulation valve and the combustor lies a pressure gauge and a solenoid valve,which are used to measure the supply pressure and control the supply of gas flow, respectively.The diameter and volume of the combustor are 72 mm and 320 cm3, respectively, with the other dimensions shown roughly to scale. In the experiment, the rotary valve is first started,and the predetermined speed is attained.Subsequently,the solenoid valve switch is turned on to supply gas to the combustor, and the pressure in the combustor is collected by the DAQ system.
The rotary valve can operate at a maximum rotating speed of 2000 rpm(revolutions per minute,r/min),as shown in Fig.1(b). The rotary valve is used as a periodic exhaust device connected to the combustor to excite pressure oscillation in the combustor under different selected working pressures and frequencies.It mainly consists of a stator,a rotor,a rotor shaft,a housing, and two bearings, which are used to support the rotating rotor shaft.The rotor and stator are made of graphite,and the other components are made of steel. The rotor is attached to the rotor shaft, the outer diameter, and length of which are 76 and 104 mm, respectively. The rotor has 16 REDs,each with a diameter of 3 mm placed along the circumference. The REDs are aligned with the center of the Stator Exhaust Duct (SED) on the stator. To eliminate the effect of harmonic components,14the cross-sectional shape of the SED is designed to be rectangular with length and width of 4.5 and 3 mm, respectively. Once the RED of the rotating rotor matches with the SED,the gases from the combustor will discharge through the duct formed by the RED and SED,thereby generating a periodic pressure oscillation inside the combustor. The frequency of the pressure oscillations is controlled by the rotating speed of the rotor shaft.The rotor shaft and servo motor are connected using a coupler, and the servo motor is controlled by a servo actuator.Thus,small amplitude pressure oscillations are generated in the combustor at a selected working pressure or frequency by controlling the supply gas pressure and rotating speed of the rotary valve.
The pressure of the gas supplied is measured using a pressure gauge (piezo-resistive, 0-10 MPa), and the oscillating pressure inside the combustor is measured through a Kistler pressure transducer (piezoelectric-Model, No. 601AA), which is mounted on the combustor. The piezoelectric sensor is used in conjunction with a Kistler charge amplifier (Type 5018A1000) to measure pressures up to a maximum of 25 MPa and to choose the appropriate range depending on the requirements. The maximum output pressure selected in this experiment is 4 MPa. The measurement mode of the amplifier can be adjusted for a simultaneous measurement of the mean pressure and oscillation pressure using one sensor.The outputs of the sensor and position data of the rotary valve are fed to the DAQ system (DH, No. 3816N, 16 channels) via lines 1 and 2(Fig.1(a)),respectively.The DAQ system has data analysis and acquisition functions,and its maximum sampling rate is 200 kHz.In the experiments,the sampling rate of the data is 20 kHz.
2.2. Rotating model of the rotary valve
During the rotation of the rotary valve (Fig. 2), a periodic open-closed exhaust duct is formed by the RED and SED.The minimum cross-section of the exhaust duct is in the Effective Exhaust Region (EER, Fig. 3). When the EER area is greater than zero, the exhaust duct is open, and the gases can be discharged from the combustor; otherwise, it is closed.The motion schematic of the rotary valve is shown in Fig.2.In the figure, A0to A5correspond to the length of the arc A0A5,which is the stroke length of a complete exhaust cycle.
Based on the characteristics of the intermittent exhaust,one exhaust cycle can be divided into non-exhaust stage and exhaust stage. In the former case, the RED turns from A0to A1, and in the latter case, it turns from A1to A5. Only in the exhaust stage can the gases from the combustor enter the rotary valve and then be exhausted. The linear velocity of the rotor is given by

where ω=2πr is the angular velocity, r is the rotating speed,and Dris the outer diameter of the rotor.
Based on Eq. (1), the position of the RED at different instances can be obtained. Since sixteen REDs are evenly distributed along the circumference of the rotor,the length of the arc A0A5is equal to 14.91 mm. Based on the geometric relationship shown in Fig. 2 the center angle θA15is 4sin-1(2R0/Dr). The length of the arc A1A5is 6.0016 mm(DrθA15/2), which is the same as 4R0(6 mm). Therefore, when solving the EER area, the arc A1A5can be approximated as a straight line with a length of 6 mm, as shown in Fig. 3. Here,Lnex(8.91 mm)and tA0respectively represent the stroke length and start time of the non-exhaust stage, and the symbols A0-A5in all the figures have the same meaning.
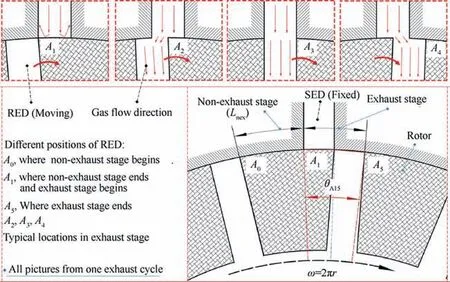
Fig. 2 Motion schematic of rotary valve.
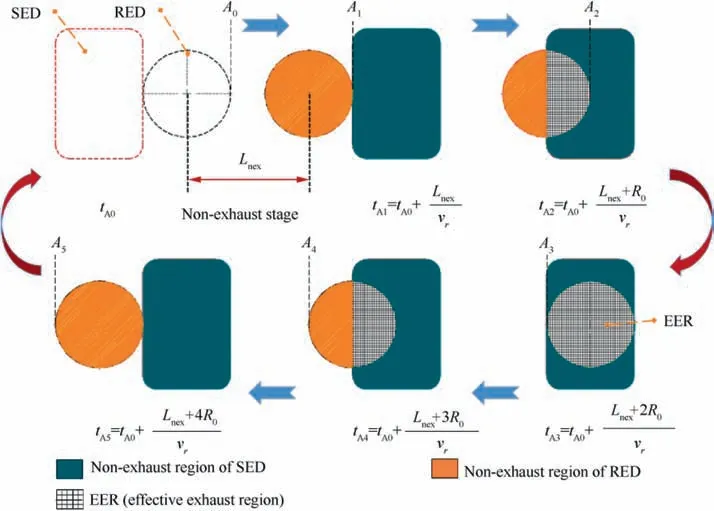
Fig. 3 Schematic of change in effective exhaust region with time.
To quantitatively describe the impact of the stroke length of the non-exhaust and exhaust stages on the pressure oscillation of the combustor, the stroke length ratio is defined as follows

where R0is the radius of the RED.
The period of a complete exhaust cycle is given by

As shown in Figs. 2 and 3, the EER area changes periodically with the rotation of the rotor. During an exhaust cycle,the EER area in the non-exhaust stage (A0to A1) is zero. On the contrary, the EER area in the exhaust stage changes symmetrically with respect to the position of A3(Fig. 3), which gradually increases from zero(A1)to 1/2 maximum(A2),maximum(A3),and then gradually decreases to 1/2 maximum(A4)and then zero (A5). Soon after, the next RED repeats the above-mentioned process (A0to A5), resulting in a periodic exhaust.
The EER area Seerdetermines the extraction flow and affects the pressure oscillations in the combustor. For one exhaust cycle, the solution of the EER area Seeris shown in Fig. 4, where Δx = vr(t-tA1) is the arc distance through which the RED rotates during the exhaust stage, and tA1and tA5(same as in Fig. 3) represent the start and end times of the exhaust stage, respectively.
As shown in Fig. 4, the EER area Seercan be solved in stages: when 0 <Δx <2R0, Seergradually increases.

where θ1is the central angle of the arc CD and is defined as
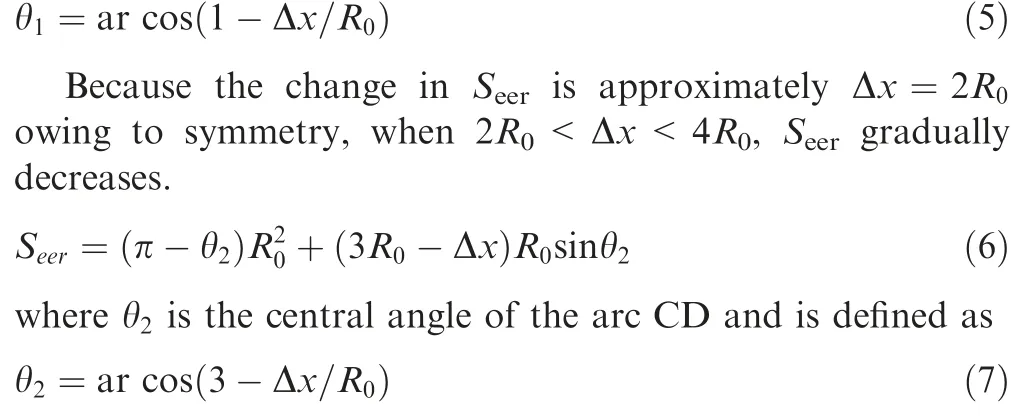
According to Eqs.(1)-(7)and the characteristics of the periodic exhaust of the rotary valve, the change equation for Seerwith time can be obtained.
3. Physical model and CFD numerical method
3.1. Physical model
In a complete exhaust cycle, only one of the 16 REDs on the rotor will be in operation, and the rest are non-exhausted.To save computing resources and reduce costs, a left-right swing motion of the RED in the CFD model is used to replace the unidirectional rotation motions of the 16 REDs. Fig. 5 shows the swing model. Here, I and III respectively represent the left and right limit positions of the RED in the swing process, and II is the position where the centers of the SED and RED are aligned.
In the swing model, the arc distance of the center line between the left-right limit position and the SED is vrT/2.The RED swings periodically from I to III and then from III to I to achieve periodic exhaust and to simulate the exhaust due to multiple RED rotations.
3.2. Mesh generation and boundary conditions
The first step in the CFD simulation is to build a 3D fluid model. Based on the structure of the rotary valve, the fluid


where n is the number of exhaust cycles and t is working time.
Considering that the experimental work inability to obtain the instantaneous flow details and flow field structural characteristics inside the rotary valve,a 3D CFD numerical model is established to provide a better understanding of the flow fields.This model is convenient for further research on the effects of different factors, including rotating speed (frequency), stroke length ratio and radius of the RED,on the pressure oscillation characteristics of the rotary valves. Moreover, it avoids the need to construct relevant prototypes during the initial stage of design and study process.domain can be divided into three parts: combustor (including SED), environment, and RED. A geometric model with three domains is constructed in the Solidworks software and is imported to ANSYS-ICEM for meshing generation.The mesh topology of the 3D fluid domain is shown in Fig. 6.
In the analysis of the CFD simulation, the mesh quality is the critical factor to obtain an accurate result.23,26However,for a higher accuracy, more high-quality meshes are required,which lead to more computing resources. Regarding the combustor domain, the unstructured tetrahedral mesh generation method is adopted to overcome the complexity of the structure. Compared with the internal diameter of the combustor,the sizes of the pressure inlet and SED are smaller. To ensure the simulation precision and reduce the number of meshes, a refinement on the local meshes is performed near the above two regions using the size function,23,27as shown in Fig. 6(a).
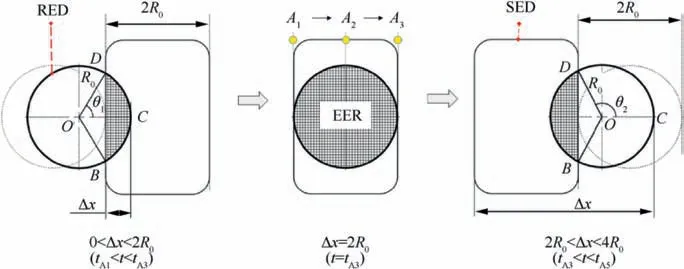
Fig. 4 Schematic of solution to EER area in exhaust stage.
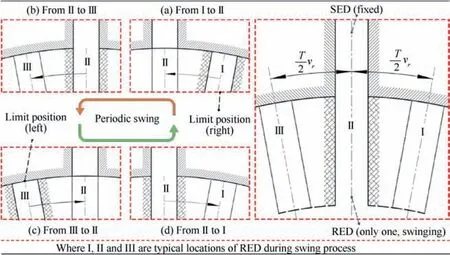
Fig. 5 Schematic of swing model of RED.
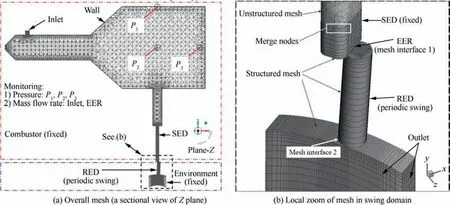
Fig. 6 Topology of 3D mesh.
Because of the swing of the RED,the EER area constantly changes, resulting in a high velocity and pressure gradients near the EER. To consider the disorder in the unstructured meshes and to facilitate the post-processing of the flow field,the mesh at the bottom of the SED in contact with the RED is generated using the structured hexahedral mesh generation method. The nodes between the structured and unstructured meshes are merged using the node merging function to ensure continuous data transmission, as shown in Fig. 6(b).
For the mesh of the RED swing domain, the structured mesh method is used with a mesh number of approximately 20000. The maximum edge length of the cell cube is set as 0.3 mm, and the width of the first layer of the wall surface boundary layer is 0.1 mm. During the exhaust stage, the upper surface interface zone 1 of the RED and the lower surface interface zone 2 of the SED partially overlap to form Mesh interface 1 (also known as the EER), as shown in Figs. 6(b) and 7(a). The 3D mesh motion of the RED from III to II is shown in Fig. 8, where A1, A2, and A3are defined as in Fig. 2.
The instantaneous flow parameters inside the environment domain vary only when the RED is in the exhaust stage.Therefore, the mesh size is related to the position of the RED: the mesh gradually varies from being sparse in the non-exhaust stage to being dense in the exhaust stage(Fig. 8). The minimum edge length of the mesh cell is 0.1 mm, which is the same as that for the RED, and the mesh number is approximately 30000. Moreover, the upper surface of the environment domain and the lower surface of the RED form a pair of mesh interface 2;the principle is the same as that for mesh interface 1 (Fig. 7).
The boundary condition surfaces of the computational domain are indicated in Fig. 6:
(a) INLET: Consistent with the position of the gas inlet in the experiment, and the value is equal to the pressure gauge data. Moreover, the velocity vector is normal to the boundary.
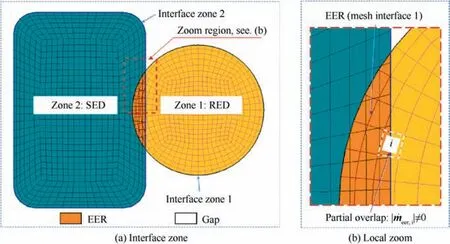
Fig. 7 CFD method: Schematic of Effective exhaust region.
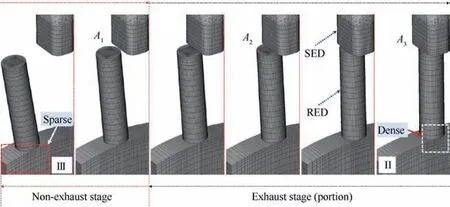
Fig. 8 Mesh position of the RED in swing process (from III to II).
(b) OUTLET:On these surfaces,the initial pressure value is set as 0.1 MPa, and the other flow parameters are obtained by internal iteration.
(c) Mesh interface: This includes mesh interface 1 (EER)and mesh interface 2. In the CFD simulation, the combination of dynamic mesh technique and UDFs is used to achieve RED periodic swing. Taking mesh interface 1 as an example, it is obtained by partially overlapping the two surfaces of interface zones 1 and 2 (see Fig. 7).When the RED is in the exhaust stage,the EER is automatically recognized as the interior region,and the highpressure gases from the combustor can flow from the SED to the RED. However, the non-overlapping parts of the interface zones 1 and 2 are automatically recognized as non-slip walls.23,28Similarly, the definition of Mesh interface 2 is the same as that of Mesh interface 1.
(d) Wall: Except for the above boundary conditions, the other surfaces are set as non-slip walls.
3.3. CFD numerical method
The flow medium is nitrogen, and the density is that of ideal gas. The other physical properties take default values. In particular, during the RED swing process, the high-pressure gas flow inside the RED has two co-existing components, namely‘‘free shear flow” and ‘‘wall bounded flow”,24which are strongly influenced by the EER area and the wall effects.Because of the high velocity and large pressure gradients in the metering edges, a turbulent flow pattern is adopted in the CFD simulation.
The CFD simulation is based on the ANSYS Fluent system,23which provides a variety of turbulence models, including the k - ε (standard, RNG, and realizable), k - Ω and Reynolds models. According to previous related studies,23,24,28,29the RNG k - ε model coupled with a two-layer zonal model30,31is the most suitable turbulence model and has been used to carry out CFD simulations. Owing to its robustness,reasonable accuracy, and low calculation cost,23,31the SIMPLE algorithm is chosen with the pressure based solver to deal with velocity-pressure coupling.The ideal compressible gas model is also applied with the activated energy.In terms of the diffusion term,the first-order difference is used.Regarding the convection,turbulence,and turbulence dissipation rate,the first-order upwind is adopted.The convergence criteria are set as follows,except that the absolute value of residual of energy is equal to 10-6and the rest are 10-4. For transient flow, the time step size is related to the rotating speed, which is set in the range of 10-5s to 2×10⁻⁶s.
During the process of RED periodic swing, the internal flow parameters are solved by

where,ρ is the N2density,u is the flow velocity vector,ugis the mesh velocity of the sliding mesh,Γ is the diffusion coefficient,Sφis the source term of φ,V is the mesh volume,A is the mesh area.
In the mesh overlapping region of the EER, the variable values of the mesh nodes are transmitted from interface zone 2 to interface zone 1. For one mesh node belonging to the EER,the variable values are obtained by interpolating its four adjacent mesh nodes that belong to the interface zone 2. The interpolation relationship is shown in Fig. 7, where the variable values at mesh point C1is obtained by interpolating from the values at mesh points A-D, which are in the opponent mesh. The dependent variable at mesh point C1is defined asU(C1), and the distances from the mesh point C1to its four adjacent points A, B, C, and D are S1, S2, S3, and S4, respectively.The variable U(C1)can be interpolated by the following equations.32

where σ is infinitely small quantity and is set to 10-8.
The logic diagram of the UDFs for RED periodic swing is shown in Fig.9.To verify the validity of the swing model,the EER area and mass flow rate through the EER are also obtained simultaneously,and the verification process is carried given in the next section.After initializing,the DEFFINE_ZONE_MOTION function25is applied to implement the RED periodic swing (as shown in Fig. 5). A face loop for all mesh cells in the interface zone 1 is then executed to obtain the exhaust mass flow rate ˙meer,iwithin each mesh cell using the F_FLUX function. If the absolute value of the exhaust mass flow rate | ˙meer,i| is not zero (as shown in Fig. 7), this mesh cell is located in the EER. Its area can be obtained using the F_AREA function.After the two procedures,the total exhaust mass flow rate ˙meerand total area Seerin the EER at the current time step can be obtained by summing and can be stored in a self-defined space. The computation continues until the presupposed maximum time step.
In the simulation, some non-ideal factors are ignored, such as the deviation in the rotating speed of the rotor,leakages and roughness of walls, and radial clearance between the interface zone 1 (RED) and interface zone 2 (SED). Some monitoring points or surfaces are set to obtain the flow data inside the computational domain, as shown in Fig. 6, where P1(same as the experimental measurement point), P2, and P3are the pressure monitoring points, and surfaces of the inlet and EER are used to monitor the mass flow rate.
4. Model validation
To verify the accuracy of the swing model and CFD method,several CFD simulation calculations at different rotating speeds are carried out, as listed in Table 1. The EER area obtained in the case of SR-1 is compared with that obtained using the rotation model to verify the validity of the swing model. In addition, the verification experiments of the corresponding parameters of SR-1, SR-3, and SR-5 are carried out based on the cold flow experimental device to verify the effectiveness of the CFD method. The CFD simulations and experimental parameters are as follows: the fluid medium is nitrogen, the supply pressure Pinis 2.15 MPa, and the stroke length ratio ΩLis 1.485.
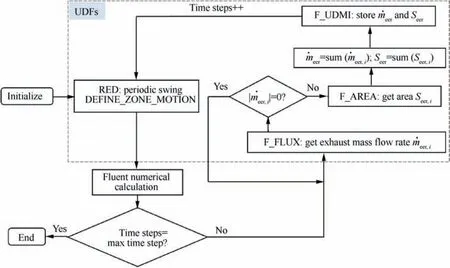
Fig. 9 Logic diagram of UDFs for the periodic swing of RED.

Table 1 Main CFD parameters under different rotating speeds.
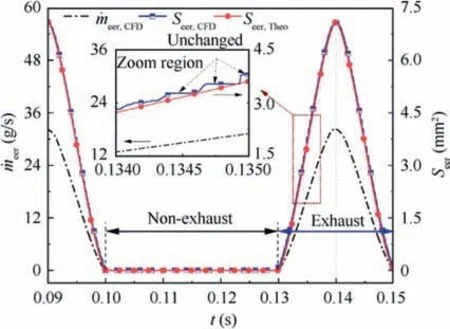
Fig.10 Variations in exhaust mass flow rate and EER area with time.
To verify the validity of the swing model, the EER area in SR-1 is calculated theoretically (Eq. (8)) and using the CFD method.The exhaust mass flow rate through the EER is simultaneously obtained in the CFD method. The variations in the exhaust mass flow rate and EER area with time are shown in Fig.10.The EER area has a significant impact on the exhaust mass flow rate28,29: the EER area and exhaust mass flow rate are zero in the non-exhaust stage and increase synchronously from zero to maximum and then decrease to zero in the exhaust stage. Regarding the EER area, the results obtained by the CFD method and theory are consistent, with an error less than 1%. The reason for the error is as follows: if a mesh cell is partially ventilated (Fig. 7, | ˙meer,i|≥0), the complete area of the cell can be obtained, resulting in a CFD value greater than or equal to the theoretical value, such as the unchanged valve in the zoom region in Fig. 10. Therefore, a single RED swing model can be used to simulate multiple RED rotational motions.
Several cold gas flow experiments and CFD simulations corresponding to the parameters of SR-1, SR-3, and SR-5 are carried out for validating the CFD method. The pressure oscillations in the combustor are obtained with time,as shown in Fig.11.The pressure obtained in the experiments and CFD simulations are in good agreement with the waveforms shown in Fig. 11(a). The pressure increases from the minimum value to the supply pressure and then maintains therein, subsequently decreasing to the minimum value, periodically. In the CFD simulations, the pressure values at the monitoring points P1to P3are consistent, i.e., the internal pressure of the combustor is in the state of overall oscillation. Therefore,the data of monitoring point P1can be adopted to study the pressure oscillations in the future. In addition, the experimental gas supply is manually controlled through the regulation valve. As a result, the gas supply pressure in the experiment is approximately 0.01 MPa higher than that in the CFD simulation. The data in Fig. 11(a)-(c) are processed to obtain the pressure oscillation characteristic parameters, as listed in Table 2 and Fig.11(d).The pressure amplitude ratioεis defined by
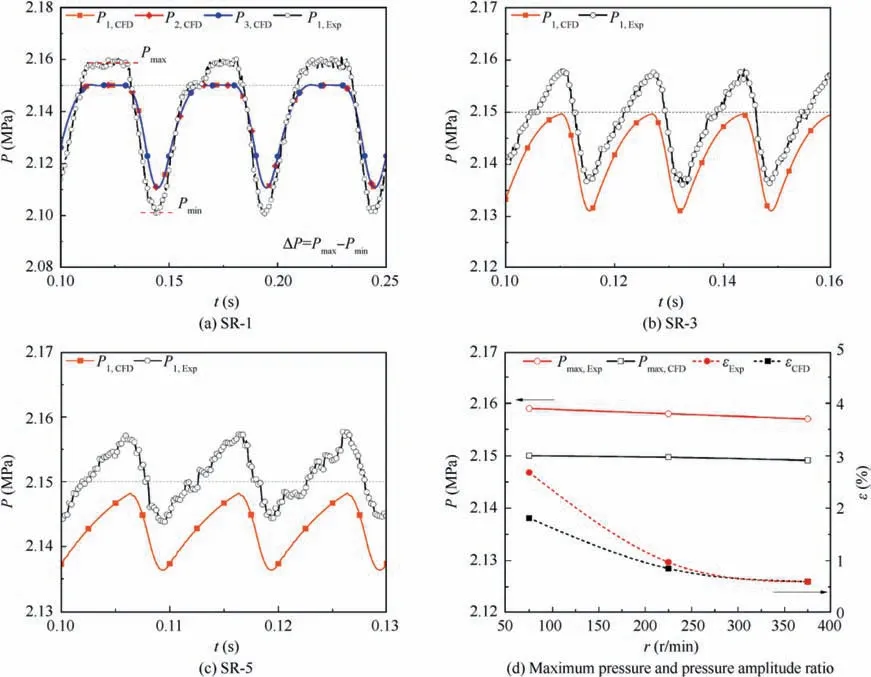
Fig. 11 Validation results: Comparison of experiments and CFD simulations.

Table 2 Characteristic parameters of pressure oscillation.

where Pmaxis the maximum pressure, Pminis the minimum pressure, and ΔP is the peak-to-peak value.
As shown in Table 2 and Fig. 11, for the case of SR-1, the maximum pressure in the combustor obtained by the two methods can reach the supply pressure, and the period T of the experiment is longer than that of the CFD method by 0.15 ms, and the error is less than 1%. Regarding SR-3 and SR-5, the maximum pressure Pmaxof both experiment and CFD method cannot reach the supply pressure, the period T of the experiments is longer than that of the CFD method by 0.12 and 0.09 ms, respectively, and the error is less than 1%. In terms of the pressure amplitude ratios, the experimental values of SR-1 and SR-3 are 0.87 and 0.012% more than that obtained by the corresponding CFD method,respectively,while the SR-5 values are the same (0.6%). Hence, the swing model and CFD method are effective and can be used to further study pressure oscillations under different working conditions.
5. CFD analysis and results
5.1. Flow process of rotary valve
Before carrying out the pressure oscillation analysis, it is necessary to understand the transient flow process of the rotary valve.In this section,the case of SR-5 is provided as an example,and the pressure,mass flow rate,Mach number,and pressure distributions at the typical time inside the rotary valve are obtained.
The variations in the mass flow rate and pressure with time in any two exhaust cycles are shown in Fig. 12. Here, ˙minand ˙meerare the supply and exhaust mass flow rates of inlet and EER, respectively, Δ ˙m=( ˙min- ˙meer), where the negative values indicate a decrease in the total gas mass inside the combustor; t=40 ms is the start time of the non-exhaust stage.Because the stroke length ratio ΩLis 1.485, the total time of the non-exhaust stage (5.97 ms) is longer than of the exhaust stage (4.03 ms), causing the pressure to change according to the ‘‘non-sinusoidal” law. The oscillation pressure gradually rises after t=40 ms and reaches a maximum value of 2.148 MPa at t=46.3 ms, gradually decreases to a minimum value of 2.136 MPa at t=49.34 ms, and finally gradually increases again, following a periodic change in accordance with the aforementioned rules. According to the gas state equation, the pressure change inside the combustor is related to the total gas mass controlled by the net mass flow rate Δ ˙m. Therefore, during the RED swing process, the net mass flow rate of the gas directly affects the pressure change.
Because of the continuous swing of the RED, the transient flow field near the EER changes dramatically. The flow Mach number and pressure distribution profiles at typical instances shown in Fig. 12 are further obtained as shown in Fig. 13.At t=46.3 ms, the RED enters the non-exhaust stage, the EER area Seer>0, and the high-pressure gas flow forms a supersonic flow inside the RED with a maximum Mach number of approximately 3.2. With the increase in the EER area,the pressure in the SED gradually decreases. At t=46.97 ms,a vortex is formed inside the RED,and the maximum Mach number drops to 2.6. At t=47.98 ms, both the EER area Seerand net exhaust mass flow rate reach the maximum, the internal pressure of the SED continues to decrease,and the maximum Mach number inside the RED drops to 1.2.The flow Mach number of the RED centerline position at the above three typical moments is obtained, as shown in Fig. 13(d), where YLis the dimensionless length of the RED centerline, and YL=1 is defined as the entrance to RED (Fig. 13(c)). The results indicate that the intensity of the change in the flow Mach number inside the RED gradually decreases with the increase in the EER area, and it tends to be instantaneously stable at the maximum value of the EER area. Therefore, the EER area (or the RED position) has an important influence on the spatial distribution of the internal pressure and Mach number of the rotary valve.
5.2. Rotating speed
Saarloos and Brewster21briefly summarized studies on relevant modulated exhaust at the nozzle exit. They showed that the amplitude of the pressure oscillation gradually decreases with increasing exhaust frequency. The same conclusion can be made from Table 2 and Fig. 11(d). Unfortunately, the reasons for the above disadvantages were not given.Since the frequency is determined by the rotating speed of the rotor, to study the effect of frequency on pressure oscillations,the cases of SR-1-SR-5 (Table 1) are used to carry out CFD research.The results are presented in this section.
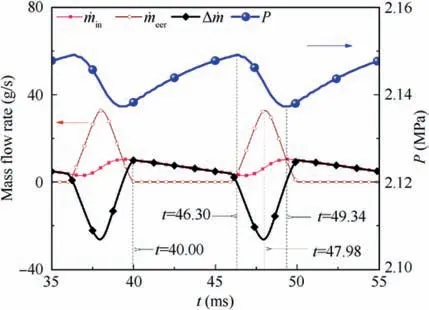
Fig.12 Variations in mass flow rate and pressure with time(SR-5).
Due to the wide range of rotating speeds, to facilitate the study of the relationship between the pressure oscillations and the rotating speeds, a dimensionless time is defined

For the cases of SR-1-SR-5, when the value of stroke length ratio is the same, the corresponding RED position and EER area are also the same.The variations in the pressure with the dimensionless time (Fig. 14(a), SR-1-SR-5) or working time (Fig. 14(b), SR-2 and SR-4) under different rotating speeds obtained by CFD simulations are shown in Fig. 14.When tΩis 1.798, the EER area and exhaust mass flow rate are maximum, and Line-Pminis the line connecting the minimum pressure under different cases, as shown in Fig. 14(a).The maximum pressure corresponding to SR-1 and SR-2 can reach the supply pressure of 2.15 MPa and can be maintained therein. However, in the other cases, this cannot be achieved:the maximum pressure gradually decreases from 2.1497 MPa(SR-3) to 2.1491 MPa (SR-5). Moreover, the minimum pressure gradually increases with the increase in the rotating speed,and the corresponding peak-to-peak value gradually decreases from 0.039 MPa (SR-1) to 0.013 MPa (SR-5). There is a pressure delay time in the pressure oscillation inside the combustor relative to the exhaust mass flow rate (or the EER area), and the pressure delay time tdis defined as the difference between the moment of minimum pressure and the maximum exhaust mass flow rate of the EER, Furthermore, the proportion of pressure delay time εtis given by

The CFD calculation results show that the pressure delay time and the proportion of pressure delay time are related to the rotating speed.The pressure delay time gradually decreases with increasing rotating speed,from 4.76 ms(SR-1)to 1.38 ms(SR-5), while the proportion of pressure delay time gradually increases, from 9.52% (SR-1) to 13.80% (SR-5), as listed in Table 3.
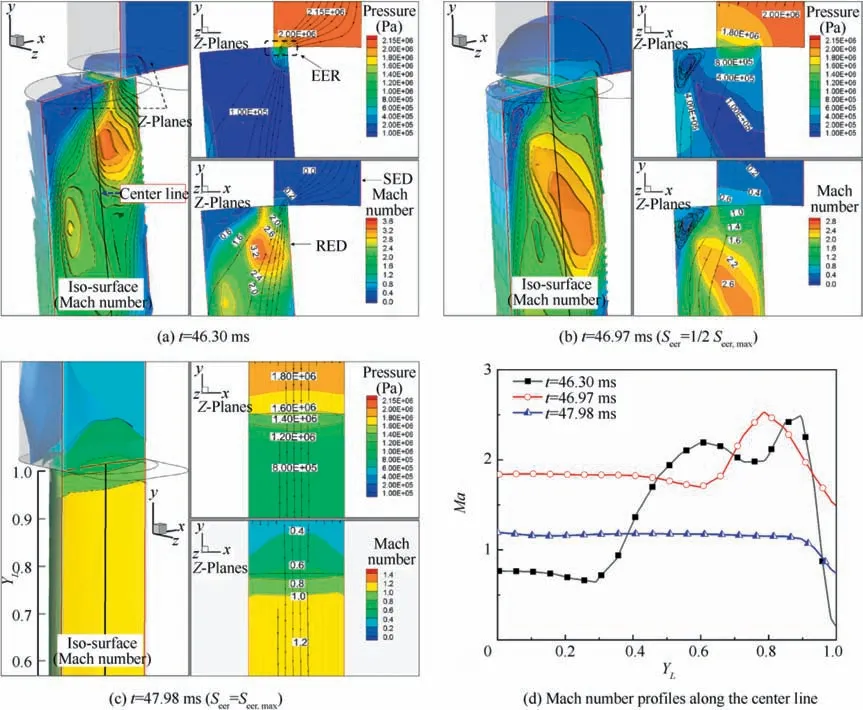
Fig. 13 Flow field inside RED and SED at different time (SR-5).
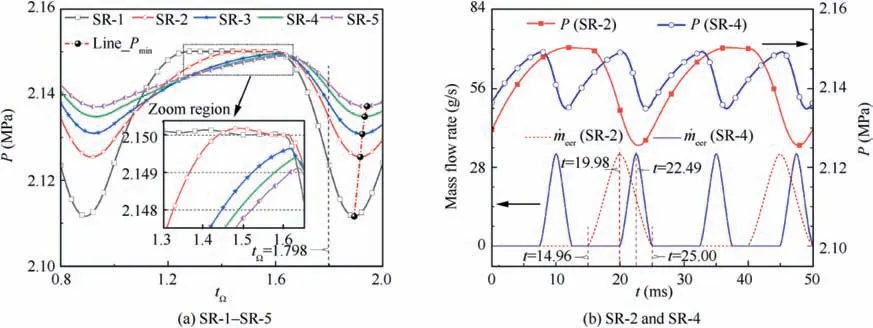
Fig. 14 Variations in pressure with time under different rotating speeds.

Table 3 Characteristic parameters of pressure under different rotating speeds.
Fig. 14(b) shows that the pressure oscillation frequency determined by the rotating speed of SR-4 is twice that of SR-2. At t=14.96 ms, SR-2 enters the exhaust stage for the first time,and then at t=19.98 ms,the exhaust mass flow rate reaches a maximum of 32.72 g/s. At the same time, SR-4 is ready to enter the exhaust stage for the second time, and then at t=22.49 ms, the exhaust mass flow rate reaches a maximum of 32.71 g/s. At the next moment, i.e., t=25 ms, the two cases exit the exhaust stage and enter the next nonexhaust stage. The above-mentioned typical moments corresponding to the pressure distribution near the EER are shown in Fig. 15.
The exhaust and supply mass flow rates corresponding to SR-1-SR-5 with the dimensionless time are obtained,as shown in Fig.16.As shown in Fig.16(a),the exhaust mass flow rate is determined by the position of the RED and not by the rotating speed. When the RED is in the same position, the exhaust mass flow rate corresponding to the different rotating speeds is consistent. Because the duration of the exhaust stage is inversely proportional to the rotating speed, the total exhaust mass is inversely proportional to the rotating speed, i.e., it gradually decreases with the increase in the rotating speed.At tΩ=1.798,the flow Mach number profiles and streamlines at different rotating speeds are shown in Fig. 17. The Mach numbers of the flow field downstream of the SED and near both sides of the EER are unaffected by the rotating speed.A chocked flow (Ma=1) is formed inside the RED, and its position gradually approaches the EER as the rotating speed increases.
Fig. 16(b) shows that the supply mass flow rate is significantly affected by the rotating speed, and its maximum value gradually decreases with the increase in the rotating speed,reducing from 18.16 g/s for SR-1 to 10.28 g/s for SR-5. At low rotating speeds,the supply mass flow rate is reduced from maximum to zero, and then a dynamic equilibrium is maintained near zero. However, with the increase in the rotating speed, the duration of the dynamic equilibrium is gradually reduced to zero, and the minimum value of the supply mass flow rate gradually increases at relatively high rotating speeds.In conjunction with Fig.12,the net mass flow rate determines the pressure oscillation inside the combustor. Therefore, when the changes in the exhaust mass flow rate are the same, the supply mass flow rate of inlet becomes a key factor affecting the pressure oscillation.
5.3. Stroke length ratio
As shown in Figs. 11 and 14(a), when the stroke length ratio ΩLis 1.485, the pressure oscillation exhibits a non-sinusoidal waveform. In related research fields where the rotary valve technique is used, such as in the downhole drilling tool,3GM cryocooler,7DDRV,9and combustion instability,14,17,33a sinusoidal waveform of the pressure oscillation is required.In this section,several cases with different stroke length ratios,listed in Table 4, are employed for CFD simulations to study the effect of stroke length ratio on the characteristics of pressure oscillations. The radius of the RED remains unchanged at 1.5 mm.
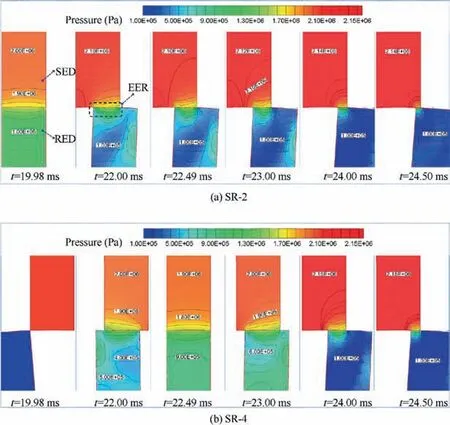
Fig. 15 Pressure distribution near EER at typical moments.
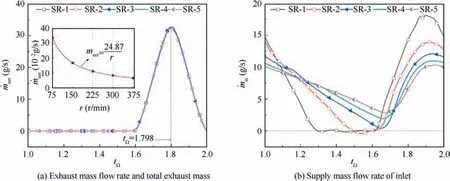
Fig. 16 CFD results: Exhaust and supply mass flow rate in one exhaust cycle.
The variations in the pressure with the dimensionless time(Fig. 18(a), SL-1-SL-4) or working time (Fig. 18(b) SL-1 and SL-4) under different stroke length ratios are shown in Fig. 18. Fig. 18(a) shows that the ‘‘sinusoidal characteristics”of the pressure fluctuations for SL-1 and SL-2 are better than those for SL-3 and SL-4.A nonlinear(sinusoidal)fitting of the pressure is carried out in the cases of SR-1 and SR-2, and the results show that the Adj.R-Square of SL-1 is 0.9992,which is greater than that(0.9963)of SL-2.Here,the closer the Adj.RSquare value is to 1,the higher the dependence between the fitting and original data.34In other words, the pressure oscillation of SL-1 has the best ‘‘sinusoidal characteristics,”followed by SL-2 and there are multiple error bands between the fitting and original curves. A further analysis shows that under the condition of large stroke length ratio, such as ΩL=1(Fig.18)and ΩL=1.48(Fig.11),the pressure oscillation waveform tends to be a square wave(low rotating speeds)or a triangular wave (high rotating speeds). Therefore, the sinusoidal characteristics of the pressure oscillation inside the combustor gradually weaken with the increase in the stroke length ratio, and when ΩL=0, the pressure oscillation exhibits a sinusoidal waveform.
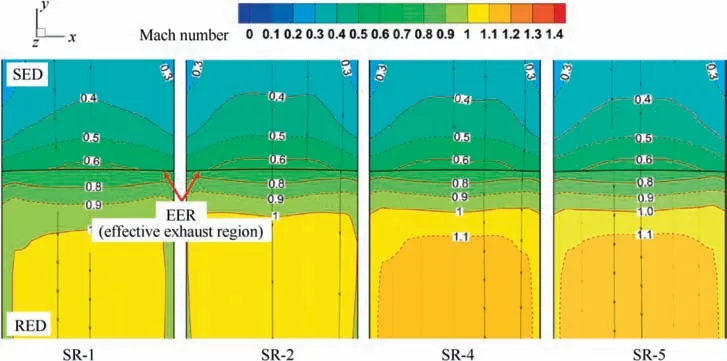
Fig. 17 Mach number profiles and streamlines of flow field at different rotating speeds.

Table 4 Main parameters values under different stroke length ratios.
The characteristic parameters of the pressure under different stroke length ratios are further obtained, as listed in Table 5. As shown in Fig. 18(a) and Table 5, the maximum pressure Pmaxand peak-to-peak values ΔP increase as the stroke length ratio increases, and the corresponding Pmaxand ΔP increases from 2.127 MPa(SL-1)to 2.150 MPa(SL-4)and 0.024 MPa (SL-1) to 0.038 MPa (SL-4), respectively.Regarding SR-1 with the best sinusoidal characteristics, the pressure delay time is 4.54 ms, in which case the proportion of pressure delay time is 22.56%, and the equivalent phase angle delay is 0.45π.In the other three cases,the pressure delay time is within 4.75±0.02 ms, in which case the stroke length ratio has a lesser effect.
Fig. 18(b) shows that the stroke length ratio has a significant impact on the waveform and characterization parameters of pressure oscillation.Because the stroke length ratio of SL-4 is 1,the total stroke length of one exhaust cycle is twice that of SR-1.As a result,the pressure oscillation frequency of SR-4 is also twice that of SR-1. When the time is between 0 and 20.12 ms, SR-1 finishes the first exhaust cycle, while SR-4 is still in the non-exhaust stage. At t=20.12 ms, the two enter the exhaust stage and reach the maximum exhaust mass flow rate at t=30.18 ms, and then exit the exhaust stage at t=40.24 ms. In the exhaust stage, the change trend of the exhaust mass flow rate in the two cases are consistent and unaffected by the stroke length ratio. In a complete exhaust cycle, the total exhausted gas mass from the combustor is the same in the different stroke length ratio cases. However,the gas supply time is prolonged with the increase in the stroke length ratio,leading to an increase in the total gas mass and an increase in the maximum pressure in the combustor.
5.4. Radius of the RED
As shown in Figs. 11 and 14(a), the maximum pressure, peakto-peak value inside the combustor gradually decrease with increasing rotating speed. However, a high quality oscillatory environment is very important for the further experimental studies on combustion response of both solid and liquid propellants. In this section, several CFD simulation calculations at different radius of the RED are carried out to study the effect of radius of the RED on pressure oscillation,as listed in Table 6. The stroke length ratio and rotating speed remain unchanged at 0 and 375 r/min, respectively.
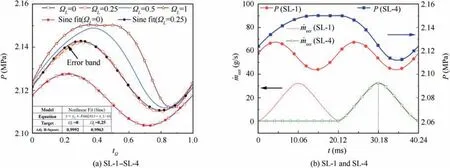
Fig. 18 Variations in pressure with time under different stroke length ratios.

Table 5 Characteristic parameters of pressure under different stroke length ratios.

Table 6 Main parameters values under different radius of RED.
The variations in the pressure and exhaust mass flow rate with dimensionless time are shown in Fig.19.Fig.19(a)shows that the pressure oscillation exhibits a sinusoidal waveform.The characteristic parameters of the pressure oscillation are further obtained, as listed in Table 7. For SD-1, the rotating speed is quintuple that of SL-1.As a result,the maximum pressure, peak-to-peak value, and pressure delay time inside the combustor are all less than SL-1. In terms of the effect of radius, the maximum pressure gradually decreases with the increase in radius of the RED, reducing from 2.115 MPa for SD-1 to 1.719 MPa for SD-3. On the contrary, the peak-topeak value ΔP and pressure amplitude ratio ε gradually increases as the radius increases, the corresponding ΔP and ε increase from 0.005 MPa for SD-1 to 0.031 MPa for SD-3 and 0.24% for SD-1 to 1.8% for SD-3, respectively. Besides,the proportion of pressure delay time for above three cases is about 25%, in which case the radius of the RED has a lesser effect.
Fig. 19(b) shows that the exhaust mass flow rate is significantly affected by the radius of the RED, and its maximum value gradually increases with the increase in the radius,rising from 30.52 g/s for SD-1 to 104.72 g/s for SD-3.As a result,the corresponding total exhaust mass of one exhaust cycle are 0.067 g (SD-1), 0.146 g (SD-2) and 0.425 g (SD-3), in which case the high quality oscillatory inside the combustor is induced, as shown in Fig. 19(a). Therefore, a high-frequency and high-amplitude pressure oscillation inside the combustor can be obtained by appropriately increasing the RED radius.
6. Conclusions
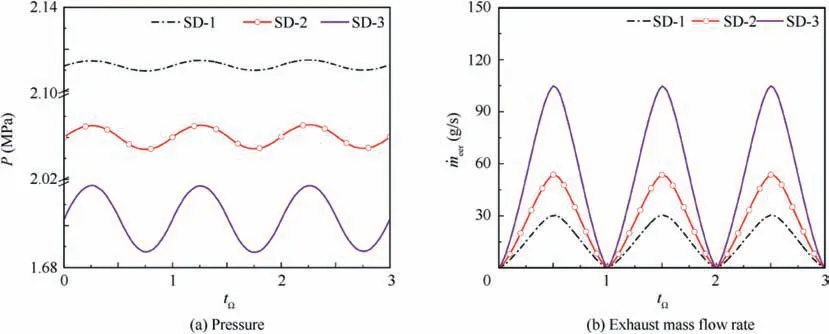
Fig. 19 Variations in pressure and exhaust mass flow with time under different radius of RED.

Table 7 Characteristic parameters of pressure under different radius of RED.
In this study, we established a rotary valve experimental platform and a 3D CFD numerical model. The CFD model was validated through experiments and theoretical modeling. Several CFD simulations were carried out to study the effects of rotating speed, stroke length ratio and radius of the RED on pressure oscillations. The characteristic parameters associated with the pressure oscillation,including the maximum pressure,peak-to-peak value, pressure delay time, and flow Mach number,and pressure profiles contours were analyzed under different working parameters by numerical methods. This work provides design guidelines for rotary valves and can benefit further numerical and experimental research on similar rotary valves. The following are the main results of this study:
(1) The rotating speed does not affect the flow Mach number distribution and the exhaust mass flow rate of the effective exhaust region. However, the total exhaust mass is inversely proportional to the rotating speed.The maximum pressure, peak-to-peak value, and pressure delay time inside the combustor relative to the exhaust area of the rotary valve gradually decrease with increasing rotating speed.
(2) The stroke length ratio affects the sinusoidal characteristics of the pressure oscillations because of its effect on the time ratio between the exhaust and non-exhaust stages. The sinusoidal characteristics gradually weaken as the stroke length ratio increases. However, the maximum pressure and peak-to-peak value increase gradually with the increase in the stroke length ratio, and the pressure delay time is unaffected by the stroke length ratio.
(3) The rotor exhaust duct radius affects the pressure oscillation by changing the exhaust mass flow rate of the effective exhaust region. The maximum pressure gradually decreases with the increase in rotor exhaust duct radius. On the contrary, the peak-to-peak value and pressure amplitude ratio gradually increases as the radius increases, and the rotor exhaust duct radius has a lesser effect on the proportion of pressure delay time.
Declaration of Competing Interest
The authors declare that they have no known competing financial interests or personal relationships that could have appeared to influence the work reported in this paper.
Acknowledgement
This study is supported by National Natural Science Foundation of China (No. 11572042).
 CHINESE JOURNAL OF AERONAUTICS2021年5期
- CHINESE JOURNAL OF AERONAUTICS的其它文章
- Ferrofluid moving thin films for active flow control
- Preliminary study on heat flux measurement data of TT-0 flight test
- An analysis and enhanced proposal of atmospheric boundary layer wind modelling techniques for automation of air traffic management
- Jet sweeping angle control by fluidic oscillators with master-slave designs
- Hot deformation behavior and microstructure evolution of the laser solid formed TC4 titanium alloy
- Electrochemical trepanning with an auxiliary electrode
