Experimental, analytical and numerical investigation on tensile behavior of twisted fiber yarns
Xuefeng TENG, Duoqi SHI, Xin JING, Shungqi LYU, Xiogung YANG,*
a School of Energy and Power Engineering, Beihang University, Beijing 100083, China
b School of Power and Energy, Northwestern Polytechnical University, Xi’an 710072, China
c Aviation Engineering Institute, Civil Aviation Flight University of China, Guanghan 618307, China
KEYWORDS Friction;Stitched composite;Tensile behavior;Twist;Yarn architecture
Abstract Stitched composite materials are emerging as a promising material due to their high interlaminar strength,combined performance and light weight.The mechanical properties of stitch yarns are very essential for stitched composite structures.In this study,the tensile behaviors of the twisted fiber yarn in stitched composites were investigated experimentally, analytically and numerically. Two kinds of cross-sectional area of twisted yarn are proposed and discussed. The paper presents an intersecting circle model to describe the cross-section of twisted fiber yarns,and a physics-based theoretical model to predict the effective tensile moduli.The numerical models take into account the cross-sectional characteristic and the twist architecture. The investigation shows that: the sum of each fiber area should be used for experimental analysis; and the crosssectional area surrounded by the yarn profile should be used for theoretical predictions and finite element (FE) simulations. The relative errors of the prediction method and the FE simulation are less than 2% and 1%, respectively. The friction between the fibers is derived, and the effect of friction on mechanical properties is discussed. The investigation method will serve as a fundamental component of twisted fiber bundle/yarn analysis.
1. Introduction
The use of composite materials (especially laminated composite materials) has grown significantly over the decades to meet the demand for lighter and stronger materials in many industries, such as automotive, aerospace, construction, etc. However, delamination between the layers of laminated composites remains a concern and has led to many attempts to improve the mechanical properties in the out-of-plane direction.Through-the-thickness stitching is an effective method to increase the interlaminar strength and damage tolerance of composite structures,as well as with a very low manufacturing cost.Stitched composite materials are potential to make stronger and lighter composite structures. The major advantage of stitched composites is the combined performance, which includes acoustic, thermal insulation, high flexural stiffness to weight ratio,and load-carrying capacity.Many studies have shown that the flexural stiffness and strength,out-of-plane tensile strength, damage resistance and interlaminar fracture toughness of stitched composite structures have been significantly improved,1-5the effects of stitch density,6,7stitch angle,8and stitch pattern9-11on the mechanical properties of composites are also investigated.
The mechanical properties (stiffness and strength) of stitch yarns are very essential for stitched composite structures. The stitch yarns are usually twisted (as shown in Fig. 1), because the twist compresses the yarn and improves the bundle uniformity, and the mechanical properties may be improved. The damage and failure of stitch yarns would lead to the degradation or failure of the stitched composite structure.Many scholars have conducted experimental and theoretical studies on the equivalent mechanical properties of twisted yarns. The mechanical property relationship between the twisted fiber bundle and the untwisted fiber can be characterized by the Hearle equation.13In the twisted fiber yarn,the twisting angle changes depending on the distance of the twisted fiber relative to the axis of the fiber bundle. That is, the fiber has a larger twisting angle on the outer periphery than inside the yarn.The twisting angle of the fiber relative to the twisted yarn axis reduces its contribution to the mechanical properties. Madsen et al.14proposed a model to estimate the mean twisting angle of twisted fiber yarn;the model assumes that the yarn is fabricated with aligned fibers,and its cross-section is circular.However, most stitch yarns are composed of several fiber bundles and are fabricated by twisting these fiber bundles together.Therefore,the cross sections will not be circular and the Madsen model is not suitable for these cases.
The relation between twist level and the yarn strength of twisted yarn are experimentally investigated.The experimental results show that there is a critical twist in glass fiber yarns,the strength of glass fiber yarn increases with the twist level firstly,and then decreases with the twist level15,16. Twisting can increase the lateral interaction and friction between the fibers in the yarn, compress the yarn and improve the uniformity of the bundle,17-19thereby improving the tensile strength of the yarn. Hironaka et al.20first observed migration structure of ramie twisted yarns through an X-ray CT scanner, and investigated the effect of migration on tensile properties. The fiber defects formed during the manufacturing process will weaken the tensile strength of the fiber, appropriate twisting of the fiber bundle can effectively alleviate the negative effects of the defects,and increase the tensile strength.There is no theoretical model or simulation study to explain the improvement of tensile strength, because it is caused by the squeezing and friction between the contacting single fibers, which is difficult to describe in the theoretical and simulation models. In addition,the stress/strain distribution in the twisted yarn is not uniform, but this has been rarely investigated with finite element(FE) method.
The aim of this study is to investigate the effect of twist architecture on the tensile behavior of twisted yarns, and develop a theoretical model to overcome the limitations of the Madsen model.First,the twisted yarn specimens were prepared, and tensile tests were performed to characterize the mechanical properties of twisted yarns. Then, analytical analysis was carried out to predict the tensile moduli of twisted yarns under tensile loading. And an intersecting circle model was adapted to predict the mechanical behavior of twisted yarns numerically. In the last section, we analyzed and discussed the reason for the improvement in tensile strength of twisted yarn, and derived the basic equations. The investigation method will serve as a fundamental component of twisted fiber bundle/yarn analysis.
2. Experimental investigation
2.1. Material and experimental method
The main research object in this work is the Nextel 720 mullitealumina fiber produced by Minnesota Mining and Manufacturing Company (3 M). Nextel 720 is an 85wt%-15wt%alumina-silica fiber produced by a sol-gel route with a diameter of 12.5 μm.21Four twisted fiber yarns were studied, which contain 1, 2, 3 and 4 twisted fiber bundles respectively, as shown in Fig. 2. According to the number N (N=1,2,3,4)of twisted fiber bundles, the twisted yarn is named as yarn-N in this paper.It should be noted that,the yarn-4 contains four twisted fiber bundles, but every two fiber bundles are twisted together and then twisted again to form yarn-4. The twist parameter (turns per meter) was measured with a trinocular reflection digital metallurgical microscope (TRDMM), and the cross-sectional area was obtained by dividing the linear density by the fiber density, which is listed in Table 1.
The twisted fiber yarn specimens for tensile tests were prepared according to ASTM D4018-17,using heavy paper as end tabs, and the distance between tabs was 150±5 mm. Tensile tests were performed with a static load rate of 0.1 mm/min(the strain rate is 0.0667%per minute)at ambient temperature using the INSTRON 5966 machine.The strain of the specimen was measured by an extensometer.

Fig. 1 Twisted yarns in stitched sandwich structure.12
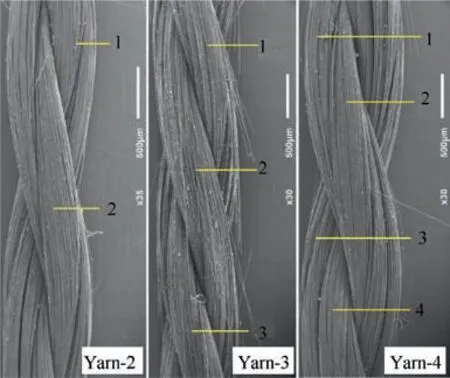
Fig. 2 SEM photographs and twisted fiber bundles of twisted yarns(yarn-2; yarn-3; yarn-4).
2.2. Tensile behavior of twisted yarns
The number of effective test specimen is 5(yarn-1),11(yarn-2),7(yarn-3) and 9(yarn-4) respectively. Fig. 3 shows the stressstrain response of each test specimen, and the discontinuity of the stress-strain curve is caused by the installation and removal of extensometer. The stress-strain response exhibits a linear behavior before the brittle rupture occurs,and the tensile moduli are calculated by the ratio of stress increment to strain increment. It can be seen that, the twist architecture makes the tensile modulus of the material slightly lower, but can significantly improve the tensile strength of the material.
Compared with the modulus of yarn-1(199 GPa),the modulus of yarn-2(193.9 GPa) is 2.56% lower, and the yarn-3(193.2 GPa) and yarn-4(187.46 GPa) are 2.91% and 5.80%lower respectively. However, the tensile strength of yarn-2(901 MPa), yarn-3(1050 MPa) and yarn-4(1031 MPa) is more than twice than that of yarn-1(450 MPa).This is because twisting can increase the lateral interaction and friction between the fibers in the yarn, compress the yarn and improve the uniformity of the bundle.22Besides, the fiber defects formed during the manufacturing process will weaken the tensile strength of the fiber, appropriate twisting of the fiber bundle can effectively alleviate the negative effects of the defects, and increase the tensile strength.At the same time, the dispersion of tensile strength is also reduced (see Table 2). Therefore, the twist of fiber yarn significantly improves the tensile strength of material, while the loss of tensile modulus is very small.
3. Analytical prediction model
3.1. Multi-level architecture of twisted yarns
As mentioned before, the twisted yarns are made by twisting and combining the fibers. The architecture of twisted yarn is multi-level, as shown in Fig. 4. The twisted yarns studied in this paper have three levels: fiber bundle, twisted fiber bundle and twisted yarn.The fiber bundle consists of Nextel 720 fibers with different cross sections. Then, three fiber bundles are twisted together to form a twisted fiber bundle.Finally,several twisted fiber bundles are twisted together to form a twisted yarn.
For yarn-2, yarn-3 and yarn-4, assume that the crosssection consists of several intersecting circles(Fig.5),and each circle representing a twisted fiber bundle. The geometry parameters were obtained based on the SEM measurement(Fig. 2), which are listed in Table 3. Three fiber bundles are twisted together to form Yarn-1. Yarn-1 has the similar cross-section (in Fig. 5) and similar parameters (in Table 3)as yarn-3,but at the fiber bundle level.The cross-sectional area of yarn-1 is assumed to be one third of the area of yarn-3.
It should be noted that,the cross-sectional areas in Table 3 are quite different form the areas in Table 1. As shown in Fig.6,the areas in Table 1 are the sum of each fiber area,since the areas in Table 1 are calculated by dividing the linear density of the yarn by the fiber density; while the areas in Table 3 are the areas surrounded by the yarn profile,which include the porosity area between the fibers. As mentioned before, the twisting angle of each fiber is closely related to the position of the fiber. Therefore, the cross-sectional areas which include the porosity should be used for theoretical prediction and FE simulations in the following sections.
Based on the cross-sections in Fig. 5, the expression of the fiber bundle is:

The expression of a circle with radius r and centered on the origin is:

The abscissa of the intersection points A and B:


Table 1 Characterization of twisted fiber yarns.
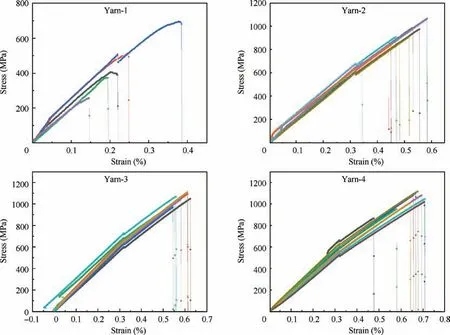
Fig. 3 Stress-strain response of twisted yarns.

Table 2 Tensile properties of twisted yarns.

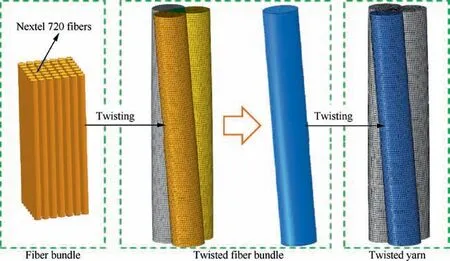
Fig. 4 Multi-level architecture of twisted yarns.
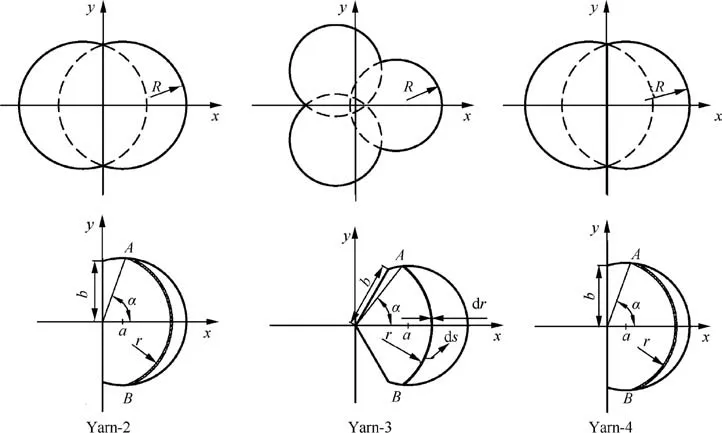
Fig. 5 Cross-sections of twisted yarns (yarn-2, yarn-3, yarn-4).

Table 3 Cross-sectional parameters of twisted yarns.
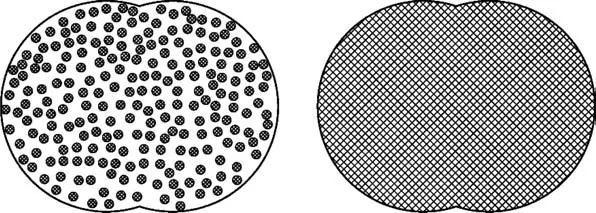
Fig. 6 Illustration of cross-sectional areas in Table 1(left) and Table 3(right).
3.2. Modulus prediction model
The effective modulus of twisted fiber can be predicted using the Hearle equation,13

here, θ is the twisting angle, Eyand Efare the modulus of twisted fiber and untwisted fiber, respectively.
The mean twisting angel model proposed by Madsen et al.14is the geometric mean in cross-section.Combining Eq.(6)with the mean twisting angel, the effective tensile modulus of the twisted fiber bundle/yarn can be calculated. However, on the one hand, the mean twisting angle is based on the assumption that the cross-section is circle, but the cross-section is not circular as shown in Fig. 2; on the other hand, as shown in Eq.(6),the relationship between Eyand θ is non-linear,so the geometric mean of the twisting angle will cause systematic errors in the prediction results.
The prediction model proposed in this paper is based on two assumptions:(1)the cross-section of twisted fiber bundle/-yarn consists of several intersecting circles;(2)the spatial fiber distribution and porosity distribution in the fiber bundle/yarn are uniform.

where L is the axial length for each turn.
Then the Eq. (6) can be written as:

According to the equilibrium equation,and considering the porosity in the fiber bundle/yarn,

here,S is the cross-sectional area in Table 3,Vfis the fiber volume fraction in the fiber bundle/yarn. It can be seen from Eq.(9) and Eq. (10) that, due to the porosity is uniformly distributed in the fiber bundle, the parameter Vfis a constant and can be eliminated in the theoretical model. Therefore,the cross-sectional areas in Table 3 should be used in the theoretical analysis and FE simulations.
Substituting Eq.(5)into Eq.(10),the effective tensile modulus of twisted fiber bundle/yarn can be calculated as:

3.3. Material properties
The mechanical properties of the Nextel 720 mullite-alumina fiber can be found in many literatures23-25.The property value has some dispersion and 201GPa is adopted as the tensile modulus.The fiber bundle can be regarded as a transversely isotropic material, and there are five independent mechanical parameters. The parameters used in this paper are given in Table 4.
3.4. Prediction results and analysis
Based on the Eq. (11), the tensile moduli of twisted yarns are predicted. Table 5 shows the prediction results of twisted yarns, and a comparison between the Madsen model and the proposed model in this paper. The prediction error is calculated as:

It can be seen from Table 5 that, the prediction values of proposed model are slightly lower than the values of the Madsen model. This is due to the two differences between the two models. The first difference is: the Madsen model assumes the cross-section of twisted yarn is circular, while the proposed model assumes the cross-section consists of several intersecting circles.Therefore,with the same cross-sectional area,the twisting angle of the Madsen model is smaller, hence the effective modulus of twisted yarn is slightly higher. The second difference is: the Madsen model first calculates the average twisting angle, and then calculates the effective modulus based on the Hearle equation; while the proposed model first calculates the effective modulus of each small region with the precise twisting angle and Hearle equation, and then calculates the effective modulus of yarn by averaging the effective modulus in the cross-section. Since the cosine function is a monotonically decreasing convex function for the twisting angel in this paper, the calculation method of Madsen model will make the calculation results larger.
In this paper,the prediction errors of the Madsen model are less than 1%, and the errors of the proposed model are less than 2%. This indicates that both theoretical models can predict the effective tensile modulus with an acceptable error for engineering applications. The Madsen model is simpler and more convenient to use; while the proposed model is based on the mechanical analysis. However, as the twisting angle increases,the difference in prediction results becomes more significant,which can be drawn from Table 5.Based on the aforementioned analysis, the physics-based model should be used for large twisting angle situations.
4. Numerical investigation
In this section, numerical simulations were carried out to investigate the mechanical behavior and stress/strain distribution of twisted yarns. For twisted yarns material, the crosssectional shape and the twist characteristic are essential and have a significant influence on the simulation result. Here,the cross-sections in Fig. 5 were adopted in the FE model,and the local coordinate system was assigned to each element.
4.1. FE models and periodic boundary conditions
Due to the periodic geometry of the yarn structure,representative volume elements (RVE) are selected as the FE models,which correspond to a full turn of the yarn structure.The geometrical parameters in Table 1 (twist parameters) and Table 3(cross-section parameters)are used to establish the RVE models, and commercially available software ABAQUS 6.14 is used to construct the 3D FE models (see Fig. 7). The element type is C3D8R.
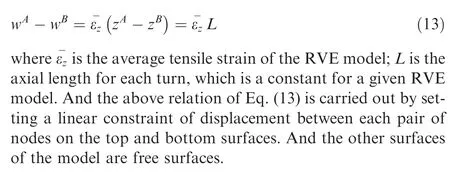
To replicate the repeating nature and ensure the continuity of stress and the compatibility of displacements at the boundaries of the RVE, periodic boundary conditions (PBCs) must be applied to the RVE model. For the RVE models in this paper, the PBCs are applied to the top and bottom surfaces:

Table 4 Mechanical parameters for Nextel 720 fiber.

Table 5 Prediction results of the Madsen model and the proposed model.
4.2. Local coordinate system
In twisted fiber yarn materials, the twist of fiber causes the local fiber axis to rotate relative to the global coordinate system along the length of the yarn, which results in a change of effective modulus in the global direction. Besides, the fiber yarns are transversely isotropic material, it is necessary to assign a local coordinate system to each element so that the local fiber axis is always parallel to the local 3 direction. To simplify the modeling process, a global coordinate system is assigned to the twisted fiber yarn model, and then is rotated to obtain the local coordinate system at each fiber yarn node in ABAQUS user material subroutine.
For the node P in the model as shown in Fig. 8, the coordinate of node P is (x, y, z), where 0 ≤z ≤L. The tangential unit vector at node P is:

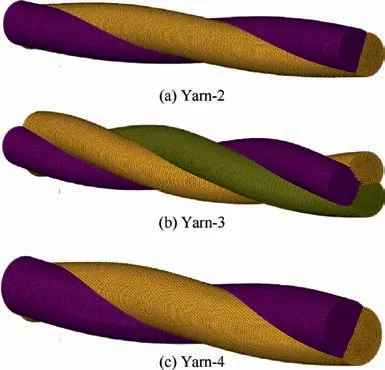
Fig. 7 RVE models of twisted yarns.
Take the node P to the axis of the twisted yarn as the X axis of the local coordinate system, the unit vector of the X axis of the local coordinate system is:

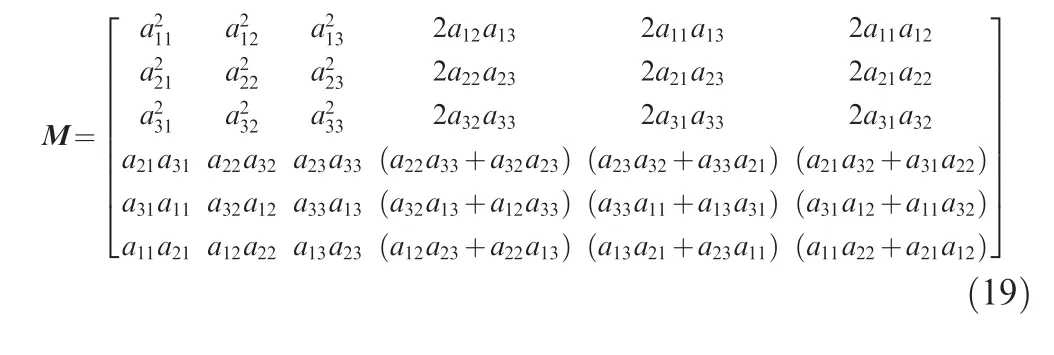
While for global coordinate system, the unit vectors are (1,0, 0), (0, 1, 0) and (0, 0, 1). Therefore, the orthogonal matrix could be written as:
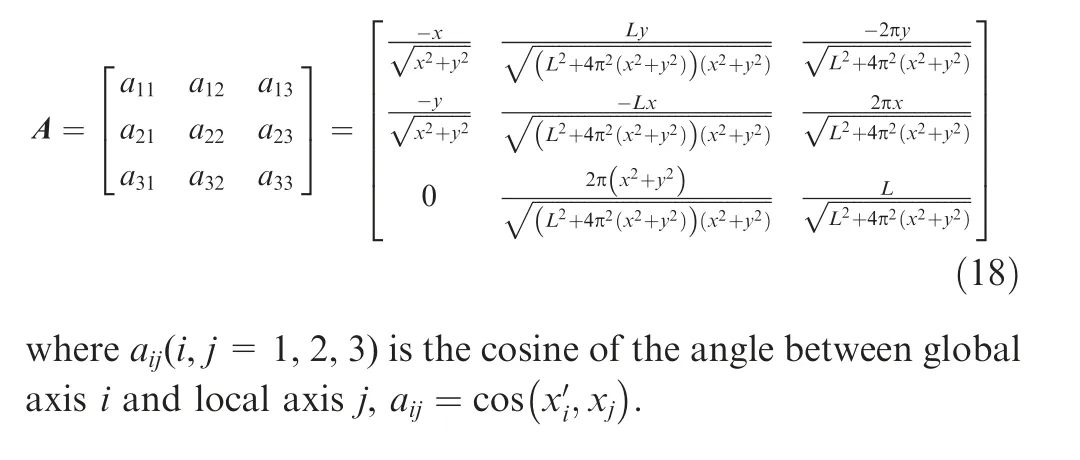
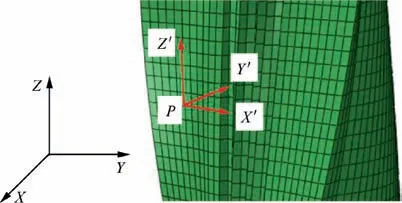
Fig. 8 Twist of yarn and local coordinate systems.
Then the transformation matrix M from the global coordinate system to the local coordinate system can be expressed as:
4.3. Numerical analysis
Mechanical parameters in Table 4 are used for the FE simulations.Effective tensile moduli of the twisted yarns are obtained from the simulation results, as shown in Table 6, and the simulated stress-strain responses are compared with experiment results in Fig.9.The simulation results show good agreements with the experimental results, and the relative errors are less than 1%(the relative error is calculated from the finite element simulation result and the average value of the test results, as shown in Table 6).
Fig. 10 and Fig. 11 show the stress/strain distributions of the yarn-1 and yarn-2,and the yarn-3 and yarn-4 have the similar distributions as the yarn-1 and yarn-2. The stress/strain distribution is the same for each layer of the yarn cross section;due to the rotational symmetry of the twisted yarns,the distributions are also rotationally symmetrical. The tensile stress/strain at the center of the yarn is larger.The further away from the center of the yarn, the smaller the tensile stress/strain,which is consistent with the prediction trend of the Hearle equation.
5. Discussion on strength performance improvement
The experimental results have shown that twisting can significantly improve the tensile strength of the fiber yarn. There is no theoretical model or simulation study to explain this phenomenon, because it is caused by the squeezing and friction between the contacting single fibers, which is difficult to describe in the theoretical and simulation models. In this section,the interaction force between the single fibers are derived to have an in-depth understanding of the reason for the increase in tensile strength.
For a single fiber microsegment in the twisted yarn, it can be assumed as a part of helix. Therefore, the curvature radius of the fiber microsegment is:


Table 6 Effective yarn moduli of FE simulations.
Fig. 12 shows the forces acting on the fiber microsegment.According to the equilibrium equation, we have:

where, σ is the tensile stress along the fiber direction; S is the cross-sectional area of the single fiber;ρ is the radius of curvature; F is the resultant force of the surrounding fibers on the fiber microsegment per unit length.
Substituting Eq. (8) into Eq. (20), the radius of curvature can be expressed as:

According to the definition of F and L, FL represents the radial resultant force of the surrounding fiber on a single fiber with a twist length.σScos2(θ )is the effective load of the single fiber along the axial direction of the twisted yarn. Therefore,the forces FL and σScos2(θ )have the same order of magnitude.
Fig.13 shows the radial resultant force of the adjacent fiber layers to a given fiber layer. Fi,jrepresents the radial resultant force of the i fiber layer against j fiber layer.For the outermost layer of fiber, the contact force is F2,1, and the maximum friction is μF2,1; for an inner fiber layer, the contact force is (Fi,i-1+Fi+1,i), and the maximum friction is μ(Fi,i-1+Fi+1,i).The formula of Fi,jcan be obtained based on the force analysis in Fig. 13:

According to the Eq. (24), as the number of fiber layers increases, the maximum friction between fibers increases significantly.
The above analysis shows that the single fiber in the twisted yarn can be subjected to great friction. This friction can make the stress distribution of the fiber in the twisted yarn more uniform, reducing the sensitivity of the yarn and fiber to internal defects. When the internal individual fibers lose their loadcarrying capacity due to microscopic defects, the surrounding fibers can share part of the load through contact friction,thereby improving the tensile strength of the twisted yarn and reducing the performance dispersion.
When not unloaded, the individual fibers which have lost their load-carrying capacity will not cause a significant reduction in the tensile modulus and strength of the twisted yarn.When unloaded, the contact force and friction on the internal fibers are released, and these damaged individual fibers will lead to a decrease in the tensile modulus and strength of the twisted yarn. That is to say, When the twisted yarn is loaded without failure, its load-carrying capacity will decrease gradually with the number of loading-unloading process increase,and this decrease will not be manifested in the current loading process, but in the next loading process, which brings huge potential safety hazards to its engineering applications.Therefore, for engineering applications, the maximum tensile stress on the twisted yarn should be much lower than the tensile strength of the twisted yarn.
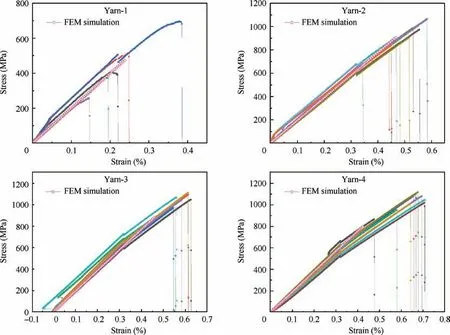
Fig. 9 Comparison of stress/strain response between experiment results and simulation.
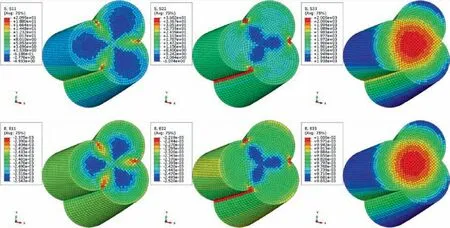
Fig. 10 Stress/strain distributions of yarn-1.
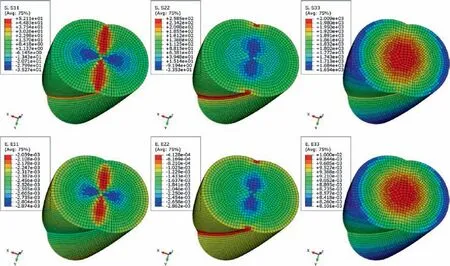
Fig. 11 Stress/strain distributions of yarn-2.
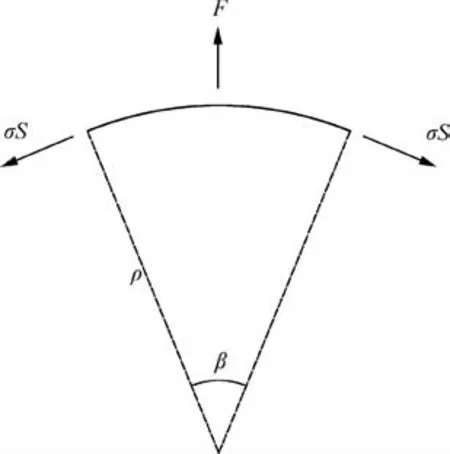
Fig. 12 Forces acting on fiber microsegment.
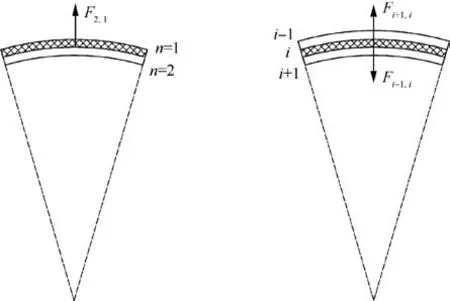
Fig. 13 Radial resultant force on a fiber layer: outermost fiber layer; inner fiber layer.
6. Conclusions
(1) The twist architecture results in a slight decrease in the effective tensile modulus of twisted fiber yarn, but the tensile strength can be increased significantly.
(2) Two kinds of cross-sectional area of twisted fiber yarn are illustrated and discussed: the sum of each fiber area should be adopted in experimental analysis; and the cross-sectional area surrounded by the yarn profile should be adopted for theoretical prediction and FE simulation. That’s to say, the cross-sectional area surrounded by the yarn profile should be adopted when using the Hearle equation.
(3) An intersecting circle model is proposed to describe the cross-section of twisted fiber yarn in the prediction and simulation models. And a physics-based prediction model is developed. The prediction results and FE simulation results are in good agreement with experimental data.
(4) The friction force between the fibers are derived,and the friction force is the main reason for the significant improvement in the tensile strength of the twisted yarn.
Declaration of Competing Interest
The authors declare that they have no known competing financial interests or personal relationships that could have appeared to influence the work reported in this paper.
Acknowledgements
This study was co-supported by the National Natural Science Foundation of China(Nos.51772009,51911530201,51802264 and 51275023).
 CHINESE JOURNAL OF AERONAUTICS2021年5期
- CHINESE JOURNAL OF AERONAUTICS的其它文章
- Ferrofluid moving thin films for active flow control
- Preliminary study on heat flux measurement data of TT-0 flight test
- An analysis and enhanced proposal of atmospheric boundary layer wind modelling techniques for automation of air traffic management
- Jet sweeping angle control by fluidic oscillators with master-slave designs
- Hot deformation behavior and microstructure evolution of the laser solid formed TC4 titanium alloy
- Electrochemical trepanning with an auxiliary electrode
