Structural design and optimization for vent holes of an industrial turbine sealing disk
Chng YAN, Jinfng ZHU,*, Xiuli SHEN, Jun FAN, Zhigng JIA,Tifng CHEN
a School of Aerospace Engineering, Xiamen University, Xiamen 361005, China
b School of Energy and Power Engineering, Beihang University, Beijing 100083, China
c Army Aviation Institute, Beijing 100000, China
d Aero Engine Academy of China, Beijing 101300, China
e AECC Commercial Aircraft Engine Co, Ltd, Shanghai 200241, China
KEYWORDS Multi Island Genetic Algorithm;Stress concentration;Structural optimization;Sub-model method;Vent hole
Abstract Severe stress concentration occurs around circular vent holes of an industrial turbine sealing disk. This paper investigates the structural design and optimization for the vent holes to effectively reduce the maximum von Mises stress and improve the fatigue life of the turbine sealing disk.An efficient integrated design optimization method is presented based on a novel non-circular vent hole design method in combination with a variable dimension sub-model method, a selfdeveloped modeling and meshing tool, and the Multi-Island Genetic Algorithm. The proposed non-circular vent hole is biaxial symmetric and consists of four smoothly connected arcs.The variable dimension sub-model method is utilized to obtain accurate results in the fields around the vent holes within the computationally acceptable time. The modeling and meshing tool is developed by using the Tcl/Tk Scripts to rebuild the geometry and generate the high-quality hexahedral mesh automatically. The Multi-Island Genetic Algorithm is adopted to solve the studied constrained optimization problem. After optimization, the maximum von Mises stress is reduced from 1305.644 MPa to 963.435 MPa, and the fatigue life is increased from 3091 cycles to 30,297 cycles.The results show that the proposed design and optimization methods can significantly improve the performance of the turbine sealing disk along with the remarkable drop in stress concentration.
1. Introduction
Structures with different types of holes are widely used to reduce the weight or satisfy other various service requirements.Due to abrupt changes in cross-section, severe stress concentration may be produced around these holes when the structures are subjected to diverse working loads. The presence of severe stress concentration may result in strength degradation and lead to structural failures, such as fatigue and fracture.1-3In academia and industry, the influences of the profiles of the holes and loading conditions on stress concentration have received great attention from many researchers.4-6
A large number of works using analytical methods have been carried out for the analysis of the stress distribution around holes and the mitigation of stress concentration.7-11However, the analytical methods may be insufficient to solve some practical engineering tasks with complex structures and loading conditions. With the rapid increase in computer processing power,the Finite Element Method(FEM)has become more popular in the product development process, and the numerical optimization techniques have been utilized in the shape optimization of holes to reduce stress concentration.12-16For example,Das and Jones12performed a shape optimization for a fuel flow hole located in the wing pivot fitting of an F-111 aircraft, and found that stress concentration is significantly reduced. Krishnapillai et al.16presented a structural design optimization for fuel flow holes, and showed that the peak maximum tangential principal stress is reduced with the majority of the stress distribution achieving a near constant value.
In the field of aero-engine,turbine disks play major roles in the performance of engines due to their significant influences on the system reliability and the service life. The holes in the turbine disks sometimes determine the life of the disks due to the existence of severe stress concentration.17One effective way to handle stress concentration is to design novel profiles for the holes and conduct corresponding optimizations. Chen et al.18proposed a modeling method for a biaxial symmetry non-circular hole to improve the conventional circular bolt holes on turbine disks. The results showed that the maximum first principal stress is reduced by 14.8% along with the remarkable drop in stress concentration. Chen et al.19expanded the biaxial symmetry non-circular bolt hole to the uniaxial symmetry non-circular bolt hole and obtained a better scheme with less stress concentration.
To be noted, the number of the bolt holes remains unchanged in the above literature. The change of the discrete quantity (hole number) may face some difficulties in the FEM-based optimization, such as: (A) the size of the singlehole cyclically symmetric sector model will change, and the boundary conditions imposed on the model have to be automatically adjusted; (B) the design variables of the profile of the bolt hole couples with the hole number,and inappropriate combinations of these parameters may lead to unreasonable designs.
In addition to the above literature,little information for the design and optimization of the holes on turbine disks has been reported up to now, especially for the vent holes. There are some differences between the design of the bolt hole and the vent hole.For example,the total area of the vent holes should be severely restricted due to the requirements of the aerodynamic and heat transfer disciplines, while the total area of the bolt holes may be unrestricted usually.
An industrial turbine sealing disk was initially designed with circular vent holes. The numerical results showed that severe stress concentration happens around the holes. This paper presents a novel non-circular design for the vent holes to effectively reduce the maximum von Mises stress and improve the fatigue life of the turbine sealing disk. A FEMbased optimization is also conducted to improve the performance of the proposed vent holes further. Notably, the number of vent holes will be optimized by using some techniques to overcome the difficulties discussed above.
The automatic geometry modeling and mesh generation are two key technologies of the FEM-based optimization. Generally speaking, the automatic geometry modeling can be realized by using two different ways, which are: (A) updating the expression of the established geometry model by using Macro commands,and(B)rebuilding the geometry by using the software user-developing languages.20-21The second way is adopted in this paper for its better performance in robustness and flexibility.The automatic mesh generation can be achieved by using two different element types, which are tetrahedron and hexahedron.The tetrahedral mesh has distinct advantages in terms of convenient regeneration and adaptive capacity,while the hexahedral mesh performs better in terms of element number and computational accuracy.22-24For the sake of high computational efficiency and accuracy,the hexahedral mesh is adopted in this paper. Notably, a practical modeling and meshing tool is developed by using Tcl/Tk Scripts to rebuild the geometry and generate the high-quality hexahedral mesh automatically.
Furthermore, an efficient integrated design optimization method is presented by combining a variable dimension submodel method, the non-circular vent hole design method, the self-developed modeling and meshing tool, and the Multi-Island Genetic Algorithm (MIGA).
The remainder of this paper is organized as follows.Firstly,the basic information of the vent holes of the studied turbine sealing disk is presented. Secondly, the design and optimization methods are introduced in detail. Then, the validation for the utilized variable dimension sub-model method is conducted. Finally, the results are discussed, and the work is summarized.
2. Vent holes of the studied turbine sealing disk
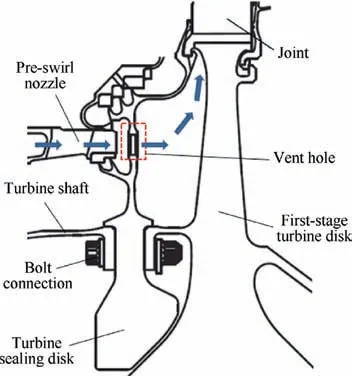
Fig. 1 Schematic of a common turbine rotor.
The studied turbine sealing disk is designed for a civil highbypass-ratio turbofan engine. Fig. 1 shows a 2-D schematic description of a conventional turbine rotor,which is similar to the one studied.The turbine sealing disk is connected with the turbine shaft and the first-stage turbine disk by using bolt connections. The vent holes on it locate facing to the pre-swirl nozzle.These vent holes and the pre-swirl nozzle are key components of the pre-swirl system, which is mainly employed to provide cooling air for the turbine rotor blades. The design of the pre-swirl system has received great attention from researchers for its advantages in reducing the temperature of the turbine rotor blades.25-27The studies have shown that the location and the total area of the vent holes have significant influences on the performance of the pre-swirl system.Therefore, the design of the vent holes is a multi-disciplinary collaborative task.
By considering the requirements from the aerodynamic,heat transfer, and structural strength disciplines, common circular vent holes were first designed for the studied turbine sealing disk by the experienced engineers. Fig. 2 shows the 3-D single-hole cyclically symmetric sector sub-model of the studied turbine sealing disk with the initial circular vent hole.Fig. 3 shows a schematic description of the circular vent hole.To handle stress concentration occurred around the initial circular vent holes, this paper attempts to redesign and optimize the vent holes. The design region should be restricted to the specific area shown in Fig. 2 so as to meet the demands of the aerodynamic and heat transfer disciplines.
3. Design and optimization
3.1. Integrated design optimization method
The integrated design optimization method is based on a twostage procedure,as shown in Fig.4.The vent hole is optimized in the second stage on the basis of an appropriate computational model determined in the first stage.
In the first stage, a simple way to determine the computational model is to build a 3-D model of the turbine sealing disk. However, it may be a hard task to determine the boundary conditions for such a 3-D model because of the existing of many contact pairs between the turbine sealing disk and other components(i.e.,the turbine shaft,the first-stage turbine disk,and the joint). The contact forces are very sensitive to the shape of contact surface and may even significantly reduce the accuracy of the simulation results. It is therefore of great importance to develop the so-called contact optimization techniques, of which the studies range from linear elastic frictionless to large deformation frictional contact problems.28
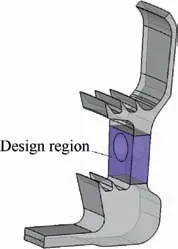
Fig. 2 3-D single-hole cyclically symmetric sector sub-model of turbine sealing disk with initial circular vent hole.
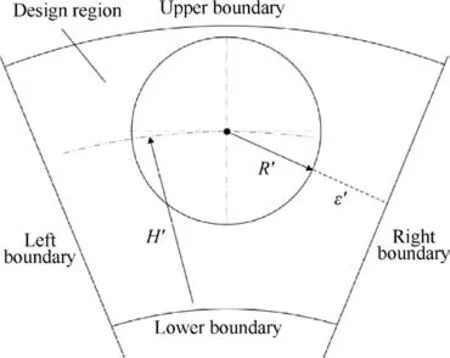
Fig. 3 Schematic of circular vent hole.
An alternative way to overcome the difficulty is to build a 3-D model of the turbine rotor, which includes the turbine shaft, the turbine sealing disk, the bolt connections, the joint,the first-stage turbine disk, etc. However, it is very difficult to solve such a 3-D large-scale highly nonlinear problem.Even if it converges, the simulation is quite time-consuming and costly. It takes more than one week on an 8-Core, 64G memory computing platform.
An alternative way to reduce the computational cost is to build a 2-D model of the turbine rotor. On the 8-Core, 64G memory computing platform, the simulation takes about fifty minutes.However,the vent holes may be incorrectly simulated by such a 2-D model, which may only lead to satisfactory results in the regions far away from the vent holes.
To obtain accurate results in the fields around the vent holes within the computationally acceptable time, we utilize a variable dimension sub-model method by combining the 2-D model of the turbine rotor and the 3-D single-hole cyclically symmetric sector sub-model of the turbine sealing disk.On the 8-Core, 64G memory computing platform, the simulation of the 3-D single-hole sector sub-model takes about five minutes.The details of the variable dimension sub-model method will be introduced in Section 3.2.
In the second stage, a FEM-based optimization is conducted to obtain a better scheme for the vent hole by utilizing the non-circular vent hole design method, the self-developed modeling and meshing tool, and MIGA. The details will be respectively introduced in Sections 3.3-3.6.
3.2. Variable dimension sub-model method
The core idea of the variable dimension sub-model method is:(A) according to St. Venant’s principle, satisfactory results in the regions far away from the vent holes may be obtained by using the 2-D model of the turbine rotor; (B) by choosing the appropriate cut-boundary locations, the 3-D single-hole cyclically symmetric sector sub-model of the turbine sealing disk can be established to obtain more accurate results in the regions around the vent holes.
In detail, the method involves the following steps.
(1) Construct the 2-D geometry model of the turbine rotor by using UG NX. Different geometry features like vent holes, bolts, bolt holes, and joints are modeled separately.
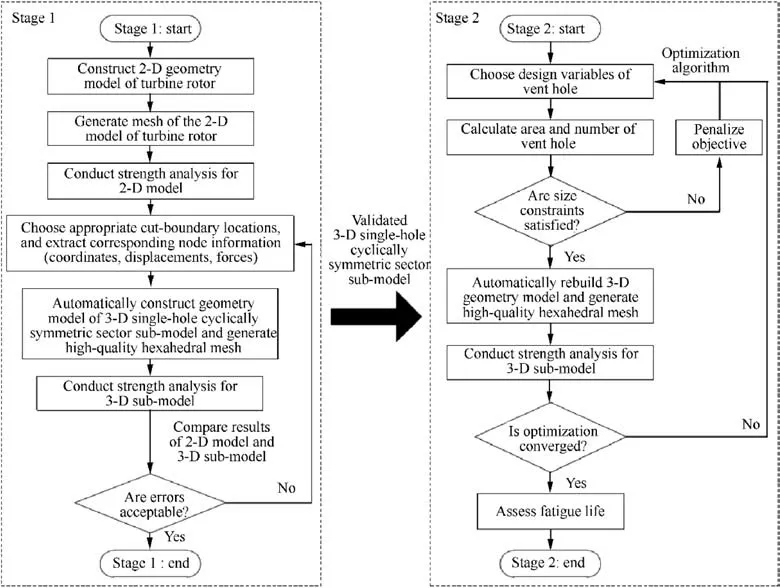
Fig. 4 Flowchart of integrated design optimization method.
(2) Generate the mesh of the 2-D model of the turbine rotor by using HyperMesh. The PLANE183 with axisymmetric option is selected as the element type of the axisymmetric features.The PLANE183 with plane stress option is selected to simulate the non-axisymmetric features.The CONTA172 and TARGE169 are used to represent the mechanical behavior of the contact pairs. The MASS21 is selected to simulate the blade mass and apply the aerodynamic forces of the blades. The PRETS179 is used to define the pretension force imposed on the bolt connections.
(3) Conduct the strength analysis for the 2-D model by using the APDL language of the finite element analysis software ANSYS. Particularly, the thickness real constants for the elements that simulate the nonaxisymmetric features are respectively determined according to their circumferential distribution.The temperature field and the aerodynamic pressure loads are respectively denoted as

where r denotes the radial coordinate, z denotes the axial coordinate, T2D(rb, zb) denotes the temperature at any location (rb, zb) of the 2-D model, P2D(rf, zf)denotes the aerodynamic pressure at any location (rf,zf) of the boundaries of the 2-D model.
(4) Choose the appropriate cut-boundary locations, which should be far enough away from the vent holes.The corresponding information of the nodes at the cut boundaries should be extracted from the results of the strength analysis of the 2-D model. The coordinates and displacements of the nodes will be utilized in Step 6. The stresses of the nodes will be utilized to validate if the cut boundaries are appropriate or not.
(5) Automatically construct the geometry model of the 3-D single-hole cyclically symmetric sector sub-model of the turbine sealing disk and generate the high-quality hexahedral mesh by using self-developed modeling and meshing tool. The numbers of the elements and the nodes at the cut boundaries of the 3-D sub-model are set to be the same with that of the 2-D model,as shown in Fig.5.The SOLID186 is selected as the computational element type of the 3-D sub-model.
(6) Conduct the strength analysis for the 3-D single-hole cyclically symmetric sector sub-model by using the ANSYS APDL language. One key step of the variable dimension sub-model method is to map the boundary conditions and loads from the 2-D model to the 3-D sub-model. The coordinate systems of all the nodes of the 3-D sub-model are first rotated into the cylindrical coordinate systems.
From Fig. 5, we can see that the node Niat one of the cut boundaries of the 2D model corresponds to the node set N′iof the 3D sub-model. The radial coordinates r(N′i) and the axial coordinates z(N′i)of the nodes at the cut boundaries of the 3-D sub-model should be modified to be the same with that,namely r(Ni), z(Ni), of the corresponding nodes of the 2-D model. The coordinate mapping can be described as

Fig. 5 Comparison of cut boundaries between 2-D model and 3-D single-hole sector sub-model.

The displacement results of the nodes at the cut boundaries of the 2-D model should be extracted and imposed on the corresponding nodes of the 3-D sub-model as displacement boundaries. The displacement mapping can be described as

where Urdenotes the radial displacement,Uzdenotes the axial displacement.
The mapping of the temperature field and the aerodynamic pressure loads from the 2-D model to the 3-D sub-model can be described as

where θ denotes the circumferential coordinate,T3D(rb,θb,zb)denotes the temperature at any location (rb, θb, zb) of the 3-D sub-model, P3D(rf, θf, zf) denotes the aerodynamic pressure at any location (rf, θf, zf) of the boundary of the 3-D sub-model.
(7) Compare the results of the strength analysis of the 2-D model and the 3-D sub-model and check whether the errors are acceptable or not. If not, recreate and reanalyze the sub-model with different cut boundaries that are further away from the vent hole, and repeat Step (4) to Step (6). If yes, the cycle will be terminated, and the appropriate 3-D single-hole cyclically symmetric sector sub-model will be obtained.
3.3. Non-circular vent hole design method
Fig.6 shows the geometry model of the proposed non-circular vent hole.From it,we can see that the vent hole is biaxial symmetric and consists of four smoothly connected arcs.The vent hole has the same center (rc0=H, θc0=0, zc0=0) with the basic circle whose radius is R0.The large arc Niof the vent hole is tangent to both the small arc A2and the basic circle. The radii of the large arc Niand the small arc A2are R1and R2respectively. The center of the large arc Niis located at the point (rc1=H+R0- R1, θc1=0, zc1=0). The center of the small arc A2is located at the point (rc2, θc2, zc2), where
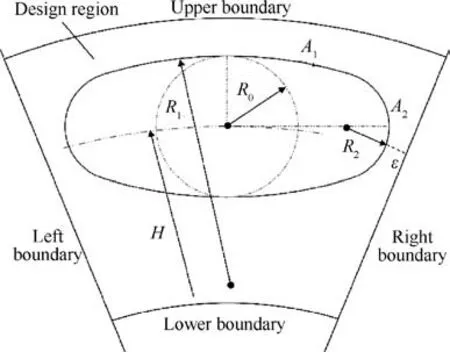
Fig. 6 Schematic of non-circular vent hole.

The analytical expression of the area SSof the single vent hole is derived for the convenience of coordinating the hole number.

The nearest distance between the vent hole and the right/left boundary of the single-hole sector sub-model is

where n denotes the number of the vent holes (or the sectors)of the studied turbine sealing disk.
3.4. Optimization model description
The maximum von Mises stress σeq,maxis selected as the objective.The profile and the location of the proposed vent hole can be determined by four parameters (R0, R1, R2, and H), which are selected as the design variables. According to the actual requirements from the aerodynamic discipline, heat transfer discipline, and processing technology, the distance should be greater than or equal to a small ε0and the total area of the newly designed vent holes(namely nSs)should be severely limited to 1±0.5% ST. Here STdenotes the total area of the initial circular vent holes.
To obtain the best scheme as far as possible, the vent hole number n should also be optimized.However,if n is set to be a design variable,the optimization may easily fail due to the severe limitation to the total area nSs.This paper chooses an indirect way to optimize n on the basis of the following equation.

where ceil (y) denotes a function that rounds the variable y to the nearest integer greater than or equal to y.
In summary, the optimization model of this study can be described as
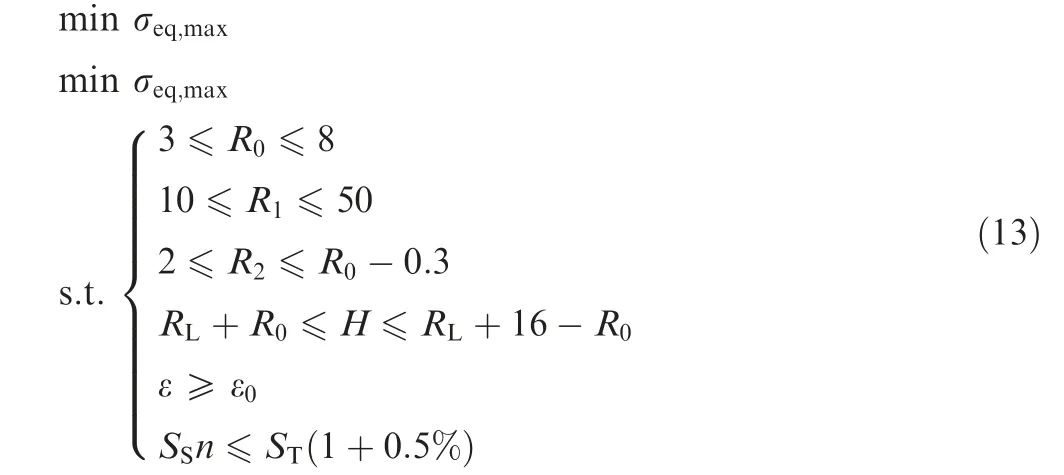
where RLand RL+16 respectively denote the radii of the lower boundary and the upper boundary of the design region.The variation ranges of the four design variables are determined according to the processing technology and the geometry limitations.
There are some couplings among the variation ranges of the design variables R0,R2and H,which makes it difficult to conduct the optimization.The difficulty can be overcome by using the following transformation.

Therefore, Eq.(13) can be transformed as
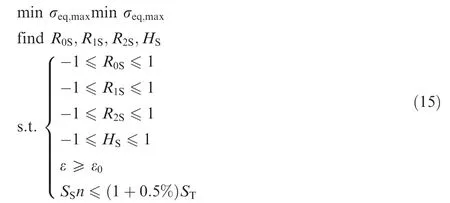
To be noted, the size constraints in Eq. (15) can be easily and quickly obtained according to Eq. (10), Eq. (11), and Eq.(12). In optimization, the objective eq,max will be directly penalized using a large value when the size constraints are not satisfied. The computational cost of the optimization may be reduced because in these situations the time-consuming strength analysis for the 3-D sub-model will not be conducted.
3.5. Self-developed modeling and meshing tool
The tool is developed to automatically rebuild the geometry of the 3-D single-hole sector sub-model and generate the corresponding high-quality hexahedral mesh on the basis of the 2-D model. To eliminate the inconvenience caused by different software and improve the computational efficiency, the geometry modeling and the mesh generation are realized in a unified tool by using the user-developing languages of Hypermesh,namely Tcl/Tk Scripts.Particularly,the mesh generation strategy, which is based on the mapping/sweeping method, is considered in the geometry modeling phase. The mapping/sweeping method is mainly used to extrude the 3-D hexahedral mesh for a revolving body or an extruding body by mapping or sweeping the 2-D quadrangle mesh,which is first generated on the source face, to the target face. Due to the existence of the vent hole, the 3-D single-hole sub-model cannot be directly generated by revolving or extruding a single surface. Therefore, the geometry is first partitioned into four simple subdomains, of which each belongs to a revolving body or an extruding body. As shown in Fig. 7, the regions in purple color, red color, yellow color, and green color are respectively denoted by the Sub-domains A,B,C and D.The mesh compatibility problem may occur between the neighboring Subdomains due to the different sweeping directions. An alternative way to solve the problem is to construct the "trajectory mesh" along the sweeping direction. The main steps of the geometry modeling and mesh generation are as follows.
(1) Define the design variables of the vent hole, i.e. R0, R1,R2, and H. The main Tcl/Tk Syntax is:set variable =expression.
(2) Input the predefined HM file of the 2-D sub-model,which includes the basic geometry and associated quadrangle mesh information. The main Tcl/Tk Syntax is:*readfile filename
(3) Rotate the 2-D geometry model and generate a 3-D geometry sub-model without the vent hole. The main Tcl/Tk Syntax is: *rotatemark entity_type mark_id plane_id angle
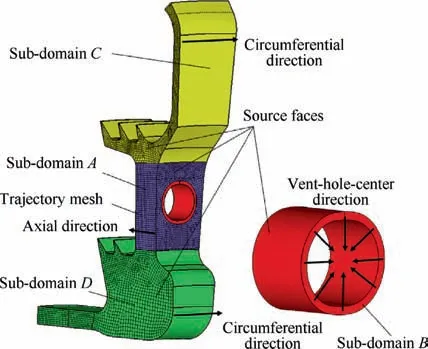
Fig. 7 Mesh generation strategy of 3-D single-hole sector submodel.
(4) Construct the profile of the vent hole and generate the 3-D geometry sub-model with the vent hole.The main Tcl/Tk Syntax are:* linecreatestraight x1y1z1x2y2z2*hm_createmark entity_type mark_id?option? list
(5) Construct an offset profile of the vent hole.Trim the 3-D sub-model constructed in Step 4 and generate the Subdomains A, B, C, and D. The main Tcl/Tk Syntax is:*trim_solids_by_surfaces
(6) Generate the quadrangle mesh on the source face of the Sub-domain A and sweep/map it along with the axial di rection and the "trajectory mesh" so as to obtain the hexahedral mesh of the Sub-domain A. The main Tcl/Tk Syntax is: * automesh face_index algorithm elem_type
(7) Extract the face mesh of the Sub-domain A and sweep/map it along with the vent-hole-center direction so as to obtain the hexahedral mesh of the Sub-domain B. The main Tcl/Tk Syntax are:
* findfaces entity type mark
* solidmap_begin ordered
*solidmap_end options density_or_size bias_style biasing
(8) Sweep/map the existing quadrangle mesh on the source face of the Sub-domain C along with the circumferential direction so as to obtain the hexahedral mesh of the Subdomain C.
(9) Sweep/map the existing quadrangle mesh on the source face of the Sub-domain D along with the circumferential direction so as to obtain the hexahedral mesh of the Subdomain D.
(10) Set the element attributes and export the established model. The main Tcl/Tk Syntax is:
* feoutputwithdata export_template filename reserved 1 reserved 2 export_type string_array number_of_strings
Fig. 8 shows the automatically generated geometry model and high-quality hexahedral mesh. Notably, the mesh layers and the node number around the vent hole can be arbitrarily adjusted according to the actual requirements.
3.6. Multi-Island Genetic Algorithm
The Multi-Island Genetic Algorithm is adopted to solve the constrained optimization problem in this paper. MIGA is a modified approach of the Traditional Genetic Algorithm(TGA), which is mainly employed to find the possible optimal solution based on the natural selection of the biological evolution.29-31
The basic principle of TGA is: (A) an initial population is determined randomly as the first generation; (B) the individuals are selected from the population based on their fitness ranking; (C) the selected individuals are used to reproduce the offspring through crossover and mutation; (D) these operations, namely selection, crossover, and mutation, are repeated to produce new generations until the optimization is finished.
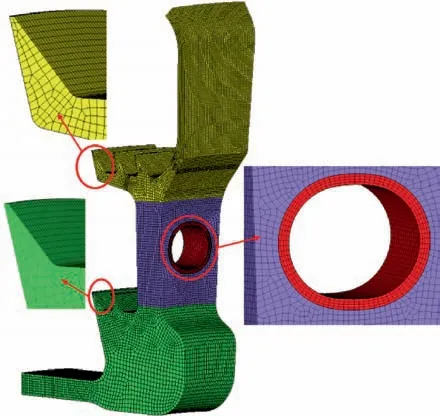
Fig. 8 Geometry model and high-quality hexahedral mesh generated by self-developed modeling and meshing tool.
Being different from TGA,MIGA divides each population into several subpopulations, which are called islands. The TGA operations (selection, crossover, and mutation) are then performed independently on each island.Exchange of individuals called migration is periodically performed between different islands to keep the diversity of the probable solutions and increase the chance of obtaining the global optimal solution.The evolution procedure between two successive generations in MIGA is shown in Fig. 9, where m denotes the migration interval, k denotes the arbitrary positive integer.
4. Method validation
The principle of the variable dimension sub-model method implies that reasonably accurate results could be obtained in the regions around the vent hole only if the cut boundaries are far enough away from the hole.Considered the restrictions of the sub-model method,the results of the 2-D model and the 3-D single-hole sector sub-model should be compared to validate if the adopted cut boundaries are suitable or not.
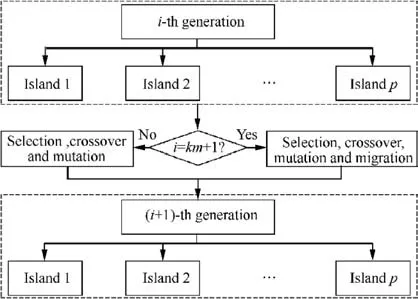
Fig. 9 Evolution procedure between two successive generations in MIGA.
Fig. 10 and Fig. 11 respectively show the radial displacement distribution and the axial displacement distribution of the 2-D model and the 3-D single-hole sector sub-model.From them, we can see: (A) the distribution of the radial displacement and the axial displacement of the 3-D sub-model are quite similar to that of the 2-D model; (B) the locations and the values of the maximum/minimum radial/axial displacements of the 3-D sub-model are almost the same with that of the 2-D model.
Fig. 12 shows the vonMises stress distribution of the 2-D model and the 3-D single-hole sector sub-model. From it, we can see: (A) since the 2-D model cannot correctly simulate the hole-structure, the stress results near the vent hole of the 2-D model are not reliable;(B)except for the unreliable region,the distribution of the vonMises stress of the 3-D sub-model is quite similar to that of the 2-D model;(C)except for the unreliable region, the locations and the values of the maximum/minimum vonMises stress of the 3-D sub-model is almost the same with that of the 2-D model.
Four typical locations,namely A,B,C,and D,are selected to show the detailed differences between the 2-D model and the 3-D sub-model. From Table 1, we can see: (A) for the radial displacement Urat the four locations (A, B, C, and D), the differences between the 2-D model and the 3-D submodel are ranging from-0.291%to 0.039%;(B)for the axial displacement Uzat the four locations, the differences between the 2-D model and the 3-D sub-model are ranging from-0.386%to-0.083%;(C)among the four locations,the maximum absolute difference of the von Mises stress σeqis 1.141%.
Fig. 13 shows the von Mises stress σeqalong the paths of the two cut boundaries. From it, we can see: (A) at the two cut boundaries, the results (σeq) of the 3-D sub-model are in good agreement with that of the 2-D model; (B) for the average von Mises stress at the cut boundary 1, the difference between the 2-D model and 3-D sub-model is only 0.626%;(C) for the average von Mises stress at the cut boundary 2,the difference between the 2-D model and 3-D sub-model is-2.042%.
According to the above discussions, we find that the displacement/stress differences between the 2-D model and the 3-D single-hole sector sub-model are relatively small and acceptable in engineering.It can be concluded that the selected cut boundaries are appropriate.
5. Results and discussion
5.1. Optimization results
After optimization,we obtain an optimal scheme for the studied vent hole,which satisfies all the predefined constraints and possesses the minimum σeq,max(maximum von Mises stress).
Table 2 shows the results of the initial circular vent hole and the optimal non-circular vent hole. Compared with the initial scheme, the profile of the optimal scheme changes apparently,the radius R1of the large arc is increased by 244.138%, the number of the vent holes is reduced by 21.333%,and the maximum von Mises stress σeq, max is reduced by 26.210%. The total area of the optimal non-circular vent holes is only increased by 0.224%, which meets the requirements of the aerodynamic and heat transfer disciplines.
Fig.14 shows the von Mises stress distribution of the initial scheme and the optimal scheme.From it,we can see:(A)compared with the initial scheme,the maximum von Mises stress of the optimal scheme is reduced significantly; (B) the high stress area of the initial scheme only converges in a small edge of the vent hole, while the high stress of the optimal scheme is fairly well-distributed around the vent hole.
To provide a more detailed description, Fig. 15 shows the von Mises stress distribution along the edges of the vent holes of the initial and optimal schemes.From it,we can see:(A)for the initial scheme, the maximum von Mises stress(1273.208 MPa)is 55.616% larger than the average von Mises stress(818.172 MPa),while the minimum stress(556.764 MPa)is 31.950%smaller than the average stress;(B)for the optimal scheme, the maximum von Mises stress (963.435 MPa) is 11.648% larger than the average von Mises stress(862.919 MPa), while the minimum stress (768.436 MPa) is 10.949% smaller than the average stress. Obviously, the improved scheme is more uniform in von Mises stress distribution when compared with the initial scheme.
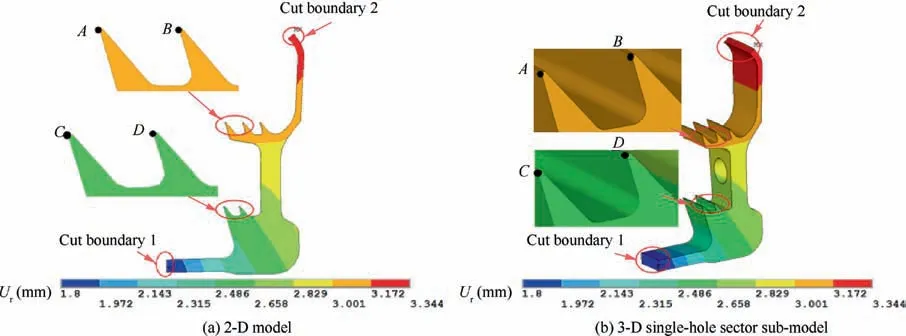
Fig. 10 Comparison of radial displacement distribution between 2-D model and 3-D single-hole sector sub-model.
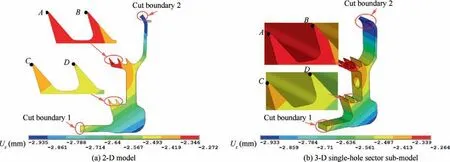
Fig. 11 Comparison of axial displacement distribution between 2-D model and 3-D single-hole sector sub-model.
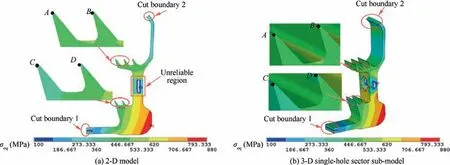
Fig. 12 Comparison of von Mises stress distribution between the 2-D model and the 3-D single-hole sector sub-model.

Table 1 Comparison of displacement/stress results between 2-D model and 3-D single-hole sector sub-model.
Fig.16 and Fig.17 respectively show the radial stress distribution and the circumferential stress distribution of the initial scheme and the optimal scheme. From them, we can see: (A)for both the initial and optimal schemes, the high radial stress areas locate at the left/right sides of the vent hole, while the high circumferential stress areas locate at the bottom/top sides;(B) compared with the initial scheme, the maximum radial stress of the optimal scheme is increased from 686.403 MPa to 954.465 MPa, which may be induced by the reduction of the radius R2of the small arc; (C) compared with the initial scheme, the maximum circumferential stress is reduced from 1346.503 MPa to 956.586 MPa, which may be caused by the increase of the radius R1of the large arc.
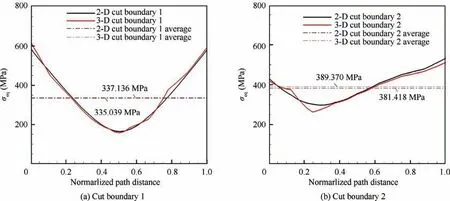
Fig. 13 Comparison of von Mises stress along paths of cut boundaries between 2-D model and 3-D single-hole sector sub-model.

Table 2 Comparison of results between the initial circular vent hole and the optimal non-circular vent hole.

Fig. 14 Comparison of von Mises stress distribution between the initial scheme and the optimal scheme.
According to the above discussions,we think the reason for the better performance of the optimal scheme is: by changing the design parameters (R0S, R1S, R2S, and HS) of the noncircular vent hole,the von Mises stress at the left/right sides of the vent hole may be adjusted to be approximately equal to that at the bottom/top sides.It may achieve uniform stress distribution and effectively reduce stress concentration.
In summary, the improved scheme possesses apparent advantages over the initial scheme with less stress concentration and more uniform stress distribution.
5.2. Fatigue life assessment
The fatigue life should be assessed to further compare the performance of the initial scheme and the optimal scheme. The selected fatigue load spectrum is: 0 — maximum von Mises stress — 0.
Based on the previous engineering experience, we choose a favorite fatigue life model — the Morrow equation,32which was evolved from the Manson-Coffin33,34equation by introducing the effect of the mean stress. The Morrow equation can be described as

where the parameter Δε denotes the total strain amplitude, E denotes the elastic modulus, σmdenotes the average stress,σ′fdenotes the fatigue strength coefficient, b denotes the fatigue strength exponent, ε′fdenotes the fatigue ductility coefficient, c denotes the fatigue ductility exponent, and Nfdenotes the fatigue life.
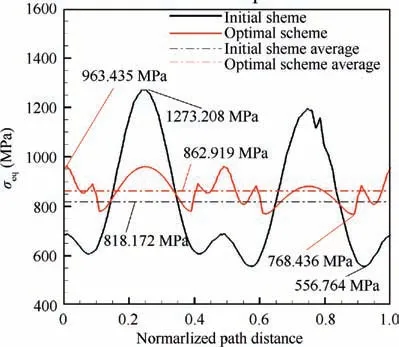
Fig. 15 Comparison of von Mises stress distribution along edge of vent holes between the initial scheme and the optimal scheme.
The Morrow equation establishes a relationship between fatigue life and the total strain amplitude, which is the sum of the elastic and plastic strain amplitudes. Considering that the elastic finite element analysis is adopted in this paper, we calculate the total stress amplitude approximately by using the popular Neuber equation,35which can be described as

where ε denotes the local strain, σ denotes the local stress, Δσdenotes the local stress amplitude, σndenotes the nominal stress, Δσndenotes the nominal stress amplitude, ktdenotes the theoretical stress concentration factor.
The Neuber equation can be solved by combining the cyclic stress-strain curve, which can be described as

where K′denotes the cyclic stress coefficient, n’ denotes the cyclic strain hardening exponent.
According to the above equations,the fatigue life of the initial scheme and the optimal scheme can be finally calculated,which are shown in Table 3.Compared with the initial scheme,the fatigue life Nfof the optimal scheme is increased from 3091 cycles to 30,297 cycles.
Obviously,the optimal scheme performs better than the initial scheme. It illustrates that the proposed design and optimization methods are advanced and have some values in engineering.
6. Conclusions
In this paper,novel design and optimization for the vent holes of an industrial turbine sealing disk were presented by utilizing an efficient integrated design optimization method, which involves a proposed variable dimension sub-model method, a novel non-circular vent hole design method, a self-developed modeling and meshing tool, and the Multi-Island Genetic Algorithm. Some findings of this work could be summarized as follows:
(1) The displacement/stress differences between the 2-D model and the 3-D single-hole cyclically symmetric sector sub-model are relatively small and acceptable in engineering. It illustrates that the adopted variable dimension sub-model method can obtain reasonably accurate results by using less computational cost.
(2) The developed modeling and meshing tool is robust and efficient to automatically rebuild the geometry and generate the high-quality hexahedral mesh of the 3-D singlehole sector sub-model.
(3) By changing the design parameters of the non-circular vent hole, the von Mises stress at the left/right sides of the vent hole may be adjusted to be approximately equal to that at the bottom/top sides. It may achieve uniform stress distribution and effectively reduce stress concentration.
(4) After optimization, the performance of the turbine sealing disk improves significantly. The maximum von Mises stress is reduced from 1305.644 MPa to 963.435 MPa, and the fatigue life is increased from 3091 cycles to 30,297 cycles. It illustrates that the proposed design and optimization methods are advanced and have some values in engineering.

Fig. 16 Comparison of radial stress distribution between the initial scheme and the optimal scheme.

Fig. 17 Comparison of circumferential stress distribution between the initial scheme and the optimal scheme.

Table 3 Comparison of fatigue life between the initial scheme and the optimal scheme.
Declaration of Competing Interest
The authors declare that they have no known competing financial interests or personal relationships that could have appeared to influence the work reported in this paper.
Acknowledgment
This study was co-supported by the National Natural Science Foundation of China (No. 52005421), the Natural Science Foundation of Fujian Province of China (No. 2020J05020),and the Project funded by China Postdoctoral Science Foundation (No. 2020M682584).
 CHINESE JOURNAL OF AERONAUTICS2021年5期
- CHINESE JOURNAL OF AERONAUTICS的其它文章
- Ferrofluid moving thin films for active flow control
- Preliminary study on heat flux measurement data of TT-0 flight test
- An analysis and enhanced proposal of atmospheric boundary layer wind modelling techniques for automation of air traffic management
- Jet sweeping angle control by fluidic oscillators with master-slave designs
- Hot deformation behavior and microstructure evolution of the laser solid formed TC4 titanium alloy
- Electrochemical trepanning with an auxiliary electrode
