Aerodynamic performance of owl-like airfoil undergoing bio-inspired flapping kinematics
Xinyu LANG, Bifeng SONG, Wenqing YANG,b,*, Wenping SONG,c
a School of Aeronautics, Northwestern Polytechnical University, Xi’an 710072, China
b Research & Development Institute of Northwestern Polytechnical University in Shenzhen, Shenzhen 518057, China
c Yangtze River Delta Research Institute of Northwestern Polytechnical University, Taicang 215400, China
KEYWORDS Aerodynamic performance;Bio-inspired kinematics;Flapping airfoils;Low Reynolds number;Micro aerial vehicles
Abstract Natural flyers have extraordinary flight skills and their prominent aerodynamic performance has attracted a lot of attention. However, the aerodynamic mechanism of birds’ flapping wing kinematics still lacks in-depth understanding. In this paper, the aerodynamic performance of owl-like airfoil undergoing bio-inspired flapping kinematics extracted from a free-flying owl wing has been numerically investigated. The overset mesh technique is used to deal with the large range movements of flapping airfoils.The bio-inspired kinematics consist of plunging and pitching movement. A pure sinusoidal motion and a defined motion composed of plunging of sinusoidal motion and pitching of the bio-inspired kinematics are selected for comparison.The other two NACA airfoils are also selected to figure out the advantages of the owl-like airfoil. It is found that the cambered owl-like airfoil can enhance lift during the downstroke. The bio-inspired kinematics have an obvious advantage in lift generation with a presence of higher peak lift and positive lift over a wider proportion of the flapping cycle. Meanwhile, the bio-inspired motion is more economical for a lower power consumption compared with the sinusoidal motion. The sinusoidal flapping motion is better for thrust generation for a higher peak thrust value in both upstroke and downstroke,while the bio-inspired kinematics mainly generate thrust during the downstroke but produce more drag during the upstroke.The defined motion has similar lift performance with the bio-inspired kinematics,while it consumes more energy and generates less thrust.The unsteady flow field around airfoils is also analyzed to explain the corresponding phenomenon.The research in this paper is helpful to understand the flight mechanism of birds and to design a micro air vehicle with higher performance.
1. Introduction
In the past few years,the Flapping-wing Micro Aerial Vehicles(FMAVs)have attracted a lot of interest for their light weight,low flight noise, and high aerodynamic efficiency. Compared with the conventional fixed-wing flight,the flapping wing flight can offer many advantages in energy consumption and flight agility.1-4But so far,the aerodynamic performance of FMAVs still has many limitations and is far away from its natural counterparts. The bird-like flapping wing cannot fly as efficiently or maneuverably as birds.One of the challenge is complex flow features resulting from low Reynolds number in the order of O(104), which is characterized by the laminar separation and rapid transition to turbulent flow with the loss of lift and increase of drag.5The transition susceptibility of the separated shear layer will significantly limit the performance of the flight vehicle.However,over a long time of evolution,birds obtain extraordinary flight skills and outstanding maneuverability at a similar flight situation and Reynolds number.Thus,there is great potential for shared research between biological flyers and bio-inspired FMAVs to improve these vehicles’flight performance.6
The morphology of bird’s wing such as wing sections and planforms are believed to have an important factor in the flyer’s aerodynamic performance. Some researchers scanned dried bird wing or free-flying bird wing to reconstruct the wing geometry or establish a mathematical model.7-9It was found that the cross-section of the bird’s arm wing is characterized by a round nose, a high camber, a thick leading edge, and a sharp trailing edge.Carruthers et al.10found that a bird’s wing section shows a robust, near-constant drag coefficient compared with the S1223 and Clark Y airfoils. Anyoji et al.11experimentally tested an owl-like wing model at low Reynolds number and the result shows a high lift to drag ratio during steady-state flight. Additionally, the profile of the bird’s wing section is closely related to its flight style.12A thick and high camber wing allows barn owls to fly at a lower speed than pigeons with thinner airfoils. The wing morphologies also show an association with their flight style according to Lees et al.13, who demonstrated that the morphological differences manifested primarily are shown as differences in drag rather than lift. Some birds, such as barn owls, have an almost elliptical shape wings planform, which leads to high flight efficiency during gliding flight.14Thielicke and Stamhuis15experimentally investigated the influence of wing morphology on the flapping wing model with a pigeon-like planform.Chang et al.16numerically studied the unsteady aerodynamic performance of a seagull-like planform flapping wing.Although bird’s wing morphology has attracted a lot of attention, there are still few studies on the unsteady performance of the real bird wing section. Most of the studies utilized S1223 or modified NACA series airfoil as the flapping model wing section, which is still different from the real bird’s wing section.
Flapping motion, as the manner to generate lift and thrust for all flight animals,plays an important role in their flight efficiency and maneuverability.Many photogrammetric measurements have been performed by tracking the landmarks on the wing to capture the wingbeat kinematics during their hovering or free-flying process.17-19Their result suggests that the wingbeat kinematics are characterized by a long flat downstroke phase but a short steep upstroke phase, which is distinct from the simple sinusoidal motion commonly used in robots or simplified models.20,21Both numerical simulation22and experiment23suggested that the downstroke is primarily responsible for weight support, which means more lift will be generated during the downstroke phase than the upstroke phase. Compared with the simple sinusoidal motion,non-sinusoidal and asymmetry functions show the advantages of lift enhancement and energy saving.24,25Kinematics like trapezoidal waveforms associated with a higher rate of upstroke and downstroke motion will induce a stronger Leading Edge Vortex(LEV),which is believed to be responsible for high-lift mode.26Recently, studies on kinematic parameters optimization of the flapping wing also suggested that the asymmetry and non-sinusoidal kinematics can be beneficial to flight ability and minimum energy.27,28Chang et al.16analyzed a bioinspired kinematic characterized by asymmetric flapping motion and found that a longer downstroke phase will be beneficial for lift production. Vandenheede et al.29experimentally investigated bio-inspired hover kinematics and concluded that the bio-inspired motion can generate more thrust in hovering flight than the same amplitude sinusoidal motion. In most of the previous literature,the adopted bio-inspired flapping kinematics are simplified or self-defined, which is still different from the real bird’s flapping motion.
Although more and more people begin to pay attention to the aerodynamics of bird flight, few have focused on the relationship between real bird’s wing kinematics and force generation during its forward flight. One primary problem is that,unlike hummingbirds which could perform almost steady hovering in front of a flower,it is difficult to accurately capture the wing kinematic parameters in free forward flying. Additionally, there are also many limitations to measure the aerodynamic force in real time during the free animal movement.Furthermore, most morphological measurements of birds’wings are based on recently deceased birds rather than the living birds.Thus,the aerodynamic characteristics of the reestablished model and real bird might be different due to the measurement discrepancy. Nowadays, CFD offers a way to explore the relationship between the birds’ wing kinematics and their aerodynamic properties.And it has been successfully applied to aerodynamic force evaluation of small animals,particularly insects and hummingbirds.30,31. Nevertheless, the wing geometry and wing kinematics of the flapping model employed in numerical simulations are still much less detailed than its natural counterpart.
To better understand the relationship between birds’ wing kinematics and their unsteady aerodynamic performance, the computational fluid dynamics method was performed to investigate the aerodynamic characteristics of an owl-like airfoil driven by the bio-inspired kinematics obtained from a free-flying barn owl. The bio-inspired kinematics were extracted from the experiment conducted by Wolf and Konrath18. The experiment measured the wing kinematics of a free-flying barn owl with a high spatial and temporal resolution measurement equipment. Based on the mathematical formulation of the owl wing section established by Liu et al.7, an owl-like airfoil at 50% spanwise location was reconstructed for this study. To figure out the benefit of the bio-inspired kinematics, a pure sinusoidal motion and a defined motion were selected for comparison. Additionally, NACA0012 and NACA5506 airfoil with a similar thickness and camber to the owl-like airfoil were also considered to investigate the characteristics of the bird-like airfoil configuration. The present research will provide a better understanding of natural flyers’ highly efficient flight mechanisms. The natureinspired movement parameters can be used as a base for FMAVs’ performance enhancement.
2. Materials and methods
2.1. Model
The owl-like airfoil named OWL05 is reestablished based on the measurement by Liu et al.7, which was the cross-section at 50%length of the barn owl wingspan.The maximum thickness of the OWL05 is 5.52% at 11% chord length, and the maximum camber is 2.77% at 47% chord length. To evaluate the influence of the owl-like airfoil’s geometry profile on its flight performance, NACA5506 with a similar thickness and camber as OWL05 is considered in further research. Meanwhile,symmetrical airfoil NACA0012 is also selected for comparison as NACA0012 driven by various unsteady motions has been extensively studied and its unsteady aerodynamic performance has been widely explored.24,26,32-34It is helpful to better understand the characteristic of the bird-like airfoil and bioinspired kinematics on the basis of the knowledge of the aerodynamic performance of NACA0012 under unsteady motion.A similar comparison has also been adopted in the research conducted by Rival et al.35. The geometry of these three airfoils is shown in Fig. 1.
2.2. Flapping kinematics
The bio-inspired kinematics used in this study are obtained from the experiment conducted by Wolf and Konrath18, who measured the wing kinematics of a free-flying barn owl using the measurement technique PROPAC(projected pattern correlation technique). The method is based on the stereophotogrammetry that enables the reconstruction of threedimensional objects from multi-camera images. The realized multiple cameras setup, which mounted on a stiff lightweight frame, can move along with the flying bird. Therefore, the wing profile and wing kinematics during flapping flight can be obtained with this high spatial and temporal resolution measurement technique.The experiment obtained the displacements of plunging, pitching,and sliding motion at three spanwise positions on the barn owl wing, which were 10%, 50%,90%length of barn owl wingspan.Previous studies have found that the interaction between leading edge vortex and tip vortex will form a very complicated flow field structure near the wing tip.36Meanwhile,the influence of the outer part wing’s folding and morphing movements on its aerodynamic performance cannot be ignored.37Therefore, only the motions of the wing section at the half spanwise location are considered in this study. The three-dimensional flapping motion can be simplified into movements of two-dimensional airfoil, composed of plunging, pitching, and sliding motion. This simplification has also been adopted in other research38. Besides, because the magnitude of sliding motion is quite smaller than that of the other two motions, the sliding motion is ignored and only the plunging and pitching motion are incorporated. Thus, the extracted bio-inspired kinematics combining plunging and pitching motion, which is named the Owl Motion (OM), are described as follows:
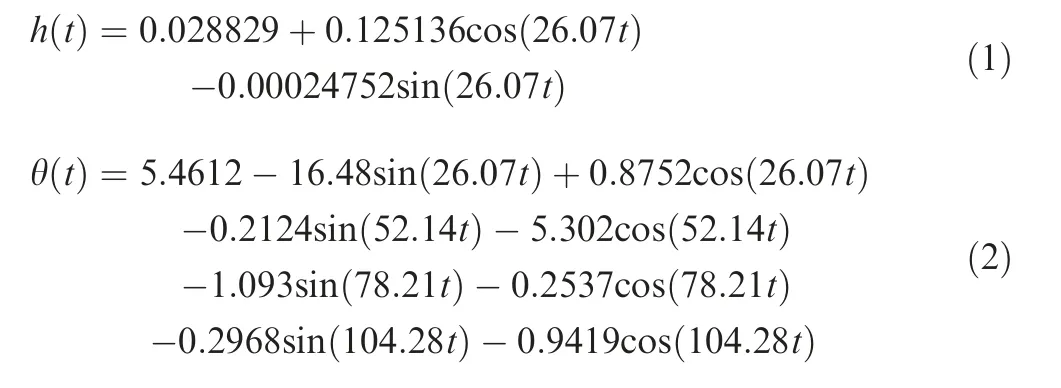
where h(t)means plunging motion displacement in meters and θ(t) means the pitching angle in degrees.
To explore the advantages of bio-inspired kinematics for aerodynamic performance, a pure sinusoidal motion with the same amplitude of plunging and pitching motion as the OM was adopted.The pure sinusoidal was named the Sine Motion(SM)and described as follows:

where hmis the plunging amplitude and is set to 0.1251 meters;θmis the pitching amplitude and equals 15.9249 degrees. θ0is the mean angle of attack.It should be noted that,to eliminate the influence of the mean angle of attack on lift force between the pitching motions of the OM and SM,θ0of the SM is set to 5.4612 degrees. Thus, the mean angle of attack of the two motions is consistent. Additionally, a small translation phenomenon could be found when we compare the plunging motion of OM and SM. To assess the effect of this difference between the plunging motion of OM and SM, a new flapping motion named Defined Motion (DM) has been created. The DM consists of plunging motion of SM and pitching motion of OM, and can be written as

Fig. 2 shows the plunging displacement h and pitching angle θ of these three kinematics. It could be seen that the plunging motion of the OM is very close to the sinusoidal motion. However, the pitching motion of the OM is far from the sinusoidal motion, which seems more like a square function.

Fig. 1 Geometry of three airfoils.
The parameters used in this simulation are presented in Table 1. The mean chord length and free stream flow speed were adopted from the free-flying owl measurement by Wolf and Konrath.18The flapping frequency is the real owl’s flapping frequency.

Table 1 Numerical simulation parameters of NACA0012,NACA5506, and OWL05 under different flapping motions.
2.3. Performance parameters
Dimensionless force coefficients are obtained to analyze the simulation results, which are given as
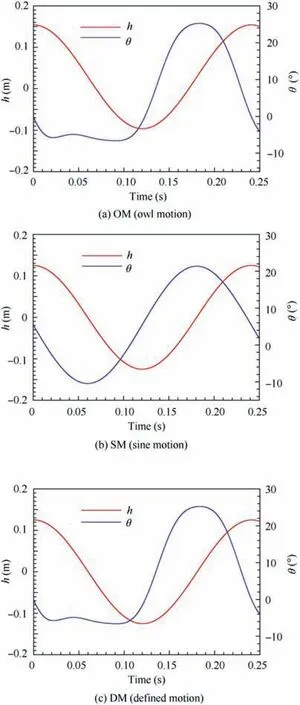
Fig. 2 Plunging displacement and pitching angle of three flapping kinematics.
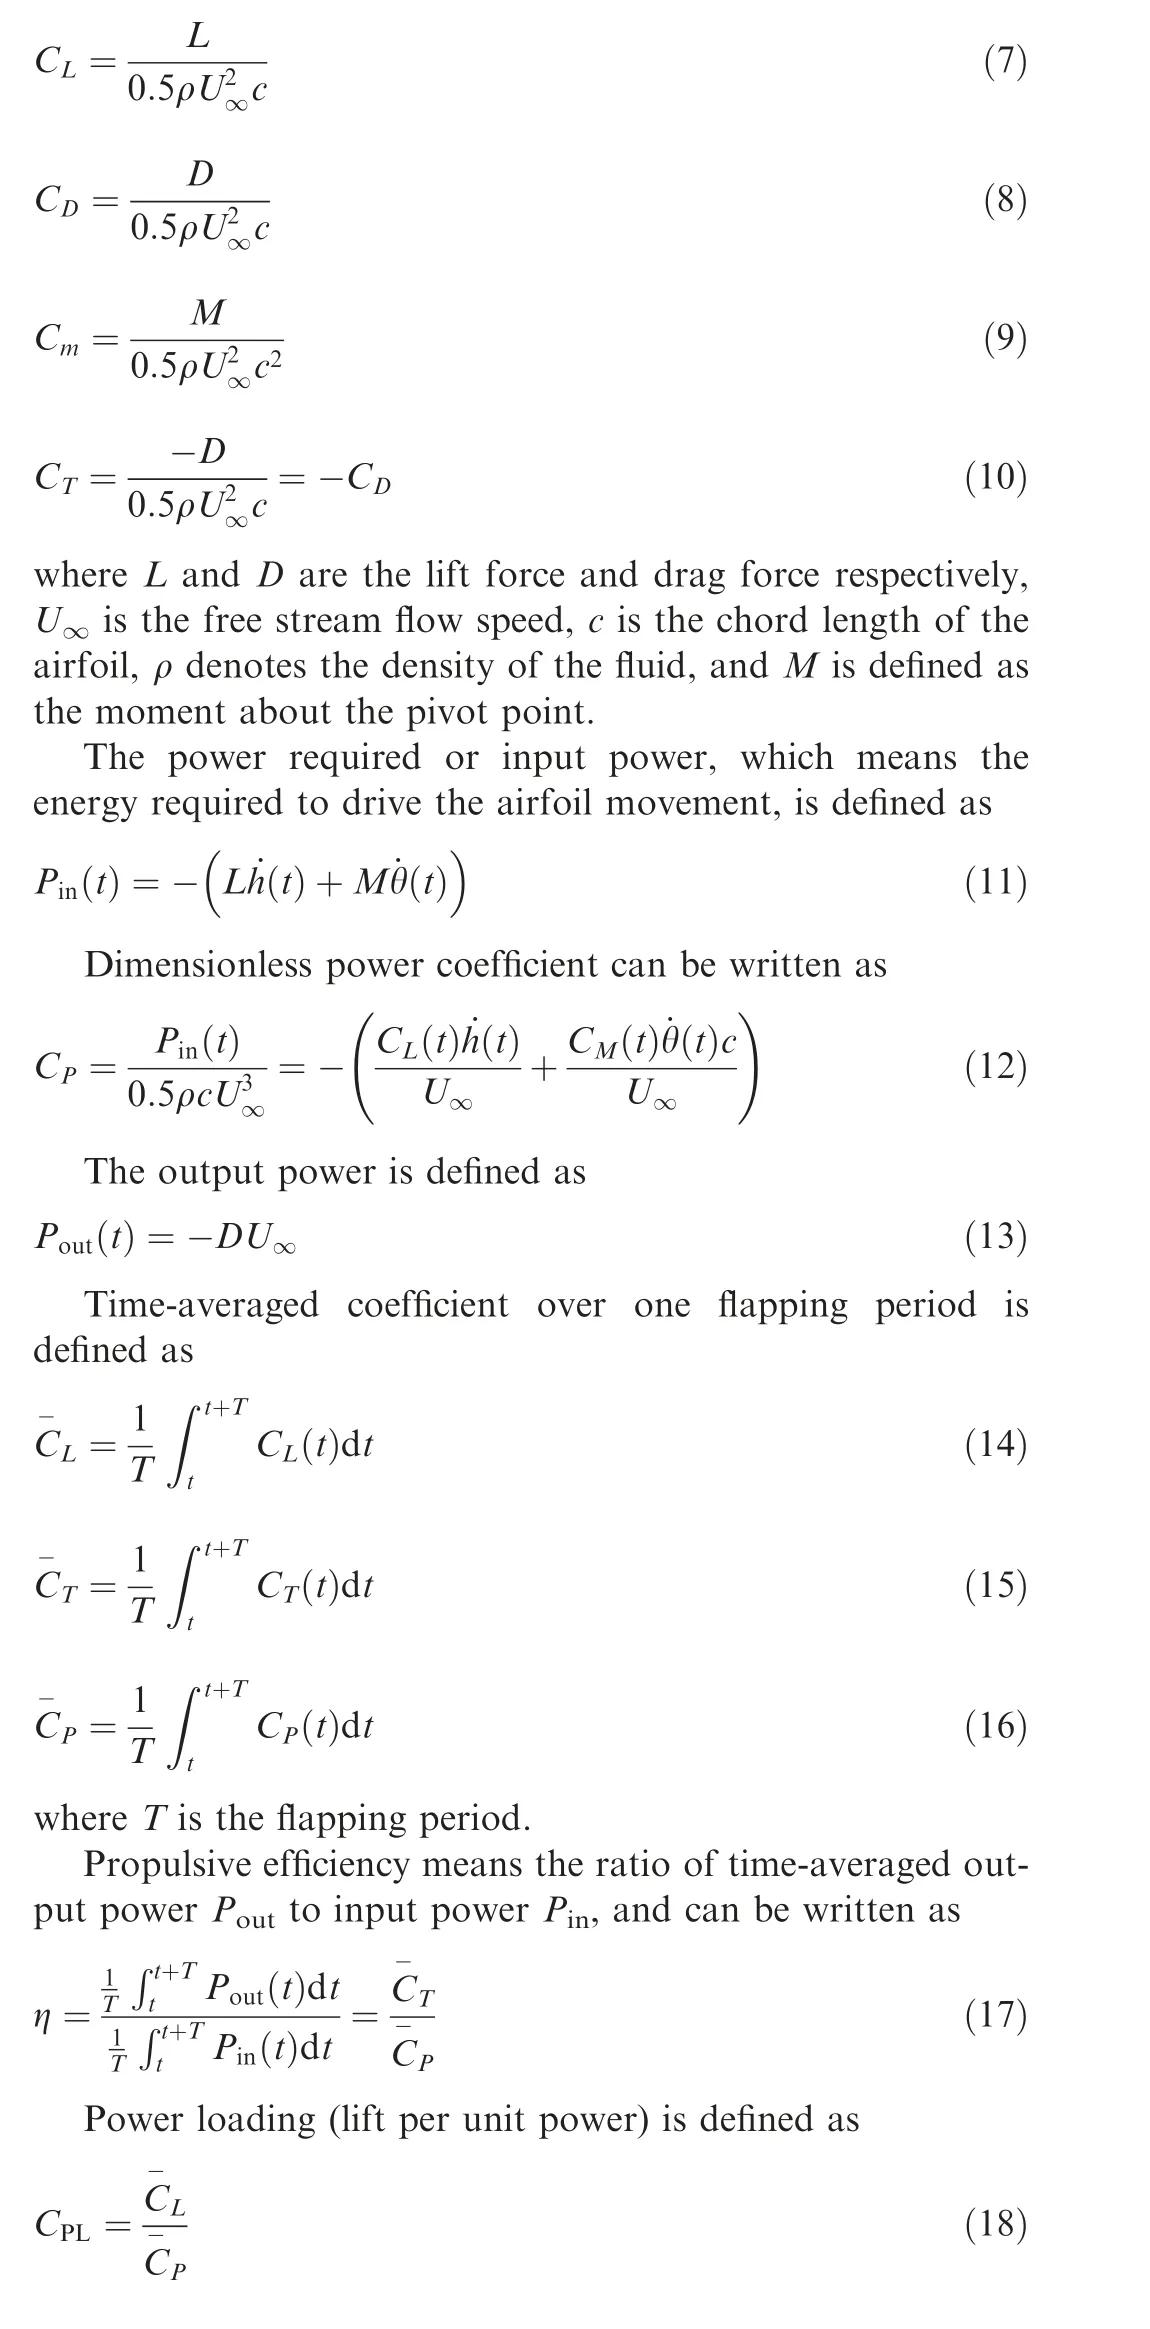
The reduced frequency k is the non-dimensional flapping frequency and is defined as

In the simulations of different flapping motions in this work, the reduced frequency k equals 0.35.
2.4. Computational methods
The transient simulations are investigated numerically using the computational fluid dynamics software Fluent by solving the Navier-Stroke equations. The motions of the flapping wings were conducted based on an overset mesh technique.The overset mesh,consisting of background mesh and component mesh, is considered to be suitable for the large-scale motion simulation. During the dynamic movement, the background mesh stays stationary, while the entire component mesh moves as a rigid body with the airfoil controlled by a User Defined Function (UDF). Consequently, the component mesh can keep high mesh quality during its movement.
The computational domain used for the overset mesh method is shown in Fig. 3. The component zone and background zone are both structure mesh with similar boundary shape. The front, upper, downstream boundaries of the component zone are 5c from the trailing edge of the airfoil. For the background zone, the front, upper and downstream are 30c,30c,and 40c respectively from the TE.The boundary condition of the inlet is velocity inlet and the outlet is pressure outlet. The boundary type of the component zone is overset. Noslip wall condition is applied to the airfoil. For all the cases in this study, the k-ω SST turbulence model is used to simulate the fully turbulent flow. Momentum, turbulent kinematic energy, and specific dissipation rate are discretized with second-order upwind scheme. Second-order accuracy is applied to calculate the pressure. The coupled algorithm is employed for the pressure-velocity coupling.
The mesh used in this section is shown in Fig. 4. Fig. 4(a)shows the final mesh assembled by a component mesh and background mesh. Fig. 4(b) is the component mesh and Fig. (c) is the mesh around the airfoil in the component zone.The first grid spacing around the airfoil is 10-5c to ensure y+<1.
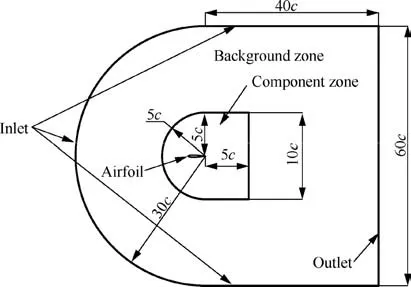
Fig.3 Computational domain schematic of overset mesh used in NACA0012 flapping airfoil simulation.
2.5. Solver validation
The present numerical research is validated with experimental and numerical data. The experiment was conducted by Lee and Gerontakos39on NACA0012 airfoil with pure pitching motion around c/4 at Re=1.35×10⁵. The Angle of Attack(AOA)of this pitching airfoil is a sinusoidal function described as

In this case, the pitch-bias angle is set to 10 degrees. The pitching amplitude is set to 15 degrees, which means the AOA ranges from -5 to 25 degrees. The freestream velocity is 14 m/s, and the reduced frequency in this case k is 0.1.
The topology of the mesh and computational domain is the same as that aforementioned in Section 2.4. The total number of the cells for the assembled mesh is around 1.4×10⁵. Four kinds of time steps were used for time step refinement, which was 600,1200,2400,4800 per period.All cases were calculated for 6 cycles and the results of the last cycle are analyzed.Fig.5 presents the results of different time steps,with the comparison between the experimental results of Lee and Gerontakos39and the numerical results of Li et al.40It can be found that, when the time step is less than T/2400, the trend of present simulations is in good agreement with the experimental39and the numerical results.40The discrepancy between present simulations and the experimental results mainly appears in the downstroke phase, particularly when AOA is greater than about 20 degrees.During that deep-stall phase,the formation and shedding of leading and trailing edge vortex appear alternately,leading to an obvious fluctuation and inaccurate calculation in the lift coefficient. Meanwhile, the turbulence model and mesh quality may also affect the uncertainty of the simulation results, which have also been discussed in previous numerical studies.40,41Furthermore, it is also difficult to accurately measure the surface pressure under complex flow structure conditions during the deep-stall phase. Nevertheless, the present results show good agreement in trend with the experimental data when the time step is less than T/2400.Thus,considering the calculation accuracy and time cost, the current time step T/2400 will be adopted in the subsequent simulations.
Besides, the overset mesh method has also been validated against a NACA0012 (c=1 m) plunge-pitch simulated by Mulder and Hoeijmakers42and Ashraf43at Re=2×10⁶.The plunging displacement(h)and pitching angle(θ)are given respectively by

In this case, h0equals c/2. θmequals 15 degrees. The phase shift between plunging and pitching is π/2. The pivoting point is c/3 from the leading edge. The reduced frequency k, in this case, is 1.0.

Fig. 4 Overset mesh system in OWL05 flapping airfoil simulation.
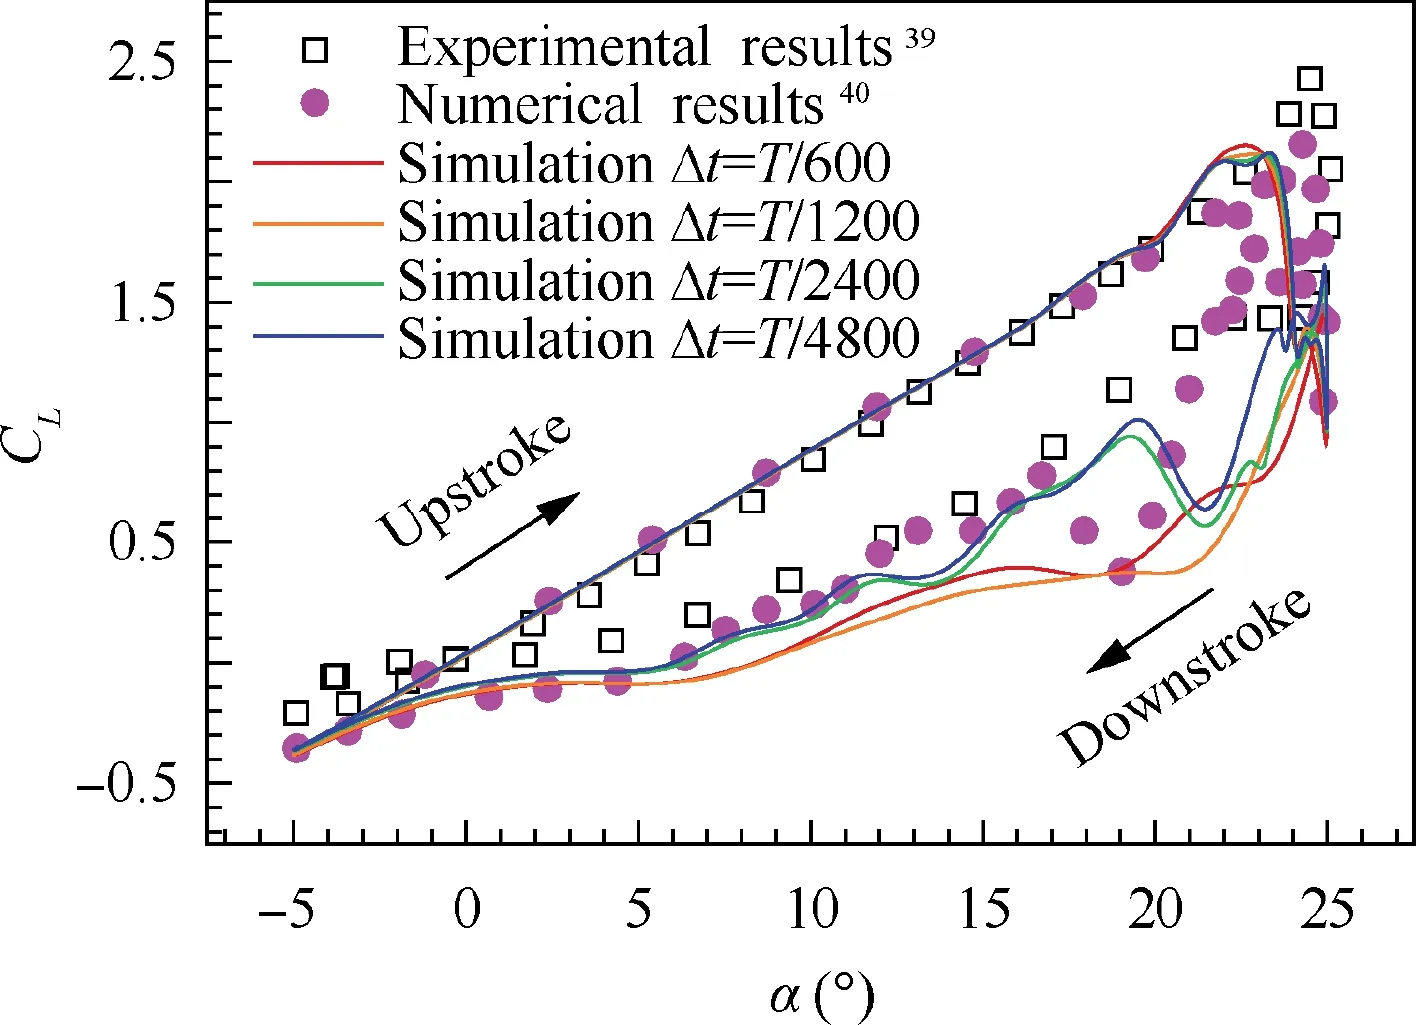
Fig. 5 Comparison of present simulation at different time-steps with experimental results39 and other numerical results.40
To eliminate the influence of mesh resolutions on the calculation results,the mesh dependence study was performed using three different mesh resolutions as shown in Table 2.All three mesh systems are in similar topology as shown in Fig. 4, and were calculated for 6 cycles with 2400 time steps per period.The results of the last two cycles are presented in Fig. 6, compared with the numerical results by Mulder and Hoeijmakers42and Ashraf.43Fig. 6(a) shows the time history of drag coefficients and Fig. (b)presents the time history of lift coefficients.As can be seen, the force coefficients of these three meshes show little difference and are in close agreement with the computational results of Mulder and Hoeijmakers42and Ashraf.43But there is still a small deviation at the valley of the drag force profile between present results and Ashraf.43Different turbulence models might contribute to this deviation, as the S-A model was used in Ashraf’s43simulation while the k-ω SST turbulence model was used in the present study. Overall, the trends in drag and lift of present simulations match well with the reference.
The results of these two validation cases indicate that medium mesh with 2400 time steps per period gives sufficient accuracy in the flapping airfoil simulations using overset mesh.Hence, medium mesh with 2400 time steps per period is selected for all subsequent simulations in this paper.

Table 2 Mesh resolution used in mesh dependence study.
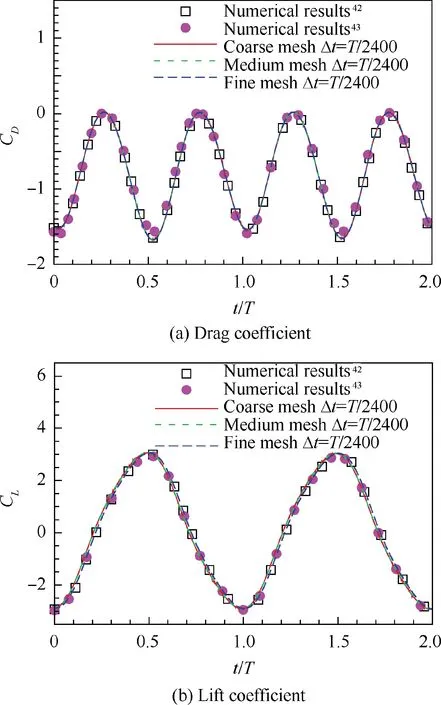
Fig. 6 Time history of drag and lift coefficient of present calculation and Refs. [42,43].
3. Results and discussion
Using the overset mesh method, nine cases were calculated to evaluate the aerodynamic performance of bio-inspired kinematics and the owl-like airfoil, which are NACA0012,NACA5506, OWL05 airfoils driven by the OM, SM and DM respectively.
Mesh systems of these nine cases are similar to the mesh aforementioned in Section 2.4. The turbulence model and numerical algorithm are the same as those used in the solver validation. All these cases were computed for six periods and the results of the last period are analyzed.
3.1. Aerodynamics coefficients
Fig. 7 presents the force coefficients of the aforementioned nine cases. Fig. 7(a) shows the time history of lift coefficient at the sixth flapping period of these cases and Fig. 7(b) shows the time history of thrust coefficient.The solid lines,dash lines and long dash lines represent results of the OM, SM and DM respectively.Gray zone in the diagram indicates that the airfoil is flapping downstroke.The other side in the light zone means that the airfoil is flapping upstroke. The black long dash line means the 0 value.
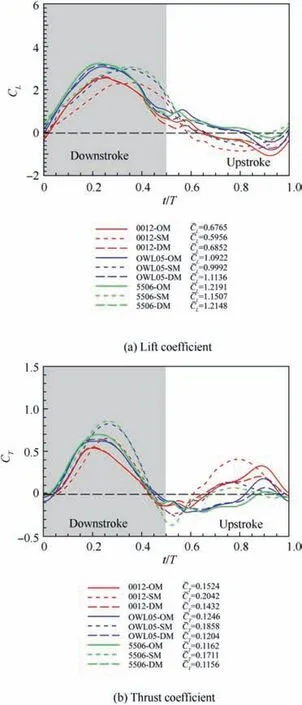
Fig.7 Time history of lift and thrust coefficients of NACA0012,OWL05, and NACA5506 under different flapping motions.
Obviously, under the same flapping motion, the lift curves of the three airfoils reach their peak values almost at the same time during both downstroke and upstroke. The same phenomenon can also be found from the time history of thrust curves.As can be seen from Fig.7(a),the variation of lift coefficient of different airfoils under the same flapping motion shows a similar trend, especially for airfoils with similar camber and thickness. The same phenomenon can be found in the variation of the thrust coefficient presented in Fig.7(b).Meanwhile, the force coefficients of OM and DM are very close to each other throughout a wide proportion of the flapping cycle.A small discrepancy can only be found near the midstroke and end of the upstroke. For NACA5506, the difference between the results of OM and DM is too small to be distinguished from the lift and thrust curves, while the time-averaged values are still different.For the lift force shown in Fig.7(a),the timeaveraged lift force of OM is much higher than that of SM.For NACA0012, the increment could reach to 13.6%. It means that the OM shows the advantage of lift generation over the SM. However, given the time-averaged thrust force shown in Fig. 7(b), the SM could generate more thrust force than the OM. For OWL05, the increment of the time-averaged thrust force reaches to 49.1%. It indicates that the simple sinusoidal motion has an advantage in thrust generation.
Considering the lift coefficient presented in Fig.7(a),the lift coefficient curves of these nine cases are asymmetric about the 0 value. Meanwhile, the positive amplitudes are greater than the negative amplitudes,as a distinct feature for positive mean lift generation. As for the three different motions, one of the most notable differences is the timing of the peaks and valleys appearing.The timing of peak and valley lift values of OM and DM is almost identical for similar kinematics of each other.For the OM and DM,the maximum lift coefficient occurs earlier than the SM and then drops quickly until the midstroke.During the upstroke phase, valleys of the OM and DM occur later than that of the SM. Meanwhile, the values at the peak and valley of the DM are almost higher than those of the OM and SM under the same airfoil.It could also be seen that,for the same airfoil,the OM and DM could keep a positive lift coefficient over a wider proportion of the flapping cycle than the SM.For the cases driven by the OM and DM,the negative lift force always occurs near the end of the upstroke. In other words,the bio-inspired flapping kinematics can reduce the negative lift production during the upstroke phase,leading to better lift performance compared with the pure sinusoidal motion.Additionally, more lift force is generated during the downstroke phase for the OM, which means that the downstroke is primarily responsible for weight support. This phenomenon can also be found in previous studies.23,24From the peak and time-averaged lift values, it seems that the DM composed of sinusoidal plunging motion and owl’s pitching motion shows optimal lift performance.
As for these three airfoils, lift performance shows similar consequences under the same flapping kinematic. That is, for the OM, NACA5506 has the highest lift coefficient peak and valley values, while NACA0012 has the lowest values at the same two positions.And the maximum CLof OWL05 is much higher than that of NACA0012 undergoing the OM but a little lower than that of NACA5506. Similar results could be found for these airfoils that applied the SM.
Focusing on the thrust coefficient presented in Fig. 7 (b),positive thrust occurs during both downstroke and upstroke,but the thrust of the two phases was not symmetrical. Meanwhile,the peak value of thrust during the downstroke is larger than that during the upstroke, indicating that more thrust force is generated during the downstroke.As for the three different motions, it is also significant that the timing of peaks and valleys appearing is different for the OM and the SM,which shows similarity in lift coefficient profile. But the peaks and valleys thrust forces of OM and DM happen almost at the same time. For the same airfoil, the SM presents higher peak values than the OM and DM in most of these cases,no matter the airfoil is in the downstroke or the upstroke.Except for the case of OWL05 that applied the SM, the peak value is a little lower than OM during the upstroke. The DM presents the lowest peak values during the upstroke and the minimum time-averaged thrust force. It can also be found that the SM could attain a more positive thrust force, especially during the upstroke phase. This means that, driven by the OM, the thrust generated during the downstroke phase occupies the main part of total thrust. Meanwhile, the thrust coefficient of the OM grows more smoothly without sharp changes,which always appear during the transition phase of the SM. Thus,from the peak and time-averaged thrust values, it can be concluded that traditional sine motion is beneficial to thrust,while the defined motion has the worst thrust performance.
With the same flapping kinematic, the difference in airfoil geometry has a noticeable effect on the force generation.Apparently, the symmetric airfoil has advantages in thrust generation compared with NACA5506 and OWL05 airfoil.From Fig. 7(b), it is obvious that the symmetric NACA0012 generates higher thrust during both downstroke and upstroke.However, the downstroke phase is the dominant phase on thrust generation for NACA5506 and OWL05 airfoil with a thin and cambered profile. In other words, the thin and cambered bird-like airfoil will induce more drag during the upstroke.
The properties of the different motions can also be seen in Table 3. The higher propulsive efficiency of SM indicates that the input energy is converted into thrust more efficiently,which makes better propulsive performance.When considering the power requirement for these three motions to drive the flapping wing, the power coefficient of OM is less compared with SM and DM for most cases. Meanwhile, a higher power loading of OM means per unit power will produce more lift during the flapping cycle. In other words, the owl motion is a quiet economical flapping motion, which could explain the saving energy behavior of birds’ flight to a certain extent.While the defined motion DM can achieve optimal lift performance,it consumes more energy and has worse propulsive performance compared with the OM.
To highlight how the flapping motion affects lift force production,the effective angle of attack of the three flapping kinematics is analyzed. As shown in Fig. 8, the effective angle of attack is defined as
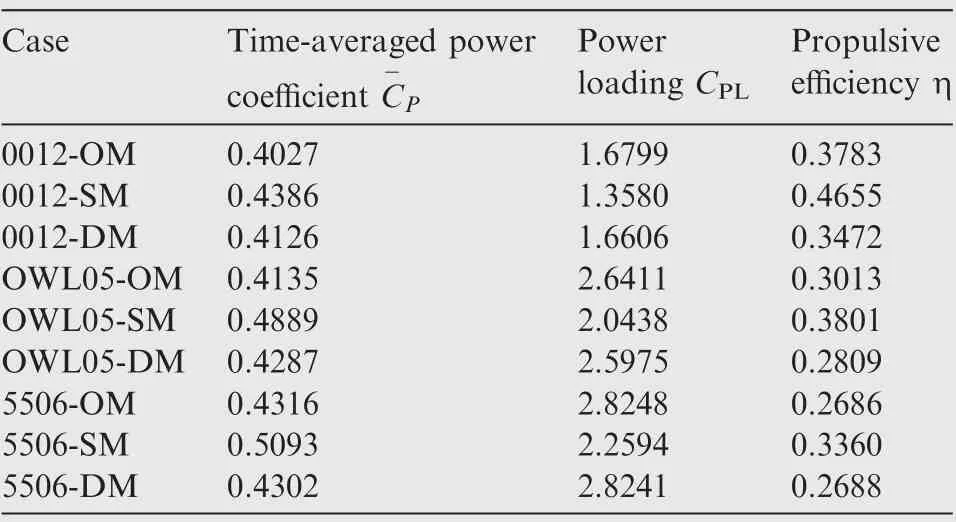
Table 3 Time-averaged power coefficient, power loading and propulsive efficiency of different cases.

Fig. 9 presents the time history of the lift coefficient of OWL05 and the effective angle of attack under the three motions. Noteworthy, the effective angle of attack of OM and DM are almost identical throughout the flapping cycle.However, the lift force of OM and DM is still slightly different, especially near the midstroke and end of the upstroke.During the downstroke, the lift of OM increases rapidly to the maximum value, with a similar trend of the effective angle of attack of OM. Meanwhile, the lift and the effective angle of attack of OM reach the maximum value almost at the same time. The same phenomenon can also be seen for the DM. For the SM, the peak lift coefficient occurs a little later than the effective angle of attack. Besides, the peak lift coefficient of OM is a little higher than that of SM, which might be attributed to the higher effective angle of attack for OM. As the airfoil passes through the intermediate position and moves towards the lowest point, the effective angle of attack for SM decreases more gradually, and the magnitude comes to be higher than that for OM. Meanwhile, a higher lift force for SM could be seen in the same phase.When t/T is greater than 0.4, the difference of lift force between OM and DM seems to be more noticeable. A small transient lift peak appears right after t/T=0.55, which is also the time when the effective angle of attack of OM and DM starts to remain a constant value. When t/T is greater than 0.6, the effective angle of attack for OM turns to be higher than the SM, and the lift force for OM starts to be higher again. Near the end of the upstroke, the lift force of OM turns to be lower than that of SM and the effective angle of attack presents the same situation. Therefore, it can be found that there is a close relationship between the effective angle of attack and lift force production. While the lift force and the effective angle of attack go basically the same trend,there are still some differences at some time instants, especially for the OM and DM. The vortices development and shedding might contribute to these differences and the lift fluctuation. In other words, the aerodynamic force did not solely depend on the effective angle of attack, but was significantly influenced by the flow structure.44The same phenomenon can also be seen from the investigation by Meng et al.45Therefore, it is necessary to analyze the effects of flow field structure on lift generation.
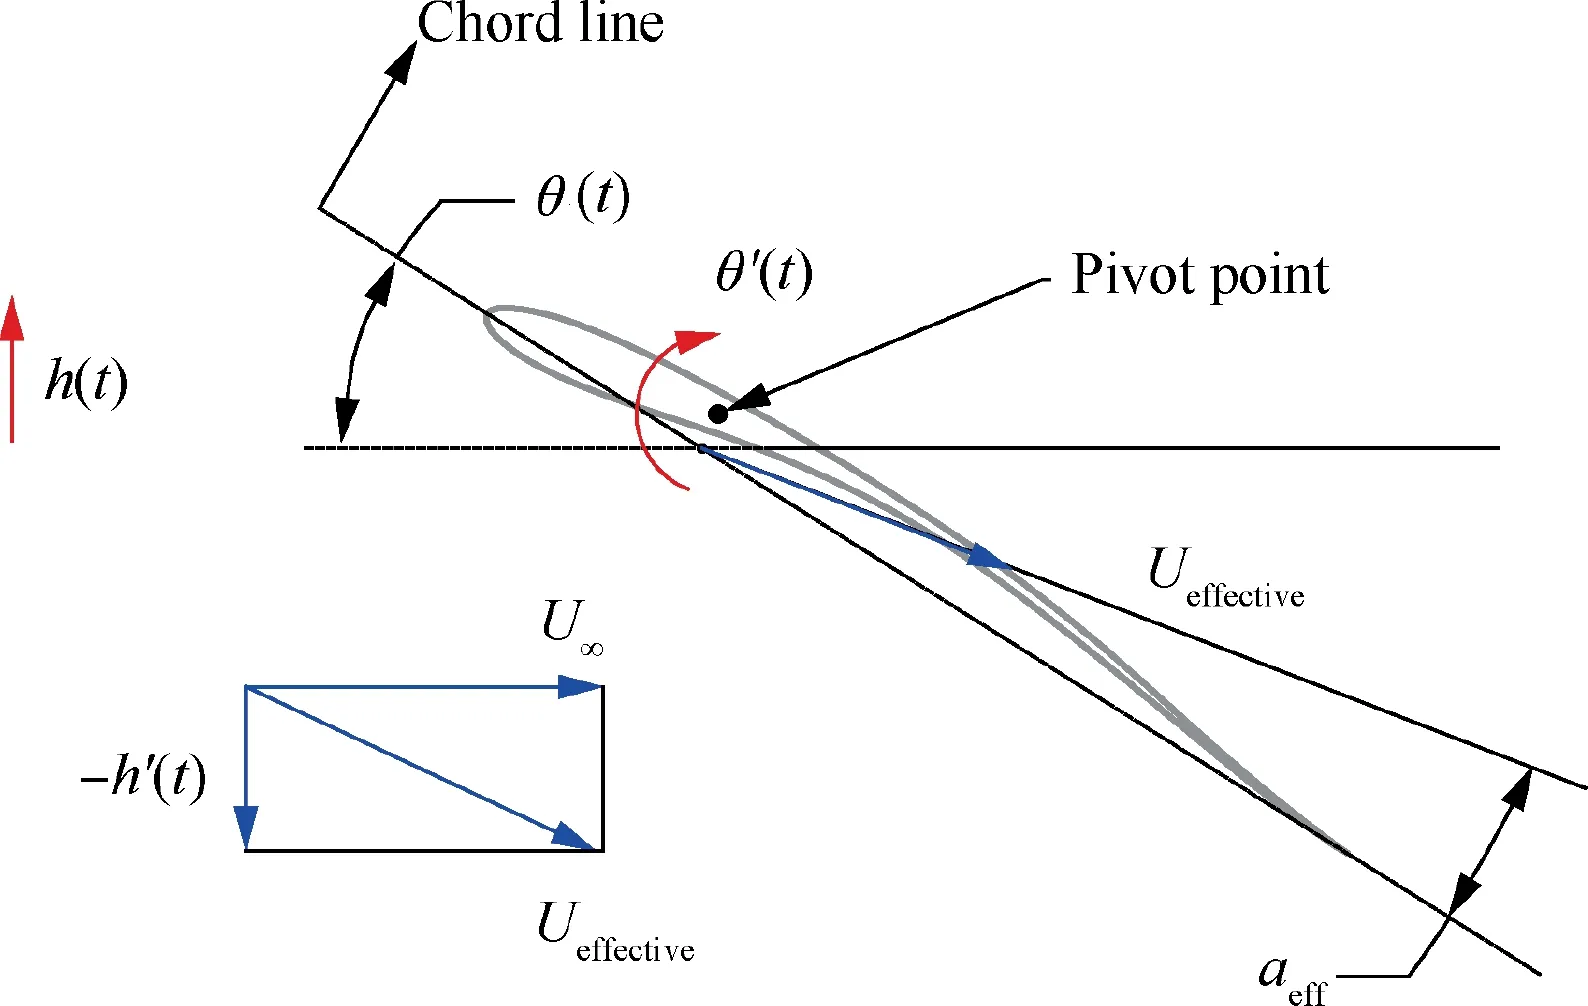
Fig. 8 Schematic diagram of effective angle of attack.
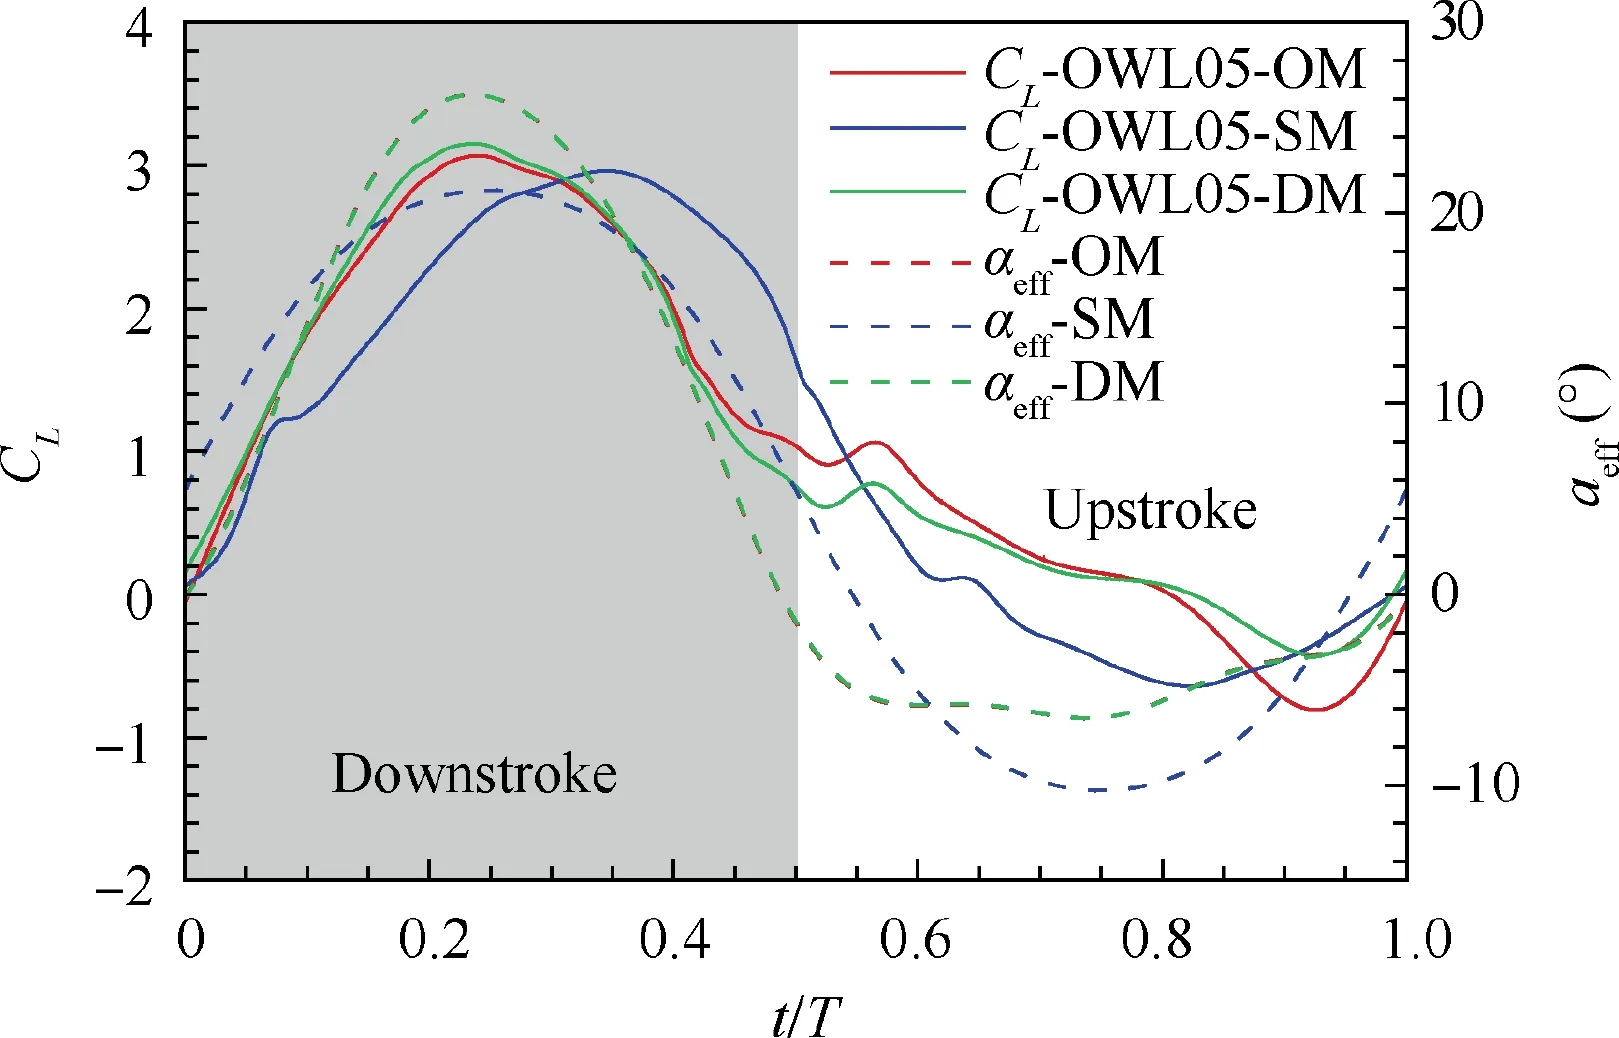
Fig. 9 Time history of lift coefficient of OWL05 and effective angle of attack under different flapping motions.
3.2. Flow structures
The instantaneous vorticity contours of OWL05 driven by the OM, SM and DM respectively are presented in Fig. 10.Dimensionless vorticity ω* is scaled by U∞/c, which means ω*=ωzc/U∞. Four different moments in one flapping cycle of the three different motions are selected to analyze the vorticity field. It can be seen that the flow field of SM is significantly different from that of OM and DM, while the flow field of OM and DM looks very similar. Only during the upstroke phase, the differences in flow structures for OM and DM are obvious by referring to Fig.10(c)and(d),as well as the lift force at the same phase.
As the airfoil moves downward, the shear layer formed at the leading edge rapidly rolls up into the leading edge vortex on the upper side of the airfoil. With the feeding of the shear layer, the LEV grows in both size and strength and continues to travel downstream.As the airfoil arrives at the intermediate position (Fig. 10(a)), an obvious LEV could be seen on the upper side near the leading edge. The size of LEV formed by the OM is clearly larger than that of the SM. A larger LEV induces a higher peak suction force at the corresponding position on the airfoil’s upper surface, as shown in Fig. 11(a),which gives the pressure coefficient Cpdistributions of the OWL05 at t/T=0.25.By referring to the lift curves presented in Fig.7(a),a close relationship can also be found between the development of the LEV and the fluid dynamic force exerted on the airfoil. From Fig. 7(a), at t/T=0.25, the lift of OWL05 with the OM is slightly larger than that of OWL05 with the SM, which means that the larger LEV formed by the OM induced more lift at this moment.Meanwhile,an anticlockwise rotating secondary vortex characterized by lambda shape is formed beneath the LEV on the upper surface when the OWL05 applied the OM, with a small peak suction force appearing near 0.15c on the upper surface by looking at Fig. 11(a). However, a similar secondary vortex can be barely found on the upper side of OWL05 that employed the SM at this moment.
When the airfoil reaches the lowest point at t/T=0.5,LEV formed by the OM has shed from the upper surface and starts to merge with trailing edge vortex, illustrated in Fig. 10 (b).However, the LEV of OWL05 that employed the SM is just beginning to break off the airfoil at this moment. This phenomenon that the LEV sheds and moves away from the airfoil will lead to the drop in the lift presented in Fig.7(a).The timing that the LEV separates from the upper surface is different,leading to a discrepancy of the moment that the peak lift force appears. As shown in Fig. 10(b), the LEV formed by the OM separates earlier than the LEV formed by the SM, which makes the maximum lift generated by the OM occur a little earlier. Different vortex structures at this moment contribute to the discrepancy of lift. The LEV on the NACA0012, which still remains on the upper surface, offers a wider region and lower suction force and a higher lift force. Additionally,although the flow fields of OM and DM are very similar, the small difference in pressure coefficient distribution leads to the discrepancy in lift force.
When OWL05 moves upward to the intermediate position presented in Fig. 10(c), the SM yields a slightly larger LEV on the lower surface of the airfoil, leading to a higher suction force at the corresponding position presented in Fig. 11(c).This might be the reason for a lower lift force generated by the SM during the upstroke, as the LEV on the airfoil’s lower surface might induce a low-pressure region and produce a negative lift force. The pressure coefficient distributions of OM and DM at t/T=0.75 shown in Fig. 11(c) look very similar,which account for a comparable lift force at that moment.
At the instant t/T=1.0 shown in Fig. 10(d), the LEV formed by the SM is already separated by the lambdashaped secondary vortex and starts shedding from the lower surface. This shedding LEV, which has moved to the trailing edge along the lower surface, creates a significant lowpressure zone. Referring to Fig. 7(a), the LEV generated by the SM on the lower surface separated earlier, resulting in an earlier negative lift peak during the upstroke. However, the LEV formed by the OM beneath the airfoil is just rolling up,and a lower pressure zone induced by this LEV generates more negative lift force compared with the DM. The LEV of DM seems to have been separated already, and the structure of LEV looks very similar to that of LEV at t/T=0.75.This similarity can also be seen in the pressure coefficient distributions at these two moments by looking at Fig. 11(c) and Fig. 11(d).
Fig. 12 gives a close-up view of the vorticity field around these three airfoils under different motions at the moment when they reach peak lift values. As can be seen from Fig. 7(a),under the same flapping motion,the timing of the peak lift force appearing for three different airfoils is comparable. In other words,the effective angles of attack of these three airfoils are almost identical under the same flapping motion. The differences between the flow field and the maximum lift force might be attributed to the differences in airfoil shapes. Additionally, the flow field for the same airfoil that applied OM and DM seems very similar in Fig. 12, as well as the pressure coefficient distributions shown in Fig. 13.
For the OM, it is obvious that the vorticity contours of these airfoils show a similar structure. A strong clockwise LEV could be seen on the upper surface of the airfoil, accompanied by the lambda-shaped secondary vorticity beneath the LEV. This counterclockwise secondary vortex tends to split the LEV into two parts, leading the LEV to break up and move downstream. The mechanism for the LEV detachment of the OM might be the boundary layer eruption illustrated by Widmann and Tropea.46As the secondary vortex induced by the LEV gradually grows to be strong enough, the feeding of the LEV from the boundary layer is blocked. When no more fluid can be accumulated from the boundary layer,the LEV detaches from the airfoil eventually, accompanied by a steep drop in lift force. It is also obvious that the size and strength of the LEV on NACA5506 are stronger than those of the other two airfoils. A stronger LEV induces a higher peak suction force near the leading edge by referring to Fig. 13(c), which might account for a higher peak lift coefficient of NACA5506.
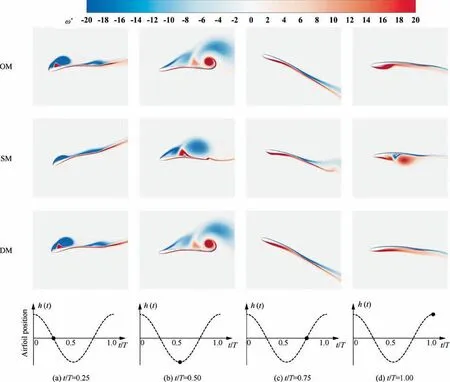
Fig. 10 Vorticity contour of OWL05 with two motions at different time.
For the SM,a larger-scale LEV is shown on the upper surface of these airfoils, while the strength is not as strong as the LEV generated by the OM.Besides,the vortex structure on the upper surface of the airfoil is different from that formed by the OM at the moment of maximum lift force. A small secondary vortex can be seen beneath the LEV on the upper side of NACA0012 and OWL05. However, there is no obvious sign that the leading edge vortex here is severed by the secondary vortex, and even the secondary vortex structure is not seen on the upper surface of NACA5506. This phenomenon suggests that, for the SM, the mechanism of the LEV shedding may be different from the boundary layer eruption. Furthermore, the LEV on the surface of NACA5506 has moved close to the trailing edge, while the LEV on the NACA0012 and OWL05 has only developed to the middle of the airfoil.Among these three cases for the SM, NACA5506 presents the highest peak lift value, and this might relate to the largest size of LEV on the upper surface of NACA5506. As can be seen from Fig. 13, the magnitude of peak suction force of NACA5506 is the lowest among the three airfoils under SM.However, the largest size of LEV forms the widest lowpressure region on the upper side of the NACA5506, leading to the highest peak lift value. Therefore, one can find that the maximum lift is related to both the strength and size of the LEV.
In general,the LEV growth and detachment process is similar by looking at Figs. 10 and 12, but the influence of airfoil shape on aerodynamic force and flow structure cannot be neglected. As shown in Fig. 1, NACA0012 is a thicker airfoil with a rounder nose.The thickness and camber of NACA5506 are similar to that of OWL05,but NACA5506 has the sharpest leading edge.Under the same flapping motion,the thicker airfoil NACA0012 has better propulsive performance as can be seen in Fig.7 and Table 3.This phenomenon is consistent with the previous studies.32,47The camber is beneficial to lift generation,which is consistent with the phenomenon in steady aerodynamics. Furthermore, the shape of the leading edge will significantly affect the process of transition of the LEV.33For NACA5506 with a sharper leading edge,the LEV rolls up faster and the strength is stronger compared with the LEV formed by a rounder leading edge. A higher growth rate of LEV formed by a sharper leading edge can be reflected by the trend of lift force presented in Fig. 7(a), that is, the lift force of a sharper profile grows more quickly until the peak value.Meanwhile,the timing of the peak lift force for a sharper profile happens slightly earlier.For example,under the DM,the peak lift value for NACA5506 occurs at t/T=0.2257.For OWL05 and NACA0012,the peak lift value occurs at t/T=0.2357,0.2527 respectively.
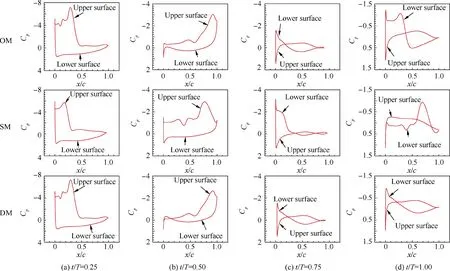
Fig. 11 Pressure coefficient distributions of OWL05 with three motions at different time.
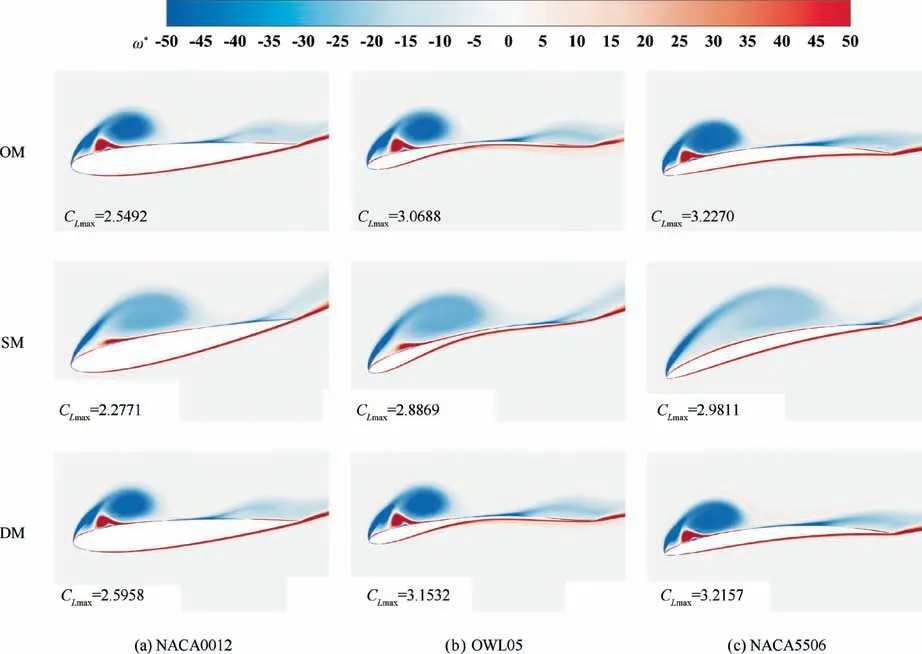
Fig. 12 A close-up view of vorticity contours around airfoils at the moment of maximum lift coefficient for each case.
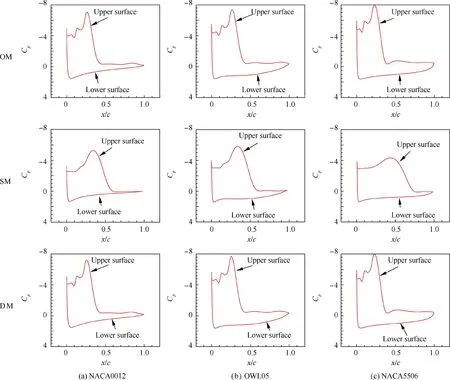
Fig. 13 Pressure coefficient distributions of airfoils at the moment of maximum lift coefficient for each case.
As mentioned above, airfoils with the same flapping motion reach the maximum lift at almost the same time by looking at Fig. 7. At that moment, the effective angle of attack of the airfoils with the same motion is almost the same value. For the OM and DM, the peak lift value occurs around t/T=0.23. For the SM, the peak lift value reaches near t/T=0.35. Referring to the time history of the effective angle of attack presented in Fig. 9, the effective angle of attack of OM and DM is about 26 degrees at t/T=0.23,and the effective angle of attack of the SM is about 19 degrees at t/T=0.35. It can be seen in Fig. 12 that, for the same airfoil, the OM could induce a stronger LEV and an obvious secondary vortex under a larger effective angle of attack. But the size of the LEV induced by the OM is smaller than that induced by the SM. Given the magnitude of the maximum lift of each case, one can find that the strength of the LEV has a greater impact on the lift force.However, a stronger LEV may induce the secondary vortex,which leads to the LEV breakup earlier, and the lift coefficient decreases earlier and quickly.
4. Conclusions
In this paper,a transient numerical method based on the overset mesh technique is used to assess the aerodynamic characteristics of an owl-like airfoil named OWL05 undergoing a bioinspired flapping motion named OM (owl motion). Additionally, a pure sinusoidal motion named SM (sine motion) with the same flapping amplitude and a new defined motion(DM) composed of plunging motion of SM and pitching motion of OM are also considered. And other two airfoils,NACA0012 and NACA5506, are also selected to evaluate the advantages of the owl-like airfoil. The following conclusions are drawn from the study:
(1) The bio-inspired kinematics OM has an obvious advantage in lift generation.For the OM,the presence of a positive lift force can be found over a larger proportion of the flappingcycle,andthepeakliftvalueismuchhigherduring the downstroke,which means that more lift is generated during the downstroke phase.The time-averaged lift force andpowerloadingofOMarealsosuperior.TheSMhasan advantage in thrust generation.For the SM,the propulsionefficiencyismuchgreater,andhigherpeakthrustforce can be seen in both upstroke and downstroke.In contrast,the downstroke phase is the dominant phase of thrust generationfortheOM.Nevertheless,thetime-averagedpower coefficient of the OM is less than that of the SM, which means that the bio-inspired flapping motion is a saving energy movement.The DM owns the optimal lift performance, but it consumes more energy and has a worse propulsive performance compared with the OM.
(2) The higher camber owl-like airfoil OWL05 generates higher peak lift and time-averaged lift than the symmetrical NACA0012 in the flapping cycle. While OWL05 can generate a higher thrust peak in the downstroke,larger drag force during the upstroke results in a lower time-averaged thrust than NACA0012. With a similar thickness and camber as OWL05,NACA5506 has better lift performance over the flapping cycle and higher peak thrust in the downstroke than OWL05.But the motions of NACA5506 consume more energy than those of OWL05. For NACA5506 with a sharper leading edge,the LEV rolls up faster and the strength is stronger compared with the LEV formed by OWL05 and NACA0012 with rounder leading edge.
(3) The flow field around the airfoil has an obvious impact on the lift force.The flow structures around airfoil under OM and DM are comparable for similar kinematics.The bioinspired OM induces an LEV earlier,leading to the occurrenceofpeakliftforceearlierinthecycle.TheLEVformed by the OM is stronger than that formed by the SM but its size is slightly smaller. However, a stronger LEV will induce a secondary vortex,which will sever the LEV and cause the lift to drop rapidly.
Declaration of Competing Interest
The authors declare that they have no known competing financial interests or personal relationships that could have appeared to influence the work reported in this paper.
Acknowledgements
This study was supported by the National Natural Science Foundation of China (No. 11872314 and U1613227), the China Scholarship Council, Key R&D Program in Shaanxi Province of China (No. 2020GY-154) and Natural Science Basic Research Plan in Shaanxi Province of China (No.2019JQ-394).
 CHINESE JOURNAL OF AERONAUTICS2021年5期
- CHINESE JOURNAL OF AERONAUTICS的其它文章
- Ferrofluid moving thin films for active flow control
- Preliminary study on heat flux measurement data of TT-0 flight test
- An analysis and enhanced proposal of atmospheric boundary layer wind modelling techniques for automation of air traffic management
- Jet sweeping angle control by fluidic oscillators with master-slave designs
- Hot deformation behavior and microstructure evolution of the laser solid formed TC4 titanium alloy
- Electrochemical trepanning with an auxiliary electrode
