Wing optimization of propeller aircraft based on actuator disc method
Yifei ZHANG, Haixin CHEN, Yufei ZHANG
School of Aerospace Engineering, Tsinghua University, Beijing 100084, China
KEYWORDS Propeller;Actuators;Optimization;Aerodynamics;Aircraft wings
Abstract Propeller aircraft are widely used in general aviation.The rotating propeller has a strong effect on the aerodynamic performance of the wing. This paper uses an actuator disc to model the effect of the propeller. A wing optimization method is developed with the actuator disc method.Several wing optimizations with different slipstream settings are studied.The twist angle and airfoils of the wing are used as the design variables.The results show that the propeller slipstream and slipstream directions have a strong influence on the optimization process. Powered-on optimization with a slipstream can obtain better drag reduction results than unpowered optimization. The drag decomposition results show that most of the drag reduction comes from the form drag reduction.The symmetric ‘‘inboard-up” slipstream configuration is found to have the highest lift-to-drag ratios, which are 18.87 for the twist angle optimization and 19.15 for the airfoil optimization.
1. Introduction
Propeller aircraft have a short take-off distance, a large maximum take-off weight and a long range.According to the statistical data of the Federal Aviation Administration, propeller aircraft accounted for 71% of the general aviation market share in 2019.
Numerical simulation of a powered-on propeller aircraft often requires enormous computational resources because the propeller flow is strongly unsteady.Consequently,it is difficult to introduce power into the aerodynamic design of a propeller aircraft. Usually, there are two steps when designing a typical propeller wing. The first is the design without power, and the second is validation with power. There have been many aerodynamic studies on propeller aircraft that do not consider power. For example, Santosdesigned a new turboprop aircraft based on Q400. However, the propeller slipstream was not considered in the design process; consequently, error was reported when calculating the fuel cost and flight range.Wang et al.redesigned the nacelle and high lift system of a propeller aircraft without the propeller slipstream. Since the propeller slipstream affects the high-lift system, their design did not achieve the requirements of the take-off configuration in wind tunnel tests. Vecchia et al.optimized the fuselage and wing of a new regional turboprop aircraft to avoid flow separations without a slipstream. Zhang et al.designed a propeller aircraft based on Piaggio Avanti without a slipstream.
However, there is a large difference between a jet aircraft and a propeller aircraft. The propeller generates a slipstream during flight. The slipstream causes complex aerodynamic interference with the fuselage,wing and tail.This phenomenon makes performance prediction and aerodynamic design difficult. Qiu et al.demonstrated that the propeller slipstream can cause flow separation at the wing-nacelle joint area. Xie and Yefound that the propeller slipstream can change the sucking peak of the aircraft and reduce profile drag. Wangand Lireported that the strong interaction of propeller slipstream and downstream components can influence the performance of the propulsion system. Marinusand Xiaoet al.reported that the slipstream direction affects the aerodynamic performance and changes the lift and drag.Since the propeller slipstream is important to the aerodynamic performance, it is necessary to design propeller aircraft with the slipstream.
Xu et al.used a Kriging surrogate model for wing optimization,and the lift-to-drag ratio was increased by 3%.They found that the wing designed with a slipstream has lower drag than the original wing designed unpowered.Mahieustudied the propeller performance of an aircraft and validated it with different slipstream settings. He reported that the slipstream direction changed the wingload distribution and affected the induced drag. Epamafound that the twist angle and chord distribution of a wing can be modified to adjust the propeller slipstream to reduce drag when optimizing a propeller wing under a slipstream.
The propeller slipstream has a strong influence on the aerodynamic performance of an aircraft. However, only a few researchers have considered the power effect in numerical optimization. If the slipstream effect is ignored, the design cannot be optimal under powered-on conditions. It is necessary to consider the slipstream effect in the design process of a propeller aircraft to explore the aerodynamic performance boundary and further increase the cruise efficiency, which is a focus of this paper.
There are three kinds of numerical methods for considering the effect of the propeller slipstream:(A)the unsteady method,(B) quasi-steady method, and (C) actuator disc method. The unsteady method usually uses a multicoordinate system to directly simulate the propeller rotation,which is the most accurate and time-consuming method. The quasi-steady method applies a multireference frame,but the phase angle of the propeller is fixed, so it is relatively computationally efficient. Yu et al.studied the aeroacoustics and aerodynamic characteristics of propeller blades using both unsteady and quasi-steady method,the results were good,but the computational cost was tremendous. The actuator disc method is an alternative method of simulating the thrust and slipstream effects of the propeller. It is the most efficient method for considering the propeller effect.
There are three different actuator disc methods:momentum theory, propeller vortex theory, and blade element theory.Momentum theory simplifies the propeller as a disc with no thickness,and a pressure increment is applied through the disc.The rotation of the slipstream can also be added to the disc.Farrar and Agrwalanalyzed the aerodynamic performance of an open rotor engine by a momentum theory actuator disc,and the model was in good agreement with the experimental data. Yang et al.studied propeller-induced ground vortices by the actuator disc method, and the flow field was in good agreement with the experiment. The vortex theory treats the propeller as a series of vortices. It is also called the propeller strip vortex theory. The blade element theory regards the blade as a series of local airfoils at different radial positions on a propeller. These airfoils are called blade elements. The thrust and torque can be obtained by integrating the forces on all the blade elements. The blade element theory can directly simulate the load distribution of a propeller, so it is suitable in most circumstances. Morgado et al.validated the effectiveness of the blade element theory for the optimization of a propeller. Sun et al.demonstrated that the blade element theory is beneficial for aeroelastic analysis and blade design.Wilkinson et al.replaced the load distribution generated by blade elements with an empirical formula, and the results showed that the method is efficient at low flow rates.With the development of computer technology, researchers can apply more accurate Computational Fluid Dynamics(CFD) calculations to replace the blade elements, while the basic idea still comes from the blade element method. This method is a kind of blade element theory and is called the‘‘fitting actuator disc method”or‘‘CFD actuator disc method”.The idea is to calculate an isolated propeller in advance,obtain the flow parameters and apply the flow parameters across the propeller with an actuator disc. Fitting an actuator disc can simulate three-dimensional flow more accurately.It is also able to simulate the interference between the propeller slipstream and other components.Sanchez et al.studied wind turbines by both the CFD actuator disc method and sliding mesh method. Both methods matched well; however, the actuator disc method was 10 times faster than the sliding mesh method.Wangand Jiangdemonstrated the effectiveness of the actuator disc method at a large angle of attack. Zhang et al.2reported that the CFD actuator can be used to predict flow separations and aerodynamic performance of the tail.Barakos et al.proved that CFD actuator also works for unsteady helicopter flows. Above all, the CFD actuator disc method is easily combined with a CFD solver, and the accuracy is satisfactory.
In this paper,the CFD actuator disc methodis applied in the optimization. The method is first validated by two cases with experimental data.Then,a wing is numerically optimized under the influence of the propeller slipstream. Several optimization cases with different slipstream settings are studied.The results show that both the twist angle and airfoil geometries are affected by the slipstream and can be optimized to adapt the slipstream setting for drag reduction. The existence of the slipstream and the rotation direction are illustrated and have a great influence on the wing optimization result.
2. Actuator disc method and validation
2.1. CFD actuator disc method
The CFD actuator disc modelis applied in this paper. Two of the most important parameters of a propeller are the advance ratio J and thrust coefficient T, as shown in Eqs.(1) and (2). The advance ratio represents the dimensionless propeller rotational speed, and the thrust coefficient is the dimensionless propeller thrust.

where Vis the far-field velocity, n is the blade number, D is the blade diameter, T is the thrust, qis the dynamic pressure, and S is the reference area.
Because propeller aircraft usually fly under subsonic flow conditions, the density variation across the actuator disc is not significant. Because of mass conservation, the axial velocity is unchanged across the actuator disc. Consequently, the slipstream can be simplified as a velocity change across the actuator disc, and the thrust can be simplified as a pressure change across the actuator disc, as shown in:

where r is the local radius,Aand Bare dimensionless polynomial coefficients,k is the order of the polynomial,ΔVis the circumferential velocity change,and Δp is the pressure change.First, an isolated propeller is computed by the CFD method.Then,the velocity change and pressure change across the propeller are obtained through postprocessing of the CFD.A series of polynomials that vary with the radius are used to describe the velocity change and pressure change, as shown in Eqs.(3)and(4).Aand Bcan be obtained by fitting the data from the CFD result of the propeller. Then, the two coefficients are applied to the actuator disc model.
2.2. AGARD model verification
The AGARD (Advisory Group for Aerospace Research &Development) modelis selected as the validation case of the actuator disc method. The experiment was conducted by the Aeronautical Research Institute of Sweden in 1987. The model has a rectangular wing generated by a symmetrical airfoil.The rotor is named R243,and the diameter is 0.64 m.The model has been widely used by many researchers to validate slipstream calculations. However, the detailed propeller geometry of R243 is not available. A similar propeller R212 is used for computation according to Refs..
The computation settings are as follows: angle of attack α=0, propeller rotation speed n=6650r/min, incoming Mach number Ma=0.15, and Reynolds number Re=1.7×10. The Shear Stress Transport (SST) model is used for the closure of the Reynolds stresses. The Lower-Upper Symmetric Gauss-Seidel (LU-SGS) is applied as the time advancing method.Roe’s method is used as the Riemann solver, and the Monotonic Upwind Scheme for Conservation Laws (MUSCAL) method is used as the reconstruction scheme. The actuator disc method is developed based on the in-house code NSAWET.
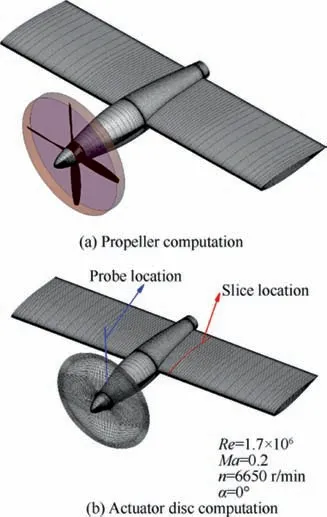
Fig. 1 AGARD model
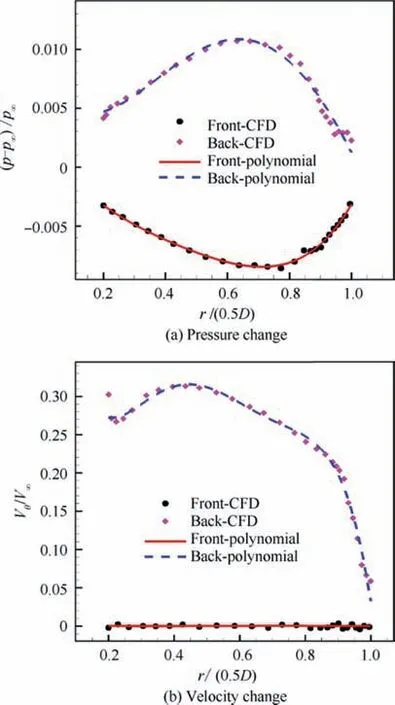
Fig. 2 Slipstream parameter changes across actuator disc(AGARD)
A propeller with a wing is first tested to obtain the pressure and velocity changes across the propeller, as shown in Fig.1(a). The sliding mesh method is used in the propeller region,and the sliding boundaries are shown in Fig.1(a). The propeller rotation region has 1.6×10grid cells, and the stationary flow domain has 2×10grid cells. The flow quantities before and after the propeller are shown in Fig. 2. The data are circumferentially averaged. It is clear that the pressure and velocity are significantly increased across the propeller region. The 4th-order polynomials are used to fit the pressure and velocity.The pressure and velocity changes across the propeller region can be derived by‘‘back-polynomial”subtracting‘‘front-polynomial”, as shown in Eqs. (5) and (6). Then, the pressure and velocity changes are applied as the boundary conditions of the actuator disc in the CFD computation,as shown in Fig.1(b). The total grid cell number of the actuator disc computation is 3×10. The results of the actuator model and propeller are compared with the experimental data. The results are shown in Fig.3, and the corresponding probe and slice locations are shown in Fig.1(b). The swirl angle in Fig.3(a)is defined as the angle between the slipstream direction and the inflow direction. The swirl angle in the figure is extracted from the location of the 6.4% diameter downstream of the propeller. The present result is better than the MGAERO result in Ref. 35. The actuator disc result, sliding mesh result and experimental data are consistent with each other except in the propeller hub region. This deviation might be caused by different propeller geometries. The experiment applies the R243 propeller, while the present actuator uses R212. Fig.3(b) shows the pressure coefficient Cin a slice at 27.7% of the diameter to the left of the propeller install location, where Xis the dimensionless chordwise position. The pressure distribution of the wing behind the slipstream matches that of the experiment well. Consequently, the actuator disc model is satisfactory. Compared to the sliding mesh calculation, the actuator disc method uses only 10% of the computational time while maintaining the accuracy.
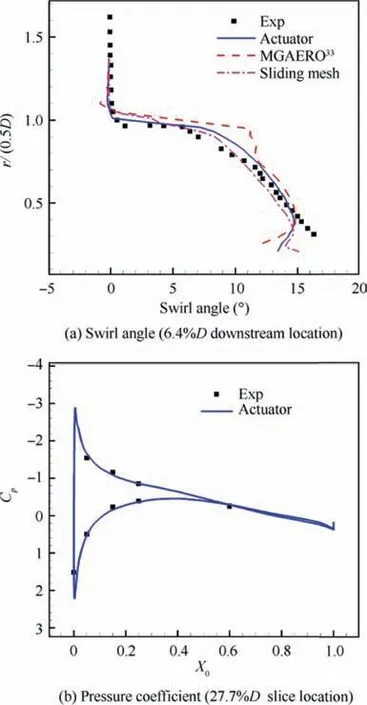
Fig. 3 Comparison of sliding mesh and actuator disc results

2.3. Turboprop aircraft validation
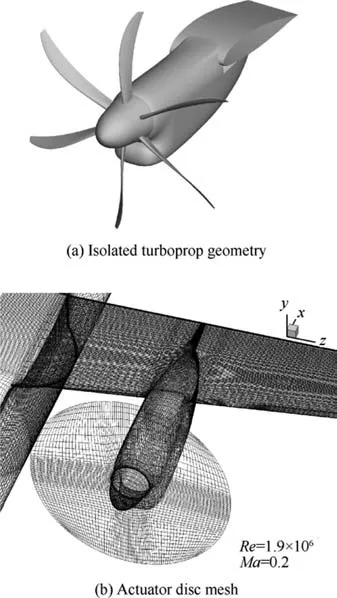
Fig. 4 Geometry and mesh of turboprop aircraft
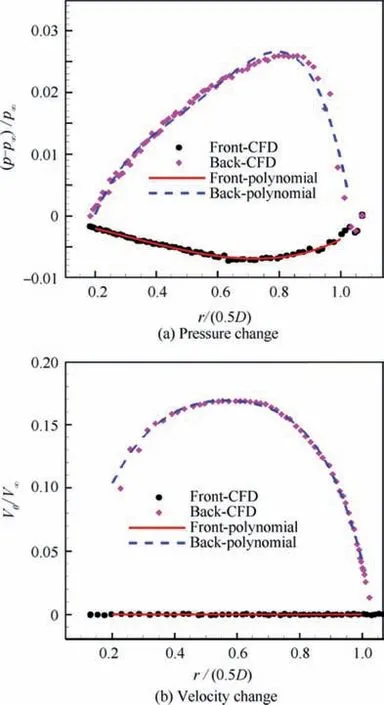
Fig. 5 Slipstream parameter changes across actuator disc(Turboprop, Ma=0.2)
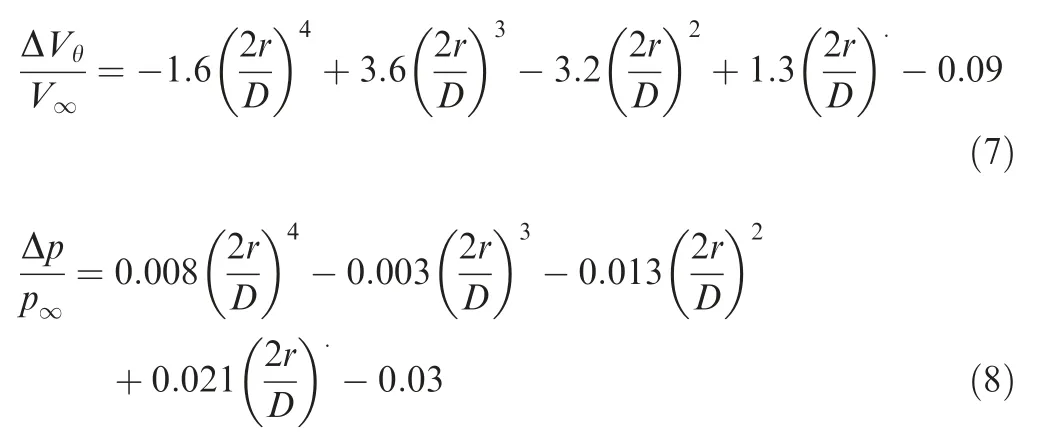
The wing optimization study in this paper is based on a twinturboprop regional airliner, as shown in Fig.4. Since the propeller and slipstream are different from those of AGARD model, an isolated propeller is computed first to obtain the slipstream parameters. The propeller geometry is shown in Fig.4(a) with advance ratio J=1.734, thrust coefficient T=0.05, incoming Mach number Ma=0.2, and Reynolds number Re=1.9×10. The pressure and velocity changes across the propeller are shown in Fig.5. Then 4th-order polynomials are used to describe the actuator disc, which are shown as Eqs.(7)and(8).The computational grid of the actuator disc model is shown in Fig.4(b). The grid has 3×10cells for the full aircraft model. The computational settings are the same as those of the AGARD model. The lift coefficient Cand drag coefficient Cversus angle of attack are shown in Fig.6.The lift results of the actuator disc computation are consistent with the experimental data except near the stall angle of attack. In Fig.6 (b), the propeller thrust has been deducted from the total drag. The pressure coefficients at two spanwise sections are shown in Fig.7. In the left wing section, the upstream slipstream increases the suction peak and the lift of the local airfoil. In contrast, in the right wing section, the downstream slipstream decreases the suction peak and lift.The actuator disc method captures the influence of the slipstream on the local pressure coefficient well.
In Section 2, the two slipstreams are so different, therefore the two propellers have been calculated and the two actuator disc parameters have been derived separately. Both of the two actuator discs match with their experiments well. The results of the two different validation cases both show that the presented actuator disc method is good at solving various slipstream flows.
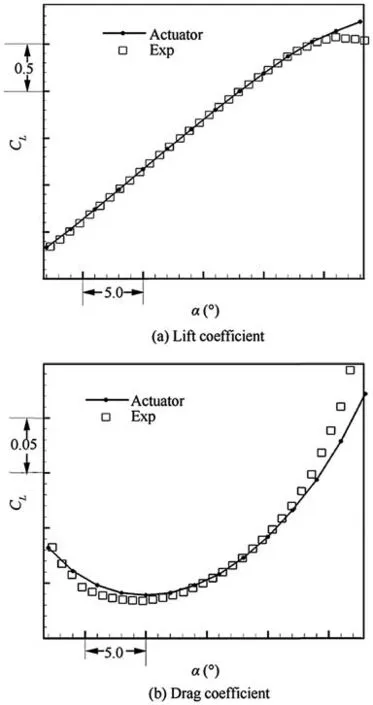
Fig. 6 Lift and drag coefficient of turboprop aircraft
If the propeller’s working conditions do not change much,one set of polynomials can be used for a propeller under other conditions.For example,in Section 3,the lift coefficient of the aircraft is fixed at C=0.48, while the angle of attack varies a little, and the propeller’s advance ratio, thrust coefficient,inflow Mach number and Reynolds number remain unchanged. The actuator disc model treats how velocity and pressure change across the propellers,and for these cases,there is no need to re-calculate the propeller. The same set of polynomials are used in all cases in Section 3.
3. Wing optimization of a turboprop aircraft

Fig. 7 Pressure coefficient of turboprop aircraft (α=6°)
In this section,the actuator disc method is applied in the optimization of a turboprop wing. The main objective is to increase the cruise lift-to-drag ratio under slipstream conditions. The Reynolds number is Re=1.6×10, the Mach number is Ma=0.5, the advance ratio is J=1.734, the thrust coefficient is T=0.05, and the lift coefficient is C=0.48.The propeller is the same one used in turboprop aircraft validation; however, the incoming flow is different. Thus, the isolate propeller has been re-calculated and the parameter changes across the propeller are shown in Fig.8.The propeller tip Mach number is approximately 0.6. The momentum change across the actuator disc is used to replace the velocity change to account for the density variation across the propeller. The actuator disc parameters are shown in Eqs. (9)and (10).
The drag of an aircraft can be decomposed by different physical mechanisms, including friction drag, form drag,induced drag and wave drag.The present turboprop aircraft is a typical subsonic aircraft. There is no shockwave in the flow, and the wave drag is zero. The friction drag and form drag mainly come from the boundary layer and flow separation. In the powered-on condition of a turboprop aircraft,local flow separation may be induced by the interference of the slipstream and the wing/nacelle, so the form drag and the friction drag can be changed. Moreover, the slipstream of the propeller may affect the wingload distribution and change the induced drag.

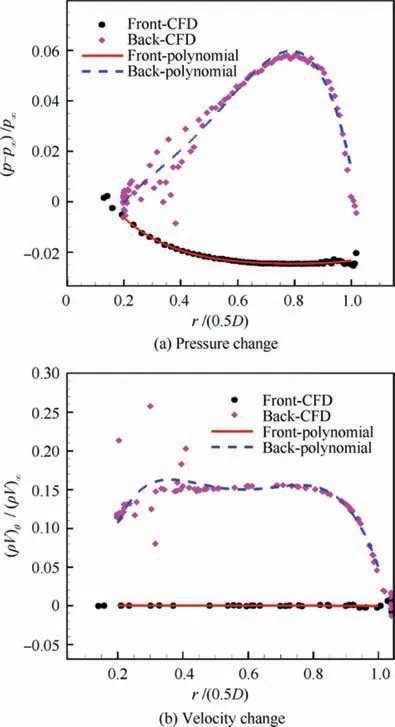
Fig. 8 Slipstream parameter changes across actuator disc(Turboprop, Ma=0.5)

3.1. Optimization settings
3.1.1. Optimization algorithm
The optimization algorithm used in this paper is a hybrid code called HASDE. It combines a Radical Basis Function Response Surface (RBFRS) and Differential Evolutionary(DE) algorithm. The differential evolutionary algorithm, as an improvement of the traditional genetic algorithm, can achieve a global optimal solution and has considerable utilization in aerodynamic optimization. The optimization code was validated by previous studies on airfoil optimizationand turbomachinery optimization. The main optimization process is shown in Fig.9.
3.1.2. Automatic grid generation and computation settings
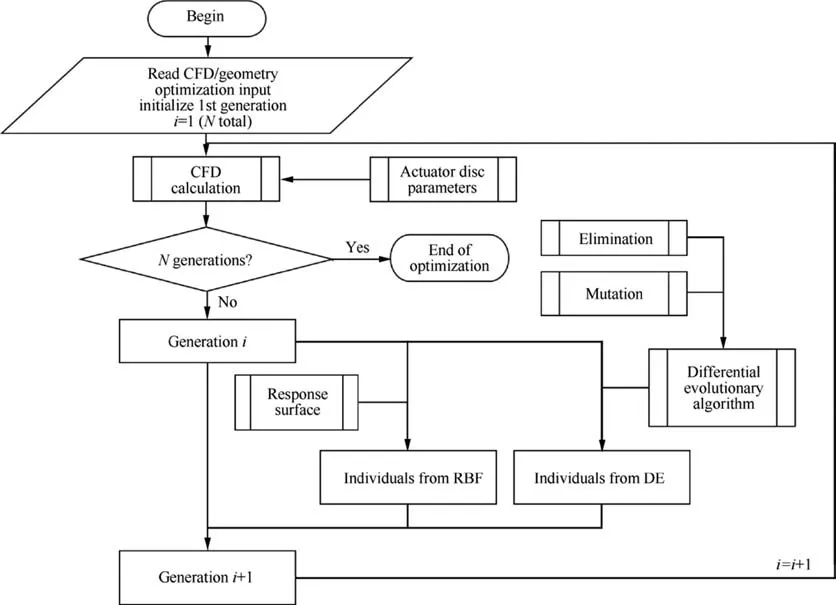
Fig. 9 Main optimization process

Fig. 10 Control sections of wing (red sections are fixed, and black sections are adjustable)
Automatic grid generation is realized by grid deformation from a baseline grid. The baseline grid is coarsened from the original grid in Section 2. The grid cell number is 5.4×10for the half model.The wing,nacelle and fuselage are modeled in the computation, and the propeller is simplified by an actuator disc.To keep the thrust line unchanged,the nacelle direction and the wing section near the nacelle are fixed. As shown in Fig.10,several spanwise sections are marked with black lines and red lines. The black sections are adjustable, while the red sections are fixed. The wing surfaces are interpolated between the spanwise sections. The adjustable sections are named L1-L6 and R1-R6 in order, where ‘‘L” refers to the left wing and ‘‘R” refers to the right wing. The computational settings remain the same as those shown in Section 2.Grid generation,flow simulation and postprocessing are integrated in a batch file to be executed by the optimization program.
To reduce the computational cost, the optimization is divided into two steps. The first is to optimize the twist angle of the spanwise sections to test the influence of the slipstream on the span load distribution. Several configurations with different propeller rotation modes are tested. The second is to optimize the airfoil geometries to increase the lift-to-drag ratio.Table 1 presents the settings of the twist angle optimization.The objective is to minimize the drag coefficient for a fixed lift coefficient. There are 6 twist angles for the half model and 12twist angles for the full model.Because the geometry of the aircraft should be symmetric, the twist angle distributions of the left wing and the right wing are the same. The design point is the cruising condition with Reynolds number Re=1.6×10,Mach number Ma=0.5, and lift coefficient C=0.48. The total optimization generation is 32, and each generation has 18 individuals.
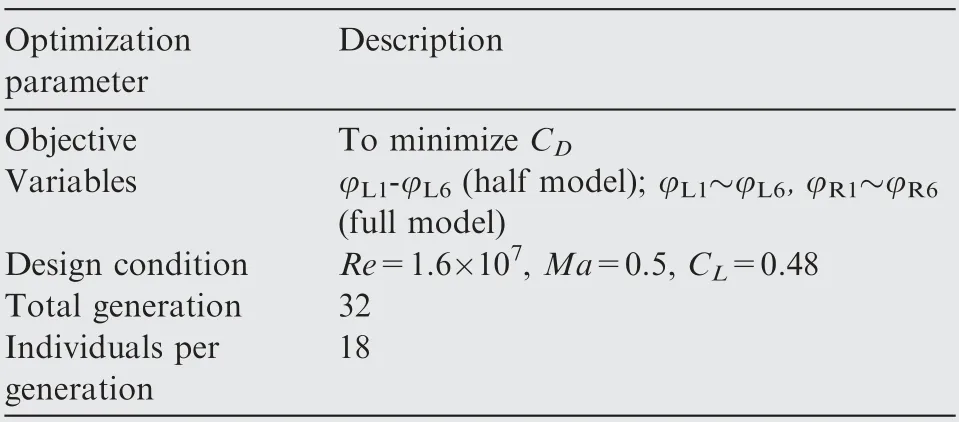
Table 1 Optimization settings

Fig. 11 Slipstream direction configuration
In the modern aviation market, most multiple turboprop aircraft have propellers rotating in the same direction. This means that the slipstreams of the left and right sides of the aircraft are not symmetric.Consequently,the aerodynamic forces of the left and right wings are unequal. It is necessary to consider the influence of the propeller rotation direction on the wing optimization process. For a typical twin-turboprop aircraft, there are three modes of slipstream directions, as shown in Fig.11.The first mode is symmetrical and is called‘‘inboarddown”. This means that the inboard wing is submerged by a downwash slipstream, while the outboard wing encounters an upwash slipstream. The second mode is called ‘‘inboardup” and is opposite to the ‘‘inboard-down” configuration.The Airbus A400M aircraft is a quad-turboprop transport that has 4 propellers. The slipstream of the two inner engines is‘‘inboard-up”, while the slipstream of the two outer engines is ‘‘inboard-down”. The third mode is the most commonly used form called‘‘normal”.The propellers of the right and left sides of the aircraft rotate in the same direction;an example of this type of aircraft is the Dash 8-Q400 aircraft. Because the slipstream is different under the three modes, the influence on the wing span load distribution is quite different. It is necessary to analyze the span load variation caused by the slipstream and obtain the design principle of the propeller wing.
To study the effect of the slipstream on the wing optimization, three wings are compared in each optimization. The first wing is the original wing geometry.It is validated under different slipstream directions. The second wing is optimized without the slipstream effect. Then, it is tested under different slipstream directions. The third wing is optimized under the slipstream effect, which is the focus of the present study.
The total drag is decomposed into friction drag, induced drag and form drag to study the drag reduction mechanism.The flow is subsonic, and there is no shockwave in the flow field. Therefore, wave drag is not considered. A nondimensional wingload is defined in

where c is the local chord length of the wing, cis the local lift coefficient, and cis the mean aerodynamic chord.
The wingload distribution is substituted into the software Lidragto compute the Oswald factor e and the induced drag C, as shown in:

where η is the spanwise location,θ and aare intermediate variables. Cis the lift coefficient of the wing, AR is the aspect ratio, and b is the wing span. The friction drag Ccan be determined from the shear stress of the wall. Then,the form drag Cis calculated by:

3.2. Twist angle optimization under different actuator disc settings
The twist angle distribution of the wing is optimized under different actuator disc settings. Three powered-on optimizations(inboard-down/inboard-up/normal) and one unpowered optimization are carried out to study the slipstream influence on the wingload, as well as the effect of drag reduction.
3.2.1. Unpowered and powered-on comparison
In this section, optimizations with different propeller power settings (unpowered/powered-on) are carried out to study the effect of the slipstream on the wing optimization.
Both the geometry and the flow field are symmetrical for the inboard-down slipstream configuration. Optimizations of the unpowered and powered-on configurations are conducted.The convergence histories of the drag coefficient Care shown in Fig.12, and the two optimizations converge well. Two designs, OPT_A and OPT_D, are selected from the optimizations because they have the minimum drag coefficient. Then,the designs are numerically computed to validate the performance. As shown in Table 2, three cases are computed.Base_A is the original wing. The geometry is unchanged, and the wing is tested with the inboard-down slipstream. OPT_A is the wing optimized without the slipstream.This wing is also validated with the inboard-down slipstream.OPT_D is directly optimized under the inboard-down slipstream.
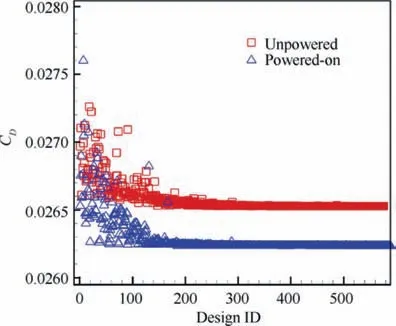
Fig. 12 Convergence histories of CD

Table 2 Inboard-down optimization results

Table 3 Inboard-down twist angle changes
The twist angles are listed in Table 3. In this optimization,the inboard sections (L1, L2) are submerged in the downwash slipstream, the outboard sections (L3, L4) encounter upwash slipstream, and the outer wing sections (L5, L6) are far away from the slipstream. At the inboard sections (L1, L2), the powered-on optimization tends to make the twist angles smaller.In contrast,at the outboard sections(L3,L4)and the outer wing sections (L5, L6), the optimization under the slipstream tends to make the twist angles larger. The twist angles of the unpowered optimization (OPT_A) are different from those of the powered-on configuration (OPT_D); however, there is no clear tendency for the variation. The variation in the twist angles changes the wingload distributions,as shown in Fig.13.The inboard wingload decreases and the outer wing wingload increases after both optimizations. The wingload of OPT_D changes more than that of OPT_A at the same locations.The elliptical lift distribution has the minimum induced drag for a planar wing. However, the present lift distributions are quite different from an elliptical distribution under the influence of the propeller slipstream. Base_A is the closest to an elliptical distribution,while OPT_D is the most different.Consequently, the induced drag of OPT_A is 3.1 counts higher than that of Base_A, and that of OPT_D is 6.2 counts higher than that of Base_A, as shown in Table 2.
When viscous flow passes a wing, the boundary layer becomes thicker at the trailing edge and generates form drag.Sections L2 (downwash slipstream) and L3 (upwash slipstream)are submerged in the propeller slipstream.The velocity contours of L2 and L3 are shown in Fig.14.In section L2,the tailing low-velocity region decreases after optimization. This means that the boundary layer becomes thinner than that of the original wing.This change decreases the form drag.In section L3, the velocity contour remains almost the same. This indicates that most of the form drag reduction comes from the inboard wing. The form drag of OPT_A has a 5.6 counts reduction compared to that of Base_A after optimization,and the form drag of OPT_D has a 9.7 counts reduction.Because the wing planform is unchanged, the friction drags of the three cases are almost the same. The drag reduction results are listed in Table 2. The form drag contributes the most to the total drag reduction.The powered-on optimization OPT_D is better than the unpowered optimization OPT_A because the lift-to-drag ratio OPT_D (17.99) is slightly larger than that of OPT_A (17.94).
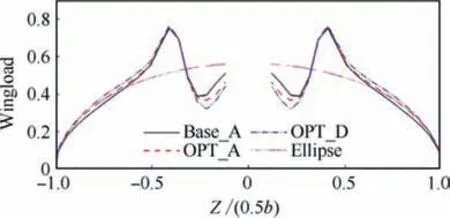
Fig. 13 Wingload distribution (inboard-down)
The study of inboard-up and normal configurations is similar to that of inboard-down. The optimization results are shown in Table 4. Base_B and Base_C are the original wings,and they have been calculated with the inboard-up and normal slipstreams. OPT_B and OPT_C are the same wing optimized without a slipstream(same as OPT_A).They are also validated with the inboard-up and normal slipstreams. OPT_E and OPT_F are powered-on optimized with the inboard-up and normal slipstreams. The drag coefficient is different with the same geometry under different slipstream conditions.The drag coefficient with the same slipstream conditions is subtracted from the original geometry to calculate the drag reduction.For example, ΔC|=C|-C|.
The wingload distributions of inboard-up and normal configurations are shown in Fig.15. Both unpowered and powered-on optimizations decrease the inboard wingload and increase the outer wingload.
A comparison of the cases with the same slipstream direction, such as Base_B, OPT_B and OPT_E clearly shows that powered-on optimization is better than unpowered optimization for drag reduction.Powered-on optimization can optimize different wing sections under different local slipstream conditions.In contrast,unpowered optimization treats wing sections with undisturbed incoming flow.
3.2.2. Slipstream direction comparison
Three powered-on optimizations, OPT_D, OPT_E, and OPT_F, were carried out in the above study. They share the same optimization settings, and the only difference is the slipstream configuration. Thus, we can study the influence of the slipstream direction by comparing these results.
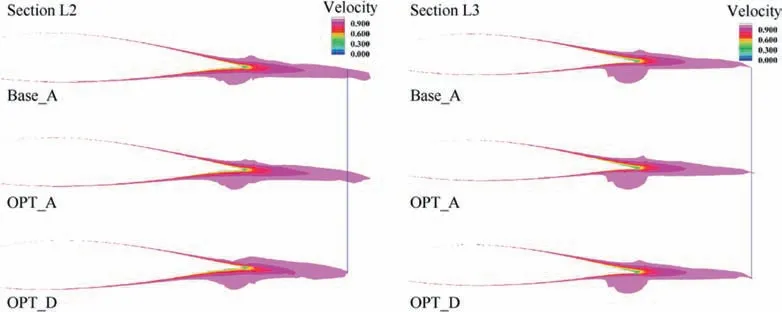
Fig. 14 Velocity contour (inboard-down)

Table 4 Optimization results of different slipstream directions
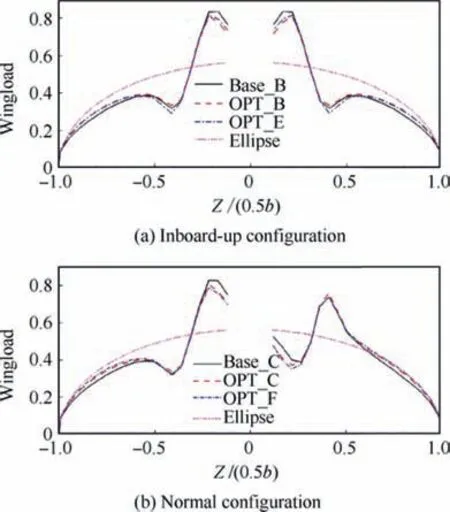
Fig. 15 Wingload distribution for inboard-up and normal configurations
The twist angles are shown in Table 5. OPT_F combines both inboard-down and inboard-up slipstreams for the left and right wings. If we optimize the left wing (submerged in inboard-down slipstream), the aerodynamic performance of the right wing (submerged in inboard-up slipstream) is not ideal. Thus, the optimization result OPT_F also combines the characteristics of the inboard-down design (OPT_D) and inboard-up design (OPT_E). As shown in Table 5, the twist angles of OPT_F are between the values of OPT_D and OPT_E. The wingload distributions are shown in Fig.16. The wingload of OPT_F is also among those of OPT_D and OPT_E.Moreover,at both the left wing(Z>0)and right wing(Z<0),the wingload distribution of OPT_F is the closest to an ideal ellipse distribution, so its induced drag is the smallest.The induced drag of OPT_F is 81.0 counts, while OPT_D’s is 84.4 counts and OPT_F’s is 87.1 counts. If we increase the wing twist angle in the downwash slipstream area and decrease the wing twist angle in the upwash slipstream region,the wingload distribution is close to an ideal elliptical distribution,and the induced drag can be reduced.
Changes in the twist angle and wingload distribution also influence the other drag components. The pressure coefficient contour and slipstream velocity slices W are shown in Fig.17.For OPT_D,the inboard-down slipstream and wingtip vortex rotate in the same direction. For OPT_E, the inboardup slipstream and wingtip vortex rotate in different directions,and the spanwise slipstream and wingtip vortex become weaker.OPT_F has both inboard-down and inboard-up characteristics for both left and right wings,and the spanwise slipstream velocity is moderate. The most important function of the propeller is to generate thrust rather than slipstream.However, a slipstream is unavoidable because of the rotating propeller. Fortunately, the slipstream energy can be recovered by the wing,similar to a stator after a rotor in turbomachinery.When the slipstream hits the wing, the slipstream energy is transferred into spanwise flow, vertical flow or axial flow.Axial flow increases the local Reynolds number and makes the local boundary layer thinner and the local form drag lower.Vertical flow changes the local angle of attack. The upwash slipstream increases the local lift,and the downwash slipstream decreases the local lift.In the inboard-up cases,the local chord of the upwash wing area is larger. The wing can make full use of the upwash slipstream to generate more lift.If the spanwise velocity becomes weaker,it means that more slipstream energy is recovered by the wing as axial velocity and vertical velocity.As a result, the form drag of OPT_E is the lowest. The form drag of OPT_E is 45.4 counts, OPT_D is 59.4 counts, and OPT_F is 59.3 counts.

Table 5 Twist angles of different slipstream directions
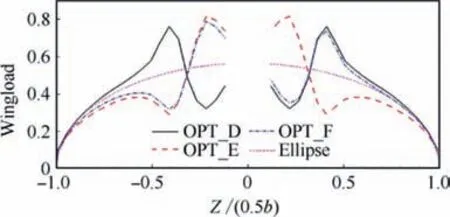
Fig. 16 Comparison of wingload distributions of powered-on optimizations with different slipstream directions
A comparison of the three powered-on optimization cases with different slipstream configurations clearly shows that the OPT_E optimized under the inboard-up slipstream configuration has the highest lift-to-drag ratio of 18.87,while the liftto-drag ratio of OPT_F optimized by the normal slipstream is 18.25, and OPT_D optimized by the inboard-down slipstream is 17.99.
3.3. Airfoil optimization
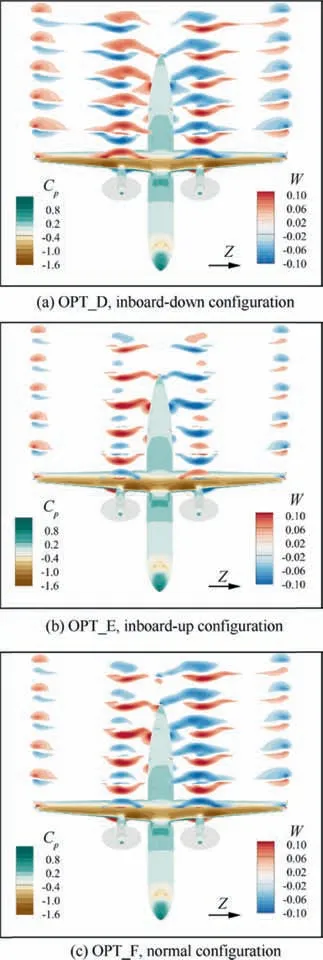
Fig. 17 Pressure coefficient contours and slipstream velocity slices (different slipstream directions)


Table 6 Airfoil optimization settings

Table 7 Airfoil optimization results
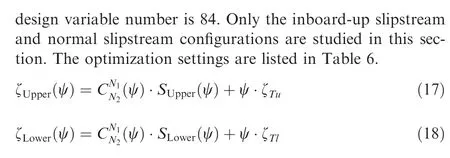

Fig. 18 Airfoils after optimization
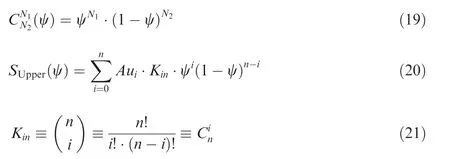
The optimization results are listed in Table 7. OPT_G is obtained with the inboard-up slipstream configuration, and OPT_H is obtained under the normal slipstream configuration.Three wing sections are shown in Fig.18.They are L2(inboard slipstream), L3 (outboard slipstream) and L5 (out of the slipstream). The locations of the airfoil sections are defined in 0.Because the wing geometry is symmetric, the left and right wing sections are the same. There are two obvious variations in the optimization.The first is to reduce the camber to change the wingload distribution. The second is to decrease the leading-edge radius. Because sections L2 and L3 are submerged in the propeller slipstream, the local velocity is increased. The optimization tends to decrease the leadingedge radius to decrease the local form drag. In contrast, the leading-edge radius of section L5 is higher than those of L2 and L3. The optimizations in this paper are single point optimization.Only the cruise condition performance is considered.A small leading-edge radius usually means a low stall angle of attack. However, the form drag is significantly decreased by reducing the leading-edge radius under the cruise condition.The airfoil pressure coefficients are shown in Fig.19. Because the left wing and right wing are in different slipstream conditions, the pressure coefficients of both the left and right wing sections are presented. The airfoil optimization tends to decease the suction peak. These changes make the form drag lower.
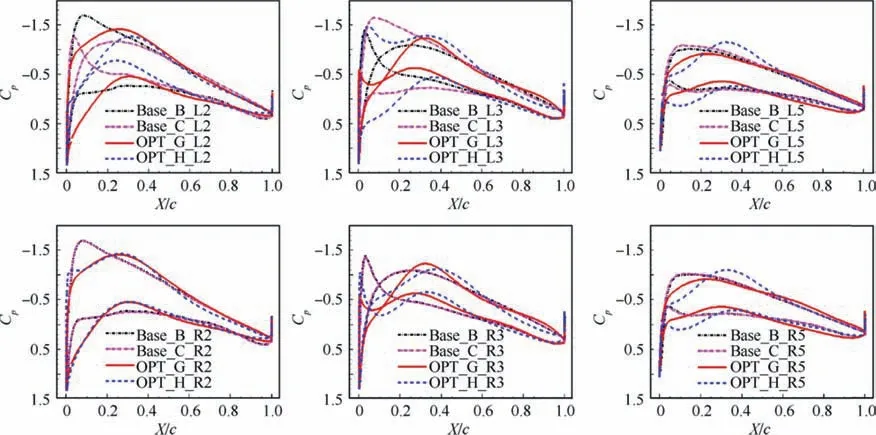
Fig. 19 Pressure coefficient (airfoil optimization)
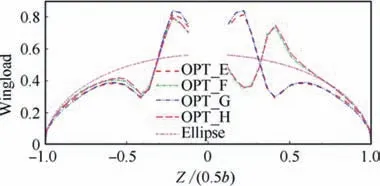
Fig. 20 Wingload distribution (airfoil optimization)
The wingload distributions are shown in Fig.20.The results of the twist angle optimization (OPT_E and OPT_F) are also compared. The slipstream conditions of OPT_E and OPT_G are the inboard-up configuration, and the slipstream conditions of OPT_F and OPT_H are the normal configuration.The wingloads of OPT_E and OPT_G are almost the same,and those of OPT_F and OPT_H are also similar.This demonstrates that both twist angle optimization and airfoil optimization tend to change the wingload in a similar pattern with a certain slipstream condition.
The drag coefficients of the airfoil optimization results are presented in Table 7. Compared to the twist angle optimization, the form drag of the airfoil optimization is lower, while the induced drag is higher.Thanks to the form drag reduction,the total drag of the airfoil optimization is better than the twist angle optimization. The lift-to-drag ratio of the airfoil optimization under the inboard-up slipstream is the largest in the present study, increasing from 18.47 (original wing) to 19.15(OPT_G). The inboard-up slipstream has higher cruise efficiency than the inboard-down or normal slipstream configurations.
4. Conclusions
The wing optimization of a propeller aircraft with the actuator disc method is studied in this paper. Optimization cases with different slipstream conditions and different design variables are carried out. Some conclusions can be made as follows:
(1)The present actuator disc method is demonstrated to be an effective tool to model the propeller slipstream effect that can precisely simulate the flow field of a turboprop aircraft.Optimization with the slipstream is realizable by the actuator disc method.
(2) Both unpowered optimization and powered-on optimization can reduce the total drag by changing the twist angles of the wing.The slipstream directions have a great influence on the wing performance of turboprop aircraft.Optimization with the slipstream can obtain better drag reduction results.Powered-on optimization can obtain different wing sections under different slipstream configurations.The inboard-up slipstream can reduce the form drag considerably by descending the spanwise slipstream velocity. In addition, the total drag of the inboard-up slipstream configuration is the best compared to that of the inboard-down or normal configuration.
(3) The drag reduction effect of the airfoil optimization is better than that of the twist angle optimization. Under the strong influence of the slipstream, the wing form drag can be significantly reduced by reducing the leading-edge radius.Moreover, both twist angle optimization and airfoil optimization change the wingload distribution in a similar pattern,which reduces the inboard wingload and increases the outboard wingload.
Declaration of Competing Interest
The authors declare that they have no known competing financial interests or personal relationships that could have appeared to influence the work reported in this paper.
Acknowledgements
This work is supported by the National Natural Science Foundation of China (Nos. 91852108 and 11872230).
 CHINESE JOURNAL OF AERONAUTICS2021年5期
- CHINESE JOURNAL OF AERONAUTICS的其它文章
- Ferrofluid moving thin films for active flow control
- Preliminary study on heat flux measurement data of TT-0 flight test
- An analysis and enhanced proposal of atmospheric boundary layer wind modelling techniques for automation of air traffic management
- Jet sweeping angle control by fluidic oscillators with master-slave designs
- Hot deformation behavior and microstructure evolution of the laser solid formed TC4 titanium alloy
- Electrochemical trepanning with an auxiliary electrode
