Frictional behavior during cold ring compression process of aluminum alloy 5052
Dawei ZHANG, Guangcan YANG, Shengdun ZHAO
School of Mechanical Engineering, Xi’an Jiaotong University, Xi’an 710049, China
KEYWORDS Deformation threshold;Magnitude of friction;Ring compression test;Shear texture;Surface feature
Abstract The friction is the considerable boundary condition in bulk metal forming. In this paper, the ring compression test was used to evaluate the friction coefficient and factor in Coulomb friction model and Tresca friction model for the plastic deformation of aluminum alloy AA5052. The micro-macro analysis method combining surface morphology and micro-texture was used to explore the friction behaviors in AA5052 cold forming process. In general, the magnitude (μ or m) of friction changes before and after a deformation threshold during ring compression. The maximum change rate of the magnitude (μ or m) before and after the deformation threshold is close to 18.5% under the present experimental conditions, and the change rate decreases with increasing loading speed. The lubrication using MoS2 is better than that using oil at lower speeds (0.15 mm/s, 1.5 mm/s), but the lubrications for MoS2 and oil are similar at higher speeds (15 mm/s). The surface roughness, three-dimensional topography, and surface texture of compressed ring have a sudden change around the deformation threshold, which deviate from the previous evolution trend. The increased friction after deformation threshold also promotes the formation of sufficient shear strain layer in the subsurface plane of the compressed ring, and then it hinders the formation of the typical deformation textures with β-oriented line and promotes the appearance of shear textures such as {001}〈110〉, {111}〈uvw〉 and {hkl }〈110 〉textures.
1. Introduction
The unavoidable contact friction between the die and the workpiece in metal plastic forming significantly affects the metal flow, the service life of die, the surface quality of the part, etc.; it also affects the microstructure of the material and produces inhomogeneous microstructures.In view of the importance of friction and the complex characteristics during the plastic forming process,many scholars have developed some friction tests, such as ring compression test,double cup extrusion,barrel compression test,twist-compression test,upsetting sliding test,T-shaped compression,pin-on-disk tribology test,and sliding compression test.The research based on these test methods showed that the friction characteristics in plastic deformation for different materials have obvious differences. Aluminum alloy AA5052 is a very widely used non-ferrous metal structural material, which plays a pivotal role in the automotive, machinery manufacturing, shipbuilding and other industries, but its friction characteristics in cold bulk forming are rarely reported. So it is necessary to further study the friction behavior of aluminum alloy AA5052 during plastic deformation.
The forming conditions, especially the lubricant, have an important effect on the friction behavior during plastic deformation.For example,different lubricants present different respondents to high and low loading speeds.Friction leads to the changes in surface topography of the workpiece and the inhomogeneous material flow during metal forming process.Inhomogeneous plastic flow causes shear stress among the deformed parts, which leads to the appearance of shear textures.Zhang et al.found that during the cold compression test of ring of medium carbon steel, the surface roughness of the ring specimen changes significantly at the early and late stages of ring compression, and the friction conditions also change. Groche et al.indicated that the rough surface promotes the transforming from cubic texture to shear textures during the metal deformation process. Truzkouski et al.found from the pure aluminum rods subjected to torsional deformation experiments that {111 } fiber texture is generated on the shear stress surface and the 〈110 〉-direction texture of the {0 01}〈 1 10〉-rotating cubic texture parallels to the shear stress direction under the action of pure shear external forces.It is also found from sub-surface of the rolled face-centered cubic (fcc) metal that material subjected non-uniform deformation tends to form the ideal single-shear deformation, and the main orientation in the ideal single-shear deformation is the crystal slip direction and slip plane paralleling to the shear direction.The previous studies found that the friction has an effect on the surface characteristics and microstructure of material during metal bulk forming. However, the related study on cold bulk forming of aluminum alloy AA5052 is not sufficient.
The ring compression test is a simple and convenient method for evaluating the friction conditions in bulk forming processes and is widely used. It is also a proven and efficient testing method, and some meaningful conclusions can also be obtained by the method. Forcellese et al.used the ring compression test to study the friction characteristics of aluminum alloy AA7075 under quasi-static loading and dynamic loading conditions (800 s, 1700 s), and the results showed that the determined friction coefficient under dynamic loading is greater than that under quasi-static loading. Zhang et al.used the ring compression test to evaluate the friction boundary condition of the counter-roller spinning process used aluminum alloy AA5052, but there were fewer experimental data points, and the error between the experimental data points and the calibration curve was large.Camacho et al.used the ring compression test to study the friction factor during the forming of aluminum alloy AA6082 (UNS A96082). It was also found that the friction factor is difficult to be considered as a constant value after 20% reduction in height, so the average value was appropriate as the friction value of the lubrication condition. Hu and Deanalso found that the friction coefficient increases with increasing reduction in height during the pure aluminum ring compression test, and pointed out that the surface roughness of the pure aluminum ring also changes with the increase in reduction. The reasons for the changes of friction conditions were generally explained from the extrusion of lubricant, the increase of contact area, and the change of the surface roughness and topography,but the in-depth discussion has not been carried out. Therefore,this paper will carry out an extended study on these, and provide an in-depth understanding for the frictional behavior during cold forming process of aluminum alloy 5052.
This paper used the ring compression test to study the friction behavior during the plastic deformation process of AA5052. In the ring compression test, the hydraulic oil,MoSgrease, and different loading speeds have been adopted, and the magnitudes of friction under different combination conditions have been evaluated. Then, the changes in surface roughness, surface texture, and crystallographic texture were used to reveal the change of the friction conditions in more detail. The results indicated that deformation threshold under MoSlubrication is almost a constant, but the magnitude of friction is depended on the loading speeds; the deformation threshold and the magnitude of friction are both depended on the loading speeds under oil lubrication, but the changing degree of magnitudes (μ or m) is smaller than that under MoSlubrication.The results have contributed to the friction control and process optimization during cold forming process of AA5052.
2. Materials and experimental procedure
2.1. Material
The material of the ring specimen is AA5052,and its chemical composition measured by an energy spectrum analyzer is shown in Table 1. In the series of ring compression experiments in this study, the maximum strain rate is about 11 s(at 55%reduction under 15 mm/s),which belongs to the range of quasi-static loading conditions. So the effects of temperature and strain curvature on the relationship between stress and strain are not considered.The INSTRON-100 kN material testing machine was used to perform a uniaxial tensile test to obtain the stress-strain relationship of AA5052, as shown in Fig. 1.
The ring specimens have the ratios of D:d:h=6:3:2,where Dis the initial outer diameter of the ring specimens,dis the initial inner diameter, and his the initial height.D= 9±0.02 mm, d=4.5±0.02 mm, h=3±0.02 mm have been determined according to the working capacity of the material testing machine.
2.2. Ring compression test
All the ring compression experiments were carried out by INSTRON-100 kN material testing machine. Considering the processing parameters and machine control accuracy,three loading speeds (v) such as 0.15 mm/s, 1.5 mm/s and 15 mm/s were adopted. Two kinds of lubricants such as HM-46hydraulic oil and MoSgrease were adopted in experiments,which are widely used in cold forming.

Table 1 Chemical composition of aluminum alloy AA5052.
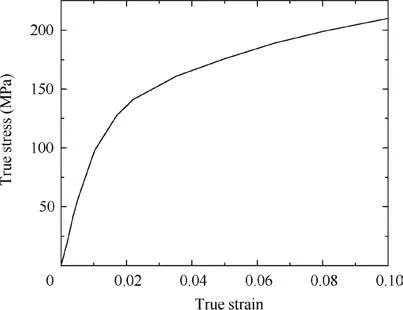
Fig. 1 Stress-strain curve of aluminum alloy AA5052.
Because the smaller compression deformation of the specimens cannot well reflect the friction changes during the forming process, the reduction in height was controlled at 30%-60% for the series of ring compression experiments. In order to capture the detailed changes of the friction conditions,every 3% reduction in height was taken as an experimental point,that is, each group of experimental conditions is not less than 10 data points.
The friction calibration curve can be obtained by theoretical analysis or numerical methods. In order to obtain a highly accurate calibration curve, the friction calibration curves were drawn by numerical methods based on the commercial finite element software DEFORM. Tresca friction model (i.e. shear friction model) and Coulomb friction model were used in the numerical simulations of ring compression to elaborate the calibration curve, respectively. The material properties were determined by Fig. 1, and Von Mises criterion was adopted in the numerical simulations. The initial mesh element size of the ring was less than 0.01 mm. The finite element analysis(FEA) predicted the reduction Δh in ring height was set to the x axis, and the reduction Δd in inner diameter was set to the y axis under a series of different friction conditions. Then,the friction calibration curve can be obtained, as shown in Fig.2.It can be found from the figures that the error between friction calibration curves at different loading speeds is small,but the friction calibration curves at corresponding loading speeds were used in the following research and analysis.
The experimental data under different experimental conditions were described on the friction calibration curve, and the corresponding friction coefficient and factor were determined according to the degree of agreement between the experimental data points and the calibration curve, that is, multiple consecutive data points should satisfy the Eq. (1) defined in the study.
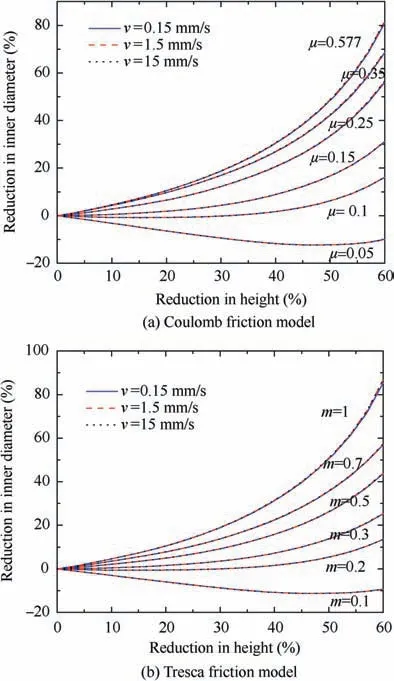
Fig. 2 Friction calibration curves at different loading speeds elaborated by different friction models.

where dand Δdare the experimental results of inner diameter and reduction percentage in inner diameter of compressed ring by experiment, respectively; dand Δdare the numerical results of inner diameter and reduction percentage in inner diameter of compressed ring by numerical simulation under Coulomb friction model or Tresca friction model,respectively; e=0.005.
2.3. Surface measurement
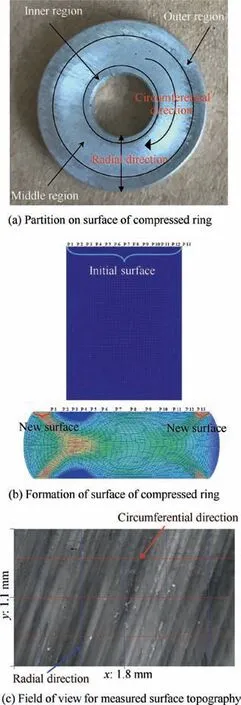
Fig. 3 Measurement positions of surface characteristics and topography of the specimens.
A white light interference profiler(UP-WLI,Rtec Instruments,USA)was used to measure the surface topography and roughness of the compressed ring, and the measurement positions were chosen from the outer region, middle region and inner region, respectively, as shown in Fig.3(a). Observing the cleaned surface of the compressed ring, it can be found that there are three distinct areas on the upper (lower) surface of the compressed ring: outer region, middle region and inner region. Taking points P1 to P13 from inside to outside on the initial surface, it can been found that the region from P1 to P13 is expanded during compression process and expanded region only part of final surface, as shown in Fig.3(b). The middle region is formed by the expansion of the upper(lower)surface of the initial ring,while the inner and outer regions are the new surfaces formed by the inner and outer cylindrical surface of the initial ring during the compression process.


The German Zeiss microscope(Evo18)was used to observe the surface texture of the compressed ring.
The compressed ring before and after deformation threshold were chosen and were cut along the compression direction.The AD-RD surface (AD, axial direction; RD, radial direction) has been mechanically polished firstly, and then argon ion thinned.The prepared surfaces were observed by scanning electron microscope with electron backscatter diffraction(EBSD) probe. According to the size of the test area and the state of the material, the selected scanning step is 0.4-0.5 μm.The data obtained from EBSD test were processed and analyzed using the Oxford HKL-Channel 5 software to obtain the texture pole figure.
3. Friction conditions during cold forming
3.1. Oil lubrication
When the oil lubrication strategy was adopted,the experimental data points of the ring compression experiments are shown in Fig. 4. Generally, it is difficult to describe all experimental data points under a certain experimental condition with one calibration curve, that is, the friction coefficient or factor (μ,m) has changed during ring compression process. The errors between the specific experimental data points and the corresponding calibration curves were calculated according to Eq.(1), as listed in Tables 2-4. When e=0.005, a deformation threshold can be found in the compression process, and two calibration curves can be used to describe the experimental data points before the threshold and after the threshold,respectively.This phenomenon was also described in cold ring compression tests of medium carbon steel on a screw press in the study,but the deformation thresholds are different.
According to Fig.4 and Tables 2 to 4,the friction behaviors at 0.15 mm/s and 1.5 mm/s are similar when oil is used as lubricant,and it is obviously different from the friction behavior at 15 mm/s.The deformation thresholds of the former two are relatively close, and smaller than the latter.
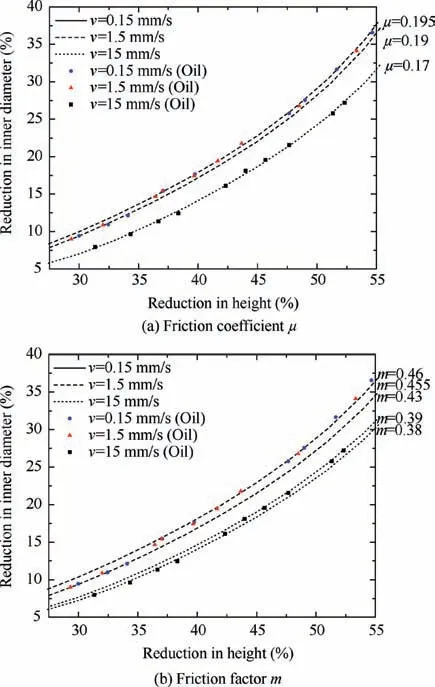
Fig. 4 Experimental data at different loading speeds when oil lubrication.

At the 0.15 mm/s and 1.5 mm/s, the magnitudes of friction are the same and the friction coefficient μ=0.19 and friction factor m=0.43 can be determined when the reduction in height is less than the deformation threshold.When the reduction in height is greater than the deformation threshold,both μ increase to 0.195. However, the changes of m are different under the two loading conditions, and m increases to 0.46 at 0.15 mm/s and to 0.455 at 1.5 mm/s.
At the loading speed of 15 mm/s, the friction coefficient μ remains unchanged and the friction factor m changes slightly.When the reduction in height is less than the deformation threshold, μ=0.17 and m=0.37, but m increases to 0.39 and μ remains at 0.17 when the reduction in height is greater than about 44%.
It can be seen that under the same oil lubrication condition,the magnitudes of friction increase slightly at a larger reduction in height when the loading speed is higher.While,the magnitudes of friction change earlier when the loading speed is relatively smaller,and the change amount of the magnitudes of friction are slightly larger than that at the higher speed.
3.2. MoS2 lubrication
When MoSgrease was used to lubricate, the experimental data points of the ring compression experiments are shown in Fig. 5. Similarly,it is difficult to describe all experimental data points under a certain loading condition with a calibration curve,that is, the friction coefficient or factor (μ, m) has changed during the ring compression process. The errors between the specific experimental data points and the corresponding calibration curves were calculated according to Eq.(1), as shown in Tables 5-7, respectively.
According to Fig. 5 and Tables 5-7, the deformation thresholds,which the magnitudes of friction will change before and after,at the three loading speeds are relatively closer when MoSis used as lubricant.When the reduction in height is less than the deformation threshold, the magnitudes of friction under the three loading speeds are similar, where e=0.005,the calibrated friction conditions are the same: m=0.38 and μ=0.17. However, when the reduction is greater than the deformation threshold, the magnitudes of friction under the three loading speeds are different.
When the reduction is greater than the deformation threshold, the friction coefficient or factor increases to m=0.45 or μ=0.19 at 0.15 mm/s; the friction coefficient or factor increases to m=0.43 or μ=0.188 at 1.5 mm/s; the friction coefficient/factor increases to m=0.41 or μ=0.1775 at 15 mm/s.


Table 2 Magnitude of friction under 0.15 mm/s and oil lubrication.

Table 3 Magnitude of friction under 1.5 mm/s and oil lubrication.

Table 4 Magnitude of friction under 15 mm/s and oil lubrication.
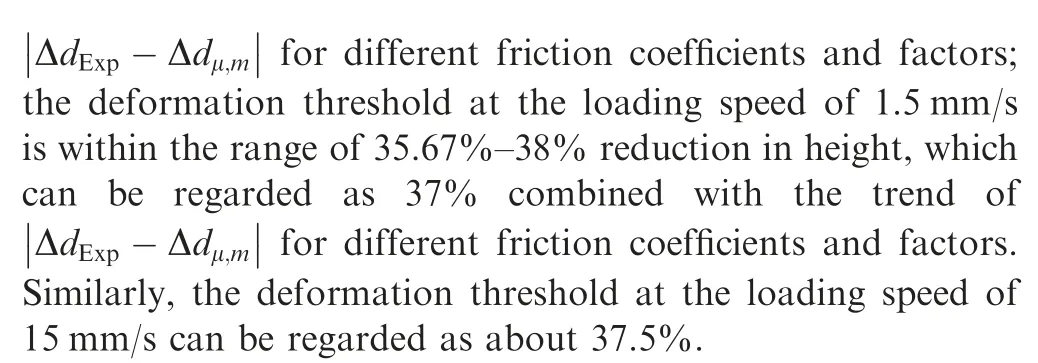
It can be seen that all the magnitudes of friction at low,medium and high loading speeds will change during the ring compression under MoSgrease lubrication. The increasing degree is the most at low loading speeds and is the least at high loading speed.
3.3. Analysis of frictional behavior
According to the analysis results in Section 3.1 and Section 3.2,the magnitudes of friction within 30% to 55% reduction in height are shown in Fig. 6. It is found that the lubricating effect of MoSis better than that of oil at the lower loading speeds (0.15 mm/s, 1.5 mm/s); and the lubricating effects of the two lubricants are equivalent at the maximum loading speeds (15 mm/s). During the compression process, the values of friction change under different forming conditions, but the degrees of the change are different, and the deformation thresholds are also different.
The changing degree of the magnitudes of friction during the ring compression process can be quantitatively expressed by the change rate FR (Eq. (4)) of the magnitude (μ, m), as shown in Fig.7.It can be found from Fig.7 that the changing degree of magnitudes of friction under Tresca friction model is greater than that under Coulomb friction model. With the increase of loading speed, the changing degree of magnitudes of friction decreases, and even there is no change under Coulomb friction model when the oil lubrication and 15 mm/s loading speed are adopted. The change rate FR by using MoSlubrication is much greater than that by using oil lubrication at the same loading speed.

where μand mare the friction coefficient and factor before the change of magnitudes of friction, respectively; μand mare the friction coefficient and factor after the change of magnitudes of friction,respectively.
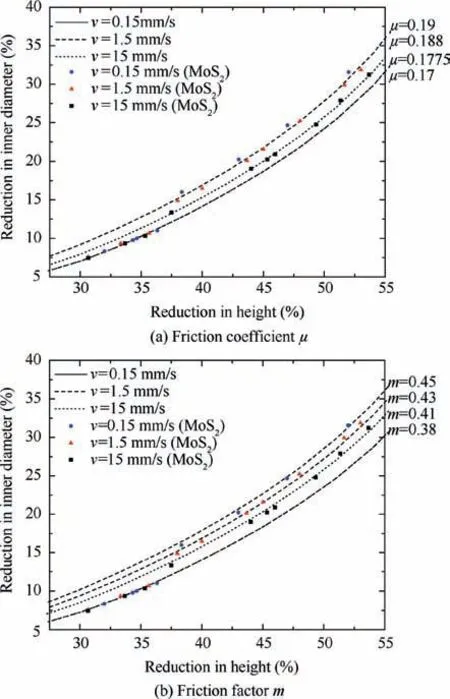
Fig.5 Experimental data at different loading speeds when MoS2 lubrication.
The deformation thresholds for magnitudes of friction under different experimental conditions are shown in Fig. 8.The lubricants have a great influence on the deformation threshold. The deformation thresholds under MoSlubrication is almost a constant; but under oil lubrication, the deformation thresholds increase significantly when loading speed increases greatly. At medium and low loading speeds(0.15 mm/s, 1.5 mm/s), the deformation thresholds under MoSlubrication are greater than the deformation thresholds under oil lubrication;however,the situation is opposite at high loading speed (15 mm/s).
In summary, at low and medium loading speeds, the lubricating effect of oil is worse than that of MoSwhen the reduction in height is small, but the FR under MoSlubrication is greater at large reduction. At higher loading speeds, both lubricants maintain a good lubricating effect,and the changing degree of magnitude of friction is smaller than that at low and medium loading speeds.
4. Results and discussion
4.1. Shape and load during compression process
The percentage curves for change in inner diameter during AA5052 ring compression process under different forming conditions are shown in Fig. 9.Under the condition of oil lubrication, the changing trend of the inner diameter at medium and low loading speeds are almost the same and the curve deviates from the initial trend after about 36% reduction in height. However, the percentage curve deviates from the initial trend after about 42.33%-44% reduction in height at 15 mm/s. These are corresponding to the changes in magnitudes of friction in Fig. 4. Under the condition of MoSlubrication, the change percentage for inner diameter suddenly increases and the sudden increment is large around 37.5% reduction in height, especially at a lower loading speed. These are corresponding to the changes in magnitudes of friction in Fig. 5. Combined with the analysis in Section 3.3, when the curve for change in inner diameter deviates from the initial change trend, it indicates that the magnitude of friction changes; and the greater the deviation slope, the greater the change of the magnitude of friction. It can also be seen from Fig. 9 that the changing characteristics and values for the inner diameter of ring under medium and low speed loading (0.15 mm/s, 1.5 mm/s) are close to each other,which is obviously different from the changing characteristic and value at 15 mm/s.
According to the experimental data,the magnitudes of friction are μ=0.17-0.195 and m=0.38-0.46 in this study. So the load curves of FEA for Coulomb friction model and Tresca friction model under the limit values (μ=0.17,μ=0.195 and m=0.38 and m=0.46) of friction are given in Fig.10.The load curves of FEA used other frictional values should be between the above-mentioned limit curves. The experimental data of load in Fig. 10 are the load at the corresponding reduction in height of compressed ring specimens in Section 3.
According to the experimental results, the effect of the two lubricants on the load is not obvious,but the loading speed hasa significant effect. The experimental load at 15 mm/s loading speed is significantly smaller than the others, as shown in Fig.10. The predicted load by Tresca friction model is similar to that by Coulomb friction model.It can be clearly seen from Fig. 10 that the predicted loads by two friction models are approaching to the experimental load at 15 mm/s.This further verifies that in the ring compression test, the sensitivity of the ring geometry to the friction conditions is much greater than the sensitivity of load to the friction conditions. It also proves that the direct contribution of friction to the load is not large,and generally does not exceed 5%.

Table 5 Magnitude of friction under 0.15 mm/s and MoS2 lubrication.

Table 6 Magnitude of friction under 1.5 mm/s and MoS2 lubrication.

Table 7 Magnitude of friction under 15 mm/s and MoS2 lubrication.
Based on the analysis about ring geometry, compressed load and the analysis in Section 3, it can be found that the frictional behaviors are similar under medium and low loading speed (0.15 mm/s, 1.5 mm/s), which is obviously different from that under high loading speed (15 mm/s). Therefore, in the following discussion, only the morphology, surface texture, and performance characteristics of the compressed ring under the loading conditions of 0.15 mm/s and 15 mm/s were discussed.
4.2. Surface topography
According to the measurement positions on the surface(upper surface) of the compressed ring proposed in Section 2.3, the surface topographies of the ring during the compression process are shown in Figs. 11-14.
Fig.11 shows the change of the three-dimensional topography of the ring surface under oil lubrication and 0.15 mm/s with the increasing reduction in height. It can be found that the surface has a smoother stripe-like vein within smaller reduction. When the reduction increases to a certain value(i.e. deformation threshold), the surface topography changes greatly. That is, the initial smooth stripe topography becomes steep and jagged stripe topography.The large plastic deformation, the high load and the large relative slip between die and workpiece will lead to poor lubricating effect,and the new surface directly contacts the die, which further reduces the lubrication effect.During the ring compression process lubricated by oil, the deformation and surface pressure increaseafter the deformation threshold, and the relative slippage between the die and the ring surface also increases,and these will result in oil overflowing and the lubricant film breaking. In addition, the direct contact surface increases,and thus the lubricating effect is significantly reduced and the friction increases. So that the surface shows a steep and jagged shape, as shown in Fig. 11 (c) and (d).
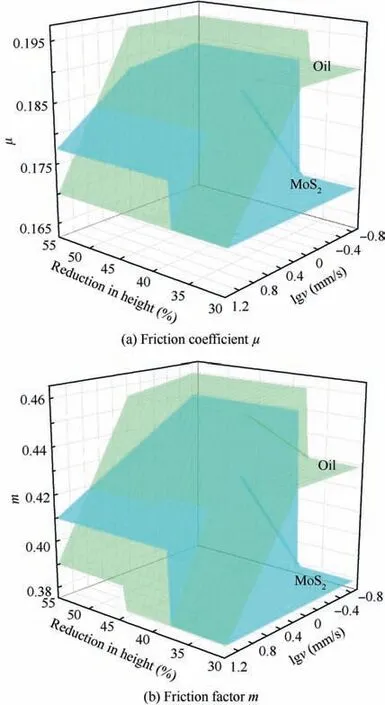
Fig. 6 Magnitudes of friction during ring compression process.
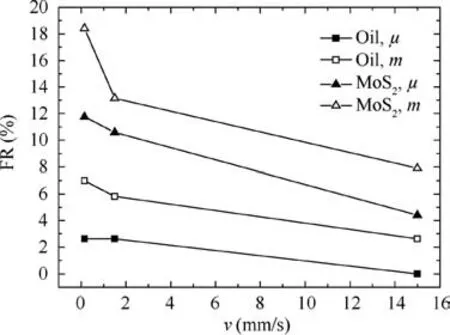
Fig. 7 Change rates of friction during ring compression.
At lower loading speeds, the change rate FR of magnitude of friction is larger, and the surface topography of the compressed ring before and after the deformation threshold is significantly different. However, at the highest loading speed, the surface topography also changes with the increase of the reduction in height,but the degree of change is relatively smaller,as shown in Fig.12.During the cold forming process,the more lubricating oil and the large relative sliding speed between die and workpiece are beneficial to form a lubricating oil film, that is, the real contact area is relatively smaller.When the oil lubrication is used at 15 mm/s, the deformation speed is fast, and the relative sliding speed between the die and the surface of ring specimen is larger,so the oil spill is relatively small. Therefore, the lubricating effect is better than that at lower speeds loading conditions, and then the friction is smaller (as shown in Fig. 4), and the degree of change for surface topography is relatively small.
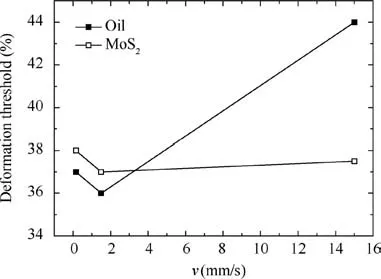
Fig. 8 Deformation thresholds.
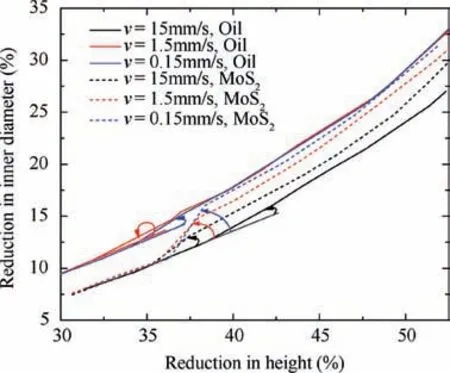
Fig. 9 Percentage curve for change in inner diameter of compressed ring.
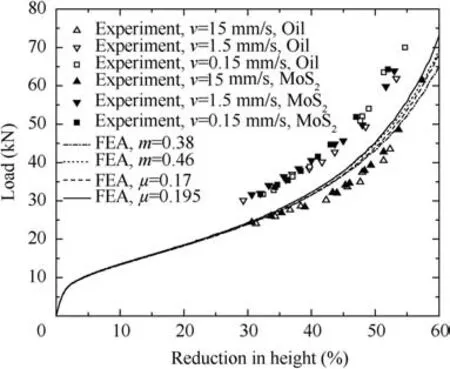
Fig.10 Comparison of experimental load and predicted load by FEA.
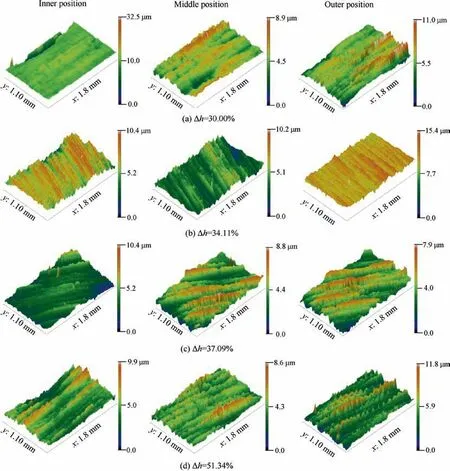
Fig. 11 Three-dimensional topography of ring surface under 0.15 mm/s and oil lubrication.
Similarly, when the reduction in height is small in the ring compression process lubricated by the MoS, most of the surface area at both higher and lower loading speeds maintains a relatively smooth stripe topography, although have fewer topography is relatively steep and jagged. However, because the fluidity of grease is worse than that of oil, so it can still retain more grease in the action zone at lower loading speed,and a part of the sawtooth profile is prevented from directly contacting the die surface due to small load. So the friction condition is better than that lubricated by oil. However, as the reduction in height reaches a certain value, a relatively large area of depression appears on the outside of the ring at 0.15 mm/s loading speed and Δh=52%, as shown in Fig. 13.
There are two possible reasons for this: (i) the grease isn’t fully diffused out due to uneven surface, and the grease is squeezed between die and surface of the compressed ring by a large load, which cause the grease sinks into the dents of the stripes and then the dents are further squeezed,so it results in appearance of deeper pits; (ii) the softer surface of compressed ring is adhered to the harder surface of die, and the softer surface is torn to form a large exfoliation and the pit expands into a deep gully with the relative sliding.As a result,the lubricating effect is weakened, the friction condition is deteriorated and the magnitude of friction has a large change.Thus, the change rate FR of magnitude of friction lubricated by MoSis larger than that lubricated by oil, as shown in Fig. 7. The discontinuous pits are also formed on the surface of the ring under a large reduction in height at high loading speed such as 15 mm/s,and they hinder the local flow of lubricant and limit its lubricating effect.However,the FR is smaller than that at low loading speeds due to the large relative sliding speed and the short interaction time.
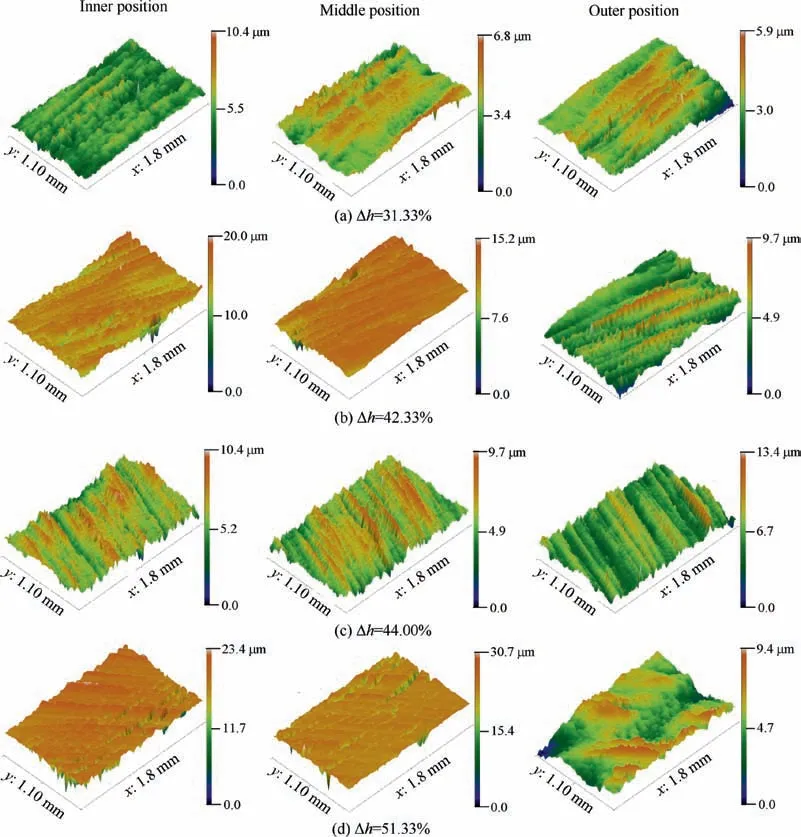
Fig. 12 Three-dimensional topography of ring surface under 15 mm/s and oil lubrication.

Similarly, the surface roughness of ring specimens lubricated by MoSis shown in Fig. 16. The surface roughness changes abruptly in the deformation range where the friction condition changes, which is much larger than that in other deformation ranges. At the loading speed of 0.15 mm/s, when the reduction is within the range from 36.33% to 38.33%, the radial roughness increases by about 185%-215%, and the circumferential roughness increases by about 110%-125% in outer, middle and inner regions. At the load speed of 15 mm/s, when the reduction is within the range from 35.33% to 37.50%, the radial roughness increases by about 60%-190% and the circumferential roughness increases by about 60%-85% in outer, middle and inner regions.
To some extent, the surface roughness represents the characteristic of surface topography, and surface roughness is a quantitative description. Thus, the change of surface roughness is similar to that of surface topography, and the essential reasons are also the same. When the degree of deformation exceeds the deformation threshold, the friction mechanism changes. The occurrence of plough and adhesive friction causes the ring surface to be torn and scratched,so the surface topography becomes worse and the value of surface roughness increases sharply.
The above analysis shows that the surface topography and roughness of the compressed ring continuously change with the increase in the reduction. Especially, the two will deviate from the initial change trend when the reduction reaches a certain value, which may be one of the important reasons for the change of magnitudes of friction. The change of roughness near the deformation threshold under higher loading speed is also smaller than that under lower loading speed, and the change degree of roughness under MoSlubrication is also much larger than that under oil lubrication.These phenomena have the same effects as the loading speed and lubricant on the change rate FR of magnitudes of friction, which proves relevant conclusions about the change of friction from the other aspect.It also proves that the friction conditions change before and after the deformation threshold.
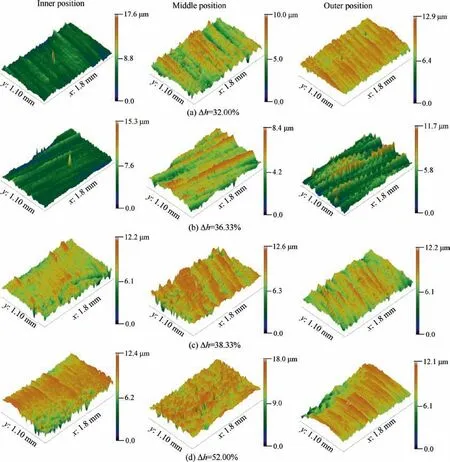
Fig. 13 Three-dimensional topography of ring surface under 0.15 mm/s and MoS2 lubrication.
4.3. Surface texture
The roughness and topography at three observation positions along the radial direction of ring surface have the same changing trend, and the middle region occupies most of the contact area. So the middle region of the surfaces was chosen as the observation area for scanning electron microscope. These surface textures are shown in Figs. 17-20. The surface characteristics of compressed ring before and after the change of magnitudes of friction were further explored.
The surface texture of the ring continues to evolve with increasing reduction in height, as shown in Fig. 17, especially the surface texture sharply changes around the deformation threshold. When the reduction is less than the deformation threshold (37%), such as Δh ≤34.11% in Fig. 17, some lubricant is still captured between the contact surfaces due to small reduction, so the direct contact between the die and the ring surface is blocked, to a certain extent. Thus, the surface has only gentle scratches, as shown in Fig.17(a) and (b). When the reduction is larger than the deformation threshold, such as Δh ≥37.09% in Fig. 17, the contact time is longer due to the larger reduction and lower loading speed,and the lubricant continuously overflows.Then,it further causes the breakage of the lubricant film, and the direct contact surface increases rapidly. Thus, the harder die plows the softer ring surface,which results in a large number of uneven, deep and densely arranged scratches, as shown in Fig.17(c) and 17(d). There are some materials from ring surface adhere to the die under large pressure,and adhesion material is torn from the ring surface to form a large number of surface defects and wear debris with the relative sliding motion. It is likely to cause a jump in magnitudes of friction.
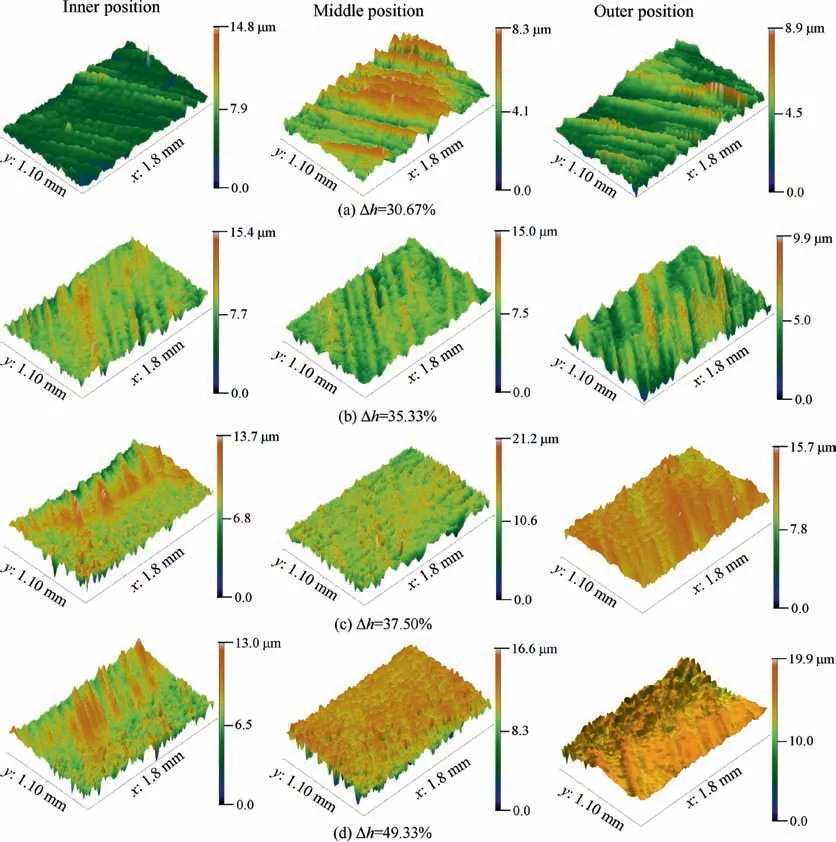
Fig. 14 Three-dimensional topography of ring surface under 15 mm/s and MoS2 lubrication.
The surface texture under higher loading speed also changes with the increase of reduction, as shown in Fig. 18.But compared with the significant change under lower loading speed, the change is less obvious. This is due to less lubricant overflowing and less real contact area between the die and the ring surface under the higher loading speed and shorter interaction time. The convex peak of the harder die surface plows the softer surface of ring to form scratches. However,there is less adhesive friction, so there are less wear and tear on the surface of the compressed ring. Therefore, within the range of 30%-60%reduction in height,the friction coefficient remains unchanged at 0.17, and the friction factor changes from m=0.38 to m=0.39, which only increases by 2.63%.
The same phenomenon can also be observed under MoS2 lubrication.Compared with oil lubrication,the change is more significant. The surface texture changes significantly with increasing reduction at lower loading speeds.When the reduction is less than the deformation threshold (38%), such as Δh ≤36.33% in Fig. 19, the surface texture of the ring is conducive to lubrication, and the friction conditions are good, as shown in Fig.19(a) and (b). However, as the loading time gradually increases, the grease is also further squeezed out of the surface to make the increase of direct contact areas, and the die directly plows and tears the part of the ring surface,and then severe friction occurs. At the same time, the grease trapped between the active surfaces flows into the valley,which further squeezes the pits under the action of large pressure.The pits lead to the deepening and spreading of the scratches,and gradually form fissure-like grooves,as shown in Fig.19(c)and (d), which causes the friction conditions to change significantly before and after the deformation threshold.
Similarly, compared with the lower speed, the surface texture of the compressed ring lubricated by MoSis also smoother at higher loading speed, as shown in Fig. 20.Although the number of scratches on the surface of the plow increases with increasing reduction, relatively more lubricant is trapped and less abrasive debris is generated due to shorter interaction time. So the change in friction conditions before and after the deformation threshold is relatively smaller.
In summary, the number of scratches by plowed increases as the reduction increases, if only a small amount of adhesive tearing debris is generated, then the change in magnitude of friction before and after the deformation threshold is smaller;on the contrary,if a large number of material tears on the surface of the ring due to adhesion,and the wear debris and long grooves adhere to the surface of the ring,then it indicates that the interaction on the surface between ring and die is poor,and the magnitude of friction changes greatly before and after the deformation threshold.
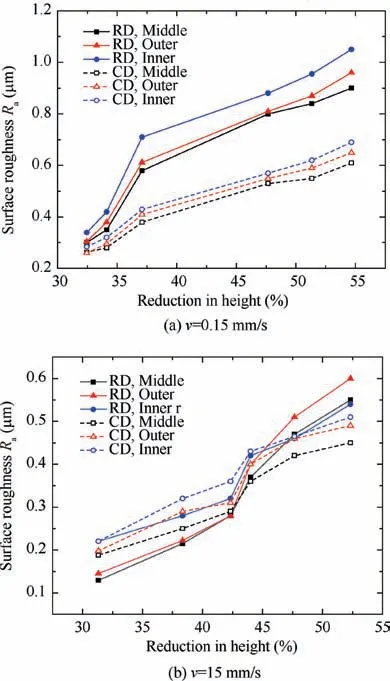
Fig. 15 Variation of surface roughness under oil lubrication.
4.4. Deformation and texture
Friction on the surface of ring strongly affects the material flow behavior during compression process,and results in inhomogeneous strain distribution in the compressed ring, as shown in Fig. 21. The ring cross-section can be divided into hard deformation zone, small deformation zone and easily deformation zone according to the magnitude of the strain.This is similar to the upset deformation characteristics of a cylinder with friction, but the inside and outside deformation of the compression ring section are asymmetric: the inside deformation is less than that the outside deformation in the hard deformation zone, and the inside deformation is greater than the outside deformation in the easy deformation zone,as shown in Fig. 21. Zhang et al.also pointed out that the inhomogeneous microstructure distribution characteristics for the compressed ring of aluminum alloy AA1050, and divided the ring section into 7 deformation zones.
In order to quantitatively analyze the inhomogeneous characteristics of the strain distribution on the surface of the compressed ring, the maximum, minimum and average values of strain on the subsurface plane/line (about 100 μm from the surface, as shown in Fig. 21) of the compressed ring at 52%reduction in height were taken for quantitative analysis, as shown in Fig. 22. Take the 1000 points on the subsurface plane/line shown in Fig. 21 to calculate the average value,and the strain inhomogeneity is represented by inhomogeneity index C, which is calculated by Eq. (5).
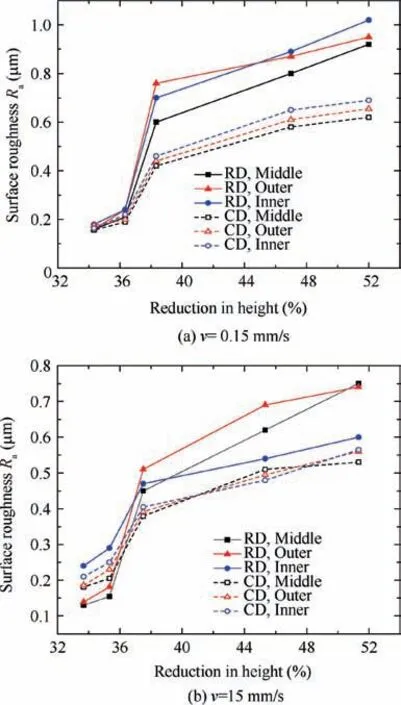
Fig.16 Variation of surface roughness under MoS2 lubrication.
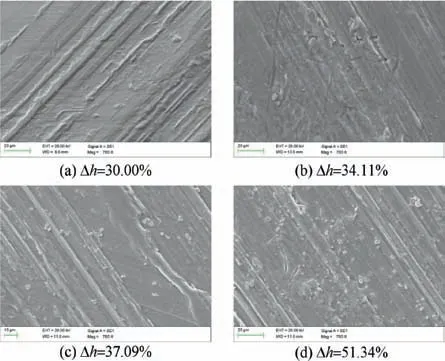
Fig.17 Surface texture of compressed ring under oil lubrication and 0.15 mm/s.

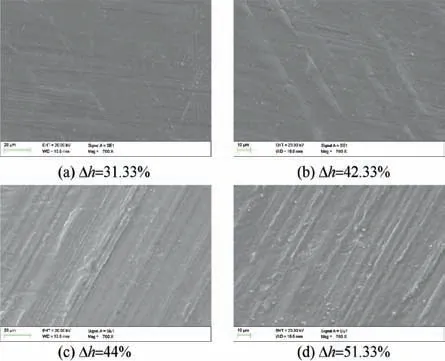
Fig.18 Surface texture of compressed ring under oil lubrication and 15 mm/s.
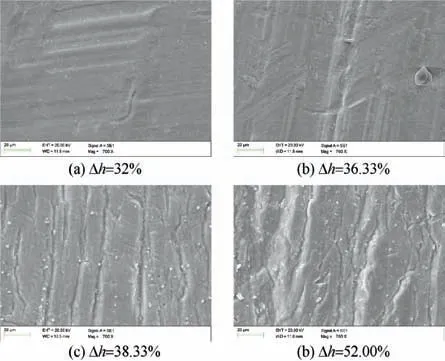
Fig. 19 Surface texture of compressed ring under MoS2 lubrication and 0.15 mm/s.
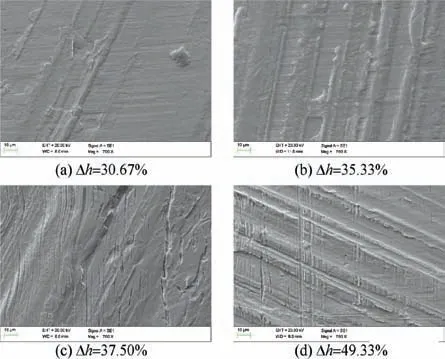
Fig. 20 Surface texture of compressed ring under MoS2 lubrication and 15 mm/s.
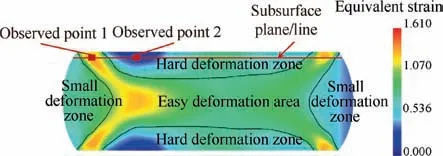
Fig. 21 Equivalent plastic strain of a ring specimen with δh=52.00%,m=0.45.
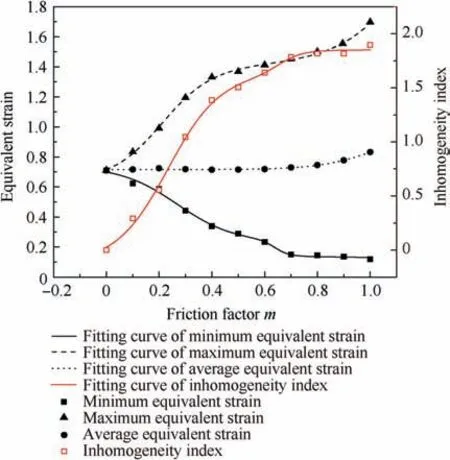
Fig. 22 Strain parameters on the subsurface plane/line at Δh=52%.
As shown in Fig. 22, it can be found that the minimum strain value in the hard deformation zone (observed point 2 shown in Fig.21)gradually decreases as the friction conditions increase, and the maximum strain value in the easy deformation zone (observed point 1 shown in Fig. 21) gradually increases as the friction conditions increase, but the average strain is almost constant. The corresponding strain inhomogeneity index gradually increases. These indicate that the degree of inhomogeneity deformation of the subsurface increases with the surface friction increases.Under the friction conditions (m >0.7) closing to dry friction, the minimum strain, maximum strain, and strain inhomogeneity index change gently.
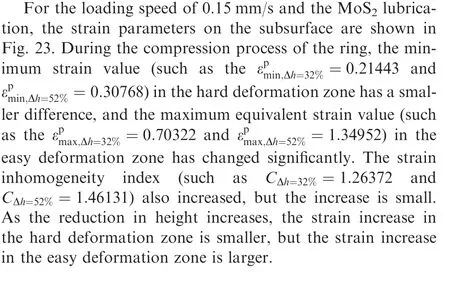
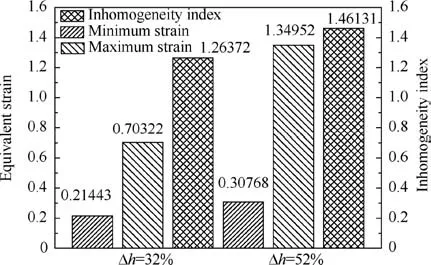
Fig. 23 Strain parameters on subsurface plane/line at chosen reduction.
The grain orientation of the material at the contact area between die and specimen is affected by inhomogeneous local plastic deformation and shear stress. An EBSD analysis was performed in the easy deformation zone (observed point 1 shown in Fig. 21) and the hard deformation zone (observed point 2 shown in Fig. 21) of the subsurface area of the ring specimen.
For metals with a face-centered cubic structure, {111} is their slip surface, so the best crystallographic texture of such metals is often represented by {111} pole figures. Therefore,only {111} pole figures are listed, where Yis parallel to the direction of the compression direction and Xis parallel to the radial direction of ring, as shown in Figs. 24 and 25.
At 32%reduction in height,part of the initial cubic texture in the hard deformation zone (ε≈0.21443) from the subsurface is transformed into S orientation components and copper orientation components, as shown in Fig.24(a). However, in the easy deformation zone (ε≈0.70322), the density of the S orientation components is the largest,and the cubic orientation texture further disappears,and the copper orientation texture is converted to the brass orientation components, as shown in Fig.24(b). Therefore, when the friction is relatively smaller, the shear stress is smaller and it is difficult to form a sufficient amount of shear texture, so the deformation texture is dominant.

Fig. 24 Crystal pole figure on subsurface plane/line at Δh=32%.

Fig. 25 Crystal pole figure on subsurface plane/line at Δh=52.00%.
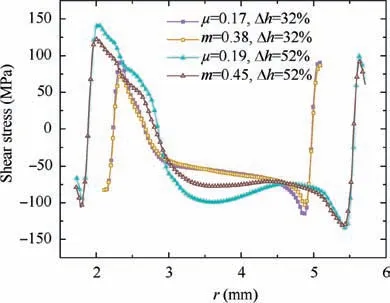
Fig. 26 Shear stress distribution on the subsurface plane/line.
5. Conclusions
(1) There is a deformation threshold during the ring compression process of AA5052, and the magnitude of friction (μ, m) changes before and after the deformation threshold. Within the range of 0.15-15 mm/s, the deformation threshold for change in magnitude of friction(μ,m)under MoSlubrication is almost a constant,such as about 37.5% (37-38%) reduction in height; but the deformation threshold under oil lubrication depends on the loading speed, which is about 36% (36% and 37%) reduction at medium and low loading speeds(0.15 mm/s and 1.5 mm/s),and is about 44%at the high loading speed (15 mm/s).
(2) Under MoSlubrication, the magnitudes of friction before deformation threshold are μ=0.17 and m=0.38;but the magnitudes of friction after deformation threshold are μ=0.19 and m=0.45 at 0.15 mm/s,μ=0.188 and m=0.43 at 1.5 mm/s, μ=0.1775 and m=0.41 at 15 mm/s, respectively. Under oil lubrication, the magnitudes of friction before deformation threshold are μ=0.19 and m=0.43 at 0.15 mm/s and1.5 mm/s, μ=0.17 and m=0.38 at 15 mm/s,respectively; and the magnitudes of friction after the deformation threshold are μ=0.195 and m=0.46 at 0.15 mm/s, μ=0.195 and m=0.455 at 1.5 mm/s,μ=0.17 and m=0.39 at 15 mm/s, respectively.

(4) Frictional conditions change the local material flow characteristics of the ring surface and affect the crystal structure. The increased friction promotes the generation of shear deformation texture. Before the deformation threshold, the texture is dominated by deformation texture such β-oriented deformation texture on the subsurface of the compressed ring specimen;while the texture is dominated by shear texture such as{001 }〈110 〉, {hkl }〈110〉 and {111 }〈uvw〉 in both hard and easy deformation zones after the deformation threshold.
Declaration of Competing Interest
The authors declare that they have no known competing financial interests or personal relationships that could have appeared to influence the work reported in this paper.
Acknowledgements
The authors would like to gratefully acknowledge the supports of the National Natural Science Foundation of China (No.51675415).
 CHINESE JOURNAL OF AERONAUTICS2021年5期
- CHINESE JOURNAL OF AERONAUTICS的其它文章
- Ferrofluid moving thin films for active flow control
- Preliminary study on heat flux measurement data of TT-0 flight test
- An analysis and enhanced proposal of atmospheric boundary layer wind modelling techniques for automation of air traffic management
- Jet sweeping angle control by fluidic oscillators with master-slave designs
- Hot deformation behavior and microstructure evolution of the laser solid formed TC4 titanium alloy
- Electrochemical trepanning with an auxiliary electrode
