Application of focused laser differential interferometer to hypersonic boundary-layer instability study
To YU, Youde XIONG, Jiqun ZHAO, Jie WU,b,*
a School of Aerospace Engineering, Huazhong University of Science and Technology, Wuhan 430074, China
b Hubei Key Laboratory of Engineering Structural Analysis and Safety Assessment, Wuhan 430074, China
KEYWORDS Bicoherence analysis;Focused laser differential interferometer;Hypersonic boundary-layer instability;Non-intrusive measurement;Wind tunnel experiment
Abstract Accurate prediction of hypersonic boundary-layer transition plays an important role in thermal protection system design of hypersonic vehicles.Restricted by the capability of spatial diagnostics for hypersonic boundary-layer study,quite a lot of problems of hypersonic boundary-layer transition,such as nonlinearity and receptivity,remain outstanding.This work reports the application of focused laser differential interferometer to instability wave development across hypersonic boundary-layer on a flared cone model.To begin with,the focused laser differential interferometer is designed and set up in a Mach number 6 hypersonic quiet wind tunnel with the focal point in the laminar boundary-layer of a 5 degree half-angle flared cone model. Afterwards, instability experiments are carried out by traversing the focal point throughout the hypersonic boundary-layer and the density fluctuation along the boundary-layer profile is measured and analyzed.The results show that three types of instability waves ranging from 10 kHz to over 1 MHz are co-existing in the hypersonic boundary-layer, indicating the powerful capability of focused laser differential interferometer in dynamic response resolution for instability wave study in hypersonic flow regime;furthermore, quantitative analyses including spectra and bicoherence analysis of instability waves throughout the hypersonic boundary-layer for both cold and heated cone models are performed.
1. Introduction
Hypersonic laminar/turbulent boundary-layer transition is one of the most important issues for hypersonic vehicles design.Although quite large effort has been devoted to this topic in the past 70 years, only a partial knowledge of hypersonic boundary-layer transition has been obtained so far due to the complexity of hypersonic instability waves.The insufficient understanding of hypersonic boundary-layer transition mechanism precludes accurate prediction of transition location, and further affects the deployment of thermal protection system and also the trajectory design of hypersonic vehicles.1For example, an accurate prediction of transition location can lead to a reduction of 20% of the total vehicle weight in re-entry vehicles according to Wendt.For the sake of better understanding of transition mechanism of hypersonic boundary-layer, consistent effort must be put on instability and transition studies.
As one of the major approaches for hypersonic boundarylayer instability and transition study, wind tunnel experiment plays a relatively important role due to its capability to reproduce part of the real flight condition, such as Mach and Reynolds numbers. Even though quite a large number of new findings have been obtained based on hypersonic wind tunnel experiments, such as the non-linear interactions of instability waves,transition control methods,receptivity process,cross flow instability on delta wingand dilatational waves,all the previous hypersonic boundary-layer instability experiments were quite restricted by measurement techniques,due to the very high frequency of instability waves in hypersonic regime and also the harsh experimental environment of hypersonic flows. For instance, the frequency of second mode instability wave is generally around several hundred kilo Hertz (kHz) and its harmonic is even over mega Hertz (MHz),which is challenging for hot-wire anemometry and flush-mounted sensors. Furthermore, hotwire anemometry or similar instruments can hardly survive in hypersonic wind tunnels with high enthalpy, such as shock tunnels or gun tunnels.Last but not least, the property of instability waves across boundary-layer is of great importance in the understanding of boundary-layer transition mechanism,and the corresponding diagnostic capable of boundary-layer profile qualification is thus required.
As a non-intrusive diagnostic technique, Focused Laser Differential Interferometer (FLDI) has attracted quite a lot of attention in recent years. This method was proposed by Smeets in the early 1970 s for the application of wind tunnel experiment.Since attention was not on high-speed flow at that time, the application of FLDI did not attract people’s attention, though hypersonic boundary-layer transition research was ongoing at that time. Several other work done by Laderman and Demetriades,and O’Harealso involved laser differential interferometer, but their systems were set up in the way of line-of-sight integrating. Stimulated by the need of hypersonic boundary-layer instability experiment in T5 reflected shock tunnel, Parziale et al. built a FLDI system and succeeded to measure the freestream disturbance and instability waves on a slender cone model in T5 tunnel recently,but without attempt to resolve the instability waves along the boundary-layer profile. Not long after that,Fulghum and Settlesapplied FLDI for the freestream disturbance measurement in supersonic wind tunnel by replacing the Wollaston prism with Sanderson prism, and smaller sensitive region was achieved. Jewell et al. measured the phase velocity of disturbance in turbulent jets using D-FLDI system.More recently, Ceruzzi and Cadou applied FLDI in the noise study of turbulent air jetAlthough the application of FLDI spreads fast on different topics of aerodynamics in recent years, few has been done on the instability wave evolution of hypersonic boundary-layer along both streamwise and wall-normal directions. For the sake of in-depth insight of instability waves across hypersonic laminar boundary-layer,high-dynamic response instrument is required,and thus FLDI is employed to measure the behavior of the hypersonic instability waves of a 5 degree half-angle flared cone model at Mach number 6 quiet wind tunnel in Peking University.
The objective of this work is to reveal the property of instability waves throughout the extremely thin hypersonic boundary-layer. This paper is organized as follows. Firstly,the experiment setup of hypersonic instability is introduced with an emphasis on the working principle of FLDI;secondly,the FLDI technique is validated by a surface mounted highfrequency sensor; thirdly, the hypersonic instability experiments are conducted for both cold and heated flared cone model; finally, qualitative analysis is provided on the instability waves before concluding remarks are made.
2. Experimental setup and diagnostics
2.1. Hypersonic wind tunnel
The experiment was conducted in the ∅120 Mach number 6 quiet wind tunnel of Peking University, which is one of the few operational hypersonic quiet wind tunnels over the world according to Schneider,as shown in Fig. 1. The operation mechanism of the tunnel has been elaborated in previous work,and thus only a brief introduction will be given herewith.This quiet wind tunnel can be operated in both noisy and quiet modes by switching throat bleeding,and each tunnel run can last for 30 s with stagnation pressure variation within 3% deviation. To avoid flow condensation of the hypersonic freestream, the tunnel is heated up to 433 K, and to have natural transition phenomenon, the stagnation pressure of the tunnel is kept to be 10 bar(1 bar=10Pa), resulting in a unit Reynolds number approximately 10×10/m.
2.2. Flared cone model
To have a whole picture of the transition process, a 5 degree half-angle flared cone model was used as experiment model for hypersonic boundary-layer instability experiment, as shown in Fig. 2. This cone model has an overall length of 0.26 m, of which the first 0.0988 m is a conical cone with 50 μm tip radius. The surface of the flared cone is highly polished to permit a natural transition process. Furthermore, the model can be heated by electricity rod,and in current measurement campaign, the surface temperature of cone model is heated to 300 K (cold cone) and 425 K (heated cone) respectively for the influence investigation of wall temperature on instability waves.
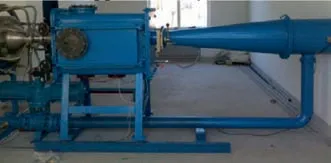
Fig. 1 Mach number 6 Quiet Tunnel (M6QT) in Peking University.
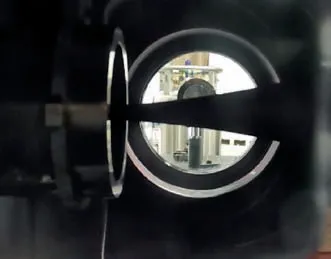
Fig. 2 5 degree half-angle flared cone model installed in the test section of M6QT.
2.3. Focused laser differential interferometer
As a non-intrusive technique, FLDI can measure the density fluctuation of a small volume in three-dimensional flow field with high spatial and temporal resolutions. The working principle of FLDI will be briefly introduced, as it has been elaborated in several publications.
A sketch of FLDI setup is given in Fig. 3, and the overall optical system is conjugate. First, a laser emits coherent light as the light source, and after that a concave lens (C1)diverges the laser beam through a polarizer (P1) and Wollaston prism(W1) before it reaches the convex lens (C2). As the divergent laser beam passes by the Wollaston prism, the single beam is separated into two orthogonally polarized beams with small separation angle. These two separated beams will converge with the aid of convex lens (C2). Due to the small separation angle of the Wollaston prism,these two orthogonally polarized beams will be separated with certain distance at the focal point,as shown by ΔX in Fig.4.Before these two orthogonally polarized beams converge to the focal point,they share almost the same optical path and thus no phase difference is assumed to be introduced.However,at the focal point,these two beams are converged and do not share the same optical path, as seen from the sensitive length L in Fig. 4, and this small volume is defined as the probe of FLDI system.Thus, any inhomogeneity of the flow within this range will produce an Optical Path Length (OPL) difference, as expressed by

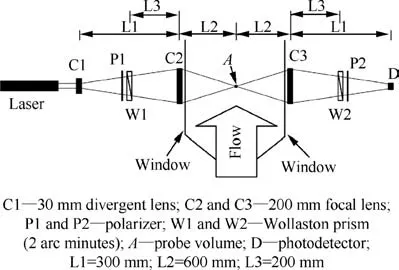
Fig. 3 Sketch of FLDI setup.
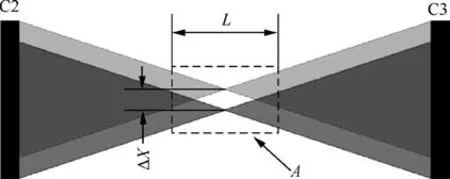
Fig. 4 FLDI optical path length (OPL).
where nand nare the refractive index of the flow, and L is the sensitive length indicated in Fig. 4. Due to such an OPL difference,the phase difference(Δφ)of these two orthogonally polarized beams will be generated accordingly,

in which λis the wavelength of the laser. Substituting the Gladstone-Dale relationship into Eq. (2), the phase difference can be expressed as Eq.(3).K is the Gladstone-Dale constant,and ρ is the density.By far,the density of the flow is associated with the phase difference.

Beyond the focal point, the beams are re-converged by C3.Another Wollaston prism (W2) and polarizer (P2) will recombine the orthogonally polarized beams, and finally the re-combined beam will be registered as irradiance by photodetector (D). Assume Iand Iare the irradiances of the two orthogonally polarized beams, l·lis the unit vector’s dot product of beams and the resultant irradiance at the photodetector surface and the phase difference of two beams are:

By replacing the irradiance to the potential response of the photodetector, the relationship between density fluctuation and output voltage of DAQ system is established as

where V is the potential response of the photodetector, and it can be expressed by V=IRR,in wich R denotes the responsivity of the photodiode and Ris the load resistance. Vcorresponds to the most linear part of a fringe before each experiment, and it can be expressed by V=2IRR.
2.4. Data analysis and reduction
2.4.1. Spectral analysis
The Fourier transform of time trace S(t) and power spectrum are defined as

where E denotes an expected value, S is the discrete Fourier transform,and the superscript*denotes the complex conjugation. The power spectral density is estimated using Welch method with hamming window (50% overlap, 4096 points per window), resulting in a frequency resolution of 0.73 kHz.
2.4.2. Bicoherence analysis
Due to the co-existence of various instability waves in hypersonic laminar boundary-layer, bispectrum is used to analyze the nonlinear phase-coupled interactions of instability waves.The bispectrum is a statistical method for evaluating the degree of phase coherence among a wave triad due to wave coupling.

If the triad of waves f,fand(f+f)are nonlinearly coupled,the bispectrum is a nonzero value.Compared with power spectrum, the bispectrum retains the information of wave phase, allowing the identification of phase-coupled waves.Since the value of bispectrum depends on the amplitude of wave, the bispectrum is generally thus normalized as follows:By such a normalization, the right-hand side of Eq. (9) is called bicoherence, indicating the degree of phase coupling with frequencies of f,fand(f+f),however with the value between 0 and 1.As the bicoherence is symmetry, the efficient area to calculate the bicoherence is restricted in the triangle region defined as


In this work, the bicoherence is calculated from time-series data using a Hamming window with 50% overlap and the points of each window is 1024. Considering that the sampling frequency of data acquisition system is 3 MHz, the frequency resolution of bicoherence comes to 2.9 kHz.
3. Experiments and result analysis
3.1. Experiment setup and validation
Based on the principle introduced in Section 2,a FLDI system was built and applied in M6QT at Peking University,as shown in Fig. 5. A commercial Helium-Neon laser was used as the light source and it emits polarized light with a wavelength of 632 nm. The beam diameter is 0.8 mm and its divergence is 1.3 mrad. The overall system was designed in periscope arrangement for precise directional control as recommended by Parziale et al.The beam is first expanded by C1(f= -30 mm) and then focused by C2 (f=200 mm) in the desired location above the flared cone model. The Wollaston prism (2 arc minutes) is allocated at the focus of focusing lens C2 and splits the beam into two orthogonally polarized beams by small separation angle.Due to such a setup,the separation of the beams is fixed at 232.7 μm by C2. Since the overall system is conjugate, the separated beams will be recombined and focused on the light receiving side,as seen from C2 and W2 in Fig. 5(b).
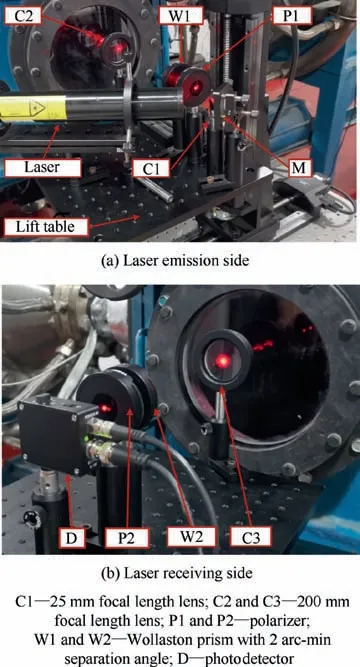
Fig. 5 FLDI setup in M6QT at Peking University.
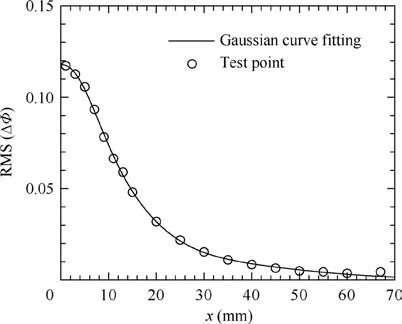
Fig. 6 Sensitive length of FLDI system.
Based on the above experiment setup, the two beams overlap most of their paths except the focused region,as shown by L in Fig. 4.This focused region is elongated along the line-ofsight direction as a result of the focusing lens, and it is necessary to determine this sensitive length. A COjet with exit diameter of 0.7 mm was placed at 4 mm away from the beam and traversed along the line-of-sight direction. The standard deviation of the output voltage of FLDI is calculated and given in Fig. 6. It demonstrates that the sensitive region exhibits Gaussian distribution and the 1/e folding in Root Mean Square (RMS) response is approximately 28 mm from the focus. However, this sensitive length is much larger than the length inside the hypersonic boundary-layer when beams are passing by. Considering that the density fluctuation in boundary-layer with instability waves is expected to be much higher than that in freestream, the influence of the freestream is thus neglected. Thus, the sensitive length was determined to be 8 mm. Moreover, it is worthwhile to note that the FLDI voltage output is related to the density gradient in such a simplified way following Parziale et al.although the interpretation of FLDI signal is rather complex.For more information of FLDI system,the readers are suggested to refer to the work of Fulghum and Settles,Schmidt and Shepherd,Lawson et al.,and Ceruzzi et al.
Thereafter the hypersonic boundary-layer instability experiments were performed. The difficulty in this measurement is the allocation of FLDI focus within the hypersonic boundary-layer due to the small boundary-layer thickness.Taking flared cone as an example, the boundary-layer thickness at x=160 mm is smaller than 1 mm when the surface temperature of cone is 300 K.Thus,this measurement was carried out in such a way that the focus of FLDI system was tuned slightly lower than the cone surface first,where no signal was obtained from the photodetector except the electronic noise; thereafter, the overall FLDI system was lifted slowly by a high-precision lifting platform until the same initial output voltage of the data acquisition system was obtained as that of the freestream,indicating no blockage of laser beam.Due to the volume of focal point and Gaussian distribution of laser beam brightness, the distance of FLDI focus is calculated to be less than 0.1 mm if the center of the rhombus region is taken as the measurement point,as shown in Fig.4.As the wind tunnel completes a single shot, the experiment is repeated under the same flow condition, and the overall FLDI system is shifted with interval of 0.2 mm towards the boundary-layer edge, resulting in a vertical displacement of 0.2 mm, as depicted in Fig. 7. Since the lifting system is isolated from the wind tunnel, the accuracy of the lifting platform can be ensured, as reflected by the same initial value of FLDI system that was observed.
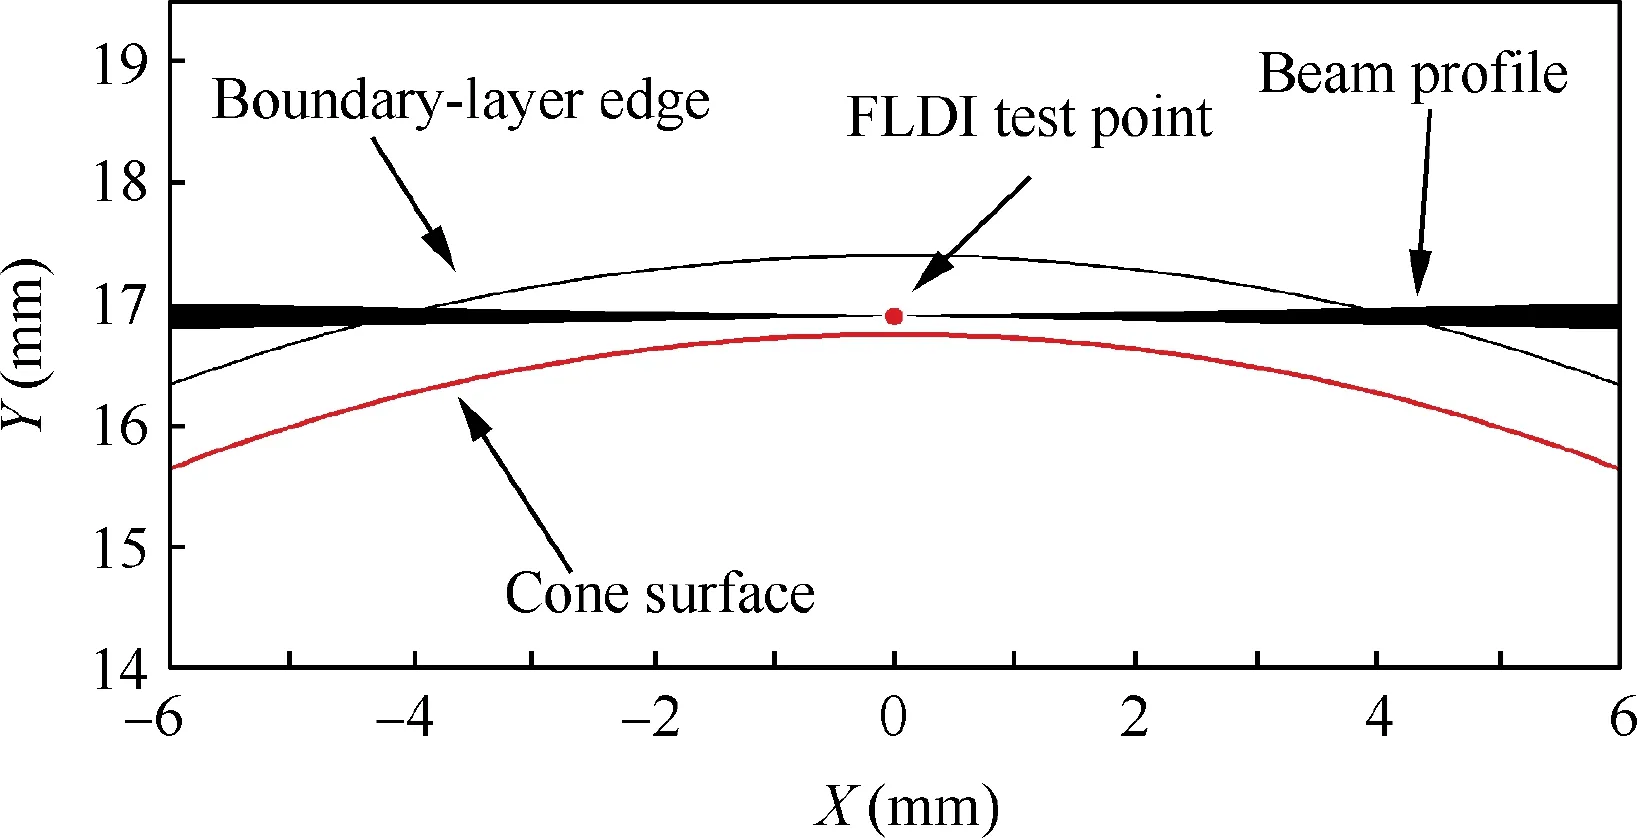
Fig. 7 Measured points across hypersonic boundary-layer of flared cone model.
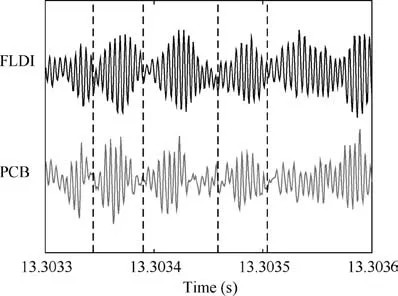
Fig.8 Time transient of FLDI and PCB flush mounted on cone model, x=150 mm, the stagnation pressure of wind tunnel is 9 bar, and the stagnation temperature is 430 K, AOA=0°.
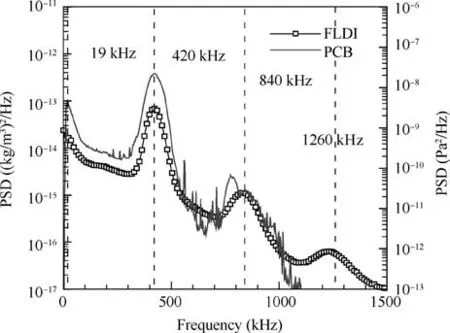
Fig. 9 Power spectral density comparison of FLDI and PCB result.
Next, the FLDI was validated by comparing the output with a surface mounted PCB M132A31 piezoelectric pressure sensor.Although the outputs of FLDI and PCB sensor are different, both instruments are capable of characterizing the instability waves. The high pass filtered time transients of PCB and FLDI signals are depicted in Fig. 8, and one can observe that the wave packages are well captured by both techniques, denoting the availability of FLDI in hypersonic boundary-layer instability study. Furthermore, the Power Spectral Density (PSD) of FLDI and PCB results are compared in Fig. 9. The FLDI appears to have a relatively wide dynamic response up to 1.5 MHz, and more interestingly,one can observe that there are four instability waves coexisting in the hypersonic boundary-layer, including the lowfrequency instability (19 kHz), second mode (420 kHz), first harmonic(840 kHz) and second harmonic (1260 kHz) of second mode instability wave. The characteristics of these instability waves are analogous to those observed by Lachowicz et al.; however, the frequencies of these instability waves are generally much higher. In contrast, the PCB sensor only detects the second mode and its first harmonic although its nominal dynamic response is up to 1 MHz, as shown in Fig. 9. It is worthwhile to point out that difference exists between the PCB sensor and FLDI results at low-frequency domain,which is speculated to be result of uncalibrated FLDI system, and further effort upon this issue will be devoted rather than this work.
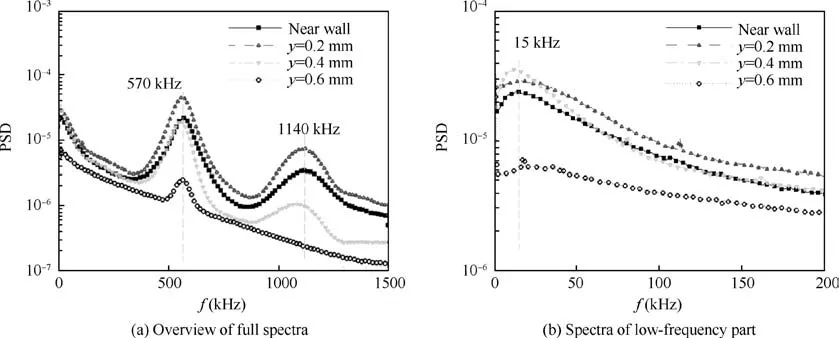
Fig. 10 PSD of density fluctuations at different heights in boundary-layer. The wall temperature of flared cone model is 300 K, the stagnation pressure of wind tunnel is 10 bar, and the stagnation temperature of wind tunnel is 433 K.
3.2. Instability waves measurement and result discussion
The power spectra density of the focus at different boundarylayer heights are given in Fig. 10. In the Fig. 10(a), one can observe boundary-layer instability waves characteristics at frequency of 570 and 1140 kHz. Based on the arithmetic relation and similar experiment by Zhu et al.and Chen et al.,one can recognize these two modes as second mode and its harmonic wave.It is worth noting that the frequency of the second mode in this experiment is higher than that obtained based on the same model by Zhu et al.and Chen et al.This is caused by the misalignment of the flared cone model, and the angle of attack is approximated to be-3°. Since the emphasis of this study is the application of FLDI across hypersonic boundary-layer,and the misalignment of the cone model has no influence on the result, and thus measurement was not performed for another angle of attack. When the focus of FLDI is placed at the reference location just above the surface of the flared cone model,these two instability waves are prominent. As the focus was shifted by an interval of 0.2 mm, the amplitude of the second mode and its harmonic increases.When the FLDI focus approaches further to the boundarylayer edge, these is a significant drop of the second mode harmonic whereas the amplitude of the second mode does not change too much, indicating the disappearance of non-linear wave interactions. At the boundary-layer height of 0.6 mm,the harmonic instability disappears and the second mode decays fast to very low amplitude. The phenomenon was validated by the hot-wire measurement of Stetson et al.,but at a relatively low frequency. As attention is drawn to the lowfrequency part,as seen in Fig.10(b),there is instability characteristic at frequency of 15 kHz, and more interestingly, this low-frequency instability keeps increasing until y=0.4 mm.As the focus of FLDI is close to the boundary-layer edge,the amplitude of the low-frequency mode decreases fast.
Next, the bicoherence contours at different heights across the hypersonic boundary-layer are depicted in Fig. 11. For clarity, the interactions within the triad (0, 0), (f, f), (f,-f)are analyzed, where fis the Nyquist frequency. The dotted lines mark out the triangle edge and the dashed lines mark out the basic interactions f+f=nf, where n=1, 2, 3 and f=570 kHz, denoting the second mode instability wave when the wall temperature of flared cone model is 300 K. At the near wall region, one can observe various phase-locked interactions of instability waves from Fig. 11(a). Sum interactions of (f, f)→2 f, (2 f, f)→3 findicate the nonlinear mechanism that the first (2 f) and second (3 f) harmonics of the second mode instability waves are produced. Note that the symbol →denotes ‘‘generates by phase-locked interaction”.Moreover, it is interesting to notice the existence of nonlinear interaction of even higher harmonics (2 f, 2 f)→4 f. Difference interaction, (2 f, -f)→f, represents the energy exchange between the first harmonics and second mode instability wave through a phase-locked interaction. As the focus of FLDI is shifted to y=0.2 mm,all the nonlinear interactions are enhanced.Besides that,sum and difference interactions involve the second mode, the first harmonic of second mode and low-frequency instabilities, and they are supposed to broaden the sideband of the second mode and its harmonics.When the focal point is moved to y=0.4 mm,the nonlinear interactions between the second mode wave and its harmonics and low-frequency instability become more prominent. As the focal point of FLDI was further moved to the edge of boundary-layer, nonlinear interaction disappears,denoting that the nonlinear interactions are no longer quadratic.
Thereafter the experiment is repeated when the surface temperature of the cone model was heated up to 425 K, and the results are given in Fig.12.In general,the frequency of the second mode and its harmonic is lower than that of the case with wall temperature of 300 K,agreeing with the hot-wire result of Stetson et al.,but the amplitude change of each instability waves is not prominent. At the reference point, both the second mode and its harmonics are observed as well.As the FLDI focus was moved towards the boundary-layer by an interval of 0.2 mm, the amplitudes of the second mode and its harmonic are almost the same as that at the reference point. When the height of FLDI focus is 0.6 mm, both the second mode and its harmonic instabilities have significant increments,and after that the second mode instability decreases slightly while its harmonics decreases relatively fast,which is quite alike to that observed on the cold model at y=0.6 mm.When the focus of FLDI is close to the boundary-layer edge, the second mode decreases fast and the second mode instability disappears. In the same way, the low frequency is analyzed independently.Unlike the second mode instability and its harmonic, the low-frequency mode keeps increasing as the focus of FLDI increases, and when the focus is close to the boundary-layer,the low-frequency mode decreases suddenly to low amplitude.
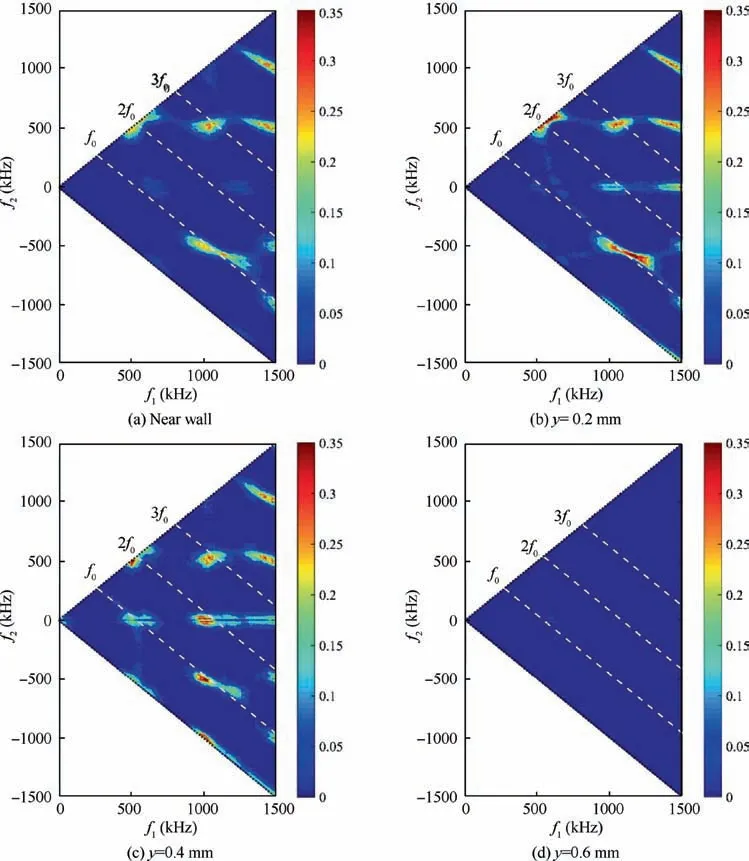
Fig. 11 Bicoherence contour of instability wave interactions across laminar hypersonic boundary-layer, the wall temperature of flared cone model is 300 K, the stagnation pressure of wind tunnel is 10 bar, and the stagnation temperature of wind tunnel is 433 K.
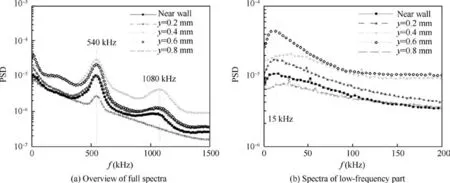
Fig. 12 PSD of density fluctuations at different heights in boundary-layer. The wall temperature of flared cone model is 425 K, the stagnation pressure of wind tunnel is 10 bar, and the stagnation temperature of wind tunnel is 433 K.
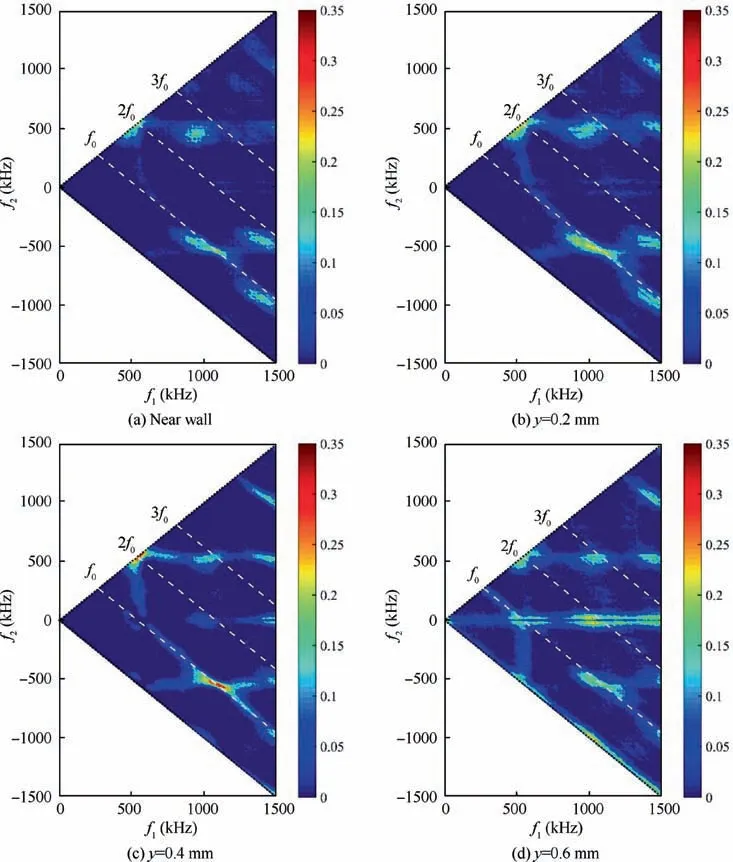
Fig. 13 Bicoherence contour of the instability wave interactions across laminar hypersonic boundary-layer, the wall temperature of flared cone model is 425 K, the stagnation pressure of wind tunnel is 10 bar, and the stagnation temperature of wind tunnel is 433 K.
In the same manner, bicoherence of each measurement height across the hypersonic boundary-layer is provided in Fig.13.At the near wall region,both sum and difference interactions are noticed,but the intensity is smaller than that of the cold model. What’s more, the same phenomenon is observed for other boundary-layer heights as well, indicating the suppression of second mode instability and its harmonics by wall-heating. It is worth noting that at y=0.6 mm for the heated model case the instability waves exhibit various nonlinear interactions, as seen from Fig. 13(d), which is in contrast with that shown in Fig. 11(d). The phenomenon can be explained by the increased boundary-layer thickness due to model heating.
4. Conclusions
In this study we described the application of a focused laser differential interferometer across a hypersonic boundarylayer measurement on a 5 degree half-angle flared cone model.The availability of FLDI system was validated by surface mounted PCB sensor,and good agreement has been achieved.The development of instability waves throughout the hypersonic boundary-layer was measured by traversing the focus of FLDI across the boundary-layer and the corresponding density fluctuation was obtained. PSD results indicate that within the hypersonic boundary-layer there are three types of instability waves, including the low-frequency mode, the second wave mode (Mack mode) and the harmonics of second mode, and these characteristic frequency shifts slightly as the wall temperature was changed from 300 K to 425 K. The amplitudes of second mode and its harmonic generally increase first and then decrease throughout the boundary-layer,agreeing well with the hot-wire results provided by Steston et al.,although the amplitude variation of instability wave does not change much as the wall temperature was improved.The low-frequency instability wave exhibits the same tendency as that of the second mode and its harmonic. Bicoherence analysis was also performed for each measurement point across the hypersonic boundary-layer, and various phaselocked interactions are observed, indicating the nonlinear mechanism across the boundary-layer. In general, the nonlinear interactions are intensive at the near-wall region, while nonlinear interactions are no longer quadratic as the measurement point moves towards the boundary-layer edge. Furthermore, nonlinear interactions are observed to be weaker when the wall was heated, denoting that wall-heating is suppressing the second mode and its harmonics. To summarize, through this experimental study,FLDI has been validated to be a powerful instrument for the instability wave characterization across hypersonic boundary-layers with relatively high dynamic response. In future work, effort will be made to resolve the boundary-layer profile with more measurement points and also the calibration of FLDI system for a more comprehensive study of instability waves in hypersonic flow.
Funding Sources
The authors would like to thank the State Key Laboratory for Turbulence&Complex Systems of Peking University for their support in this study. The support of National Numerical Wind-tunnel (No. 2018-ZT1A03), National Natural Science Foundation of China grant (No.11702106), and Fundamental Research Funds for the Central Universities(2019kfyXKJC001) are gratefully acknowledged.
Declaration of Competing Interest
The authors declare that they have no known competing financial interests or personal relationships that could have appeared to influence the work reported in this paper.
 CHINESE JOURNAL OF AERONAUTICS2021年5期
- CHINESE JOURNAL OF AERONAUTICS的其它文章
- Ferrofluid moving thin films for active flow control
- Preliminary study on heat flux measurement data of TT-0 flight test
- An analysis and enhanced proposal of atmospheric boundary layer wind modelling techniques for automation of air traffic management
- Jet sweeping angle control by fluidic oscillators with master-slave designs
- Hot deformation behavior and microstructure evolution of the laser solid formed TC4 titanium alloy
- Electrochemical trepanning with an auxiliary electrode
