Instability characteristics of a co-rotating wingtip vortex pair based on bi-global linear stability analysis
Zepeng CHENG, Siyi QIU, Yng XIANG,✴, Chun SHAO, Mio ZHANG,Hong LIU
a School of Aeronautics and Astronautics, Shanghai Jiao Tong University, Shanghai 200240, China
b Shanghai Aircraft Design and Research Institute, Commercial Aircraft Corporation of China Ltd., Shanghai 201210, China
KEYWORDS Bi-global linear stability analysis;Perturbation mode;SPIV;Vortex flow;Winglet;Wingtip vortex
Abstract The Stereo Particle Image Velocimetry (SPIV) technology is applied to measure the wingtip vortices generated by the up-down symmetrical split winglet. Then, the temporal biglobal Linear Stability Analysis (bi-global LSA) is performed on this nearly equal-strength corotating vortex pair, which is composed of an upper vortex (vortex-u) and a down vortex(vortex-d).The results show that the instability eigenvalue spectrum illustrated by(ωr,ωi)contains two types of branches:discrete branch and continuous branch.The discrete branch contains the primary branches of vortex-u and vortex-d, the secondary branch of vortex-d and coupled branch, of which all of the eigenvalues are located in the unstable half-plane of ωi >0, indicating that the wingtip vortex pair is temporally unstable. By contrast, the eigenvalues of the continuous branch are concentrated on the half-plane of ωi <0 and the perturbation modes correspond to the freestream perturbation. In the primary branches of vortex-u and vortex-d, Mode Pu and Mode Pd are the primary perturbation modes, which exhibit the structures enclosed with azimuthal wavenumber m and radial wavenumber n, respectively. Besides, the results of stability curves for vortex-u and vortex-d demonstrate that the instability growth rates of vortex-u are larger than those of vortex-d,and the perturbation energy of Mode Pu is also larger than that of Mode Pd.Moreover,the perturbation energy of Mode Pu is up to 0.02650 and accounts for 33.56% percent in the corresponding branch, thereby indicating that the instability development of wingtip vortex is dominated by Mode Pu. By further investigating the topological structures of Mode Pu and Mode Pd with streamwise wavenumbers, the most unstable perturbation mode with a large azimuthal wavenumber of m=5-6 is identified, which imposes on the entire core region of vortex-u. This large azimuthal wavenumber perturbation mode can suggest the potential physical-based flow control strategy by manipulating it.
1. Introduction
The wingtip vortex is a large-scale vortex structure formed at the tip region due to the pressure difference between the upper and lower surfaces of the wing. Since the wingtip vortex persists for a long distance in the wake of an aircraft, this structure inevitably brings about many problems such as wake encounter,induced drag,and aerodynamic noise,which adversely affect the safety,economy,and comfortability of aircraft. Consequently, the Federal Aviation Administration(FAA)of the USA and the International Civil Aviation Organization (ICAO) have set strict limits on the time delay and separation between the leader aircraft and follower aircraft.For instance,when the take-off weight of leader aircraft is over 136000 kg, and that of follower aircraft is at the level of less than 7000 kg, the interval time shall not be less than 159 s,and the separation shall not be less than 6 nautical miles.Besides, the induced drag resulting from wingtip vortex can account for as much as 30%-40% of the total drag.All of these indicate the necessity and scientific value of investigating the characteristics of wingtip vortex.
To alleviate the detrimental effects above, Gerz et al.put forward two strategies from the physical characteristics of wingtip vortex, namely low vorticity vortex strategy and quickly decaying vortex strategy.According to the idea,James and Frankfurther developed these strategies as follows: (A)modifying the vortex by changing the spanwise wing loading of the wing or by triggering out the natural instability in the surrounding flow; (B) accelerating the instability attenuation of wingtip vortex by applying the active control or external perturbation. As an effective method to reduce the strength of wingtip vortex, the winglet has been performed on the aircraft since 1976and has developed diverse forms. There is no doubt that these winglets can reduce the induced drag;however,the current winglets even with many active control strategies still cannot effectively accelerate the attenuation of wingtip vortex.The essential question is because of the insufficient knowledge of the physical control principle of vortex instability.The winglet not only reduces the strength of the wingtip vortex but also changes the structure, thereby significantly affecting the instability characteristics of wingtip vortices. However, the stability analysis on the wingtip vortex system generated by the winglet, likely the split winglet used by A320NEO and B737MAX, is very limited, thus hampering the further optimization of the winglet configurations and improvement of other active flow control strategies.
The instabilities of wingtip vortex include long-wave instability, elliptic instability, and vortex wandering. The longwave instability was first explained by Crowin analyzing the flow of equal-strength counter-rotating Rankin vortices pair,which was mainly caused by the combination of the following three effects:(A)the self-induced rotation opposite to the rotation direction of core fluid;(B)the motion induced by the other vortex;(C)the mutual induced motion of two vortices.Both the experimental results by Leweke and Charlesand numerical results by Gre´goire et al.indicated that the long-wave instability is characterized by a sinusoidal distortion of the vortex pair concerning its central plane symmetry and a 45° tilt with respect to the symmetric plane.The deformation amplitude will gradually increase along the flow direction until the two vortices finally merge. Subsequently, the two vortices will reconnect, and the initial vortex ring will turn into a series of three-dimensional vortex rings after several cycles. As for the elliptic instability, it resulted from the resonance mechanism of the two perturbation waves(also called Kelvin modes)generated by the vortex pair.The resonance phenomenon can lead to the exponential amplification of the perturbation wave,thus causing vortex instability. Under the condition of a low Reynolds number (10-10), as long as the equation of |m-m|=2 is satisfied, the resonance phenomenon will occur, where m, mare the circumferential wavenumbers of the Kelvin modes, respectively. The investigation conducted by Leweke and Charlesshowed that m= -1 and m=1 for the motion of the vortex pair without axial flow. Further, Roy et al.verified that m=0 and m=2 in which the axial flow exists.However,under the condition of higher Reynolds number,this equation should obey|m-m|=3.In this situation,the secondary instability and the reconnection of vortices will occur before the wingtip vortices finally attenuate and break down.With regard to the vortex wandering behavior, it was first discovered by Baker et al.in the water tunnel experiment. Subsequently, Denvenport et al.also confirmed the existence of the vortex wandering phenomenon, and their results showed that the wandering amplitude of the wingtip vortex is gradually amplified along with the streamwise location. Further, the work by Edstrand et al.showed that the least stable mode gained from the local linear stability analysis is consistent with the primary mode obtained by proper orthogonal decomposition method, thus scientifically demonstrating that the vortex wandering comes from the vortex instability.Recently, Cheng et al.and Qiu et al.confirmed that the development of the spatial or temporal instability features along with the streamwise location shares the same trend with the development of wandering amplitude, further fulfilling the recognition of the nature of vortex wandering.
As one powerful tool to investigate the vortex flow under small disturbance, the Linear Stability Analysis (LSA) method has been widely applied to quantitatively analyze the instability characteristic of vortices,for example,to identify the instability modes or to detect the growth rate. In general, LSA contains two categories,namely modalLSAand nonmodalLSA,of which the modal LSA includes local LSA, bi-global LSA, tri-global LSA, and so on.Compared with the local LSA, the biglobal LSA can give a detailed stability description of the complex flow phenomena such as the vortex system and interaction between vortex and wakes, which will help capture the least unstable mode,as well as the flow control design.For example,Moored et al.performed a spatial bi-global LSA on the velocity profiles measured in the wake of an actively flexible robotic elliptical fin to find the frequency of maximum spatial growth.It is foundthat optima in propulsive efficiency occur when the driving frequency of a flapping fin matches the resonant frequency of the jet profile.Furthermore,the work of Clark and Smitsshowed that when the mode of Karman vortex street transits to instability,the corresponding wake structure will change from one mode to another,implicating the potential value based on the stability idea for the design of wingtip vortex control.Besides,the theoretical vortices,such as characterized by the isolated Lamb-Oseen vortex or vortex pair,and Batchelor vortex,exert the most unstable perturbation to the surrounding environment.If the corresponding most unstable perturbation is exposed to the isolated vortex,one can obtain 10-10times perturbation gain and 10times for the case of the vortex pair.Under the condition of a larger Reynolds number, the larger perturbation energy will be gained.However,these studies were based on the theoretical vortex models, which are difficult to reflect the instability message in the actual wingtip vortex flow.Recently,Edstrand et al.conducted the bi-global LSA on the wingtip vortex with wake in time and space under Re=1000.The results showed that there exist a wake branch,primary vortex branch,and continuous vortex branch in time and space for the eigenvalue spectrum,and an additional secondary vortex branch is contained in space. The primary instability characteristic is dominated by the wake branch.Furthermore,when an external perturbation is applied according to the unstable frequency in the wake branch, it is found that the volume force applied according to the fifth mode will make the wingtip vortex obtain an optimal attenuation,thus providing a possible unstable control solution for the isolated wingtip vortex at low Reynolds number.However,this is a new study to investigate the full bi-global LSA of the wingtip vortex pair flow under the high Reynolds number.
In summary, the main objective of this paper is to investigate the instability characteristics of a co-rotating wingtip vortex pair generated by the up-down symmetrical split winglet under three chord-based Reynolds numbers and angles of attack. Firstly, the instrumentations and methodologies are introduced to elaborate on the experimental setup,calculation of vortex parameters,and the theory,as well as validation of biglobal LSA in Section 2.Then,both experimental and bi-global LSA results are discussed in Section 3,which is further divided into five subsections. The development of wingtip vortices along with the streamwise location is expounded in Section 3.1,which is followed by the specific treatments to obtain the base state in Section 3.2.With that,the instability characteristics of the eigenvalue spectrum are revealed in detail in Section 3.3.Further, instability characteristics of the growth rate and perturbation energy about this co-rotating vortex pair are discussed in Section 3.4. The characteristics of the most unstable perturbation modes with streamwise wavenumbers and under different flow conditions are explained in Section 3.5. Finally,the conclusions for this paper are drawn in Section 4.
2. Instrumentation and methodology
2.1. Experimental setup
2.1.1. Model design and tested flow conditions
The experiment was conducted in a closed-circuit low-speed wind tunnel with a cross-section of 1.2 m (width)×0.9 m(length) located in Shanghai Jiao Tong University (SJTU).The examined model was an M6 wing with a split winglet as shown in Fig. 1. The root length was 0.143 m and the aspect ratio of M6 wing was 3.8 with a cutoff end of the trailing edge.For other geometry parameters, please refer to the standard M6 wing on the official NASA website. The winglets were arranged symmetrically with an inclined angle of 60° respect to the chord of the airfoil, and for the design of them, one can refer to Whitcomb winglet.The whole model was made of aviation aluminum in the milling machine with its manufacture accuracy up to 0.05 mm, whose smoothness was ensured adequately. Besides, the M6 wing and winglets transited smoothly to avoid the generation of unnecessary vortex structures at the corner of the model.
For comparison,the angles of attack of 6°,8°,and 10°were tested. Three freestream velocities of u=15 m/s, 30 m/s, 45 m/s, were adopted corresponding to the chord length (c=0.08 m) based Reynolds number of Re=0.82×10, 1.64×10, 2.46×10respectively. The measured region was up to 16 chord length along with the streamwise location Δx/c=2.
2.1.2. SPIV system and postprocessing
The Stereoscopic Particle Image Velocimetry(SPIV)system in Fig.2 was used to measure the flow fields.The flow was seeded with oil droplets,the diameter of which was 1-5 μm generated from the atomized glycol. The droplets were illuminated by a dual-cavity pulsed ND-YAG laser with a maximum pulse energy of 2×380 mJ with a 532 nm wavelength. The interval of dual-cavity was set adaptively as 15 μs, 7.5 μs, and 5 μs for the freestream velocity of 15 m/s, 30 m/s, and 45 m/s respectively to keep the particles in this image pairs recorded by CCD camera belong to the same layer. The thickness of the laser sheet was approximately 2 mm throughout the measurement region. Two PCO 2000 12-bit CCD cameras with a Nikon 100 mm 1:1.4D prime lens were placed on the sidewall of the wind tunnel behind the model. The spatial resolution was 2048×2048 pixels for each image, corresponding to 0.131 mm∕pixel in the image window and indicating that the bias of the wingtip vortex location is at the order of 10.The recording frequencies of the CCD cameras were 1 Hz synchronized with the laser frequency. To obtain a satisfactory time-averaged flow field, the repetitive experiment was conducted and 200 instantaneous image pairs were continuously recorded at each measured surface.
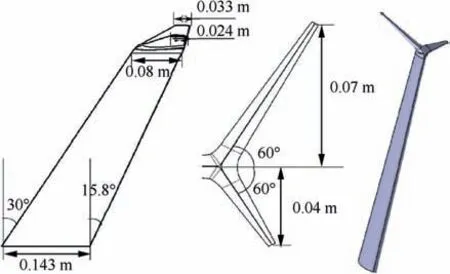
Fig. 1 Geometric parameters of examined model.
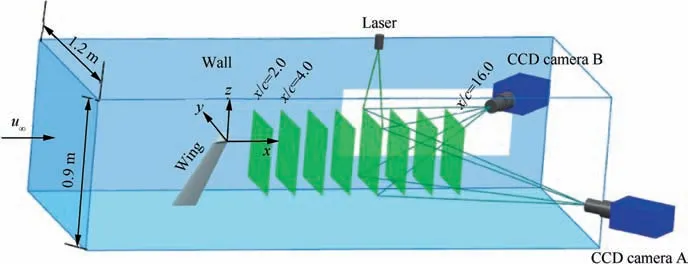
Fig. 2 Sketch of SPIV system.
A stereo cross-correlation of the image pairs was built in the TSI Insight 4 G commercial software using doubleconsulted windows to improve the resolution of the velocity vector. The initial consulting window is 72×72 pixels with an effective overlap rate of 25%. The second consulting window is 36×36 pixels with an effective overlap rate of 50%,and the unsolved velocity vector is interpolated from the surrounding vector through the filling algorithm of 9×9 pixels.In this way, the percent of good vector accounts for above 85% and the error of the velocity measured within the whole measured region is less than 1%,meeting the requirements in the following analysis.
2.2. Calculation of vortex parameters
The vortex core location in the averaged flow field is calculated by the first vorticity moment strategy as follows:
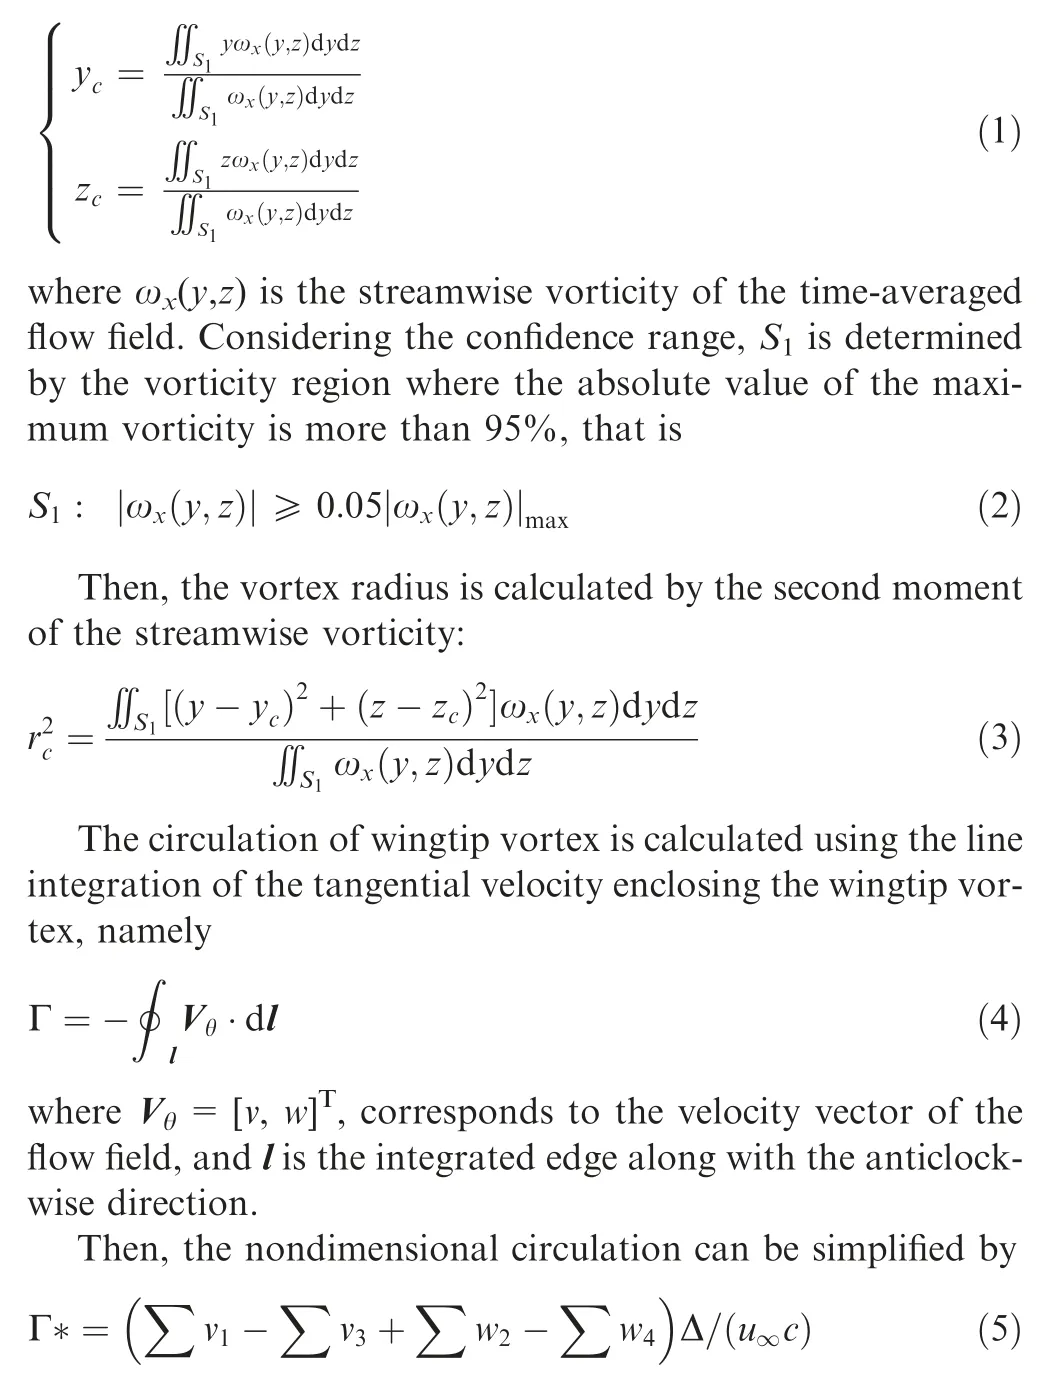
where v,w are the components of the tangential velocity,u,c correspond to the freestream velocity and chord length of the wing, served as the dimensionless reference. where the subscripts refer to the edges of the circuit in the figure of Section 3 along which the specified velocity components are summed,and Δ = Δy=Δz.
2.3. Method of bi-global LSA
2.3.1. Theory of bi-global LSA method
Neglecting the nonlinear terms,the linearized governing equations for the infinitesimal disturbances in the cartesian coordinate system which is shown in Fig. 2 can be given by
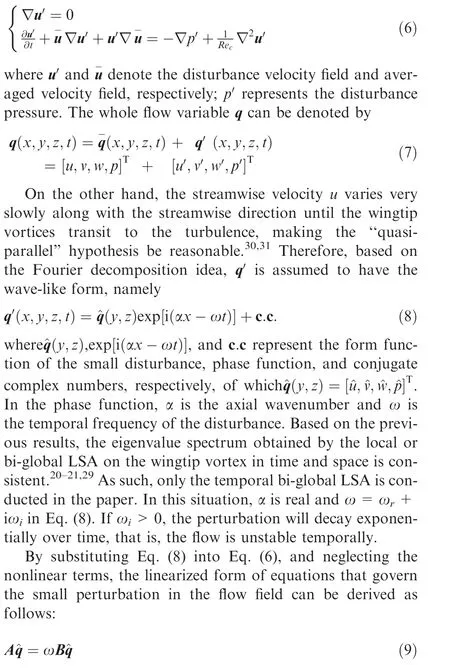
where A,B are the stability matrix as follows:
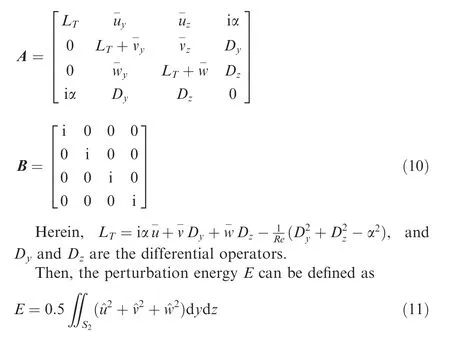
where Sis the computation domain for bi-global LSA.
Considering the requirements of numerical accuracy and convergence speed,the Chebyshev spectral configuration method was used for the discretion of Eq. (9), and for the information of the corresponding boundary condition, one can refer to our previous works for the local LSA of an isolated wingtip vortex.
2.3.2. Validation of bi-global LSA method
Before conducting the bi-global LSA on the wingtip vortices obtained by our experiments, four typical flow configurations,namely, the channel flow, isolated wingtip vortex flow, equal counter-rotating vortex pair flow,and equal co-rotating vortex pair flow,are selected to validate our codes strictly.In this process, the number of the mapped Gauss-Chebyshev-Lobatto(GCL) grids is chosen as 64, consistent with the choice in the validated publications.
In the validation of channel flow, two aspect ratios including A=1 and 4 are validated as shown in Fig. 3. All of the setting conditions are scrupulously consistent with those of the work by Theofilis et al.It can be observed that the eigenvalue spectra with each other are in good agreement, indicating that the channel flow can be exactly calculated.
Fig.4 shows the verification results of the isolated Batchelor vortex flow and the equal counter-rotating vortex pair flow compared with the work by Hein and Theofilis,where the swirl parameter, Reynold number, azimuth wavenumber, and axial wavenumber are q=0.475, Re=100, m= -1, and α=0.418,respectively.It can be found that the eigenvalue spectra agree well with each other, whether for the isolated vortex flow or the counter-rotating vortex pair flow. In particular,the unstable eigenvalues on the semi-plane of ω>0 can be accurately captured.
Under the similar parameter conditions, Mayer and Powellhave investigated the most unstable growth rate in time for the isolated Batchelor vortex flow, and the comparisons with the results by our method are listed in Table 1. Form the table,one can observe that the most unstable growth rates under different parameter conditions also coincide precisely with each other, further demonstrating that our method can capture the eigenvalues exactly.
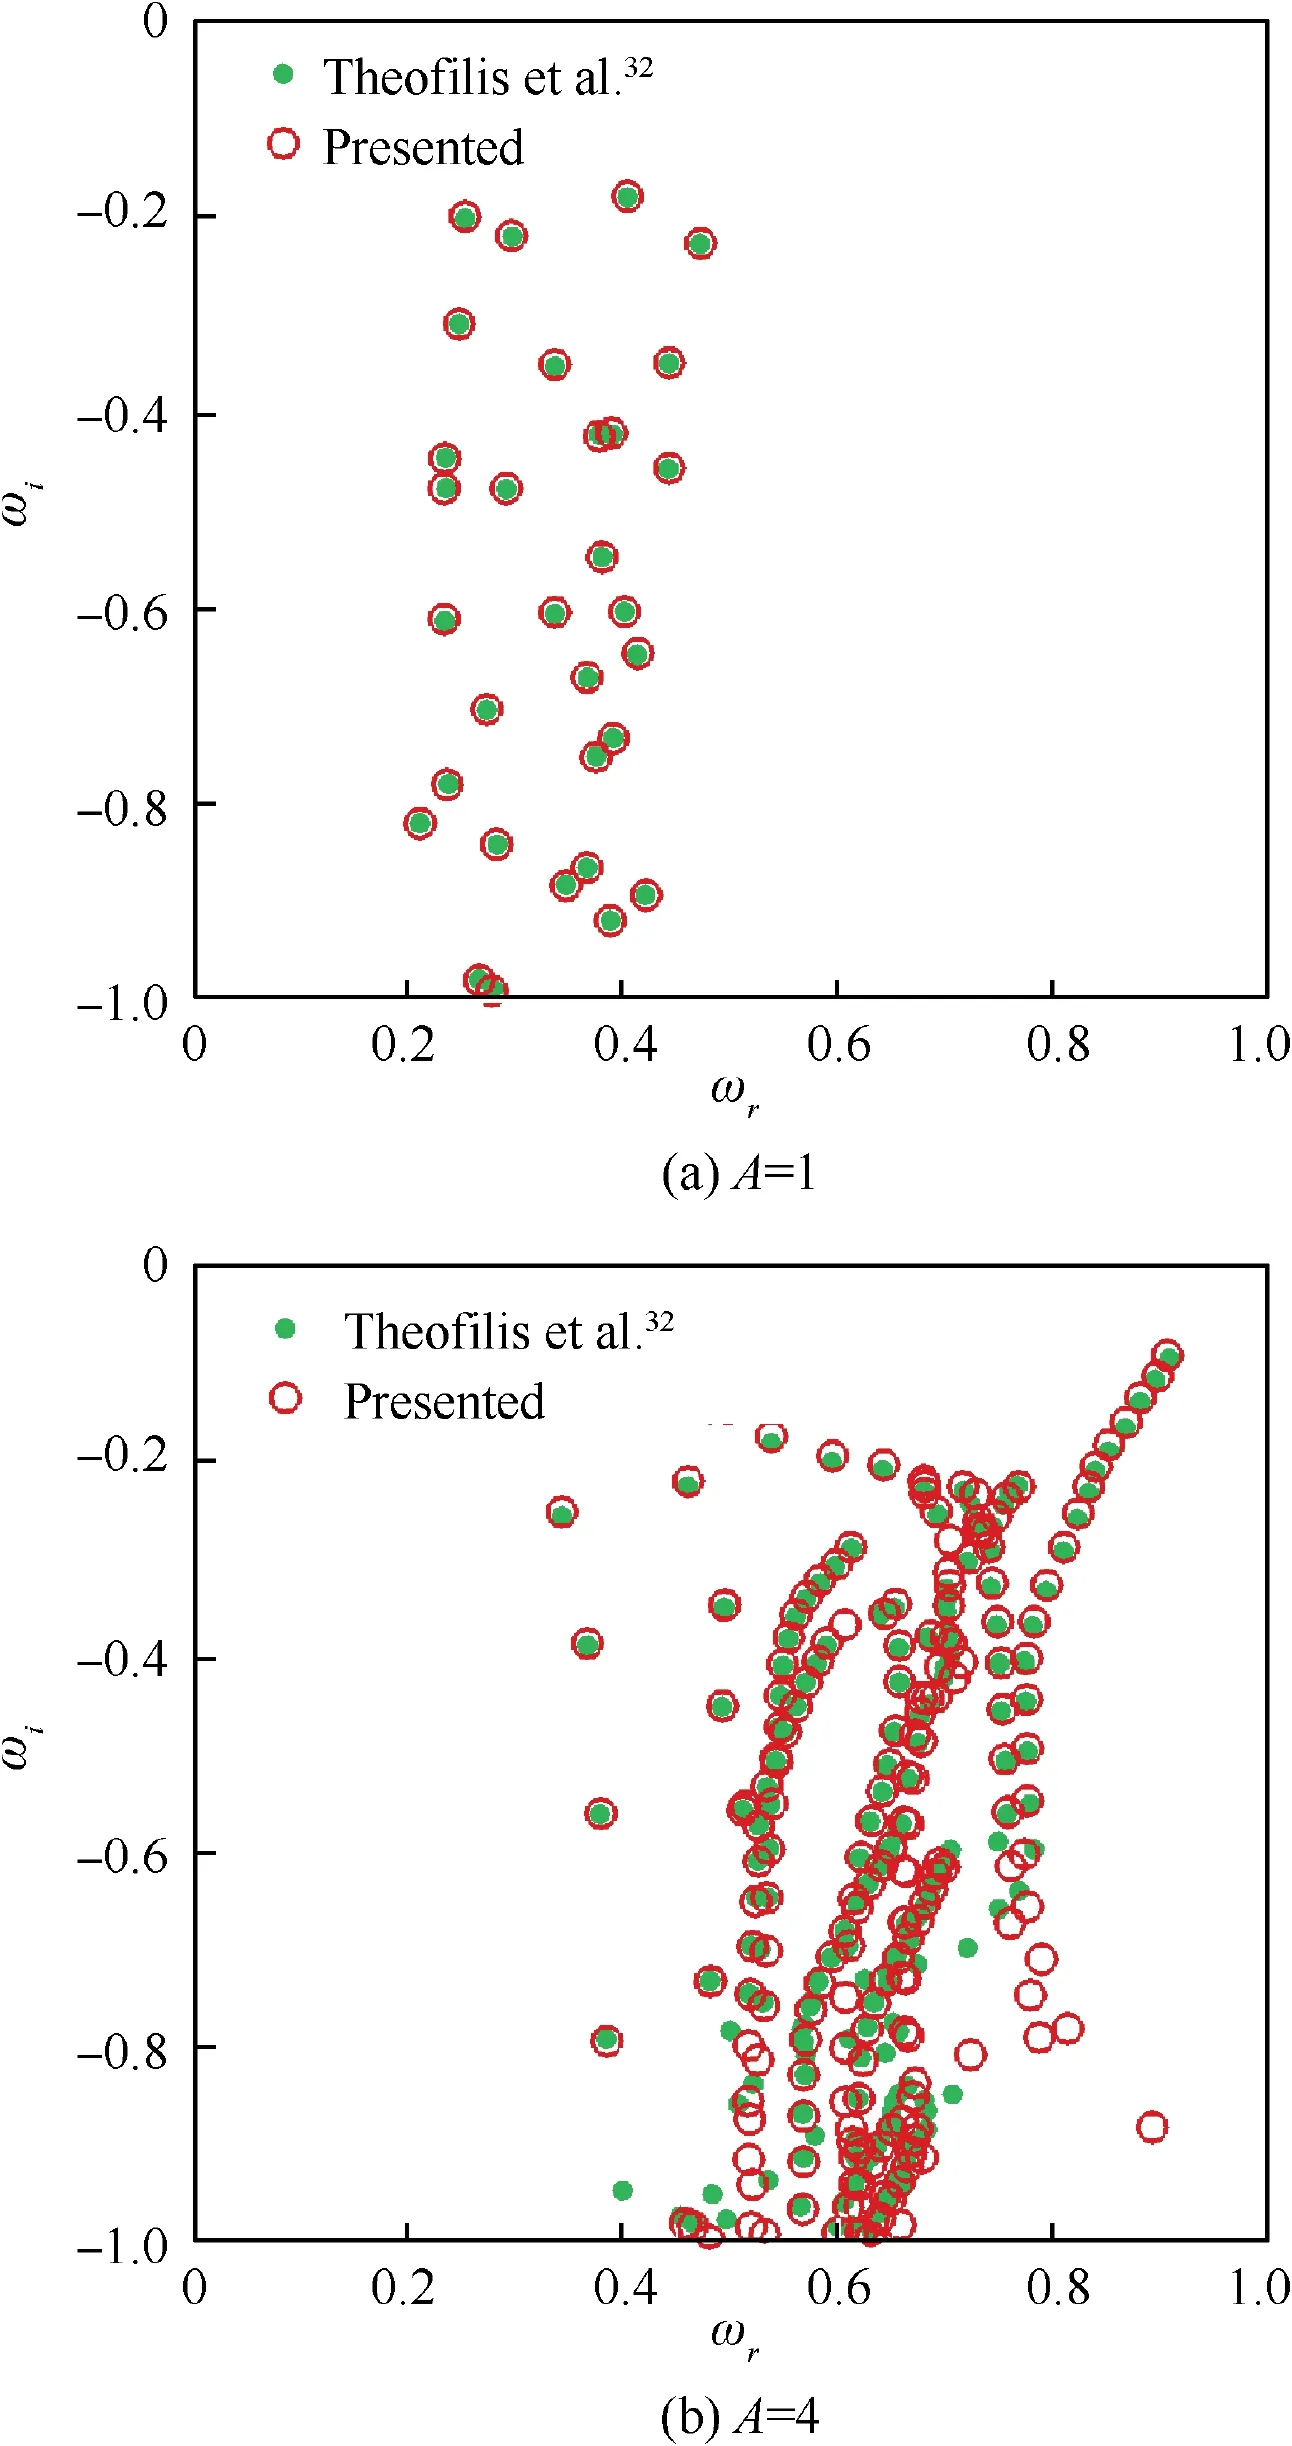
Fig. 3 Validation of cavity flows.
At last,the equal co-rotating vortex pair flow is validated to verify the accuracy of the perturbation mode obtained by our method.The base flow in this validation is the result of a relaxation calculation for a few seconds after the simple linear superposition of two Gaussian vortices, of which the initial vortex pair parameters are (a, b, Γ)=(0.0104, 0.0743,0.2045). After the relaxation calculation, these parameters become (a, b, Γ)=(0.0112, 0.0741, 0.2043), where a, b, Γ are the vortex radius,distance,and circulation of the two vortices,respectively. Therefore, the circulation- based Reynolds number is Re=13989 and a/b=0.15, which are consistent with the results of Roy et al.The axial wavenumber is also set the same as α=2.0 referring to the work by them. Then, the perturbation mode corresponding to the eigenvalue can be solved and the result is compared with that of them, which is shown in Fig. 5. It can be found that the method presented can accurately capture the perturbation modes.
In sum,the results above demonstrate that the method used in this paper can accurately capture the eigenvalues spectra and perturbation modes,which meets the requirements of bi-global LSA on the wingtip vortex pair obtained by our experiment.
3. Results and discussion
3.1. Development of wingtip vortices
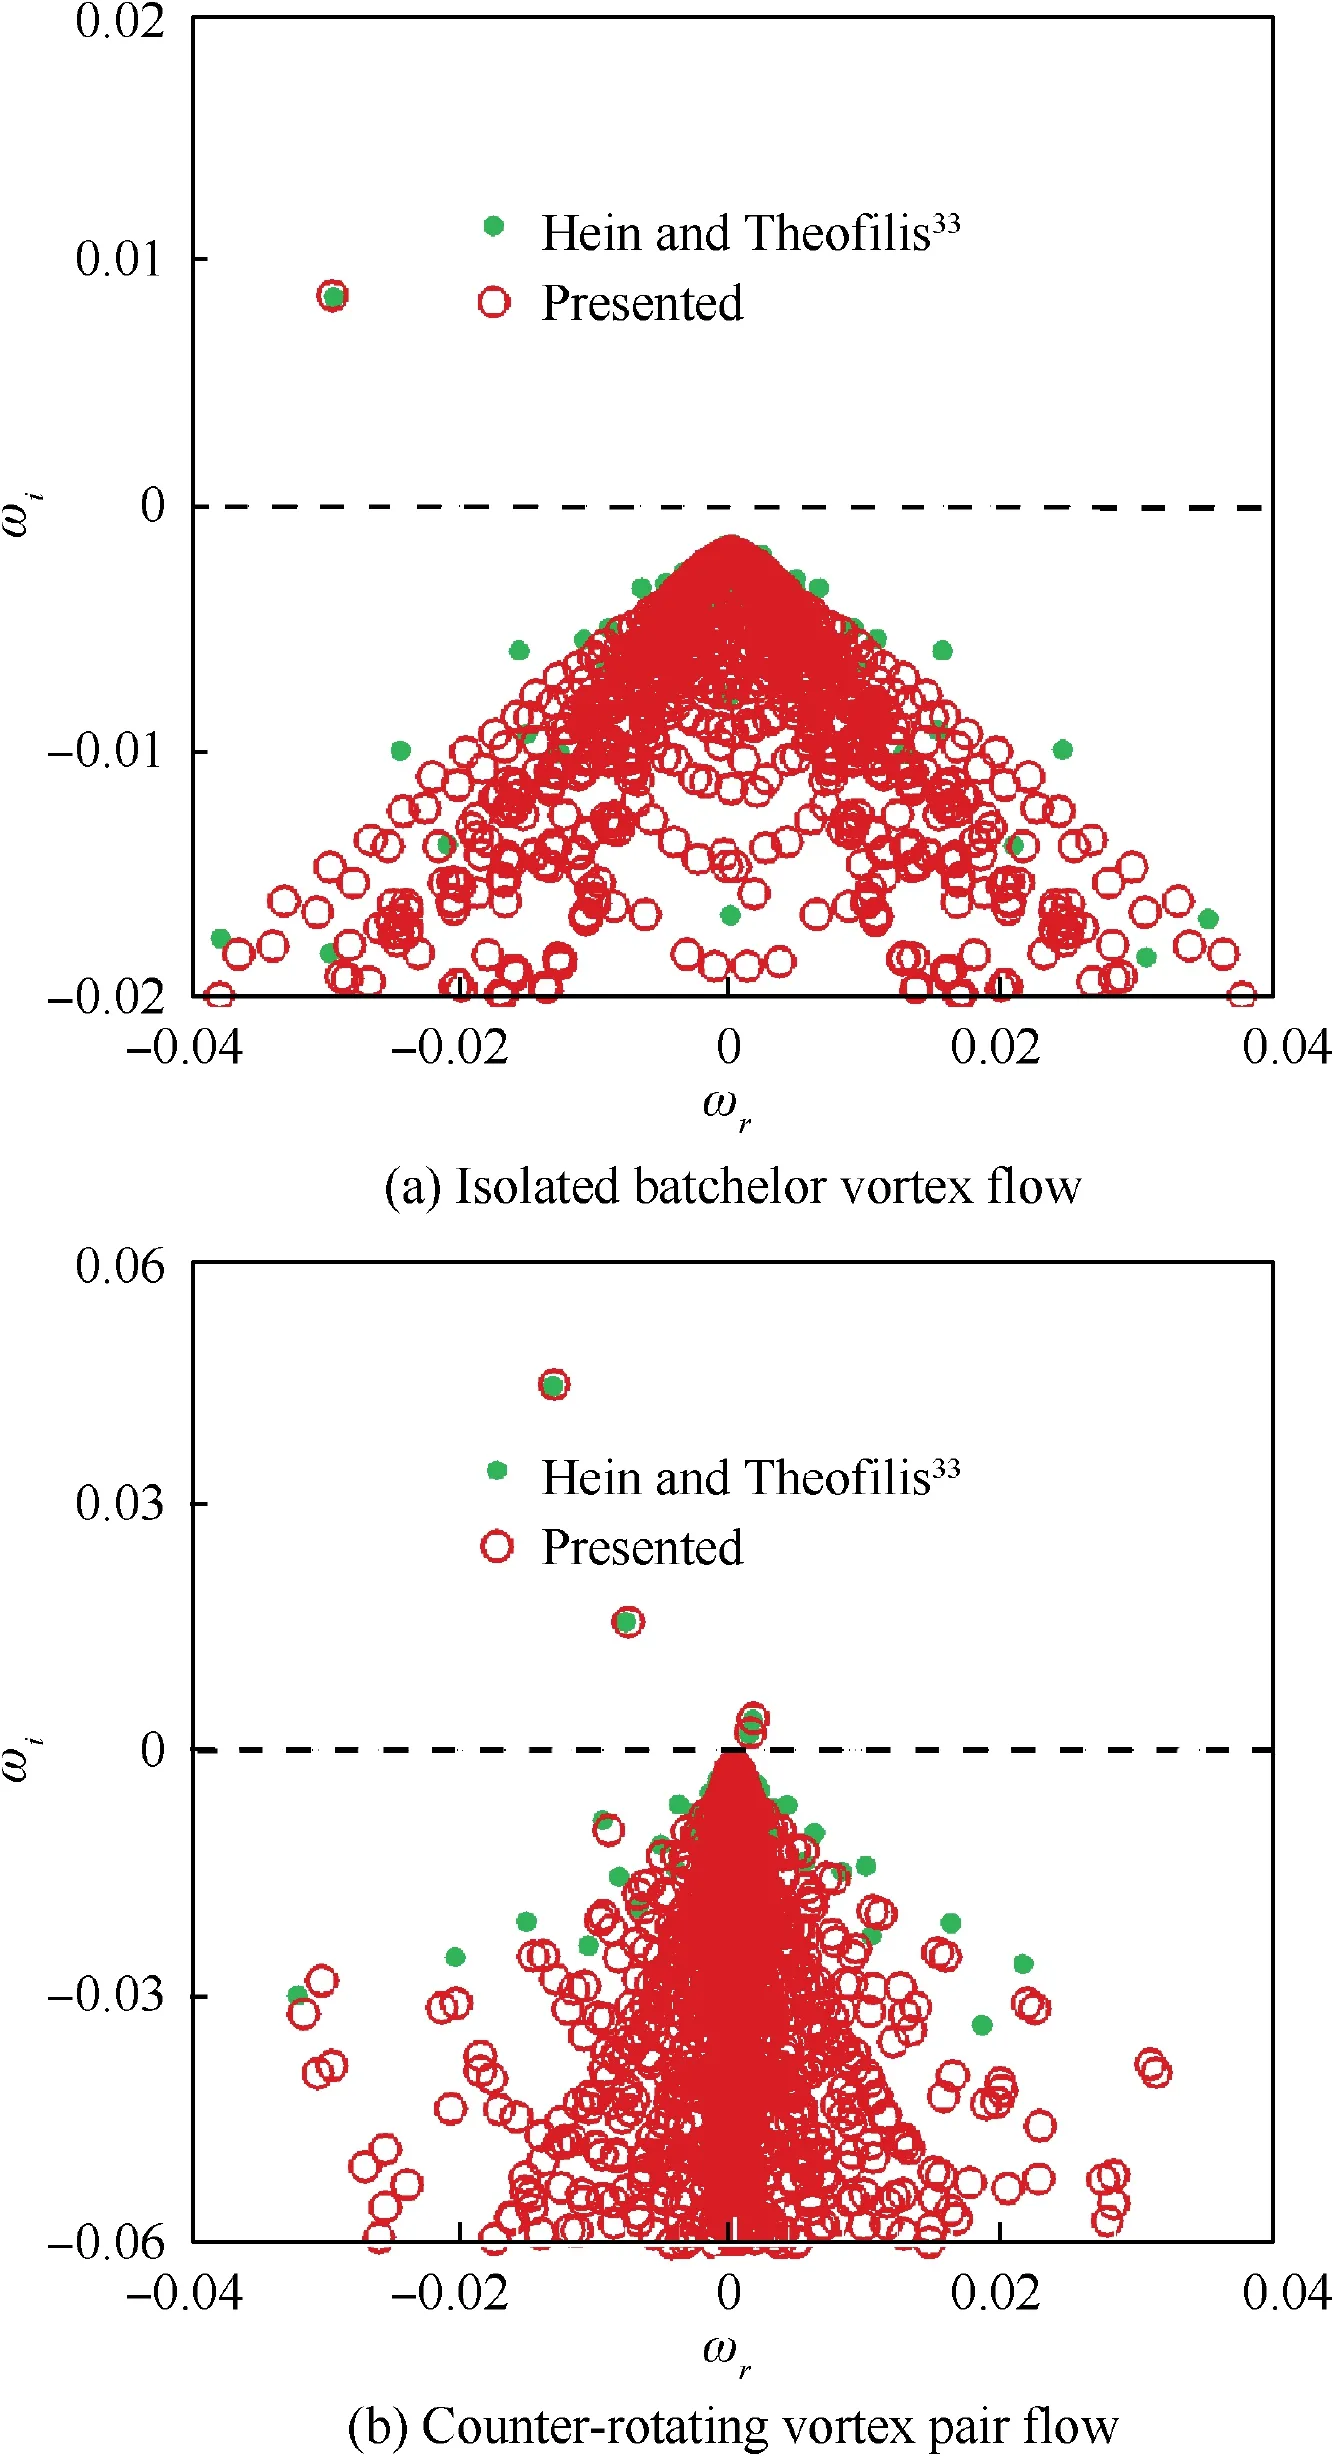
Fig.4 Validation of isolated Batchelor vortex flow and counterrotating vortex pair flow.
Taking the condition of 8° angle of attack, Re=1.64×10as an example,the development of wingtip vortices along with the streamwise location ωcharacterized by the averaged flow contour is shown in Fig. 6, in which the trailing edge of the wing is denoted by the black solid line and located on the plane of y=0.The labels of vortex-u and vortex-d marked in Fig.6(a) are denoted to indicate the upper primary wingtip vortex and down primary wingtip vortex, respectively.
As observed, the wingtip vortex system generated by the split winglet in our experiments is a co-rotating vortex pair composed of vortex-u and vortex-d. Furthermore, based on the calculations introduced in Subsection 2.2, the circulation of vortex-u and vortex-d at x/c=16 (Fig. 6(h)) is-0.3214 m/s and-0.2997 m/s, respectively, demonstrating that this vortex pair is nearly equal strength at the far-field area due to the up-down symmetrical arrangement of the two winglets of the examined model.Further,the development of the circulation with respect to these two wingtip vortices can refer to the results of isolated wingtip vortex reported in our previous experiments.Though it will change with the streamwise location,the base flow under different flow conditions selected corresponds to the same streamwise location in the paper (see details in Section 3.2). Therefore, the presented results of biglobal LSA in the following are comparative and reasonable.
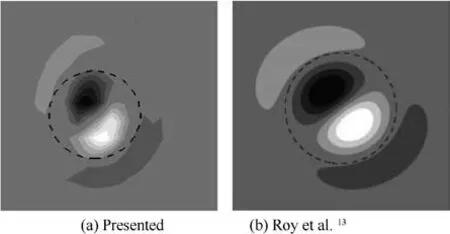
Fig. 5 Validation of co-rotating vortex pair flow.
Besides, the motion trace of the vortex core including the trajectory of the vortex pair and the distance between wingtip vortex is presented in Fig.7.As observed in Fig.7(a),the wingtip vortex pair gradually gets close to each other and becomes twisted along with the streamwise locations on the whole,which agrees well with the initial merging process for a vortex pair reported by Thomas et al.For instance, at x/c=4, 10,16, the vortex core location is (0.08167, 0.08274), (0.06791,0.05741), (0.04546, 0.04926) for the case of vortex-u, respectively, and is (-0.01872, 0.09415), (-0.006937, 0.1020),(-0.003222, 0.1072) for the case of vortex-d, respectively. As this vortex system evolves to the far-field, vortex-u gradually moves towards the direction of y-and z-, while vortex-d gradually moves towards the direction of y+ and z+. The trajectory of vortex-d in the direction is consistent with that of the isolated wingtip vortex generated by a rectangular wing in our previous results, which has also been explained by the pressure difference of the wing.As for the trajectory of vortex-u, it is largely owing to the swirl effects, and especially the induction by vortex-u is stronger than that of pressure effects, thus making vortex-u gradually approach to vortex-d.
From Fig. 7(b), it can further be found that the distance between the two vortices gradually decreases from 0.1010 to 0.07568, and the angle relative to y+ direction increases from 6.48° to 49.96° in this process. Therefore, it can be deduced that the average rotation angular velocity of the co-rotating vortex pair is 20 rad/s.
3.2. Base state for bi-global LSA
Notably, to eliminate the potential influence of wakes on the instability characteristics, it is the time-averaged flow field at the section of x/c=16 that is selected as the analysis section.However, after obtaining the time-averaged flow field by using SPIV, several specific treatments must be conducted before performing the bi-global LSA, which include: (A)averaging the dimensionless velocity azimuthally of each wingtip vortex to obtain the tangential velocity; (B) fitting the tangential velocity of each wingtip vortex based on the Lamb-Oseen vortex model and superposing them linearly;(C) relaxing the linear flow field on the numerical platform to make it satisfy the solution of Navier-Stokes equation; (D) reconstructing the axial velocity based on the streamwise flow vorticity.

Table 1 Validation of isolated Batchelor vortex flow.
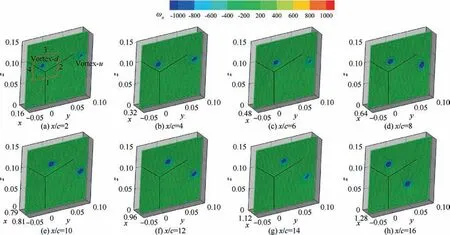
Fig. 6 Time-averaged contour of vortex pair obtained from experiment.
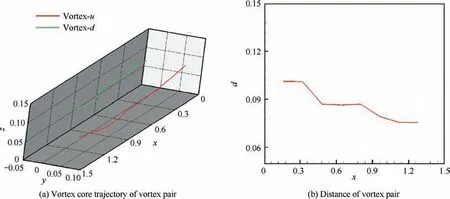
Fig. 7 Motion trace of vortex core for vortex pair.
3.2.1. Relaxation calculation
The relaxation calculation herein is carried out by the commercial software of Ansys Fluent. The user-defined functions based on the fitting results are used to initialize the computing domain in a square area of 1.28 m×1.28 m with a Cartesian grid-scale of 1600×1600, which is shown in Fig. 8(a). Since the mesh is quite dense, the mesh is displayed after an index skipping number of 16×16 in the y-direction and zdirection for clarity. That is, the displayed mesh in Fig. 8(a)is in the size of 101×101.
The boundary condition is set as the velocity entrance condition with the velocity term of zero since this calculation is only a pure relaxation coupling process without considering the external velocity input.The pressure and temperature conditions are consistent with the results recorded in the wind tunnel experiment. The inviscid, unsteady, pressure-based solver and SIMPLE algorithm is employed with the second-order windward scheme and bounded second-order implicit scheme in the spatial discretization and time advancement, respectively. Three hundred time steps are calculated and the time step length is set to 0.0001 s with an internal iteration of 20.After initializing, the calculation domain and initial flow field are shown in Fig. 8(b)-(c).
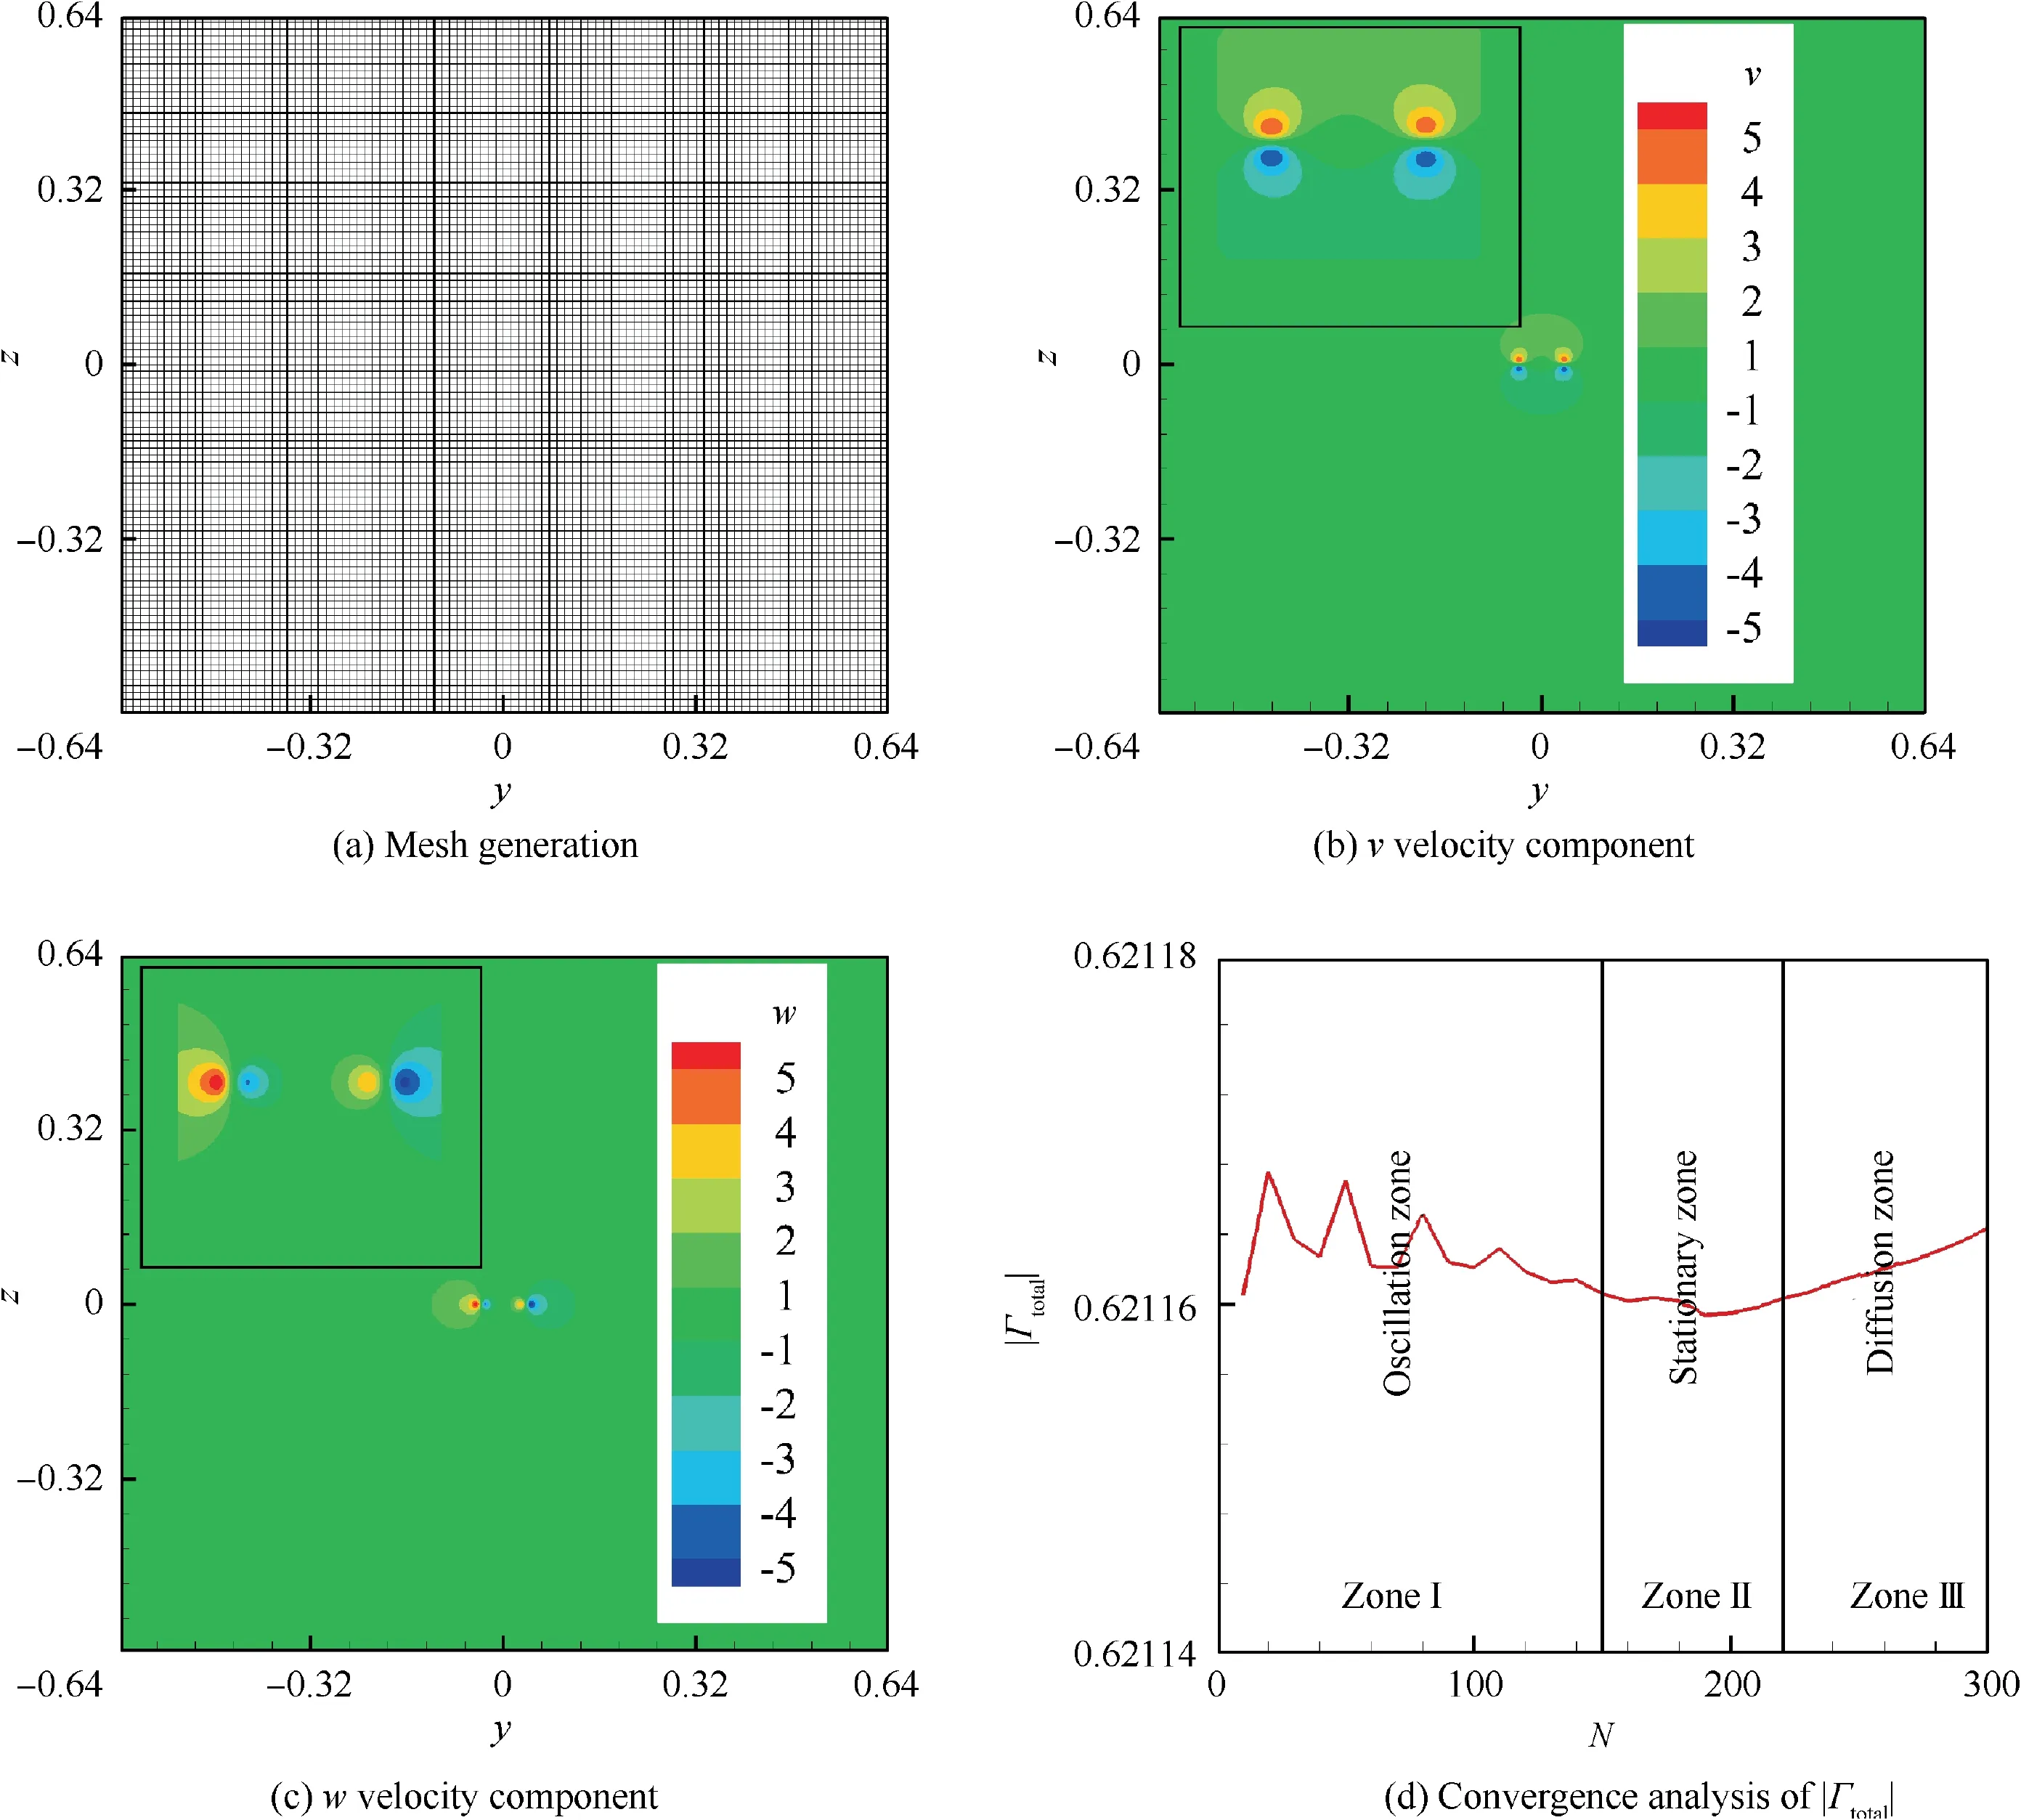
Fig.8 Specific treatments for relaxation calculation.(a)mesh generation is with an index skipping number of 16×16; (b)and (c): flow field after initialization; (d):|Γ total |= |Γ u+Γd |.
Herein, there exists a question about the determination of calculation steps for relaxation computation. Fig. 8(d) shows the convergence analysis of the total circulation of the corotating vortex pair. As observed, the change of the total circulation is at the order of 10after the decimal point. There are three distinct zones;however,they can be found in the figure, which also coincide with the observations by Roy et al.and Le Dize`s and Verga.To be more specific,after experiencing an oscillating zone, corresponding to the calculation number of N <150,the total circulation will enter into a transient stationary zone (150 ≤N <220) and then fall into the diffusion zone (N ≥220). In our work, the base state for biglobal LSA is based on the results from the stationary zone.
The flow field after relaxation lacks the information of axial velocity. Therefore, the method used by Roy et al.is referred to obtain the axial velocity according to the following equation:

where δ denotes the core radius based on the Lamb-Oseen vortex; δis the characteristic radius of Gaussian distribution of axial velocity from the experiments; u(0,0) and ω(0,0) are the streamwise velocity and vorticity at the core location,respectively.
Fig. 9 shows the comparison results obtained by the SPIV experiment and CFD calculation for the co-rotating wingtip vortex pair,in which the left scatter is the comparison of axial velocity defects AVD, and the right scatter is the comparison of streamwise vorticity. It can be observed that the corresponding results are in good agreement, indicating that the treatments above are effective and scientific.
3.2.2. Convergence analysis of mesh independence
The base flow is mapped into the computational domain by the Chebyshev spectrum configuration points,thus resulting in the effects of the numbers of configuration points on the eigenvalue spectrum.To determine the point numbers,taking the wingtip vortices under 6°angle of attack,Re=1.64×10as an example, the bi-global LSA is carried out with three grid sizes, 48,64,80,respectively, which are shown in Fig.10.
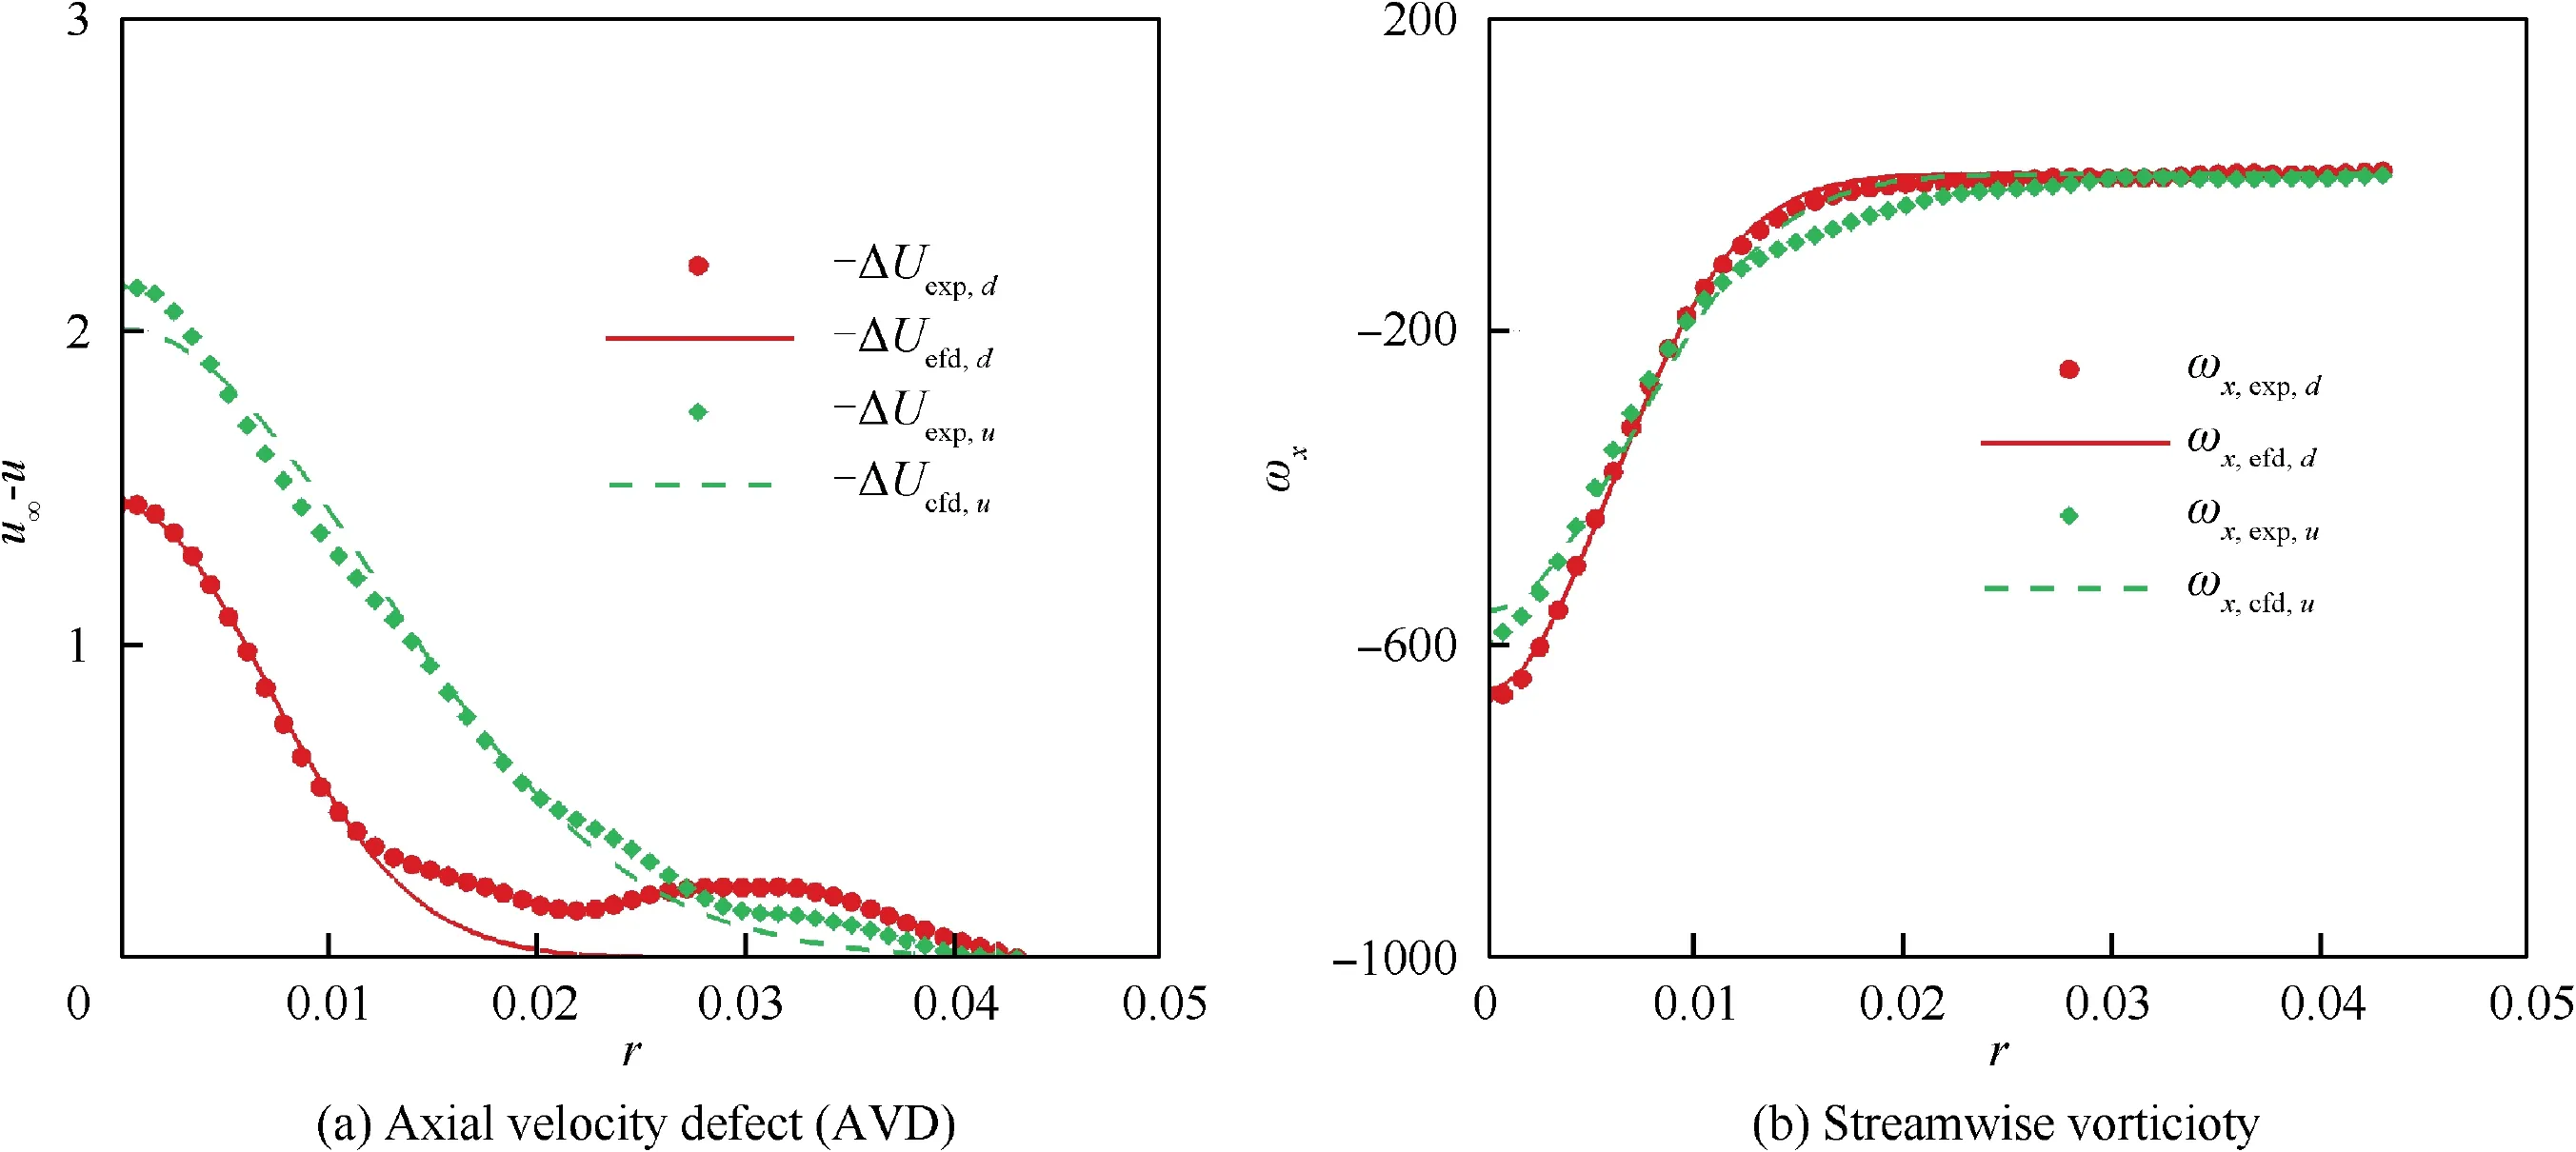
Fig. 9 Comparison of AVD and streamwise vorticity obtained from SPIV and CFD.
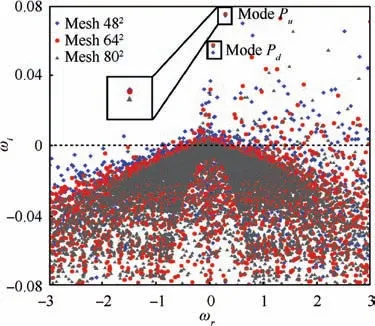
Fig. 10 Validation of mesh independence (α=1.25).
For comparison,the perturbation wavenumber is chosen as the same with α=1.25 and the results are shown in Fig.10.It can be found that the positions of the eigenvalue spectra obtained under different grid sizes in the stable half-plane are roughly unchanged,and only the positions of the discrete eigenvalues in the unstable plane are different.Furthermore,the corresponding perturbation modes of the moving eigenvalues in the unstable half-plane show that these eigenvalues are the calculation errors generated by numerical discretization. That is,these moving eigenvalues are numerical pseudo-eigenvalues.However,there also exist the fixed eigenvalues and their eigenfunctions correspond to the perturbation modes with physical significance.
As such, two typical modes, Mode Pand Mode P,in the eigenvalue spectrum in Fig.10 are denoted and their eigenvalues under three grid sizes are listed in Table 2.The results show that the grid size of 64can meet the analysis requirements. Therefore, all the calculation and analysis results are based on the results of 64grid size in the following calculation.Besides,the grid size of 56is also superposed to distinguish the pseudoeigenvalues and fixed eigenvalues more clearly when investigating the information of the eigenvalue spectrum in the following.
3.3. Eigenvalue spectrum of wingtip vortex pair
3.3.1. An overview of eigenvalue spectrum
Taking the wingtip vortices under the flow condition of 8°angle of attack, Re=1.64×10, and x/c=16 as an example, an overview of the branch features is displayed in Fig. 11. As mentioned above, all of the discrete points aredenoted by the fixed eigenvalues under the frames of two grid sizes of Mesh-56and Mesh-64,and the eigenvalue results for the grid size of Mesh-56are omitted in the figure for brevity.
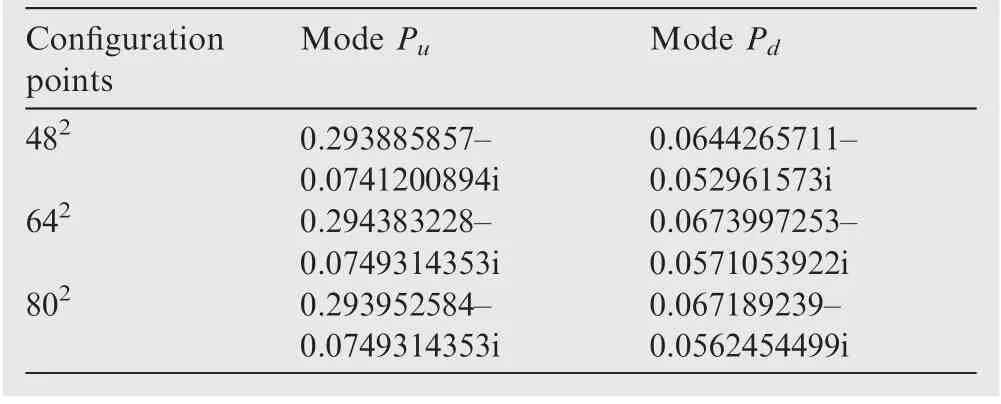
Table 2 Independence validation of Chebyshev spectrum configuration points, α=1.25.
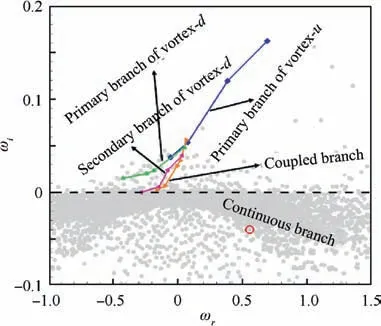
Fig. 11 Bi-global eigenvalue spectrum of wingtip vortices generated by split winglet (α=4.25).
As observed in Fig. 11, the instability eigenvalue spectrum illustrated by (ω, ω) contains two types of branches: discrete branch and continuous branch. Among them, the discrete branch contains the primary branches of vortex-u and vortex-d, the secondary branch of vortex-d and coupled branch,of which all of the eigenvalues are located in the unstable half-plane of ω>0,indicating that wingtip vortex is temporally unstable. By contrast, the eigenvalues of the continuous branch are concentrated on the half-plane of ω<0. Since the wake is not considered in our analysis, the wake branch is not found in Fig.11. Moreover, it is interesting that vortex-d has primary and secondary branches, while vortex-u only has primary branch, and the secondary branch of vortex-u does not appear,instead of the appearance of the coupled branch. This might be attributed to the fact that the corotating vortex pair in our experiments is generated under a relatively high Reynolds number which is up to 10.
3.3.2. Discrete branch of spectrum
To further investigate the instability features of the discrete branches,the corresponding perturbation modes are displayed in Fig. 12. In the figure, the information of them is differentiated in the row and the eigenvalues decrease from left to right,thus distinguishing the class of perturbation mode in the column. The results of the coupled branch are relative fuzzy because the range of scatters is four times larger than that of other branches. For uniformity and clarity, the 5th perturbation mode of coupled branch corresponding to ω= -0.1587+0.002758i is not presented herein.
As for each discrete branch in Fig. 12, the perturbation mode exhibits the uniformed structure and obvious active area.Taking the primary branch of vortex-u as an example, the affected area is concentrated in the vicinity of vortex-u as shown in Fig.12(a1)-(a4),while the area of vortex-d is almost not affected.The corresponding growth rate of the first perturbation mode is ω=0.1623,which is the most unstable perturbation mode in the whole flow field,dominating the instability evolution of this co-rotating vortex pair system. Furthermore,it can be found from the figure that the structures of this perturbation mode only have azimuthal wavenumber m,while the radial wavenumber n=0. From Fig. 12(a1) to (a4), the azimuthal wavenumber decreases from m=5 to m=4 due to the gradual decrease of ω, agreeing well the observations by Edstrand et al.in the work of isolated wingtip vortex.
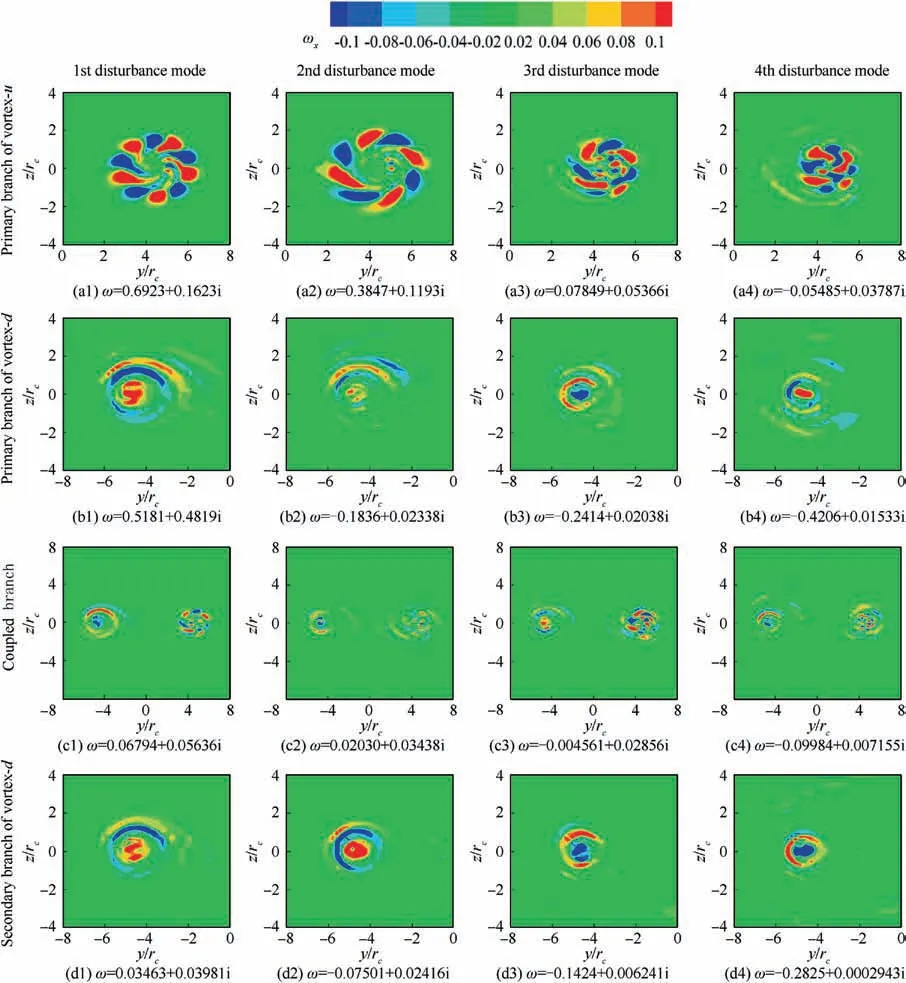
Fig. 12 Perturbation modes of discrete branches.
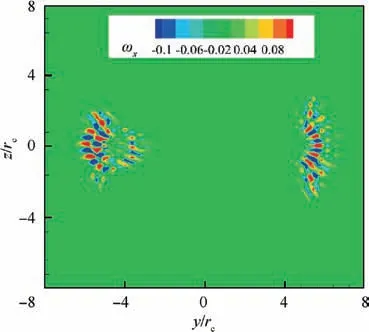
Fig. 13 Perturbation modes of continuous branch (ω=-0.1587+0.002758i).
Similar insights can be observed for the primary branch of vortex-d, the active area is condensed in the vicinity of the equivalent wingtip vortex as shown in Fig. 12(b1)-(b4). However,the perturbation modes of this branch have both the azimuthal wavenumber and radial wavenumber, which is different from that of the primary branch of vortex-u. In the meanwhile, the radial wavenumber is larger than that of the coupled branch. With regard to the secondary branch of vortex-d, which is below the primary branch of vortex-d, the structures of corresponding perturbation modes are distinctively different from those of the primary branch of vortex-d,only presenting the radial wavenumber owing to the small growth rate of vortex-d.
As for the coupled branch, the potential structures in the primary branch of vortex-u and vortex-d can be observed in the first perturbation mode of this branch as shown in Fig. 12(c1). The largest growth rate of this perturbation mode is ω=0.05636, about 1/3 of the growth rate in Fig. 12(a1).With the decrease of ω, the perturbation mode in the vortex-d region gradually shows the characteristics of the secondary branch of vortex-d, while the perturbation energy in the vortex-u region gradually weakens.
3.3.3. Continuous branch of spectrum
Apart from the discrete branches of the bi-global spectrum dictated by the presence of shear in the base-flow velocity field,the continuous branch can also be introduced in the halfplane ω<0 of the spectrum.Corresponding to the eigenvalue of ω=0.8165-0.07383i for instance, which is denoted as the red circle in Fig.11,the structures of these perturbation modes are similar to zebra-stripes as presented in Fig. 13.
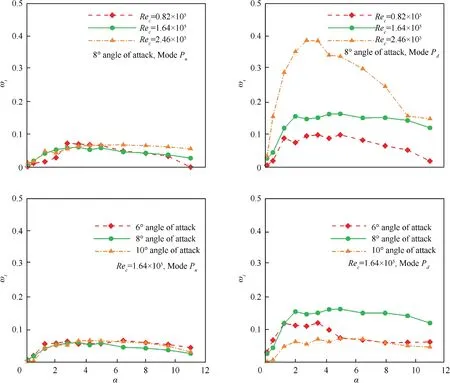
Fig. 14 Instability curves under different flow conditions.
In fact, when the viscous flow is analyzed in an infinite domain, a continuous spectrum can be found naturally. The investigations by Edstrand et al.and Mao and Sherwinshow that this perturbation mode corresponds to the freestream disturbance,exposing neglect effects on the attenuation of wingtip vortices.
3.4.Characteristics of perturbation modes of wingtip vortex pair
3.4.1. Growth rate of wingtip vortex pair
For different flow conditions, one can obtain the growth rate through the bi-global linear stability analysis.Further,the stability curves as shown in Fig. 14 can be obtained by scanning the eigenvalue spectrum under different perturbation wavenumbers.
As observed, all of the growth rates for the wingtip vortex pair are greater than zero under each flow condition, which means that this vortex pair is unstable temporally, that is,the perturbation will be amplified over time and cause the vortex pair entering into a nonlinear development stage after exceeding a certain threshold.Besides,comparisons in two columns show that the growth rate of the 1st perturbation mode of the primary branch of vortex-u(Mode P)is larger than that of the 1st perturbation mode of the primary branch of vortex-d(Mode P),which demonstrates that Mode Pdominates in the flow, namely the instability resulting from the vortex-u is stronger than that of vortex-d and the perturbation develops quicker over time, thus causing a quicker attenuation and breakdown of vortex-u.Further,the influence of Reand angle of attack on the instability shows that Mode Pis greatly affected by the variation of flow conditions, while little effects on Mode P. Meanwhile, it also shows that the vortex-u is more susceptible to external perturbation than that of the vortex-d, suggesting that Mode Pis a potential controllable mode.
Moreover,the streamwise wavenumber α of the most unstable perturbation can be sighted from the stability curve.Under the flow condition of Re=0.82×10-2.46×10and 6°-10°angle of attack, α is distributed in the interval of α=[2.75-5].The circulation-based characteristic velocity after the relaxation computation is U≈5 m/s,the core radius is δ ≈0.01 m,and thus the dimensional streamwise wavenumber α* is about α*=1800 rad/m.This means there are about 30 periods of perturbation per meter along the streamwise direction, and the wavelength of perturbation flow is λ ≈0.03 m, which is comparable to the vortex core radius of r≈0.01 m. Therefore,it can be concluded that the instability investigated in our experiments belongs to a short-wave instability.
3.4.2. Perturbation energy of instability mode
To further clarify the role of the four discrete branches during the unstable evolution of this vortex pair system,the perturbation energy histogram of the discrete branches is displayed in Fig. 15.
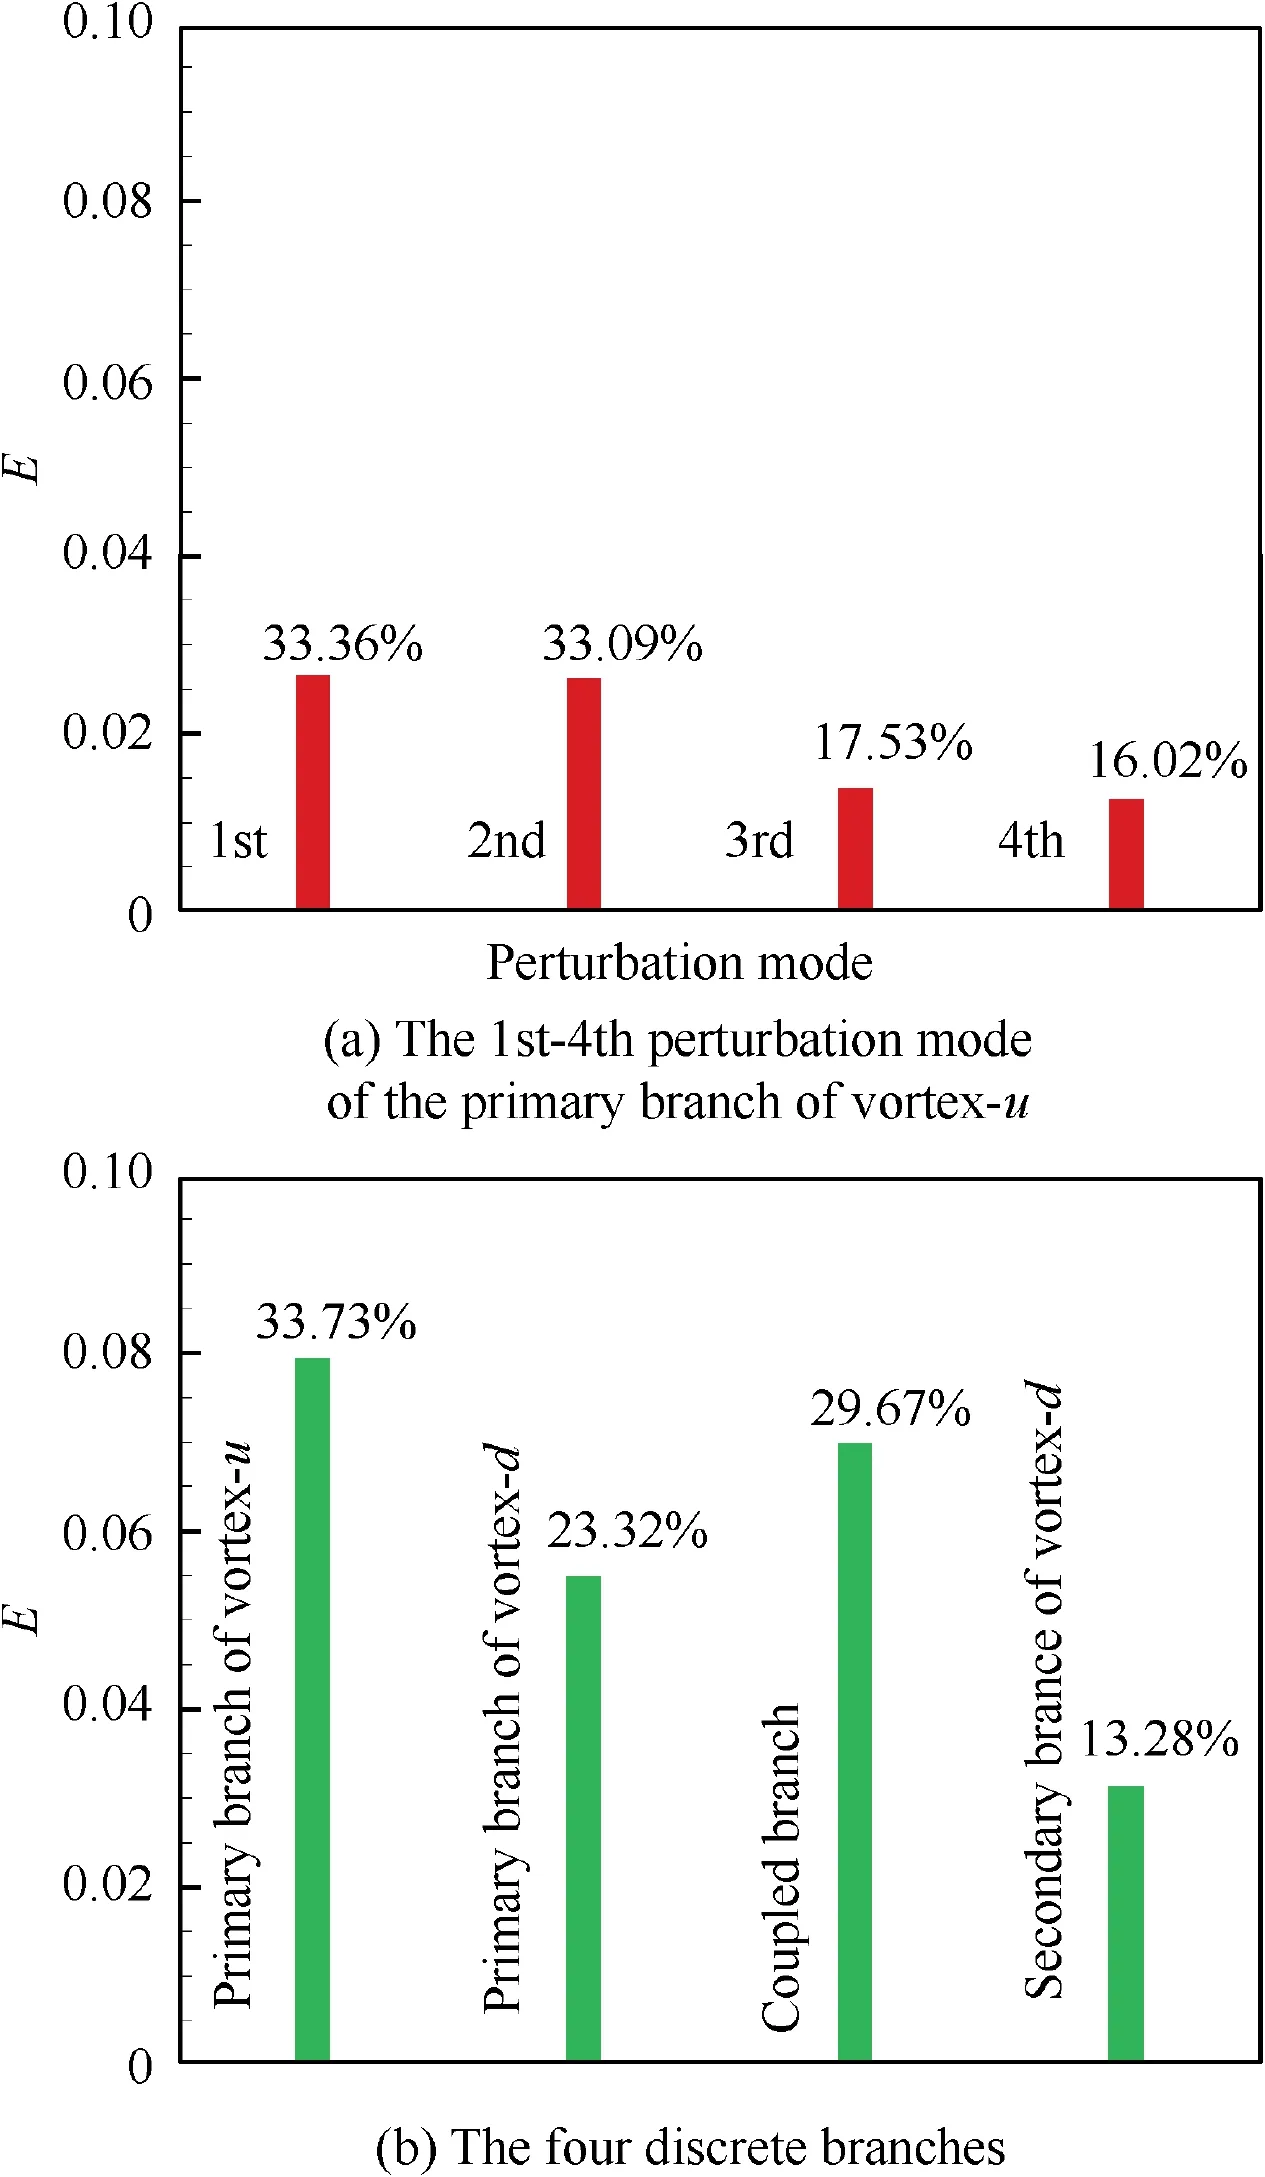
Fig. 15 Perturbation energy histogram of discrete branches
From the point view of perturbation intensity, as for the primary branch of vortex-u,the perturbation energy of the first perturbation mode, up to 0.02650 and accounting for 33.56%percent,is the largest,which is not only in this branch but also for all of the perturbation modes in the four discrete branches.Further, it can be found that the percentages of perturbation energy for the rest class perturbation modes decrease gradually from 2nd to 4th. As for the four discrete branches, the total largest perturbation energy is 0.07945 and accounts for 33.73% percent, occurring in the primary branch of vortex-u as expected, which further confirms that this branch is the most unstable. The percentages of the primary branch of vortex-d, coupled branch and the secondary branch of vortex-d are 23.32%, 29.67%, and 13.28%, respectively,demonstrating that the secondary branch of vortex-d is the least unstable as expected.
3.5. Characteristics of the most unstable perturbation modes
3.5.1. The most unstable perturbation modes with streamwise wavenumbers
Taking the flow condition of 8°angle of attack,Re=0.82×10as an example, the characteristics of Mode Pand Mode Pwith streamwise wavenumbers α are investigated as shown in Fig.16(Mode P)and Fig.17(Mode P).To present results more clearly, the legend ranges of the first two scatters for Mode Pare chosen as[-0.05,0.05],[-0.15,0.15],respectively,and the other scatters correspond to[-0.2,0.2],while the same legend range is kept as[-0.05,0.05]for Mode P.As observed,though the vortex-u and vortex-d constitute a nearly equalstrength co-rotating wingtip vortex pair, the structure characteristics of Mode Pand Mode Pare distinctive with α.When α is relatively small and almost no external perturbation exists,α=0.1 for example as shown in Figs. 16(a) and 17(a), the morphology of Mode Pand Mode Pwill be the same.To be more precise, the topologies of them are axisymmetric, which have only radial wavenumber of n=1, while azimuthal wavenumber is m=0. However, if α increases, the azimuthal wavenumber of Mode Pwill also increase. In Fig. 16(g), the azimuthal wavenumber increases to m=5 when α=4.25,and m=11 for the case of α=9.5 as shown in Fig. 16(k),during which the value of n becomes zero.
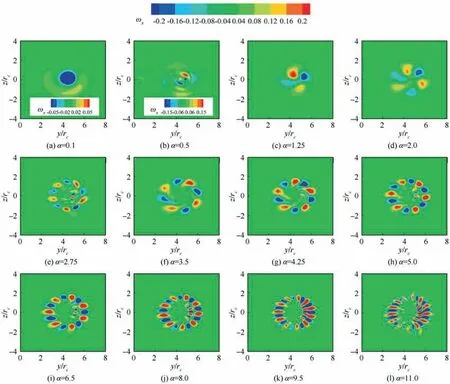
Fig. 16 Characteristics of Mode Pu with streamwise wavenumbers.
With regard to Mode P, the increase of α will change the radial wavenumber n rather than the azimuthal wavenumber m.Taking Fig.17(c) as an example,when α=1.25,the radial wavenumber is n=2; when α=5.0, as shown in Fig. 17(d),the radial wavenumber of Mode Preaches at least n ≥3.However, if the value of α is further increased, the radial wavenumber of Mode Phas exceeded the analytical range of 64Chebyshev spectrum configuration point,but the radial wavenumber can be expected to further increase.
3.5.2. The most unstable perturbation modes for different flow conditions
Fig.18 shows the comparison between Mode Pand Mode P,which have the same coordinate system with the base flow under different flow conditions. As observed, Mode Pis located exactly at the core of the vortex-u, while Mode Pis located at the core of vortex-d. For different flow conditions,the disturbance intensity of Mode Pis greater than that of Mode P,which further indicates that Mode Pplays a leading role during the development of vortex instability in the corotating vortex pair generated by the split winglet.Meanwhile,it can also be observed that the most unstable mode is of the structure with large azimuthal wavenumber, which reaches m=5-6 for different flow conditions. For the most unstable perturbation modes under the condition of 10°angle of attack,Re=1.64×10which is shown in Fig. 18(b3), one can find that Mode Pand Mode Phave similar strengths,and the relative strength of the modes is consistent with the results of the stability curve in Fig. 14.
Moreover, the relative sizes of the vortex core radius for different flow conditions are also denoted with the black dashed line in Fig.18.As observed,all of the helical and large azimuthal wavenumber perturbations of Mode Pare close to the boundary of the vortex core, and many of the perturbations even penetrate the boundary of the vortex core, entering into the core interior for different flow conditions. In particular, for the conditions of 8°angle of attack and Re=2.46×10which are shown in Fig. 18(a3), the most perturbation of Mode Phas entered into the core of vortex-u. Under this intensive excitation imposed by Mode P,vortex-u is the most unstable for all the examined conditions, which is also consistent with the results of the stability curve in Fig. 14.
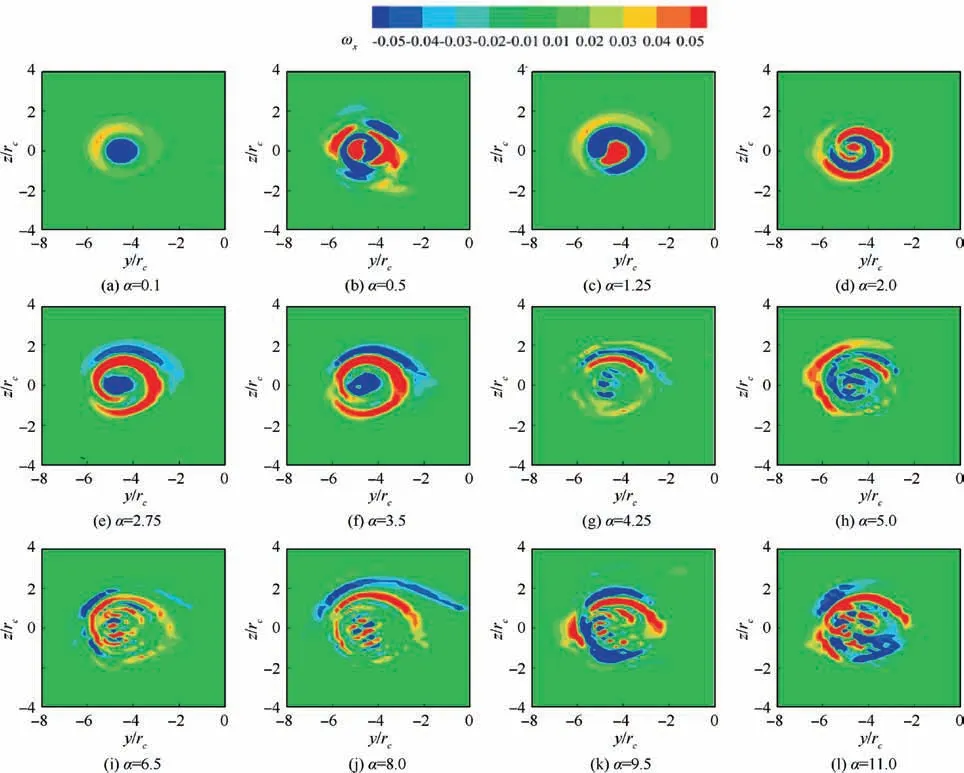
Fig. 17 Characteristics of perturbation Mode Pd with streamwise wavenumbers.
4. Conclusions
The wingtip vortex system generated by the up-down symmetrical split winglet examined in the stereo particle image velocimetry experiments contains two primary vortices including vortex-u and vortex-d, which constitutes a nearly equalstrength co-rotating vortex pair. By conducting the bi-global stability analysis on this vortex pair, the main conclusions about the instability characteristics are drawn as follows:
(1) Characteristics of the eigenvalue spectrum: discrete branch and continuous branch. The instability eigenvalue spectrum illustrated by(ω,ω)contains two types of branches: discrete branch and continuous branch.The discrete branch contains the primary branches of vortex-u and vortex-d, the secondary branch of vortexd and coupled branch, of which all of the eigenvalues are located in the unstable half-plane of ω>0,indicating that wingtip vortex is temporally unstable. By contrast, the eigenvalues of the continuous branch are concentrated on the half-plane of ω<0 and the perturbation modes correspond to the freestream perturbation. Overall, the two primary branches are located above the coupled branch and secondary branch of vortex-d, suggesting that vortex attenuation is dominated by the primary branches.
(2) Characteristics of perturbation modes of wingtip vortex pair: growth rate and perturbation energy. In the primary branches of vortex-u and vortex-d, Mode Pand Mode Pare the primary perturbation modes and exhibit the structures enclosed with azimuthal wavenumber m and radial wavenumber n, respectively. By sweeping the most unstable eigenvalue for the two primary branches under different streamwise wavenumbers α,the instability curves can be obtained. The results of the stability curve for vortex-u and vortex-d demonstrate that their growth rates increase with Reynolds number,while increase with angle of attack first and then decrease. In particular, the instability growth rates of vortex-u are larger than those of vortex-d, and the perturbation energy of Mode Pis also larger than that of Mode P. Moreover, the perturbation energy of Mode Pis up to 0.02650 and accounts for 33.56%percent in the corresponding branch, thereby indicating that Mode Pis the main disturbance source that manipulates the attenuation of this vortex pair.
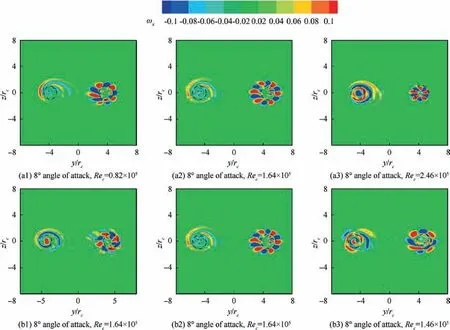
Fig. 18 Characteristics of Mode Pu and Mode Pd for different flow conditions.
(3) Characteristics of the most unstable perturbation modes: Mode Pand Mode P. The characteristics of Mode Pand Mode Pare investigated with streamwise perturbation wavenumbers α and under different flow conditions. It is found that the value of m for Mode Pincreases gradually with α,while the value of n nearly keeps as zero. However, for the case of Mode P, it is n that increases gradually while m is zero. For different flow conditions, the value of m for Mode Pis m=5-6, and α is distributed in the interval where α=[2.75,5]. The perturbation mode with the largest growth rate imposes on the entire core region of vortex-u,suggesting the potential application value of manipulating this large azimuthal wavenumber perturbation mode in the wingtip vortex control.
Declaration of Competing Interest
The authors declare that they have no known competing financial interests or personal relationships that could have appeared to influence the work reported in this paper.
Acknowledgments
The study was co-supported by the National Basic Research Program of China (No. 2014CB744802), Major Research of National Natural Science Foundation of China (No.91952302), and China Postdoctoral Science Foundation (No.2018 M642007).
 CHINESE JOURNAL OF AERONAUTICS2021年5期
- CHINESE JOURNAL OF AERONAUTICS的其它文章
- Ferrofluid moving thin films for active flow control
- Preliminary study on heat flux measurement data of TT-0 flight test
- An analysis and enhanced proposal of atmospheric boundary layer wind modelling techniques for automation of air traffic management
- Jet sweeping angle control by fluidic oscillators with master-slave designs
- Hot deformation behavior and microstructure evolution of the laser solid formed TC4 titanium alloy
- Electrochemical trepanning with an auxiliary electrode
