Automatic radar antenna scan type recognition based on limited penetrable visibility graph
LIU Songtao,LEI Zhenshuo,GE Yang,and WEN Zhenming
Department of Information System,Dalian Naval Academy,Dalian 116018,China
Abstract: To address the problem of the weak anti-noise and macro-trend extraction abilities of the current methods for identifying radar antenna scan type,a recognition method for radar antenna scan types based on limited penetrable visibility graph(LPVG) is proposed.Firstly,seven types of radar antenna scans are analyzed,which include the circular scan,sector scan,helical scan,raster scan,conical scan,electromechanical hybrid scan and two-dimensional electronic scan.Then,the time series of the pulse amplitude in the radar reconnaissance receiver is converted into an LPVG network,and the feature parameters are extracted.Finally,the recognition result is obtained by using a support vector machine (SVM) classifier.The experimental results show that the recognition accuracy and noise resistance of this new method are improved,where the average recognition accuracy for radar antenna type is at least 90% when the signalto-noise ratio (SNR) is 5 dB and above.
Keywords:antenna scan type,limited penetrable visibility graph(LPVG),support vector machine (SVM),cognitive electronic warfare.
1.Introduction
Since a radar antenna produces electromagnetic radiation,the antenna’s scan characteristics can be used to locate the radar transmitter.More importantly,the accurate recognition of antenna scan type is a crucial basis for understanding the radar transmitter’s operating status and evaluating potential threats [1].The reason is that when searching or tracking a target,the antenna beam scans the designated airspace in different ways.Therefore,the accurate recognition of the antenna scan type can be used to help electronic reconnaissance system to perform realtime analysis of unknown radar information that is acquired and intercepted [2].In other words,improving the recognition accuracy of the antenna scan type is of great significance for enhancing the cognitive ability of electronic warfare system.
Initially,the identification of antenna scan type relied on the operators’ experience and was accomplished by using headphones and stopwatches.With the technological development,most modern recognition methods of antenna scan type begin to perform automatic classification and recognition based on the feature parameters of the signals intercepted by a reconnaissance receiver.For example,Ayzgok et al.[3]extracted parameters such as the main lobe flatness ratio,the peak value of the main lobe,and the amplitude difference,and combined them with a decision tree classifier for recognition.When the signalto-noise ratio (SNR) was 20 dB,the recognition accuracy reached 94%.However,the decision tree classifier relies on the expert’s experience to set classification thresholds,which will introduce human error.Li et al.[4]firstly distinguished mechanical scans from electronic scans using the largest main lobe feature and then using such features as the kurtosis,number of main lobes,and main lobe amplitude difference to discriminate among mechanical scan types.When the SNR was 10 dB,the recognition accuracy reached 85%.Although this method used the classification of support vector machines (SVMs) to avoid human error,it extracted eigenvalues directly from the signal,as in [3],and thus could not avoid noise interference.Similarly,references [5]and [6]focused on proposing new feature parameters and increasing the recognition accuracy by increasing the number of feature dimensions,and no significant improvement was obtained in the antinoise performance.Therefore,in [7],a novel method to recognize the antenna scan type based on graphic signal processing was proposed,which described the similarity of time series in terms of graphic features and used classifiers such as backward propagation (BP) neural networks and SVM for recognition.When the SNR was 8 dB,the recognition accuracy reached 93%.However,the traditional visibility graph model used in this method was susceptible to noise,and there were still problems with compactness and long-range connectivity.
This paper proposes a radar antenna scan type recognition method based on limited penetrable visibility graph(LPVG) [8].Taking advantage of the strong anti-noise ability,compact network connections,and multiple longrange connections of the LPVG model,the recognition of the antenna scan type is performed with the SVM classifier.The results of simulation experiments show that when the SNR is 5 dB and above,the average recognition accuracy is at least 90%.
2.Analysis of radar antenna scan type
The circular scan,sector scan,helical scan,raster scan,conical scan and phased array scan are six common antenna scan types.For different scan types,the relationship between the captured pulse amplitude (PA) and the time of arrival (TOA) is also different,which is the theoretical basis for recognizing the antenna scan type.
2.1 Circular scan
A circular scan is a classic mechanical antenna scan type that can provide azimuth angle and distance information.Circular scans are often used in remote search radar or the search mode of tracking radar.Since a circular scan does not provide an elevation angle,a wide range of elevation angles is required in the search process.At the same time,to improve the azimuth angle resolution,a narrow beam of azimuth angle is often used.During the circular scan,the detected PA is expressed [9]as

wheregis thegth pulse,Apis the standard PA at the interception point of the beam,F(θg) is the gain function’s value of the circular scan’s horizontal beam,TCis the period of the circular scan,andCgis the system stability coefficient of the intercepted circular scan pulse.Fig.1(a)shows the schematic diagram of a circular scan with normalized length.Fig.1(b) shows the PA versus TOA graph for the main beam of a circular scan.
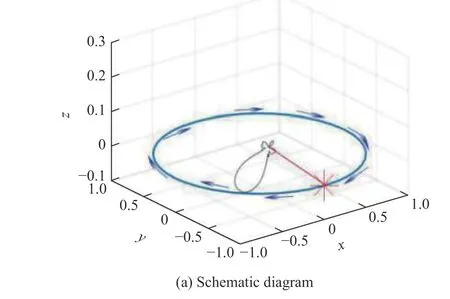
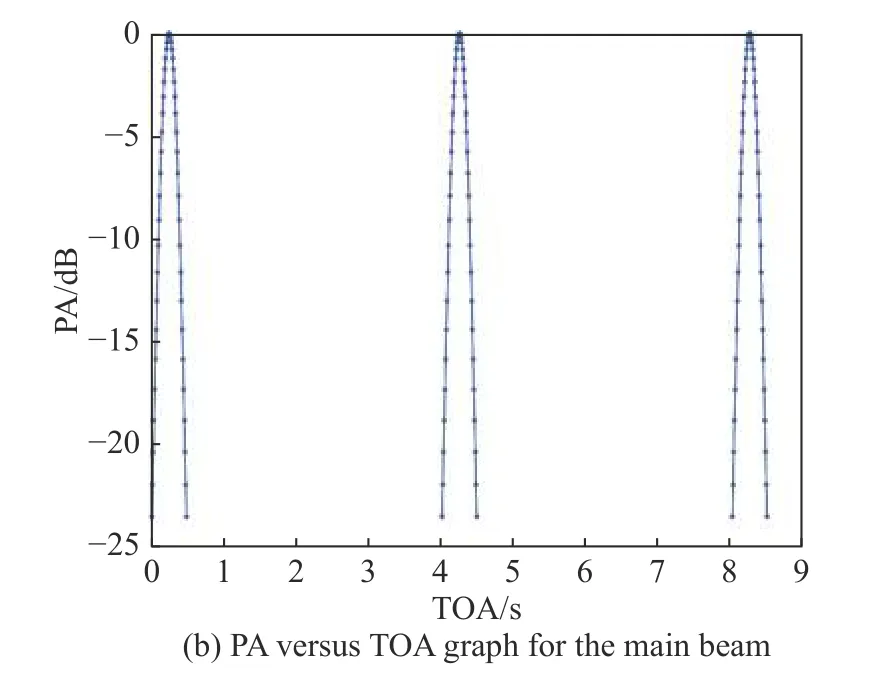
Fig.1 Circular scan
2.2 Sector scan
A sector scan is similar to a circular scan,except that a sector scan operates only within a specific angle range that can meet the requirements of fast scanning.Sector scans include two types,i.e.,unidirectional sector scan and bidirectional sector scan.Taking the unidirectional sector scan as an example,the detected PA is given below [9]:

wherejis thejth pulse,Apis the standard PA at the interception point of the beam,F(θj) is the gain function’s value of the sector scan’s horizontal beam,Tsfis the period of the sector scan,Tais the retrace time interval needed for the beam to reach the limited position,andCjis the system stability coefficient of the intercepted sector scan pulse.Fig.2(a) shows the schematic diagram of a sector scan with normalized length.Fig.2(b) shows the PA versus TOA graph for the main beam of a sector scan.
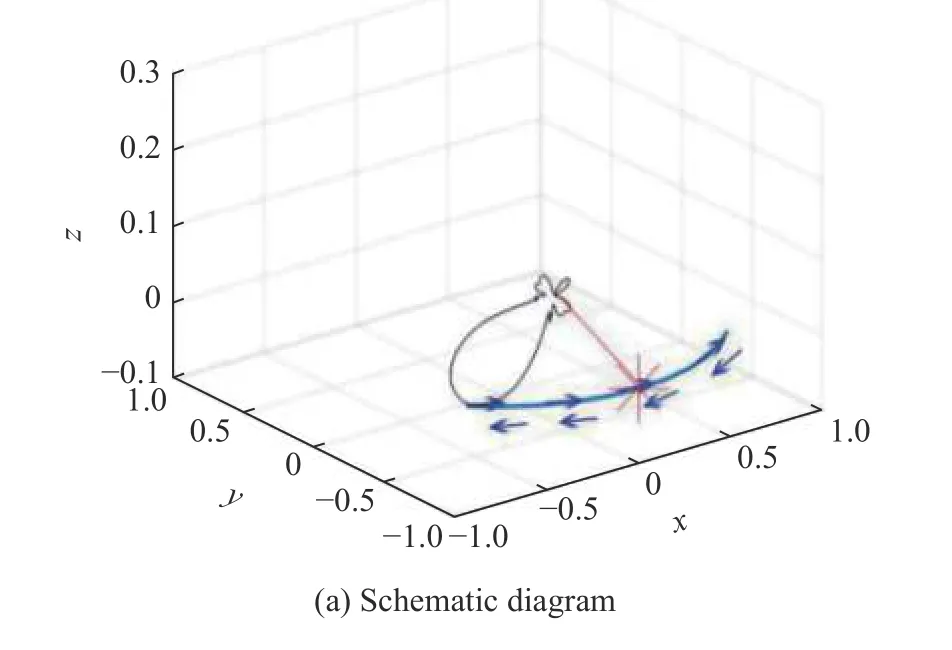
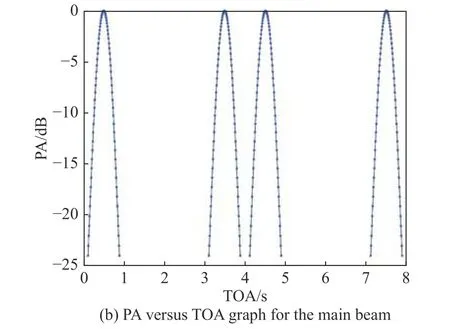
Fig.2 Sector scan
2.3 Helical scan
A helical scan is another commonly used radar scan type.A helical scan performs a rapid circular scan in the azimuth with a slowly rising elevation angle.When the elevation angle reaches the peak,it quickly drops back to the starting point and restarts the scan.Depending on the operating mode,the helical scan can provide information on both the azimuth angle and the elevation angle of the detected radar.The signal power detected during the helical scan is expressed [9]as

wherePtis the radiation power of the radar,Gtis the gain of the radar transmitting antenna in the receiver direction,Gris the gain of the receiver’s antenna,λ is the wavelength of the radar signal,Rris the distance between the radar and the receiver,θ is the angle between the radar beam and the axis,φ is the angle between the radar beam and thexoyplane,andris the distance between the radiation source and the reconnaissance equipment.Since the signal power is the square of the signal amplitude,it is easy to determine the signal amplitude.It can be seen from (3) that the variation of the amplitude of a helical scan signal depends on the relationship between the angles θ and φ,and also the helical scan period.Fig.3(a)shows the schematic diagram of a helical scan with normalized length.Fig.3(b) shows the PA versus TOA graph for the main beam of a helical scan.
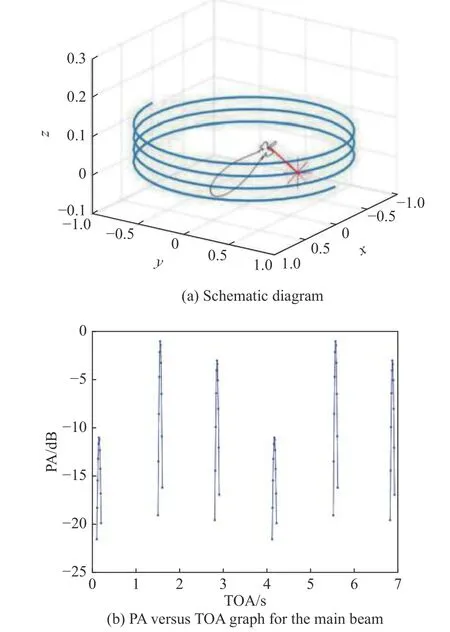
Fig.3 Helical scan
2.4 Raster scan
A raster scan progressively scans an angular area by covering it with parallel-line paths.It can provide information on the azimuth angle and the elevation angle,and it has the characteristics of a fast scan in the azimuth angle and a slow scan in the elevation angle.The signal power received during a raster scan is the same as that shown in(3).Taking a raster scan with azimuth angles θ ∈ (0°,90°) and elevation angles ϕ ∈ 0°,20°,40°,60° as an example,θ and φ in (3) can be expressed [7]as
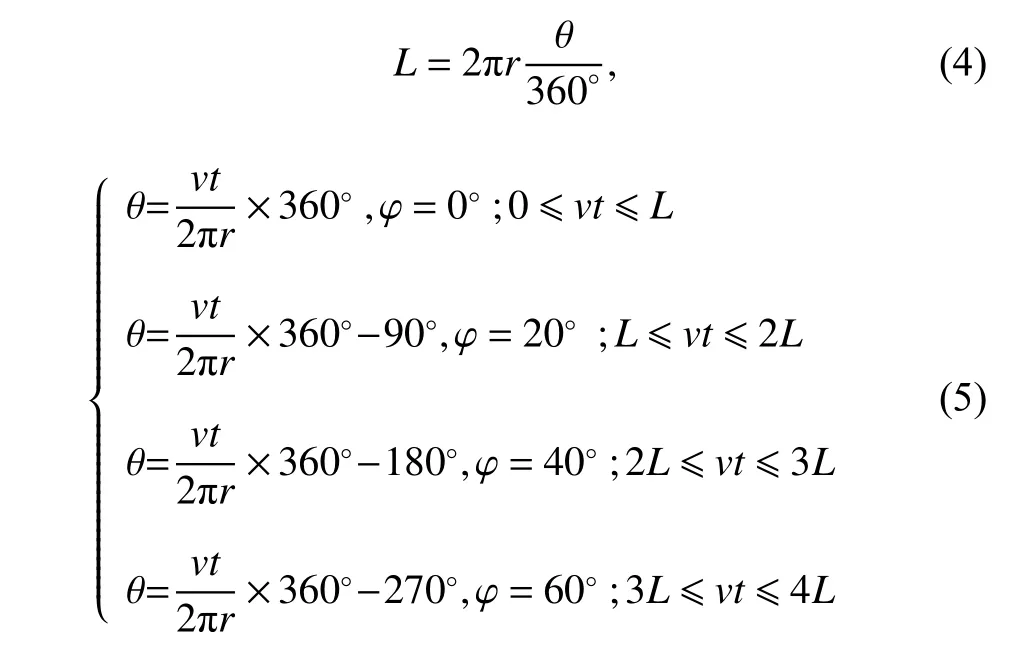
wherevis the raster scan rate,Lis the length of the raster scan,andris the distance between the radar and the receiver.Fig .4(a) shows the schematic diagram of a raster scan with normalized length.Fig.4(b) shows the PA versus TOA graph for the main beam of a raster scan.
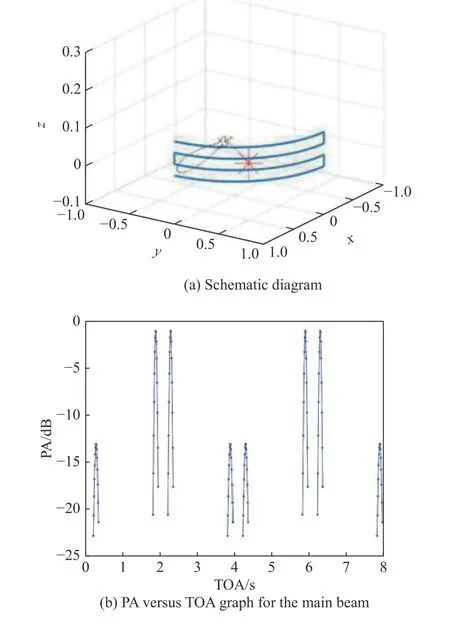
Fig.4 Raster scan
2.5 Conical scan
A conical scan is usually used for target tracking.The amplitude of the signal received is closely related to the relative positions of the radar and the receiver.When the receiver is located in the center of the cone,the amplitude of the signal received is similar to that in a circular scan,and the signal amplitude is the largest.When the receiver is located elsewhere in the cone,the signal amplitude is limited by the cone radius.For a conical scan,the detected PA is expressed [9]as

wherehis thehth pulse,Apis the standard PA at the interception point of the beam,F(θh) is the gain function’s value of the conical scan’s horizontal beam,Tsbis the period of the conical scan,andChis the system stability coefficient of the intercepted conical scan pulse.Fig.5(a)shows the schematic diagram of a conical scan with normalized length.Fig.5(b) shows the PA versus TOA graph for the main beam of a conical scan.
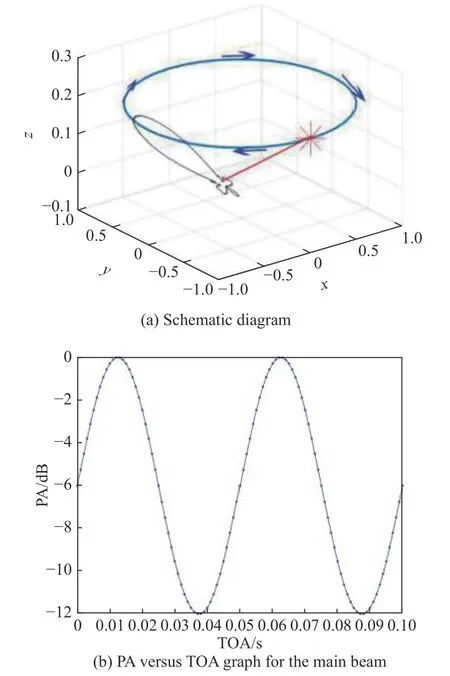
Fig.5 Conical scan
2.6 Phased array scan
Phased array radar controls the feeding phase of each radiating element of an antenna to rapidly change the beam pointing [10].A phased array scan is different from a mechanical scan in that its signal amplitude is discrete and cannot be described by a unified expression.The rule governing the phased array scan is that the amplitude jump between adjacent beams located near the normal direction must be small.As the azimuth angle θ of the scan increases,the beam jump increases according to 1/cosθ.Moreover,due to the flexibility of the phased array scan,radar signals with multiple repetition periods can be transmitted toward the key tracking targets or in the key search directions,that is,the dwell time of the antenna beam in these directions increases to achieve socalled“burn-through”.
Phased array radar composed by linear arrays only has a two-dimensional scan function,that is,it only provides the azimuth angle.To achieve a three-dimensional scan,an electromechanical hybrid scan (also known as one-dimensional electronic scan) or two-dimensional electronic scan is required [4].The electromechanical hybrid scan uses a combination of a phased array elevation angle scan and a circular azimuth angle scan for target search,tracking,and measurement.During a hybrid scan,the azimuth angle θ changes uniformly,and the elevation angle φ changes randomly.A two-dimensional electronic scan obtains three-dimensional information by expanding the array,where the azimuth angle θ and elevation angle φ both change randomly.Fig.6(a) and Fig.6(b) show the PA versus TOA graph for the main beam of electromechanical hybrid scan and two-dimensional electronic scan,respectively.
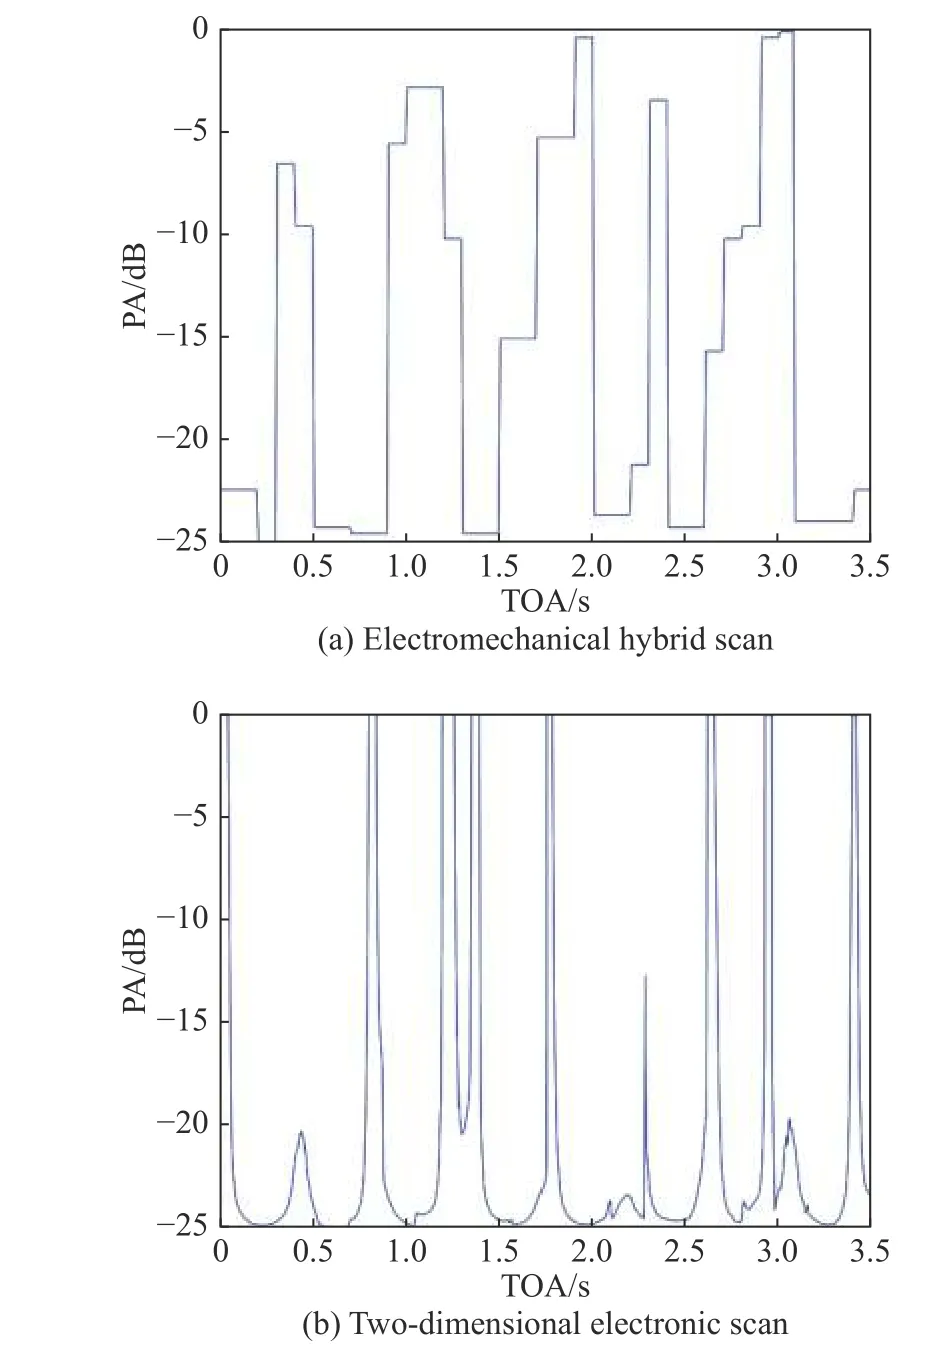
Fig.6 PA versus TOA graph for the main beam
In summary,because radar antenna beams are directed toward different spaces over time,the received signal power changes,resulting in PA-TOA graphs with different shapes.The difference between the mechanical scan,electromechanical hybrid scan and two-dimensional electronic scan is that the beam pointing changes continuously in the mechanical scan,while it changes flexibly in the electromechanical hybrid scan and two-dimensional electronic scan.In contrast,the change in the PA of different beam positions in the mechanical scan is not significant compared with that in the other two scans.Furthermore,the PA of the two-dimensional electronic scan does not change with time.In contrast,the electromechanical hybrid scan retains the characteristics of the mechanical scan and one-dimensional electronic scan,and the PA changes significantly with the TOA.
For different mechanical scan types,the following conclusions can be drawn.The PA-TOA graph of a conical scan has good continuity,while the other mechanical scan types use intermittent pulses.Unlike the conical scan,the PA-TOA graphs of the circular scan and the sector scan only have one main lobe and no peak difference,while other mechanical scan types generally have more than two main lobes and have obvious peak differences.Compared to the conical scan,the sector scan and the raster scan have shorter main-lobe time intervals due to their smaller azimuth range,while other mechanical scan types have longer ones.In short,there are differences,but also have strong correlations in the PA-TOA graphs of different antenna scan types.
3.Antenna scan type recognition based on LPVG
At present,antenna scan types based on PA-TOA sequences face three main challenges that need to be resolved.Firstly,in a complex electromagnetic environment,noise will inevitably affect the PA-TOA sequence detected by the receiver.The recognition of the antenna scan type depends on the fluctuations in the sequence value,so the impact of noise must be reduced as much as possible.Secondly,the macroscopic trend of the PATOA sequence has not been effectively used and only the microscopic features near the main lobe are used,while the macroscopic trends between the main lobes are ignored.Thirdly,the recognition effect improves little by only increasing the feature dimensions,and a new type of model is needed to describe the PA-TOA sequence from different views to improve recognition accuracy.To address these issues,this paper introduces an LPVG model and extracts time-series’ geometric structures to represent similarities,resulting in better distinguishing PA-TOA sequences with high correlations.This idea has achieved good results in the fields of fault assessment [11],medical diagnosis [12],and data analysis [13].
3.1 LPVG model
The visibility graph (VG) model proposed by Lacasa et al.[14]can establish complex network from time series.The basic idea of the VG model is that for discrete time series,the data points are defined as network nodes,and the connection lines between data points that meet the visibility criteria are defined as network edges.The visibility criteria are expressed as

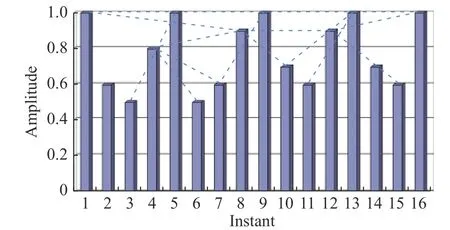
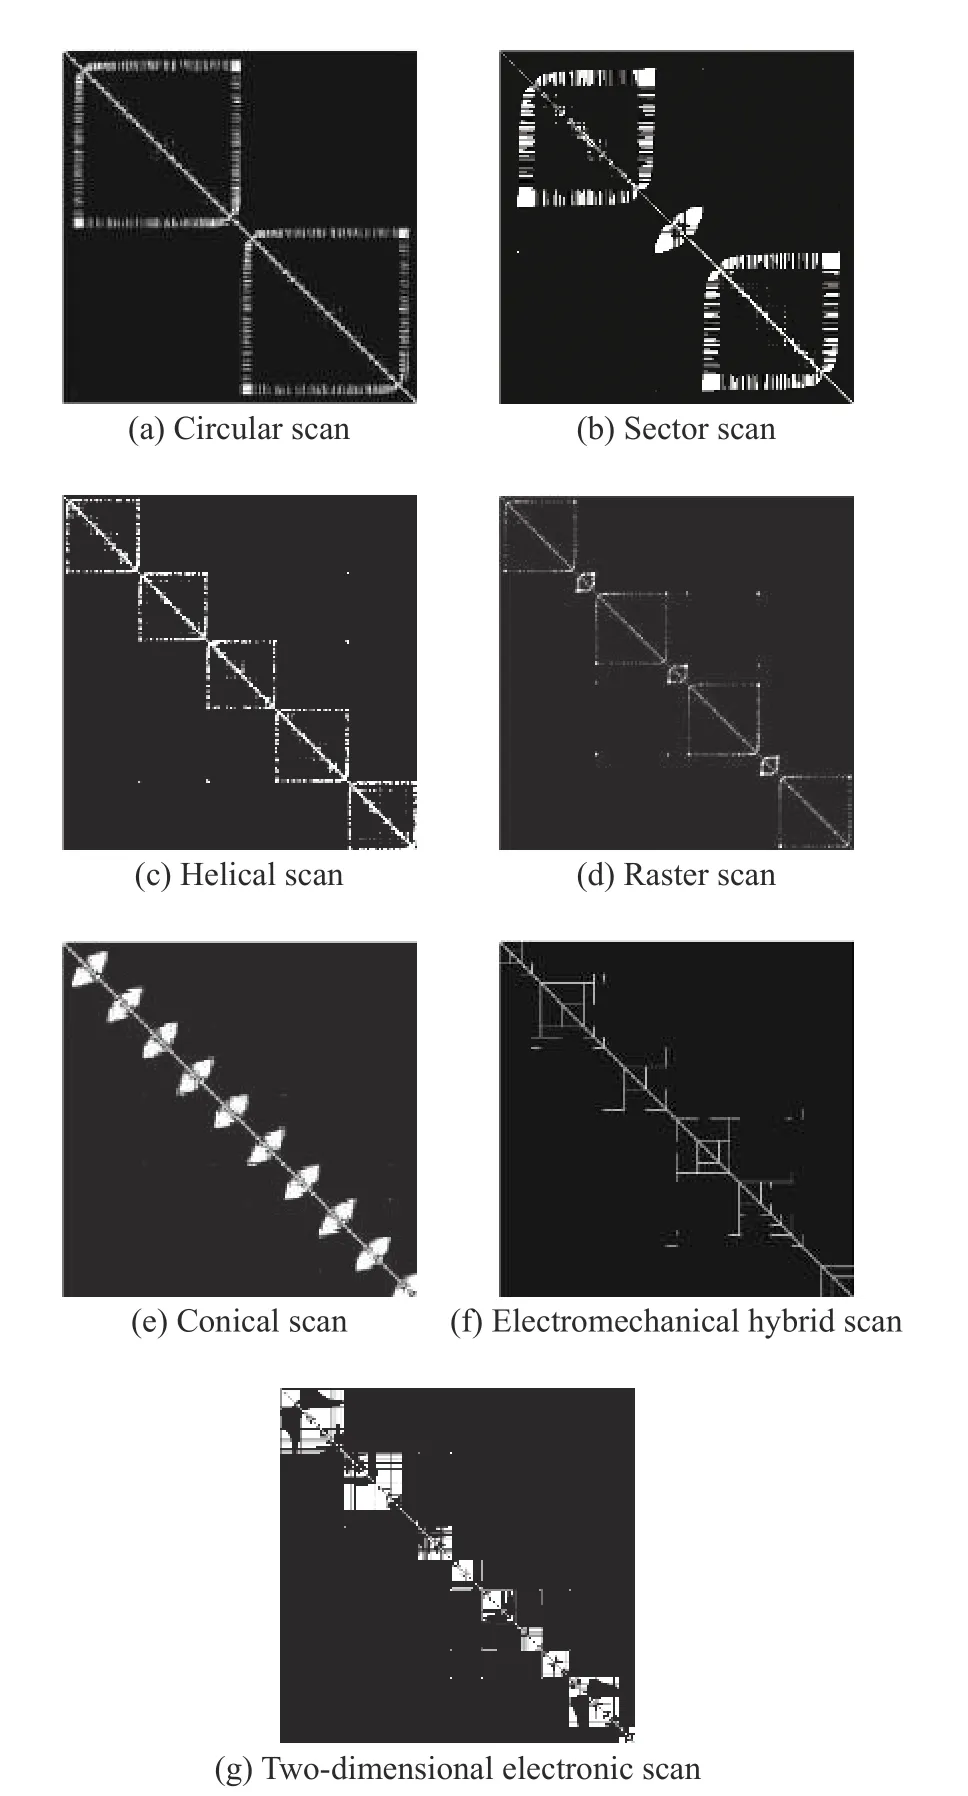
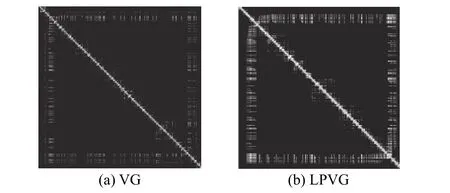
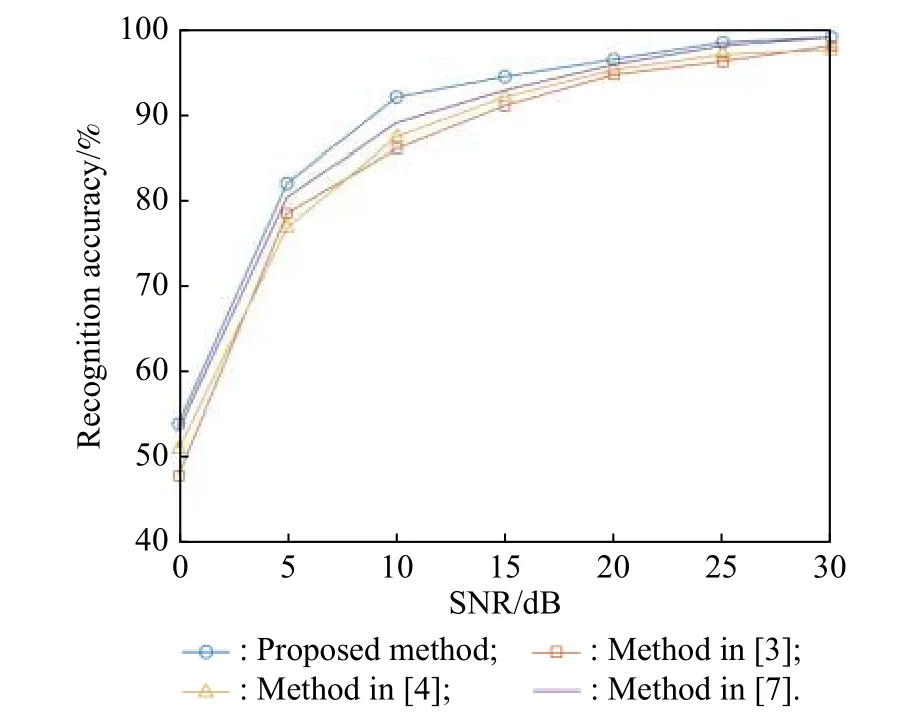
where (ta,xa) and (tb,xb) are the coordinates of two pointsaandbin the time series,(tc,xc) is the coordinate of any point between a and b,ta,tbandtcsatisfyta Fig.7 An illustration of N=16 instants versus signal amplitude for VG algorithm Inspired by the VG model,the concept of an LPVG model [8]is proposed for establishing complex network from time series.The basic idea of an LPVG is as follows.Based on the VG visibility criterion,LPVG proposes an additional rule,which is limited penetrable visibility rangeM.For two nodes which are visible to each other in the VG model,the connection line between two histogram bars to these two nodes cannot pass through other histogram bars.However,in the LPVG model,they are considered to be limited penetrable visible to each other if and only if the connection line is crossedmtimes (wherem≤M) by other histogram bars located between them.According to this rule,whenM=1,the added connection lines of LPVG compared to the VG are as shown in Fig.8. Fig.8 Added connection lines of LPVG compared to VG To better extract LPVG features,a network should be transformed into an LPVG matrix.The rule for constructing the matrix is as follows.If there is a connection line between pointaand pointb,the entry in theath row and thebth column of the matrix is 1,otherwise,it is 0.Fig.9 shows the binary images of the LPVG matrices corresponding to different antenna scan types when SNR=10. Fig.9 Binary images of the LPVG matrices Similar to the VG model,the LPVG model,as a graphic signal processing method,has the characteristics of constant feature for scale change.It can directly extract features of signal sequences with inconsistent time lengths and sampling rates without preprocessing.In addition,the LPVG has also the following advantages.Firstly,it has a greater number of network edges and more compact network connections,and it retains the geometric structure of periodic sequence rules.This makes it easier to distinguish periodic and nonperiodic sequences,as shown in Fig.9(e) and Fig.9(g).Secondly,the LPVG has more long-range connections and retains the macroscopic fluctuation trend of the time series,which is beneficial for distinguishing microsimilar but macrodifferent sequences,such as those in Fig.9(a) and Fig.9(c).Thirdly,the LPVG enhances the ability to penetrate smallscale network connections,making the network less susceptible to noise.This is beneficial for improving the discrimination of feature parameters under low SNR conditions,as those shown in Fig.10(a) and Fig.10(b).Fig.10 shows a local comparison between the binary VG image and the binary LPVG image of a circular scan sequence with SNR=5.It can be seen that the binary LPVG image retains more details. Fig.10 A local comparison between the binary VG image and binary LPVG image of a circular scan sequence The four types of feature parameters of the LPVG network,i.e.,the average degree,clustering coefficient,information entropy,and complexity,are extracted as the input of the subsequent classifier,and each parameter is descripted as below. (i) The average degree is the most intuitive parameter,and it reflects the connection relationships in a network.When the number of nodes is fixed,the greater the average degree’s value,the more connection lines there are in the network.If nodeiis connected to thesedinodes bydiedges,thendiis called the degree of nodei[15].For an LPVG network withNnodes,the average degree is expressed as (ii) The clustering coefficient reflects the clustering degree and coordination of a network.When the number of nodes is fixed,the larger the clustering coefficient is,the better the network coordination and the easier the network is to penetrate.In such a case,the destruction of a single node in the network will not have a large impact on the whole network.Assuming that nodeiis connected to thesedinodes throughdiedges,there can be at mostdi(di−1)/2edges between thesedinodes.Let the number of connected edges that actually exist between thesedinodes beDi,then,the clustering coefficient for nodeiis defined [15]by For an LPVG network withNnodes,the clustering coefficient can be gotten by He brushed ashes from his hands and sat on the sofa beside his wife, her feet propped11 on pillows, her swollen12 ankles crossed, a copy of Dr. Spock balanced on her belly13. Absorbed, she licked her index finger absently each time she turned a page. Her hands were slender, her fingers short and sturdy, and she bit her bottom lip lightly, intently, as she read. Watching her, he felt a surge of love and wonder: that she was his wife, that their baby, due in just three weeks, would soon be born. Their first child, this would be. They had been married just a year. (iii) Information entropy is used to indicate the degree of disorder or chaos in a system.The greater the information entropy,the greater the uncertainty of the system[16].For an LPVG network withNnodes,the information entropy can be written as Then,the information entropy is normalized and rewritten as whereEmaxis the maximum theoretical value of the information entropy,and at this maximum value,all nodes are connected to each other.Eminis the minimum theoretical value of the information entropy,and at this minimum value,all nodes are connected to each other by only two adjacent points (head and tail nodes are only connected to its adjacent points).EmaxandEmincan be expressed as (iv) Complexity is a parameter that represents the complexity of a network through LPVG matrix eigenvalues,and it reflects the number of edges of a binary image.For an LPVG network withNnodes,the complexity is defined by wherernormis the maximum eigenvalue of the normalization matrix,and it can be expressed as whereNis the number of nodes,rmaxis the actual maximum eigenvalue of the matrix,N−1 is the upper limit of the maximum eigenvalue of theN-dimensional matrix,and 2cosis the lower limit of the maximum eigenvalue of theN-dimensional matrix. The SVM classifier is a generalized linear classification algorithm with a good learning effect for small samples and an excellent generalization ability.When an SVM is used for radar scan type recognition,the processed LPVG network features are used as the SVM’s input,and the SVM is trained by using knowledge-based data to determine the mapping relationship between LPVG network features and antenna scan types. The basic principle of an SVM is to map sample data to a Hilbert space through the kernel function method,that is,a hyperplane is constructed to transform a nonlinear classification problem into a linearly separable problem.The determination of this hyperplane should satisfy the conditions that the distance between each sample and the hyperplane is as large as possible and the classification error is as small as possible.By the hyperplane’s discrimination,the final samples are divided into two or more categories.The classification function can be given as follows: whereSVis the support vector set,asis the Lagrangian multiplier,k(xs,x) is the kernel function,xsandysare the support vectors in certain specific category,andbis the threshold. In the experiment for antenna scan type recognition,the simulation parameters are set as follows.The scan time is 4 s,the average beam dwell time is 0.1 s,the horizontal beam’s gain function’s valueF(θ) is 1 for each scan type,the system stability coefficientCis also 1 for each scan type,the radar radiation powerPtis 1 dB,and the gainGtof the radar’s transmitting antenna in the receiver direction is 1,the receiver’s antenna gainGris 1.In addition,the radar signal wavelength λ is 5×10⁻³m,the range of the azimuth angle is (0,360°),the range of the elevation angle isespecially the range of the azimuth angle is (0,90◦) for the sector and raster scans,and the interval of the elevation angle is 20° for the raster scan. The experiments study the antenna scan type recognition for circular scan,sector scan,helical scan,raster scan,conical scan,electromechanical hybrid scan and two-dimensional electronic scan.For the same SNR,by adjusting such factors as the pulse repetition interval (PRI),antenna beam width and receiver position,50 samples are obtained for each scan type,with a total of 350 samples.And 80% of the samples of each scan type are randomly selected as the training set,with the other 20% of the samples as the testing set.The SVM’s kernel function uses a radial basis function (RBF),and the SVM’s penalty coefficientcand kernel function parametergare obtained by the particle swarm optimization algorithm.To verify the advantage of this novel method,it is compared with the methods in [3],[4]and [7]. The recognition results of the above antenna scan types after 50 Monte Carlo simulations under different SNRs are shown in Fig.11.The recognition accuracy of the proposed method increases with an increasing SNR.When the SNR is 5 dB,the recognition accuracy is 83%,at 8 dB,the recognition accuracy is 90%,at 10 dB,the recognition accuracy is 92%,and at 20 dB,the recognition accuracy is 96%.It should be noted that due to the difference between the training and testing sets,the reproduction results of the methods in [3],[4]and [7]are slightly different from the original ones. Fig.11 Recognition results of antenna scan type by using different methods Among the four recognition methods,the proposed method has the highest recognition accuracy.The method in [3]set the threshold of the decision tree classifier to perform layer-by-layer classification through expert experience,which introduced human error.The method in[4]used an SVM classifier to avoid human error but also directly extracted parameters such as kurtosis,the number of main lobes and the difference in main lobes from the signal as features,which led to unsatisfactory antinoise performance.The method in [7]used the VG model to extract time series features to improve the recognition accuracy.However,due to the limitations of the VG model,there are still problems in terms of noise resistance and the ability to extract macroscopic trends.In contrast,the method proposed in this paper combines the advantages of the LPVG’s strong ability to penetrate noise,its compact network connections,its multiple long-range connections,and its lack of human error.Therefore,the recognition effect of the proposed method is the best. Table 1 shows the recognition results of the antenna scan type for the circular scan,sector scan,helical scan,raster scan,conical scan,electromechanical hybrid scan and two-dimensional electronic scan with SNRs of 5 dB and above.The recognition results of each scan type are drawn from 10 groups of testing sets with SNRs of 5 dB,10 dB,15 dB,20 dB,25 dB,and 30 dB,for a total of 60 groups.As shown in Table 1,the average recognition accuracy of the proposed method is at least 90%.The recognition effect for electromechanical hybrid scan is relatively poor,because the hybrid electromechanical scan has the characteristics of both mechanical scan and twodimensional electronic scan,easily misrecognized as the other two types.Incorrect classifications are also prevalent for the circular scan and helical scan,because the basic principles of the two scans are strongly correlated,which leads to weaker discrimination of feature values.In contrast,the recognition accuracy of the proposed method for the sector scan,raster scan,two-dimensional electronic scan and conical scan is higher. Table 1 Recognition results for the proposed method (SNR≥5 dB) This paper proposes an automatic recognition method for the radar antenna scan type based on LPVG.Based on the analysis of seven radar antenna scan types,i.e.,the circular scan,sector scan,helical scan,raster scan,conical scan,electromechanical hybrid scan and two-dimensional electronic scan,and considering the LPVG’s ability to penetrate noise,its compact network connections,and its long-range connections,the PA-TOA sequence is converted into an LPVG network,and feature parameters are extracted.Then,the SVM classifier is used to recognize the antenna scan types.The simulation results show that the proposed method can classify and recognize seven types of radar antenna scan better.In detail,when the SNR is 5 dB and above,the average recognition accuracy is at least 90%.At present,the proposed method is only used to recognize these seven common radar antenna scan types.Further research should focus on how to classify and recognize antenna scan types such as spiral scan,Palmer scan and lobe switching scan.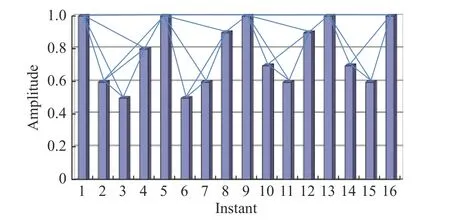
3.2 Extraction of LPVG features


3.3 SVM classifier

4.Simulation results

5.Conclusions
 Journal of Systems Engineering and Electronics2021年2期
- Journal of Systems Engineering and Electronics的其它文章
- Target maneuver trajectory prediction based on RBF neural network optimized by hybrid algorithm
- Data-driven evolutionary sampling optimization for expensive problems
- A dual population multi-operator genetic algorithm for flight deck operations scheduling problem
- Observation scheduling problem for AEOS with a comprehensive task clustering
- An improved estimation of distribution algorithm for multi-compartment electric vehicle routing problem
- VCR-LFM-BPSK signal design for countering advanced interception technologies
