Advanced optimization of gas turbine aero-engine transient performance using linkage-learning genetic algorithm: Part II, optimization in flight mission and controller gains correlation development
Yinfeng LIU, Soheil JAFARI, Theoklis NIKOLAIDIS
a Aero Engine Test Department of Hunan Aviation Powerplant Research Institute, AECC, Zhuzhou 412002, China
b Centre for Propulsion Engineering, School of Aerospace Transport and Manufacturing (SATM), Cranfield University, Cranfield MK43 0AL, UK
KEYWORDS Aeroengine control;Control optimization;Flight condition;Flight mission simulation;GA;GTE;LLGA;Min-Max controller;Robustness
Abstract Part Ⅰhas illustrated the procedures to apply the Linkage Learning Genetic Algorithm(LLGA) in Gas Turbine Engine (GTE) controller gains tuning and generated the optimization results for runway conditions from idle to takeoff. However, the total pressure and temperature of the engine inlet vary as the changing of altitude and Mach number,which would lead to the variation in fuel flow supply regulation.As a result,the optimized gains in runway might not be suitable for other flight conditions. In order to maintain the optimal control performance, the GTE controller gains should be adjusted according to the flight conditions. This paper extends the application of the LLGA method to other flight conditions and then simulates a complete flight mission with different gains and weather condition configurations.For this purpose,the control parameters in the Simulink model of the GTE controller are first corrected by the weather condition in altitude.Then,a typical flight mission is defined and divided into different flight segments based on the altitude and Mach number configuration.One representative point is selected from each segment as the datum point for optimization process. After this step, the LLGA method is used to find the best gains combinations for different flight conditions and the differences in optimization effects for different flight conditions are analyzed subsequently. The simulation results show that the optimization effect of the control performance of each flight condition is dependent on the value of and the optimal Kpla in some flight conditions is approximately equal to θδ times of the Kpla value in sea level standard condition.Finally,the complete flight mission is simulated with different gains and weather condition configurations.The simulation results show that the engine performance has been greatly improved after optimization by LLGA in the transient state and the high altitude conditions. In other steady states, the optimization effect is not very obvious.
1. Introduction
When an aircraft flies in the sky,the total pressure and temperature of the engine inlet vary as the changing of altitude and Mach number.This will lead to the variation in fuel flow supply regulation.As a result, the GTE controller gains which work well in Sea Level Standard (SLS) condition may not be suitable for other flight conditions. In order to maintain the good control performance, the GTE controller gains should be adjusted according to the weather condition during the flight mission. Many Meta-heuristic Global Optimization(MGO) algorithms have been proposed and applied in GTE controller optimization problems, including Particle Swarm Optimization (PSO), Ant Colony Optimization (ACO), Invasive Weed Optimization(IWO),and Bee Colony Optimization(BCO).However, most of these studies only focus on the controller optimization in SLS condition and the influence of the weather condition exerted on the optimization effect is rarely studied.
The Min-Max controller has been widely used in the industrial control domain and many researches about its applications in aero engine controller were also published.The fuzzy theory is regarded as one potential methodology to optimize the control performance or tracking performance. Many different T-S fuzzy norms are applied in the Min-Max controller to improve the control performanceThe nonfragile Hfilter design method is applied for continuous-time T-S fuzzy systems inin which the designed filter is assumed to have two types of multiplicative gain variations. The fuzzy adaptive control strategy is also used to solve the asymptotic tracking control problem of a class of uncertain switched nonlinear systems inwhere a novel discontinuous controller with dynamic feedback compensator is designed. The nature and characteristics of non-linear switching systems are wellstudies in the literature from different points of view including performance and modelling,control strategy design and analysis,implementation considerations,stabilization,and stability analysis.However, most of the papers in gas turbine aero-engines applications treat the Min-Max controller (or other fuzzy norms) as a black box and do not analyze the detail working process inside.As a result, sometimes it is not known that which transient loops are activated and which constraint is the dominant limitation during the control process,especially for the transient process.But this detail information is very important to help the designers to analyze the reasons for fluctuation and deviation of the engine performance and guide the direction of improving the control performance.
In part Ⅰ,a new LLGA method was proposed for GTE controller gains tuning problem and applied in runway condition from idle to takeoff. In this paper, the influence of flight conditions including altitude and Mach number will be considered in the controller performance and then the LLGA method will be extended to GTE controller optimization in different flight conditions. As a result, by adopting different optimized controller gains according to the changing of flight conditions during the whole flight mission, better control performance is expected to be achieved than applying the constant gain values in different flight conditions.For this purpose,the principle to correct the control parameters by weather condition is first presented. Then a classical flight mission is defined and the typical operational points are selected to characterize different flight segments in the flight mission. After this, the LLGA method is used to optimize the controller gains for different flight conditions. The simulation results are analyzed from the aspects of weather condition, working process of the Min-Max selection and the robustness of the GTE controller.Moreover, the complete flight mission simulation is implemented with the GTE controller configured with different gains and weather condition combinations.However,the flight condition changes continuously during the whole flight mission while the optimization controller gains are acquired only based on the representative condition points. This will make the engine performance during the flight condition to be a little different from the simulation results in separate flight conditions, which will also be illustrated in this paper. Finally, the flight mission simulations are implemented with three different control parameter configurations. The simulation results are analyzed and the detail working processes within the Min-Max controller during the flight mission are illustrated. In addition,the control performances of different control parameter configurations are compared to confirm the effectiveness of the proposed methodology to optimize the performance of the engine and controller as a closed-loop system.
2. Control parameters correction
In order to simulate the flight conditions, the altitude and Mach number will be taken into consideration and the rotational speed and fuel flow will be corrected by weather conditions. Therefore, weather condition block is added into the GTE controller model as shown in Fig. 1.
In the SLS,the ambient temperature and pressure are set as 288.15 K and 101325 Pa. The ambient temperature tand pressure pat altitude H can be calculated by utilizing Eqs.(1) and (2).

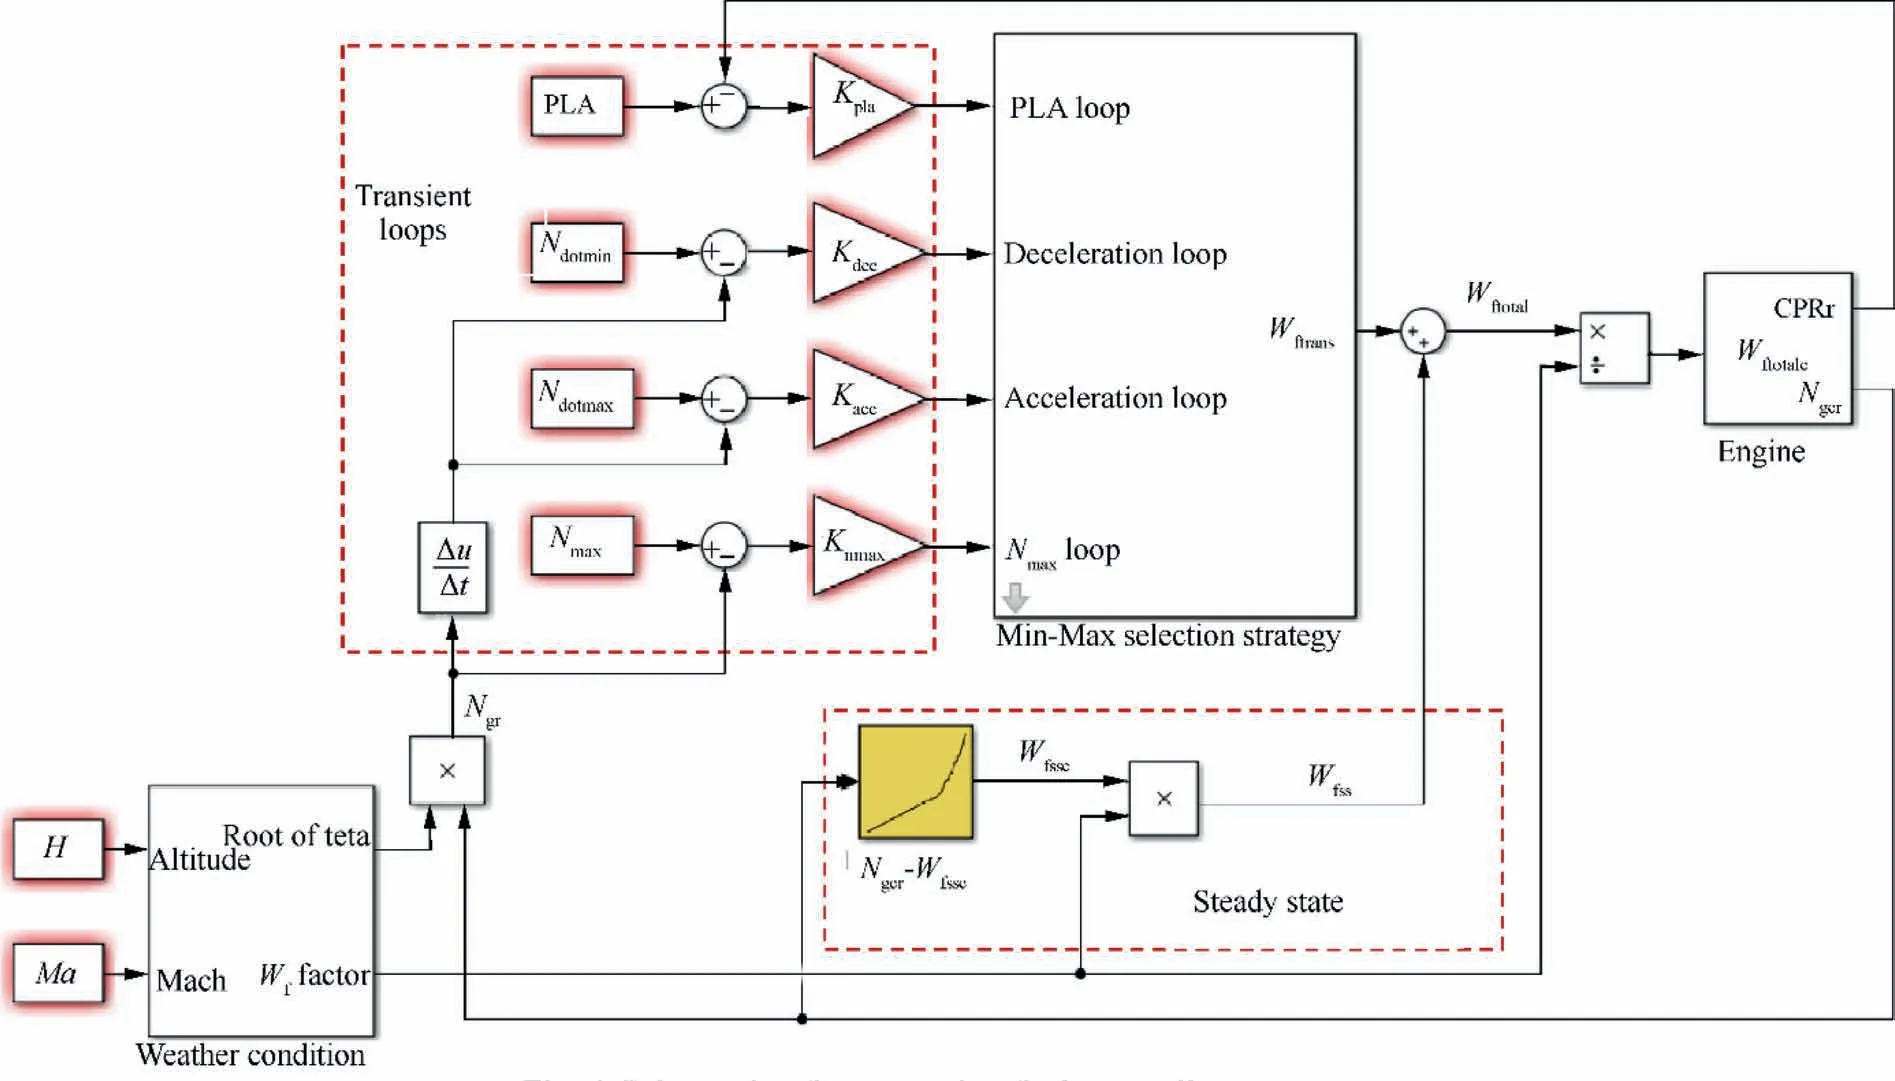
Fig. 1 Schematic of aero-engine fuel controller structure.
Considering the flight Mach number,the total temperature Tand total pressure Pof the engine inlet at altitude H and Mach number Ma can be calculated by Eqs. (3) and (4).

where γ is the ratio of specific heats and has the constant value of 1.4.
Then non-dimensional temperature θ and pressure δ are calculated by Eqs. (5) and (6).

In the limitation loops, the safety concern is evaluated by the physical rotational speed and physical acceleration or deceleration, so the relative corrected rotational speed under SLS, i.e. N, should be converted into the relative physical rotational speed Nbefore entering the limitation loops as depicted in Eq. (7). As a result, the output of Min-Max selection is the physical transient fuel flow W. The corrected steady state fuel flow Wis calculated through interpolation method from the fuel-Nschedule. In order to keep consistent with the transient fuel flow, the output fuel flow from the steady state control loop should also be converted into physical fuel flow Wby Eq. (8).Before entering the engine,the physical total fuel flow Wshould be corrected to Wunder SLS by Eq. (9). After these steps, the work of building the GTE controller is finished.


3. Description of the flight mission and definition of the flight conditions
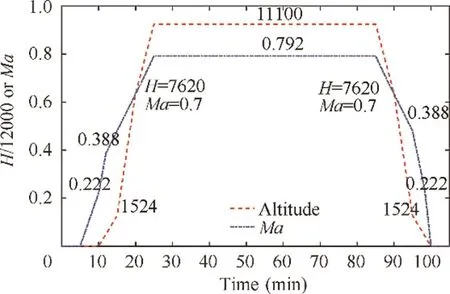
Fig. 2 Altitude and Mach number changing during flight mission.

Table 1 Representative weather conditions for different flight mission segments.
Fig. 2 shows the altitude and Mach number curves during a typical flight mission. Based on the altitude & Mach number configurations, the flight mission is divided into ten segments which are specified in Appendix. The altitudes of three climb segments are 0-1524 m, 1524-7620 m and 7620-11100 m respectively.The equivalent air speed during the altitude range 457.2-7620 m is around 128.5 m/s (250 kts). For the sake of simplicity, one representative point is selected from each segment and depicted in Table 1.In Section 4,the LLGA method will be applied on GTE controller gains tuning in different flight conditions and the genetic process parameters are the same as part Ⅰ.The optimized engine control performance will be compared with that of initial controller gains as shown in Table 2. In order to keep the consistency, the PLA command in each simulation scenario will be the same as part Ⅰwhich is shown in Fig. 3. In this figure, the PLA experiences a step increase from 0.6 to 1.0 at t=15 s and a step decrease from 1.0 to 0.7 at t=30 s. This PLA command is used to simulate the sudden change in the input command to the controller as the worst case scenario. Moreover, the definition of the objective function for control performance is also the same as part Ⅰwhich is shown in Eq. (10).

where RT is the normalized response time; FC is the normalized fuel consumption; Pis the penalty for oscillation during 0-15 s;Pis the penalty for oscillation during 30-45 s;Pis the penalty for the error between CPR and PLA;Pis the penalty for overspeed;Pis the penalty for over acceleration;Pis the penalty for over deceleration. The specific definition of each item has been illustrated in part Ⅰ.
4. Optimization results for different flight conditions
4.1. Take-off (H=0, Ma=0.222)
In the take-off condition, the aircraft is on the ground while the flight speed is accelerated,and the aero-engine works under the maximum power/thrust setting. Apply LLGA on controller gains tuning, then the fitness value convergence is shown in Fig. 4. In the figure, the minimum fitness value is already very low at the first generation and it only decreases by 2.3% during the next 29 generations. This verifies the fact that the minimum fitness value is reduced after BBs detection.
The standard deviation of the fitness value is shown in Fig. 5. The standard deviation has a great decrease in the first 2 generations, then it maintains at a relative high level during the generations of 3-22 and finally experiences an obvious reduction in the last 8 generations. This phenomenon is verysimilar to the scenario of ground idle and the reason for this has been illustrated in part Ⅰ.

Table 2 Initial gains of GTE controller.3
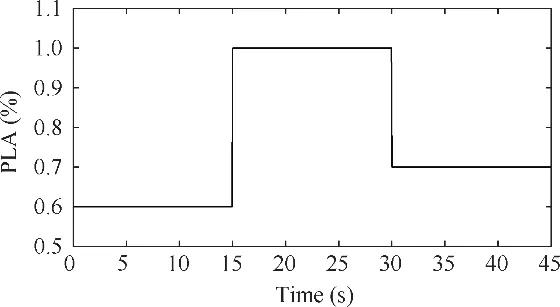
Fig. 3 Variation of PLA value for simulation.
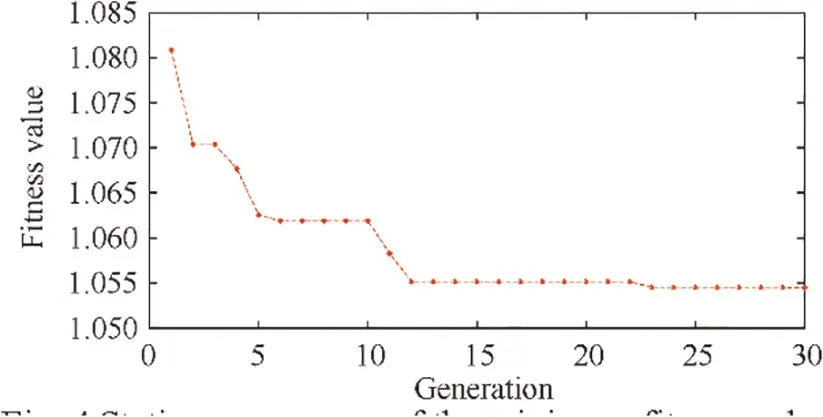
Fig. 4 Static convergence of the minimum fitness value.
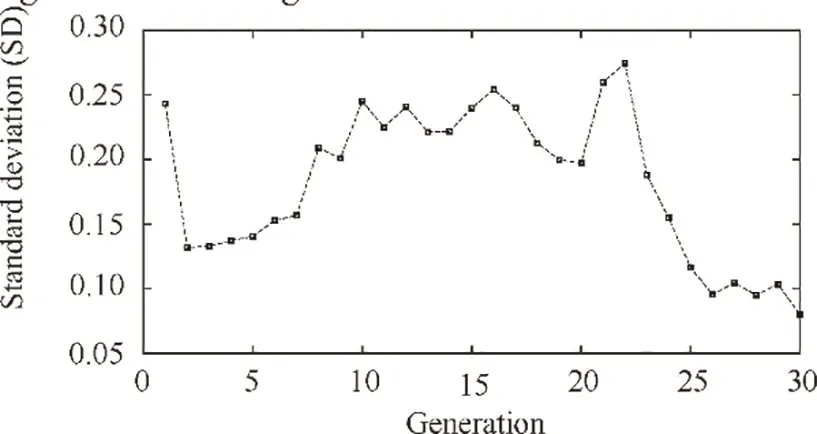
Fig.5 Standard deviation of the fitness value at each generation.

The Nderivative is shown in Fig.7.In the figure,both the Nderivative before and after optimization have not exceeded the safe bounds. Moreover, the optimized controller has used the safety margins to improve the engine performance.
4.2. Begin of climb (H=457.2, Ma=0.388)
During the climb part of a flight condition, the aircraft rises from altitude of 0 m to 11,100 m and the Mach number increases from 0.222 Ma to 0.792 Ma. As a result, the GTE inlet total temperature and pressure change a lot during the climb process. In order to ensure the reliability of the optimized controller gains, the climb process is divided into three scenarios, i.e. begin of climb (BOC), climb and top of climb(TOC). The gains tuning of these three flight conditions are studied in Sections 4.2, 4.3 and 4.4 respectively.
In ground idle and take-off, the best fitness values are found in the 28th and the 30th generation respectively. In order to verify whether the fitness value would continue to decrease beyond the 30th generation, the iteration generation in climb is set to be 40. Apply LLGA on controller gains tuning,then the fitness value convergence is shown in Fig.8.During the whole evaluation process, the minimum fitness value decreases by 3.3%and reaches the bottom at the 26th generation which means that 30 generations are large enough for sufficient convergence.The standard deviation of the fitness value is shown in Fig.9.It increases in the first 7 generations,then it maintains at a relative high level during the generations of 8-27 and finally experiences an obvious reduction during the generations of 28-35.

The Nderivative is shown in Fig. 11. In the figure, both the Nderivative before and after optimization have not exceeded the safe bounds. Moreover, the optimized controller has used the safety margins to improve the engine performance.
4.3. Climb (H=6096, Ma=0.589)
Climb is the middle part of the rise phase of a flight mission,and its representative condition point is H=6096,Ma=0.589.Set this weather condition in the GTE controller model and apply LLGA on controller gains tuning, then the fitness value convergence is shown in Fig. 12. In the figure,the minimum fitness value is already very low at the first generation and it only decreases by 0.76%during the next 29 generations. Fig. 13 shows the standard deviation of the fitness value at each generation.In this figure,the standard deviation of the fitness value has a dramatic decrease at the first three generations and then maintains at a relative low level during the following generations except for the 23th and 24th generations. The high standard deviations in these two generations are caused by the mutation operator which generates some individuals of high fitness values.
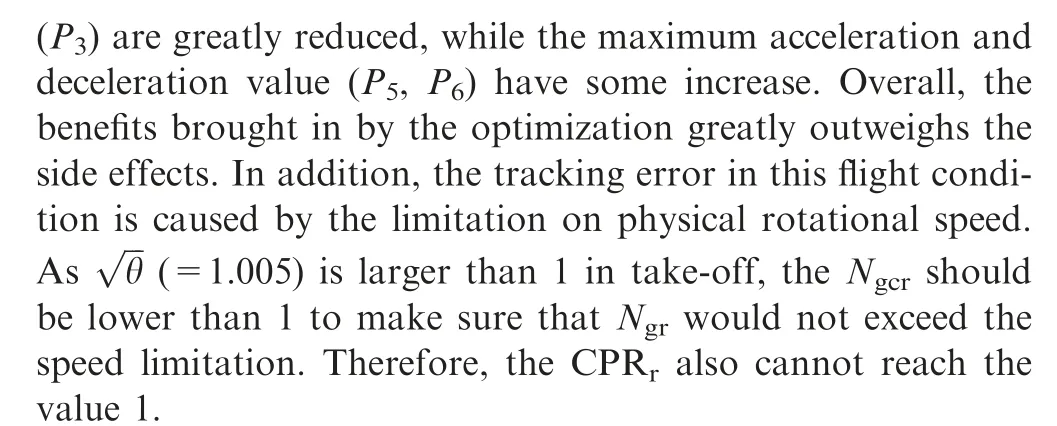
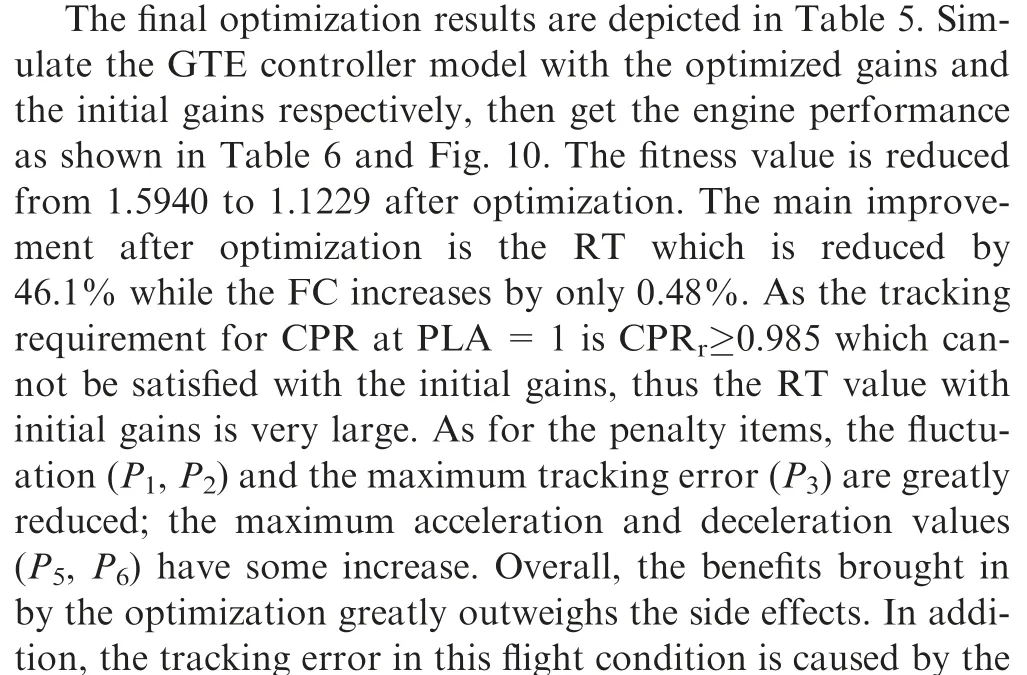
The final optimization results are depicted in Table 7.Simulate the GTE controller model with the optimized gains and the initial gains respectively, then the comparison between the controller performance before and after optimized is depicted in Table 8. The fitness value is greatly reduced from 1.2381 to 0.7990 after optimization. Almost all the items in the objective function are greatly improved after optimization except for RT.
The engine performance with initial gains is shown in Fig.14.In this figure,the CPR and Nfluctuates dramatically especially at the PLA settings of 0.6 and 0.7. Moreover, the short response time of initial controller is achieved at the expense of inducing more tracking error and fluctuation.Undoubtedly, the initial gains are unacceptable in the flight condition of climb. The normalized acceleration/deceleration is shown in Fig. 15 and the maximum acceleration has exceeded the surge bound.

4.4. Top of climb (H=10000, Ma=0.78)
TOC is the third part of the rise phase of a flight mission,and its typical condition point is H=10000, Ma=0.78. Set this weather condition in the GTE controller model and applyLLGA on controller gains tuning, then the fitness value convergence is shown in Fig.18.In the figure,the minimum fitness value decreases by 1% during 30 generations. Fig. 19 shows the standard deviation of the fitness value at each generation.In this figure, the standard deviation reduces a lot as the generation increases, especially for the first four generations.

Table 3 Optimized controller parameters.

Table 4 Performance and penalty function values before and after optimization.
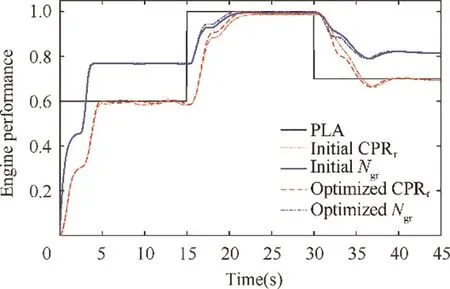
Fig. 6 Engine performance before and after optimization.
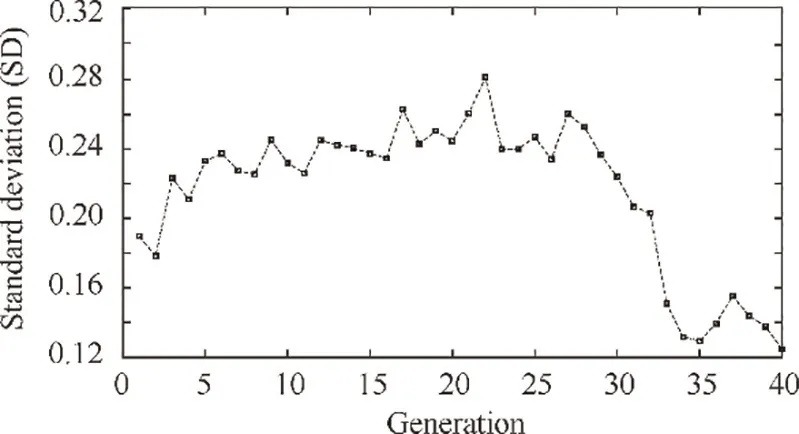
Fig.9 Standard deviation of the fitness value at each generation.
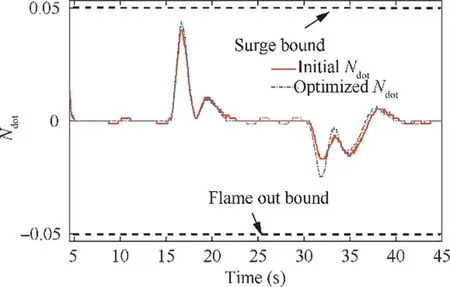
Fig. 7 Derivative of engine rotor speed before and after optimization.
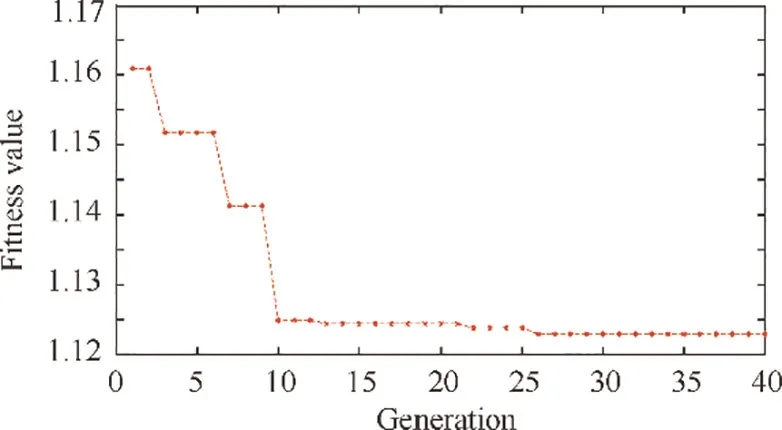
Fig. 8 Static convergence of the minimum fitness value.
The final optimization results are depicted in Table 9. Simulate the GTE controller model with the optimized gains and the initial gains respectively, then the comparison between the controller performance before and after optimized is depicted in Table 10. The fitness value is reduced from 3.7445 to 0.7089 after optimization. Almost all the items in the objective function are greatly improved after optimization except for RT.
The engine performance with initial gains is shown in Fig.20.In this figure,the CPR and Nfluctuates dramatically and follow the rule that the lower the PLA setting is,the more dramatical fluctuation they have.Moreover,the short response time of initial controller is achieved at the expense of inducing more fluctuation, more tracking error and overspeed. In addition, the CPR has deviated from PLA when PLA=0.6.Undoubtedly, the initial gains are unacceptable in TOC. The normalized acceleration/deceleration is shown in Fig. 21 and the maximum acceleration/deceleration has exceeded both the surge bound and the flame out bound.
The engine performance after controller optimization is shown in Fig. 22. In the figure, the CPR can track with the PLA well while the Ncannot reach 1. The reason for this has been illustrated in Section 4.3. The normalized acceleration/deceleration is shown in Fig. 23 and it stays within the safe zone during the whole simulation time.
4.5. Cruise (H=11100, Ma=0.792)
Cruise is the main part of a whole flight mission. In this condition, the aircraft flies in the highest altitude and highest Mach number and the representative condition point is H=11100, Ma=0.92. Set this weather condition in the GTE controller model and apply LLGA on controller gains tuning, then the fitness value convergence is shown in Fig. 24. In the figure, the minimum fitness value decreases by 2.5% during 30 generations. Fig. 25 shows the standard deviation of the fitness value at each generation. In this figure, the standard deviation reduces a lot as the generation increases,especially for the first three generations.

Table 5 Optimized controller parameters.

Table 6 Performance and penalty function values before and after optimization.
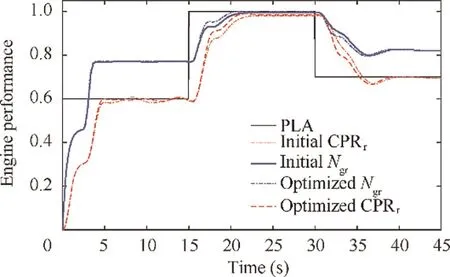
Fig. 10 Engine performance before and after optimization.
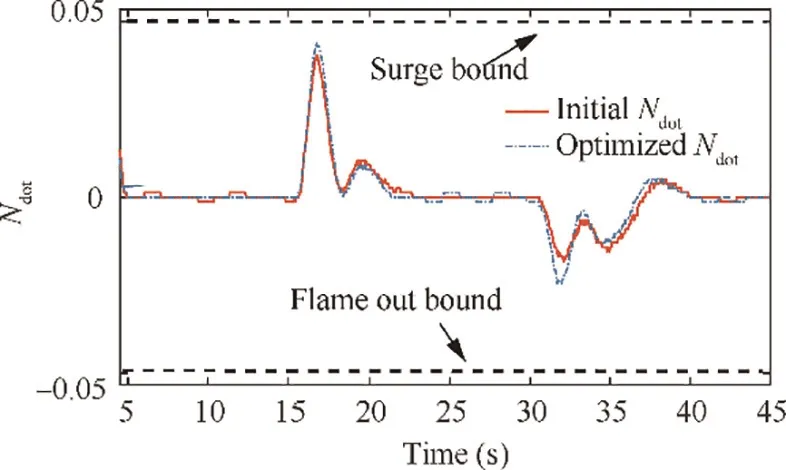
Fig. 11 Derivative of engine rotor speed before and after optimization.
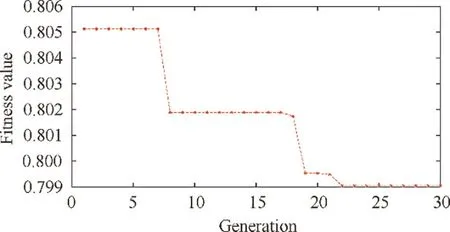
Fig. 12 Static convergence of the minimum fitness value.
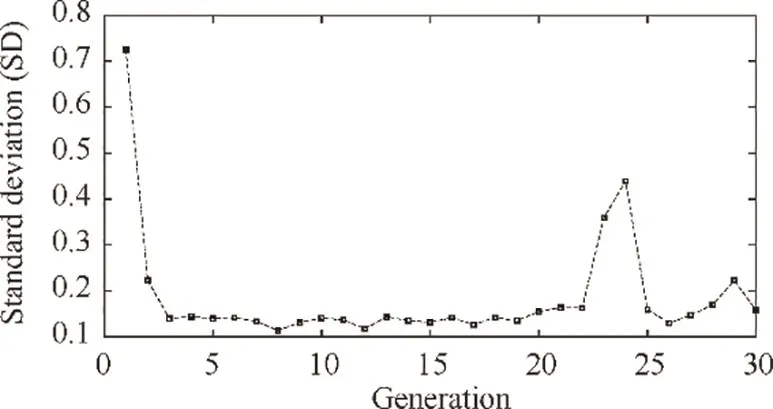
Fig. 13 Standard deviation of the fitness value at each generation.
The final optimization results are depicted in Table 11.Simulate the GTE controller model with the optimized gains and the initial gains respectively, then the comparison between the controller performance before and after optimized is depicted in Table 12. The fitness value is reduced from 7.2427 to 0.7061 after optimization. Almost all the items in the objective function are greatly improved after optimization except for RT.
The engine performance with initial gains is shown in Fig.26. In this figure, the CPR and Nfluctuate dramatically and follow the rule that the lower the PLA setting is,the more dramatical fluctuation they have.Moreover,the short response time of initial controller is achieved at the expense of inducing more fluctuation, more tracking error and overspeed. In addition, the CPR has deviated from PLA during the whole simulation time. Undoubtedly, the initial gains are unacceptable in cruise. The normalized acceleration/deceleration is shown in Fig. 27 and the maximum acceleration/deceleration has exceeded both the surge bound and the flame out bound.
The engine performance after controller optimization is shown in Fig. 28. In the figure, the CPR can track with the PLA well while the Ncannot reach 1. The reason for this has been illustrated in Section 4.3. The normalized acceleration/deceleration is shown in Fig. 29 and it stays within the safe zone during the whole simulation time.
The comparisons between the engine performance in climb,TOC and cruise before and after optimization verifies the necessity of gains optimization, especially in the flight condition of high altitude and high Mach number.

Table 7 Optimized fuel controller parameters.

Table 8 Performance and penalty function values before and after optimization.
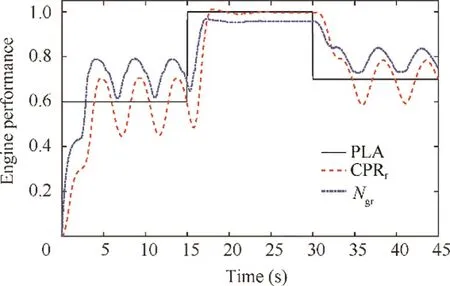
Fig.14 Tracking performance of CPR and Ngr with PLA before optimization.
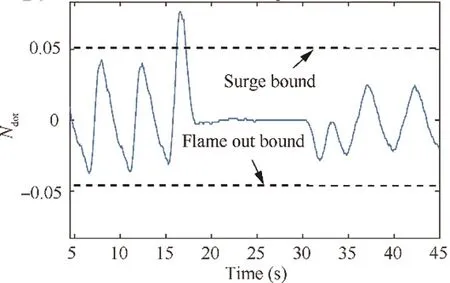
Fig. 15 Derivative of engine rotor speed before the controller optimization.
4.6. Approach (H=457.2, Ma=0.233)
The weather condition of approach is very similar to BOC.The main difference is that both the altitude and flight speed decrease during the approach condition while it is increase during BOC. The typical condition point of approach is H=457.2, Ma=0.233. Set this weather condition in the GTE controller model and apply LLGA on controller gains tuning, then the fitness value convergence and the standard deviation of the fitness value is shown in Fig. 30 and Fig. 31 respectively.
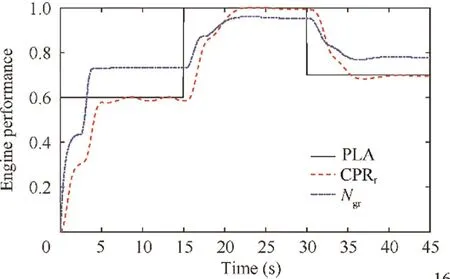
Fig. 16 Tracking performance of CPR and Ngr with PLA after optimization.
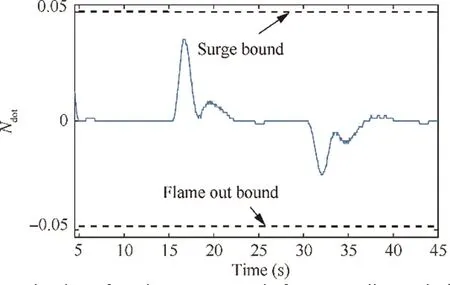
Fig. 17 Derivative of engine rotor speed after controller optimization.
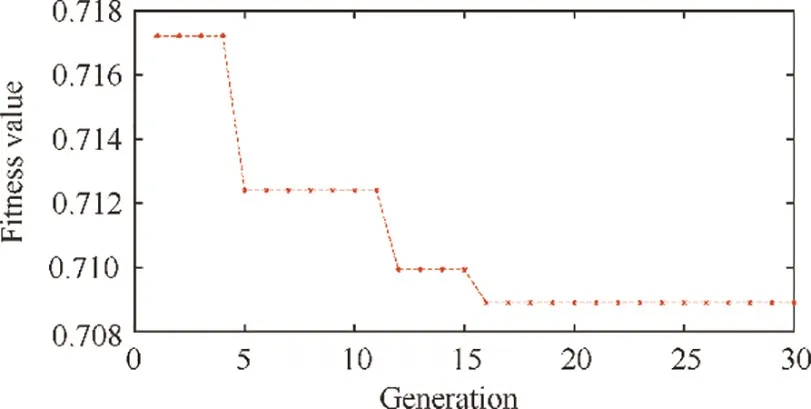
Fig. 18 Static convergence of the minimum fitness value.
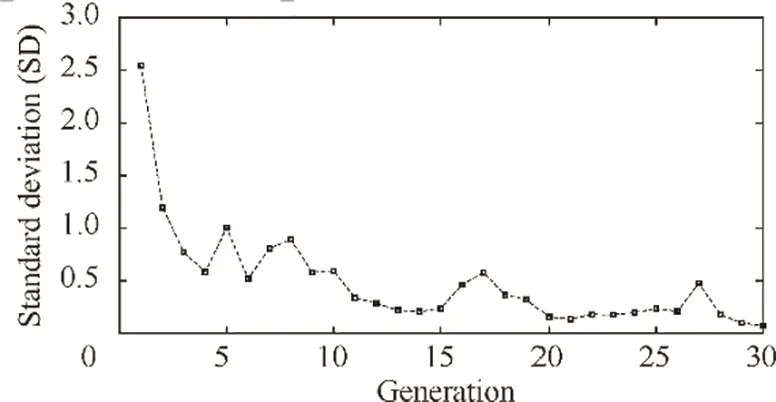
Fig. 19 Standard deviation of the fitness value at each generation.
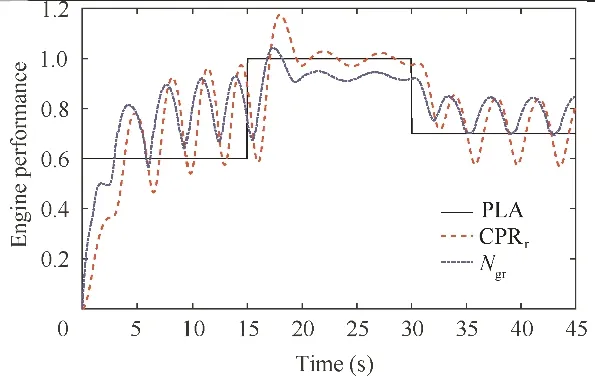
Fig.20 Tracking performance of CPR and Ngr with PLA before optimization.
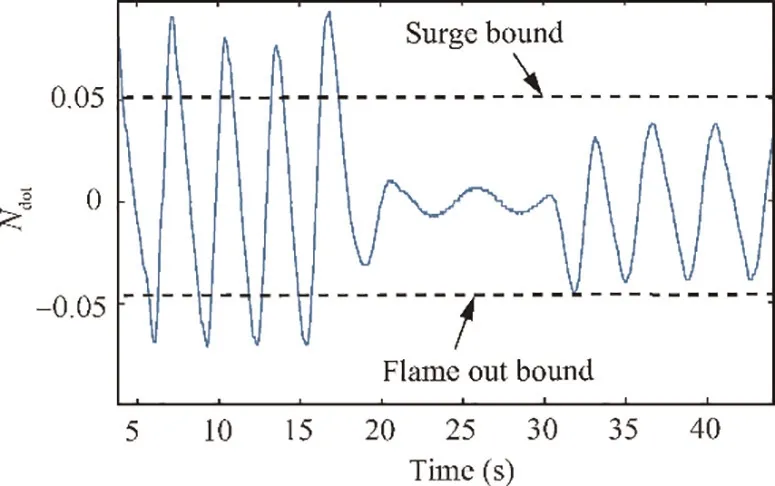
Fig. 21 Derivative of engine rotor speed before the controller optimization.
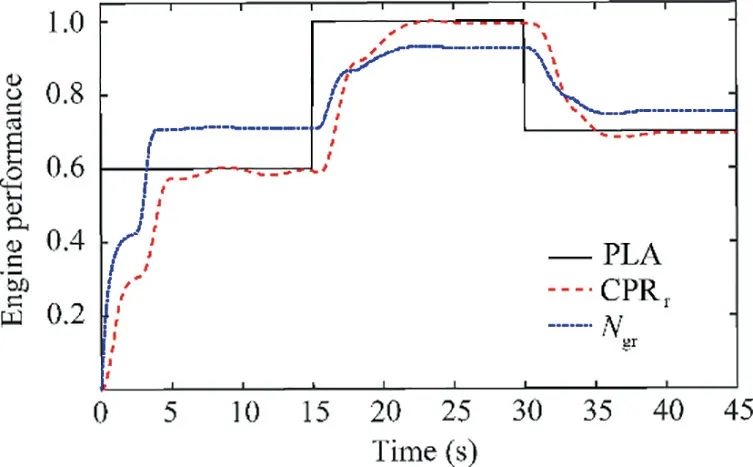
Fig. 22 Tracking performance of CPR and Ngr with PLA after optimization.
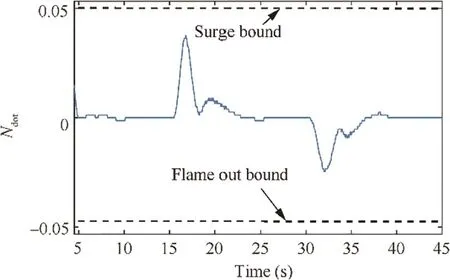
Fig. 23 Derivative of engine rotor speed after optimization.
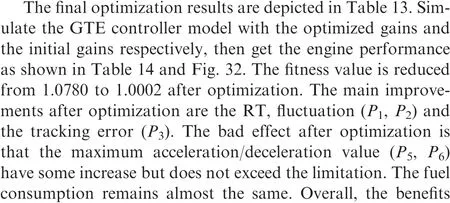

Table 9 Optimized controller parameters.

Table 10 Performance and penalty function values before and after optimization.
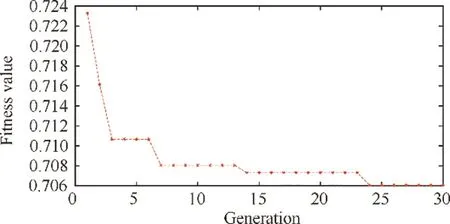
Fig. 24 Static convergence of the minimum fitness value.
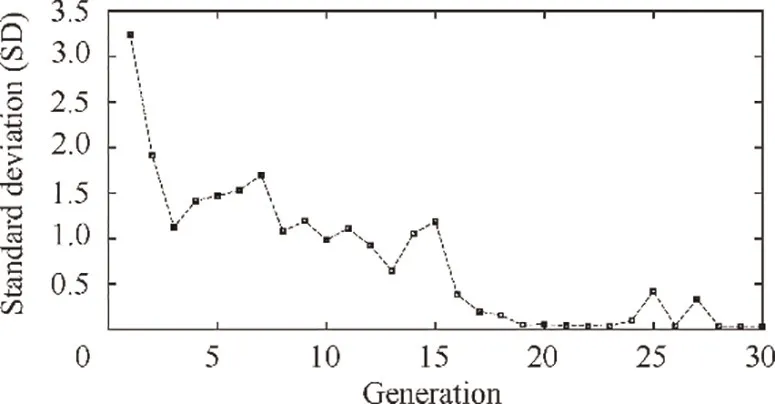
Fig. 25 Standard deviation of the fitness value at each generation.

The normalized acceleration/deceleration is shown in Fig. 33. In the figure, both the Nderivative before and after optimization have not exceeded the safe bounds. Moreover,the optimized controller has used the safety margins to improve the engine performance.
5. Analysis of the control performance optimization effect in different flight conditions

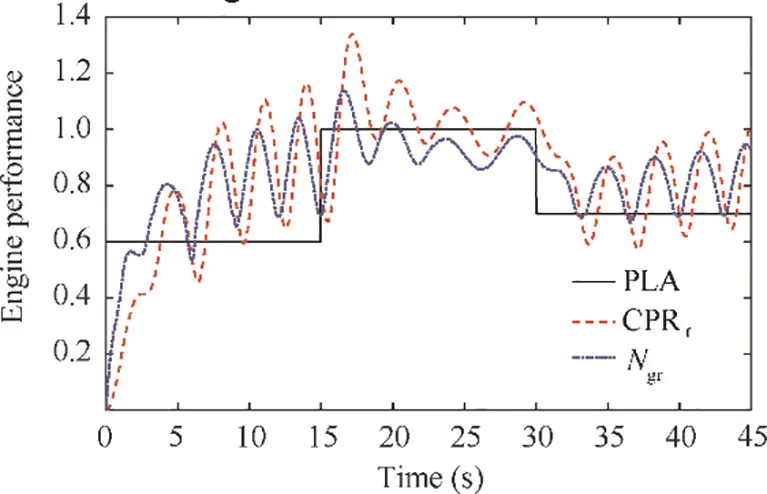
Fig.26 Tracking performance of CPR and Ngr with PLA before optimization.
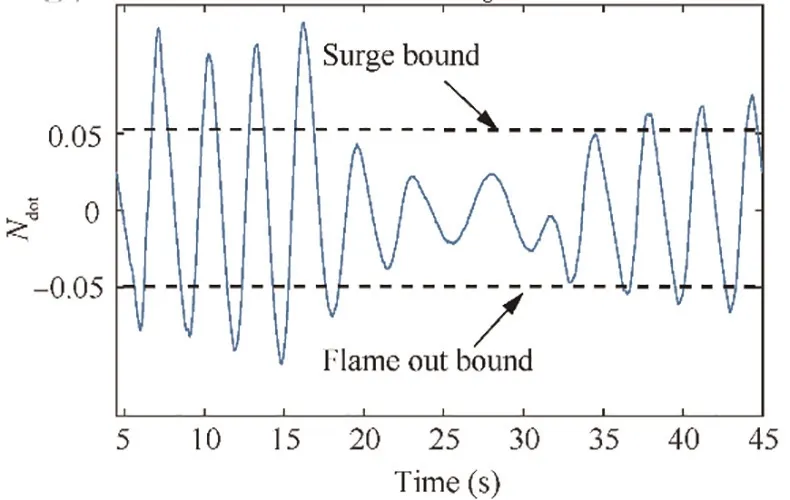
Fig. 27 Derivative of engine rotor speed before the controller optimization.
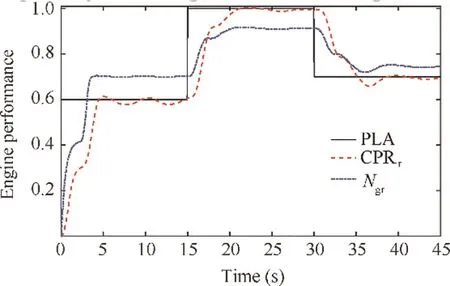
Fig. 28 Tracking performance of CPR and Ngr with PLA after optimization.

Table 11 Optimized fuel controller parameters.

Table 12 Performance and penalty function values before and after optimization.
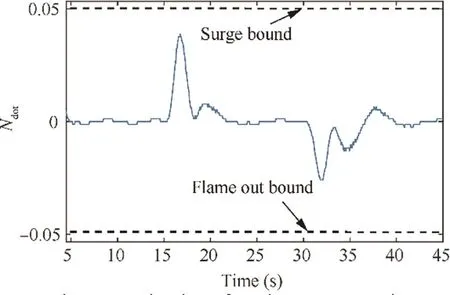
Fig. 29 Derivative of engine rotor speed.
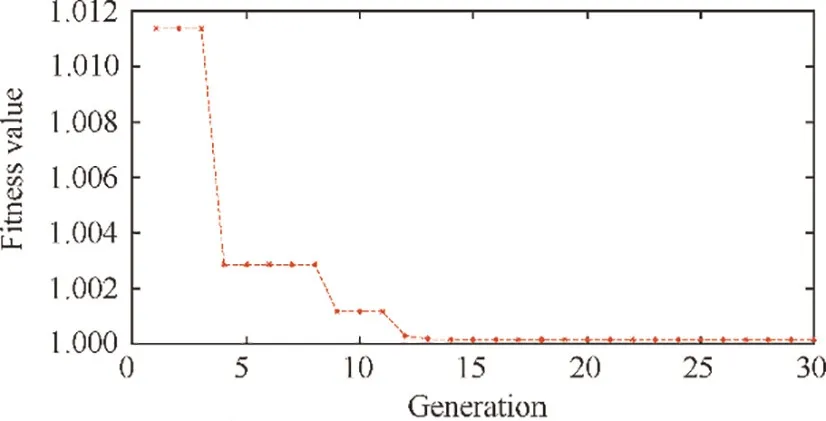
Fig. 30 Static convergence of the minimum fitness value.
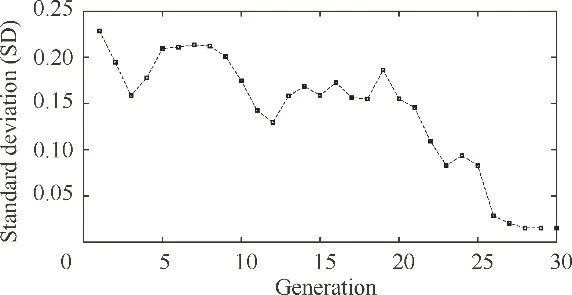
Fig. 31 Standard deviation of the fitness value at each generation.

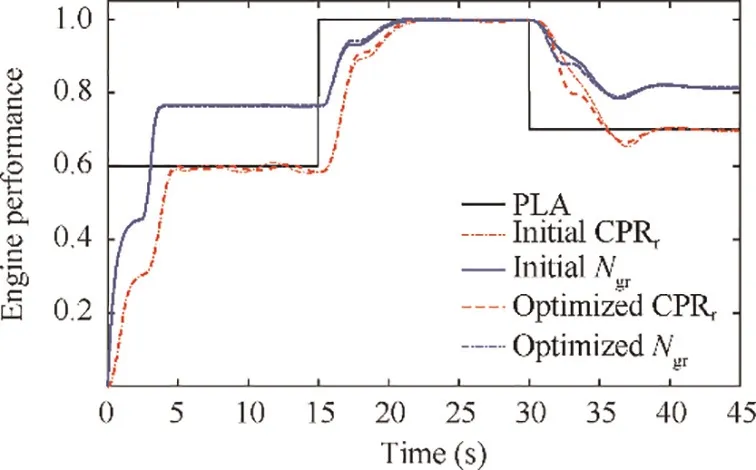
Fig. 32 Engine performance before and after optimization.
5.1. Why the optimization effects are different?
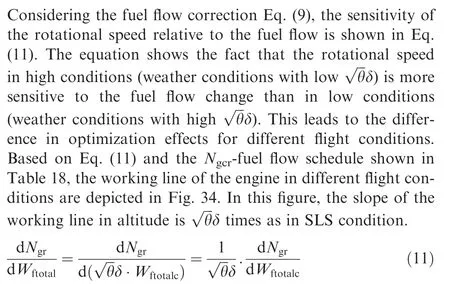

Table 13 Optimized fuel controller parameters.

Table 14 Performance and penalty function values before and after optimization.
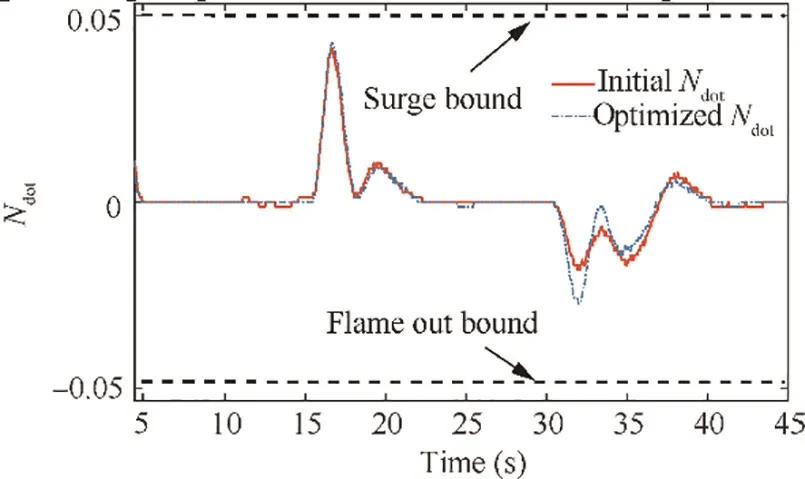
Fig. 33 Derivative of engine rotor speed before and after optimization.
5.2. Why fluctuation is more dramatical in high conditions and low PLA settings?

In low PLA settings,the Nis lower and the working line is flatter(see Fig.34),which means the same fuel flow change will cause more rotational speed change. This is the reason why fluctuation is more dramatical at low PLA settings.
5.3. Why deviation is more serious in high conditions and low PLA settings?
In climb,as shown in Fig.14,although the engine performance fluctuates,there is no obvious deviation of CPR from the PLA command. In TOC, as shown in Fig. 20, the CPR has a big deviation at PLA=0.6. In cruise, as shown in Fig. 26, the CPR deviates at both PLA=0.6 and PLA=0.7 and the amplitude of deviation is larger than that of TOC. In order to explain this phenomenon, it is necessary to study the working process inside the Min-Max controller.As discussed in partⅠ, the Min-Max selection rule is defined as below:

where Wis the fuel flow in transient control mode; W,W,Wand Ware the fuel flows in the transient control loops of PLA loop, deceleration limitation loop, acceleration limitation loop and rotational speed limitation loop respectively.
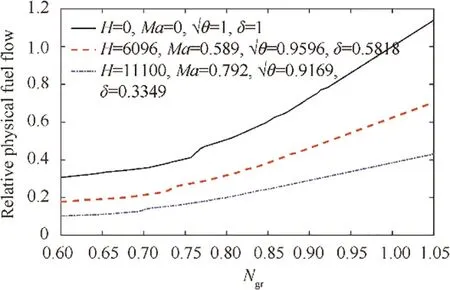
Fig. 34 Fuel-speed schedule in different flight conditions.
In high conditions, the dramatical change in Nwill increase the acceleration and deceleration, and this would make the Wto be the winner in the Min-Max selection in most time. The dominance of deceleration loop in Min-Max selection would make the average Wto be higher than zero, which will finally cause the upward deviation of CPR and Nfrom the PLA command. Fig. 35 illustrates the fuel flow of different transient loops in Min-Max selection at cruise condition. Combining this figure with the tracking performance plot in cruise (Fig. 26), it can be found that Wbecomes the winner in the Min-Max selection in most time after the CPR reaches the PLA command for the first time(about the 5th second). The average Wduring the time segments 5-15 s, 15-30 s and 35-45 s are 0.1557, -0.02658 and 0.03257 respectively. This means the deviation will first increases at PLA=0.6 and then decreases at PLA=1, and finally increases again at PLA=0.7. The changing tendency of the deviation meets the simulation result in Fig. 26 very well.
In low PLA settings, the fluctuation is more serious as discussed in Section 5.2 and this will result in larger acceleration/deceleration and cause larger Wwhich would finally result in higher W.In addition,the Nis lower in low PLA settings and the working line is flatter (see Fig. 34) which means the same positive average Wfuel flow change will cause more rotational speed change. These two factors together aggravate the deviation of CPR and Nfrom the PLA command at low PLA settings.
5.4.A rough but effective estimation of optimal Kpla in different flight conditions to solve the fluctuation and deviation problems.
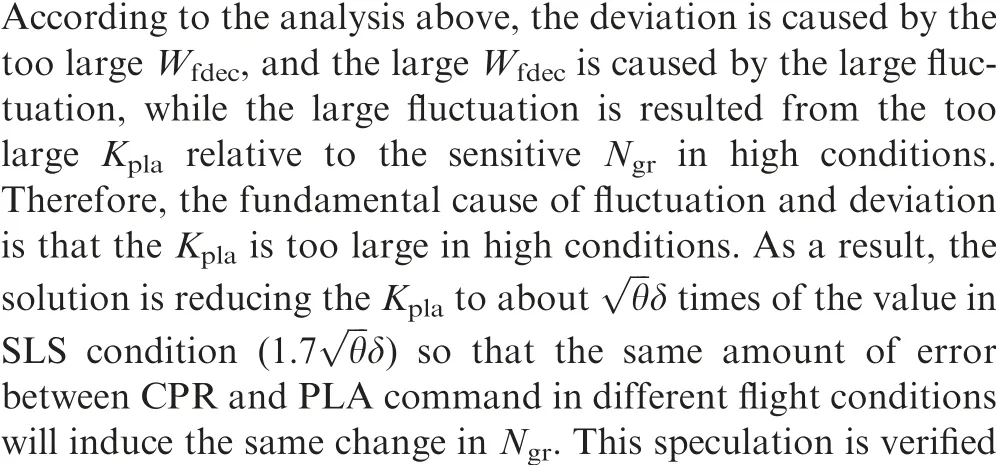
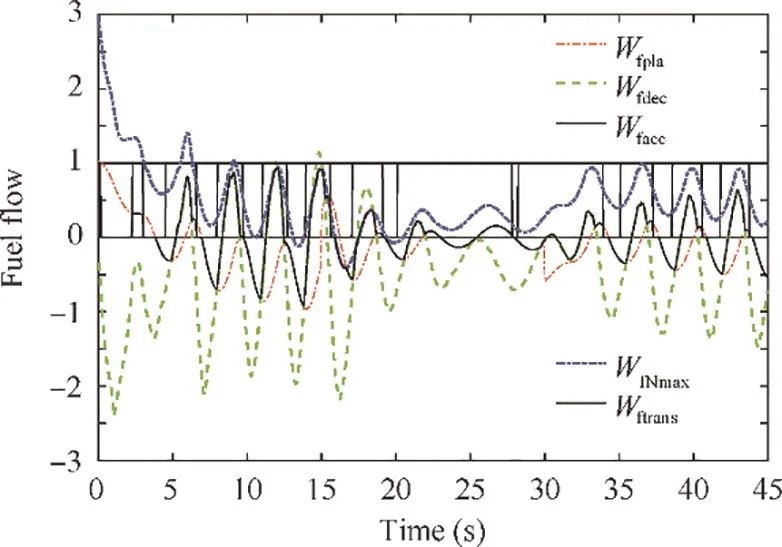
Fig. 35 Fuel flow of different transient loops in Min-Max selection at cruise condition.
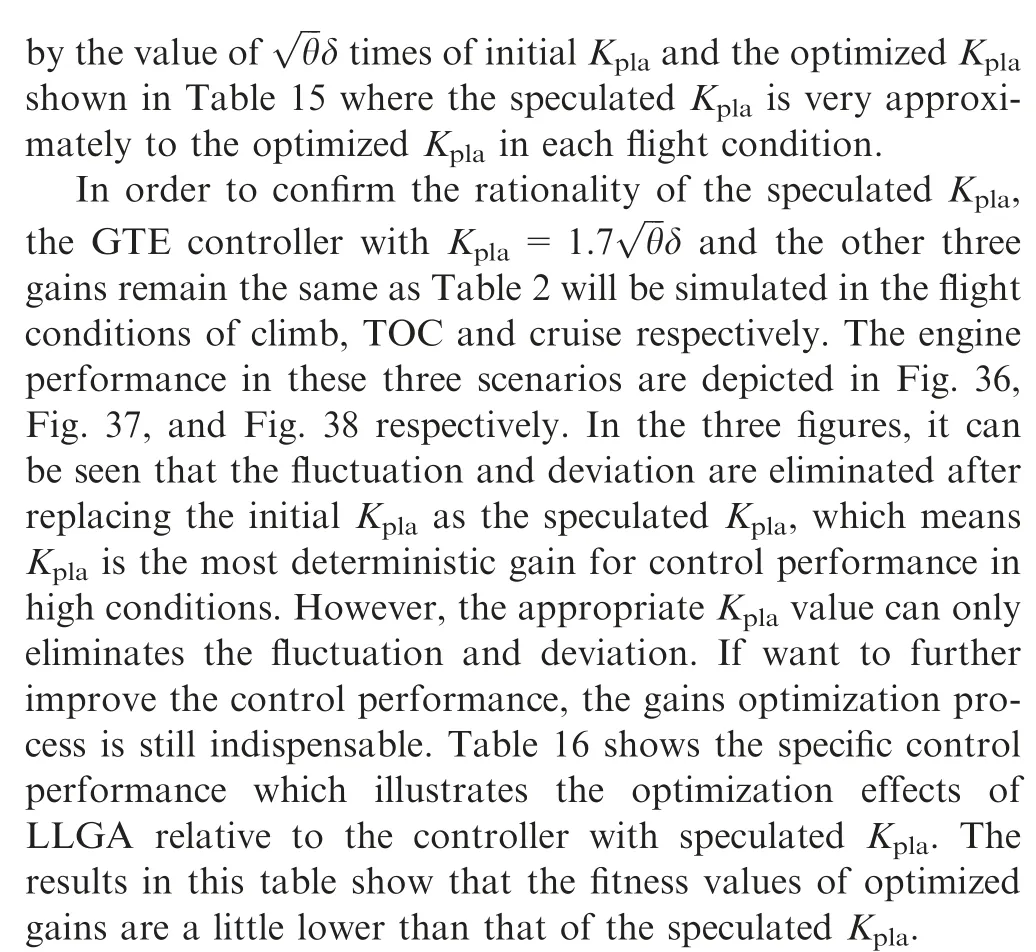
The correlation between Kand the flight condition above is based on the principle that the same amount of error between CPR and PLA command in different flight conditions should induce the same change in N. The basement of the derivation is the fuel flow correction equation of turbojet engine which has been shown in Eq. (9). As the turboshaft engine has the same fuel flow correction equation as turbojet engine, so the correlation of Kis also applicable. If apply the correlation on turbofan engine, the non-dimensional temperature θ and pressure δ should be calculated in the section of the inlet of the compressor, i.e. the ratio between the total temperature/pressure of the outlet of the fan in flight condition and SLS condition.
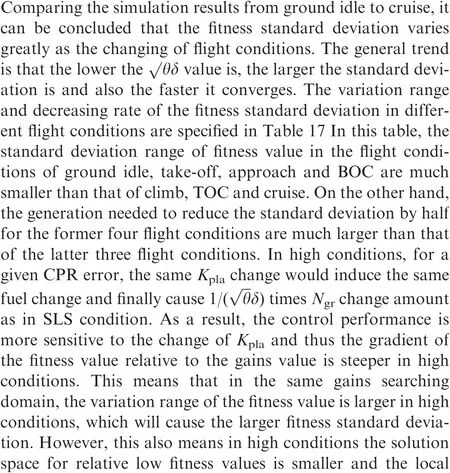
5.5. Why the fitness standard deviation is much larger but converges faster in high conditions?

6. Parameter settings for flight mission simulation
The altitude and Mach number curves of the flight mission has been shown in Fig. 2 and the optimized gains for different flight conditions are specified in Appendix.The next important issue of flight mission simulation is to determine the PLA setting in each flight condition.For the turbojet engines,the PLA value is used to deliver the requirements for engine thrust from the aircraft in different flight conditions. Therefore, the PLA setting problem can be divided into two parts:the flight condition - thrust level regulation and the PLA- thrust regulation.As for the first part, a classical thrust level-flight condition schedule of turbojet engine is depicted in Fig. 39. As for the second part, the PLA- thrust regulation varies as the specific engines. In this paper, the engine controller model is based on the data of turbojet engine TRI 60-1. The PLA setting for each thrust level can be acquired by applying interpolation in thrust-Nschedule (Fig. 40), N-fuel schedule (Table 18)and CPR-fuel schedule(Table 19)successively.After this step,all the simulation parameters are confirmed and depicted in Appendix. In addition, the Simulink model of the GTE controller for flight mission simulation is shown in Fig. 41.
7. Simulation results analysis
In order to verify the influences of the controller gains and weather conditions exerted on the engine performance, both variable and constant gain values will be applied to simulate the complete flight mission. In this section the flight mission will be simulated in three parameter configurations as shown in below:
Configuration 1: Initial gains and gradually changed altitude and Mach number;
Configuration 2: Optimized gains and gradually changed altitude and Mach number;
Configuration 3:Optimized gains and step changed altitude and Mach number.
7.1. Result of configuration 1
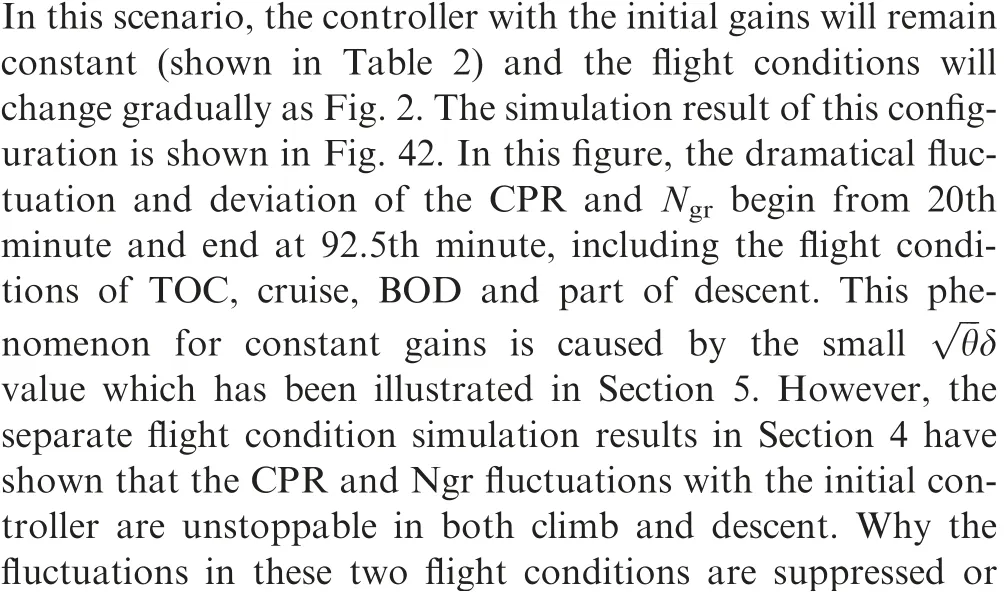

Table 15 Comparison between the speculated Kpla and the optimized Kpla.
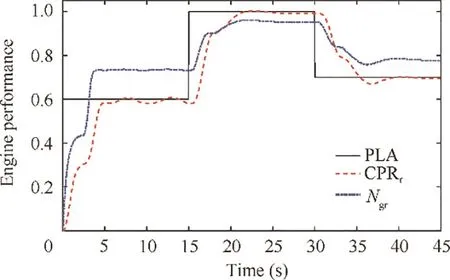
Fig. 36 Tracking performance of CPR and Ngr with speculated Kpla in climb.
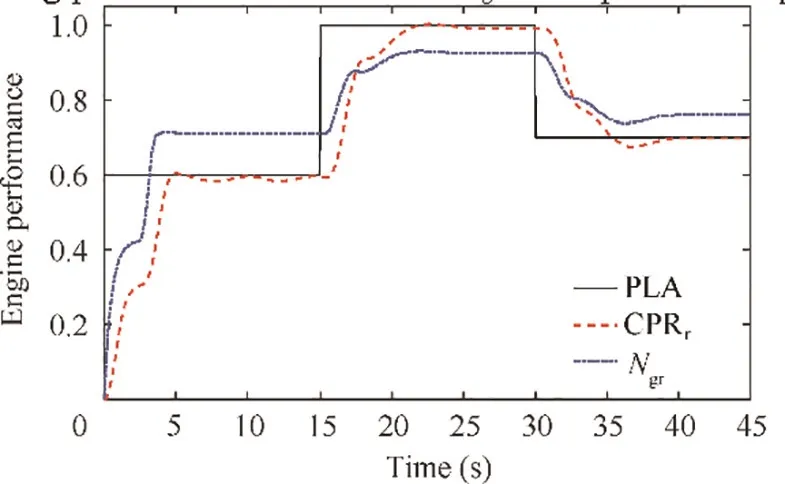
Fig. 37 Tracking performance of CPR and Ngr with speculated Kpla in TOC.
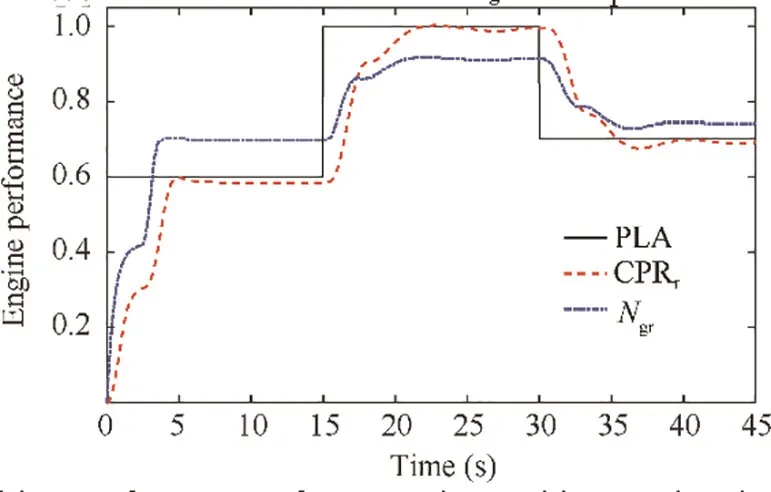
Fig. 38 Tracking performance of CPR and Ngr with speculated Kpla in cruise.


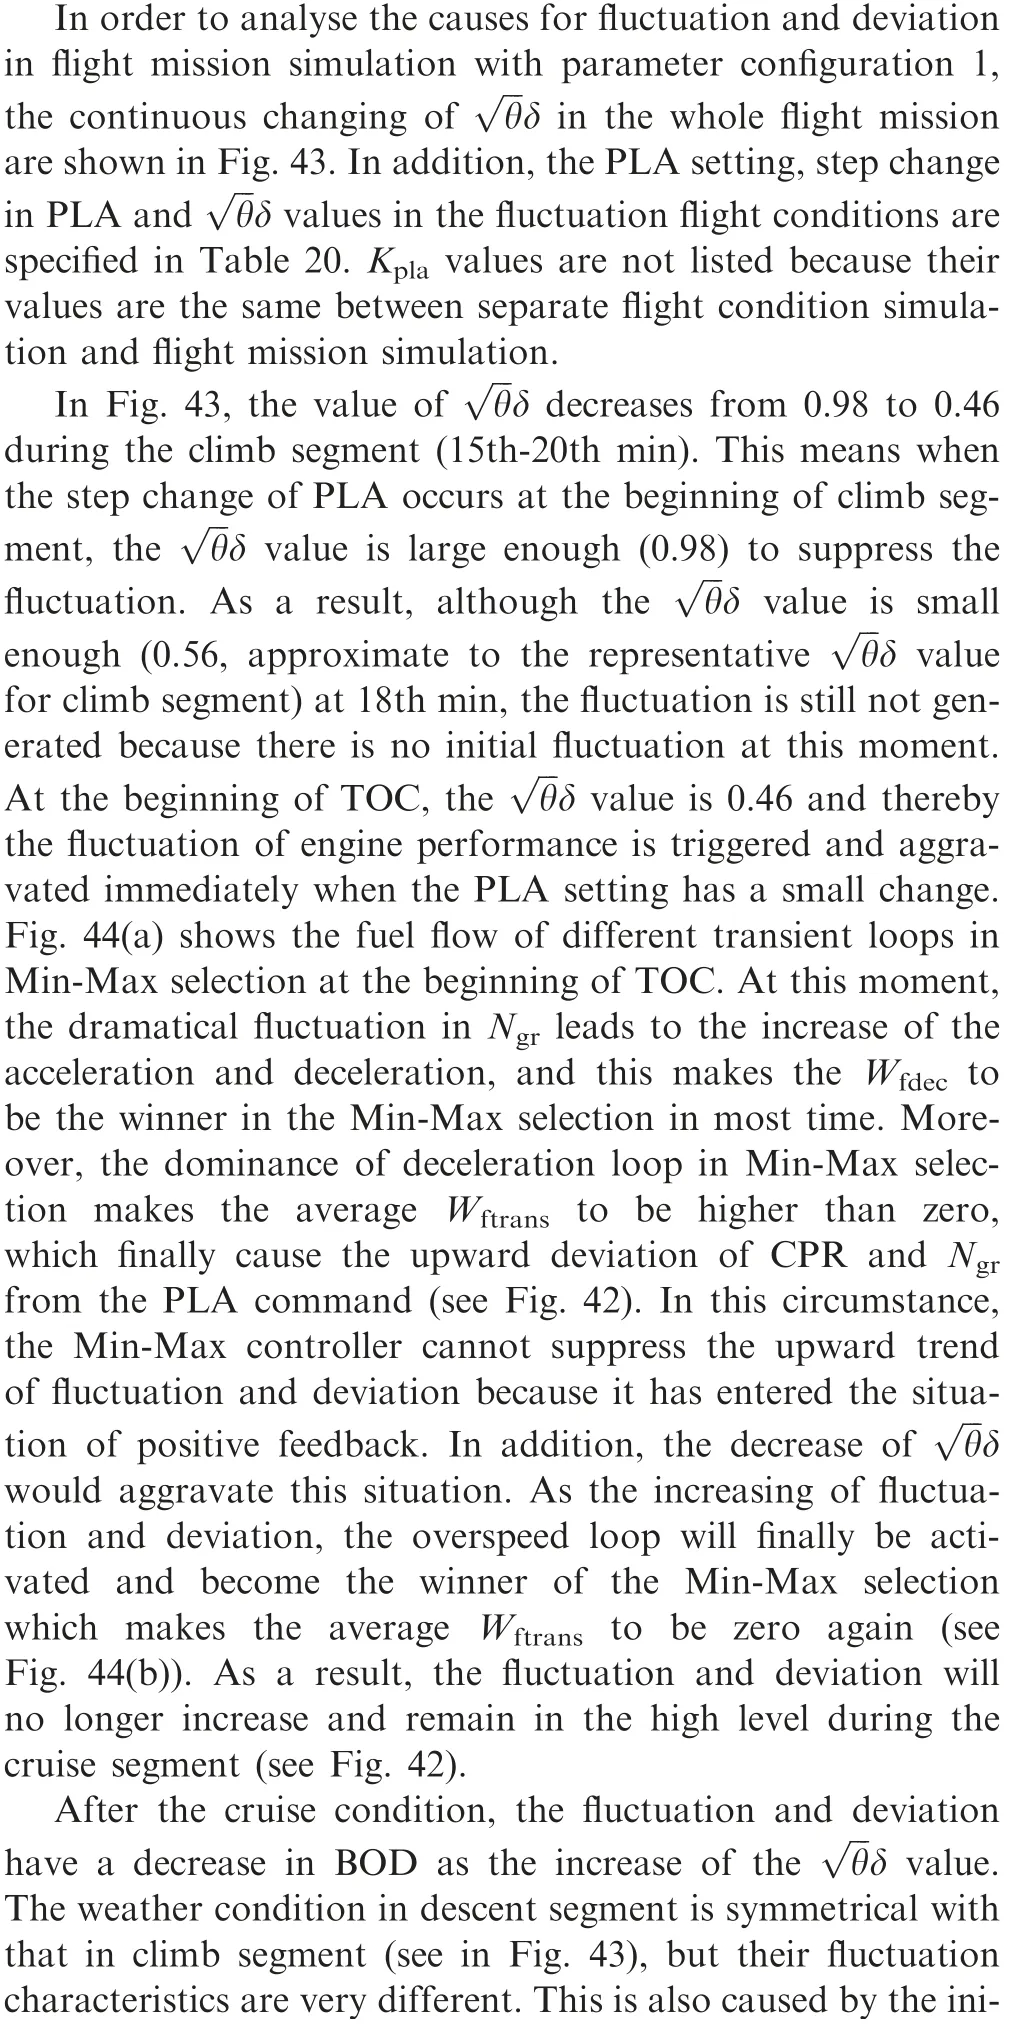

Table 16 Comparison of control performance with speculated Kpla and after optimization by LLGA.

Table 17 Fitness standard deviation ranges and convergence speed in different flight conditions.

Table 18 Fuel schedule between Ngcr and fuel flow.
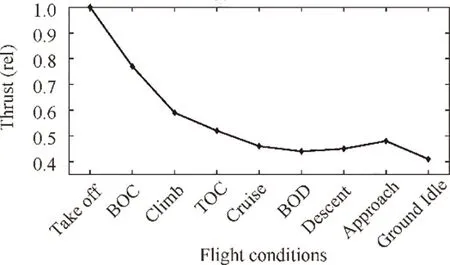
Fig. 39 Thrust setting of a turbojet engine during a flight cycle.
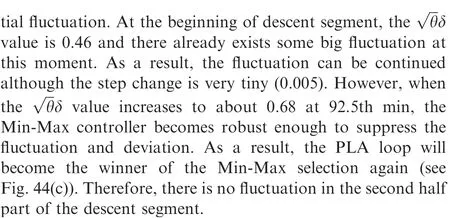
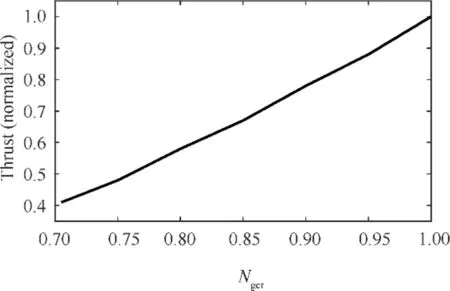
Fig. 40 Thrust-speed curve of TRI 60-1.
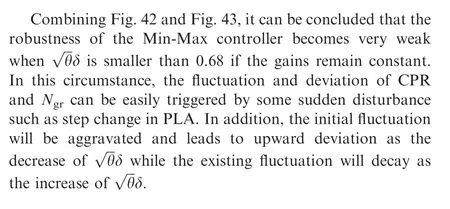

Table 19 Fuel schedule between CPRr and fuel flow.
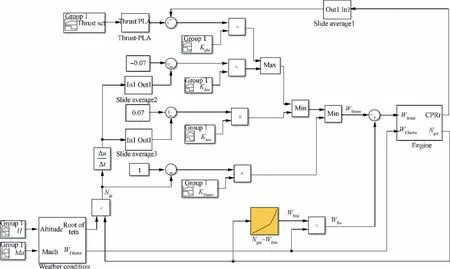
Fig. 41 Simulink model of engine controller for flight mission simulation.
7.2. Result of configuration 2
The parameter settings and weather condition of this configuration are shown in the Appendix A and Fig. 2. Fig. 45 is the simulation result of this scenario. In the figure, the tracking performance of CPR and Nwith PLA is very good during the whole flight mission. The tracking error is negligible and the overshoot/undershoot is very small. This verifies the fact that the robustness of the Min-Max controller in high conditions has been enhanced with the optimized controller gains(mainly is the K).As a result,the control performance is significantly improved after optimization.
7.3. Result of configuration 3
In this scenario, the altitude and Mach number keep constant in a flight condition. Therefore, there is a step change between two flight conditions (see Fig. 46). Although in practice it is impossible for altitude and Mach number to have a sudden change, the simulation with this configuration can illustrate the influence of the dramatically changed flight condition exerts on the control performance. Fig. 47 is the simulation result of this scenario. The tracking performance of CPR and Nwith PLA is very good during the whole flight mission except the big overshoot/undershoot at the joint of two flight conditions. The simulation results show that the sudden change in weather condition would cause great overshoot or even overspeed. However, with the optimized GTE controller whose robustness has been enhanced after optimization, the overshoot or overspeed will be eliminated in several seconds.
8. Comparison between the control performance with different parameter configurations
In order to compare the control performance with different parameter configurations, the quantitative simulation results are depicted in Table 21 and the specific control performance of each flight condition segment of the three parameter configurations are specified in Table 22, Table 23, and Table 24 respectively.
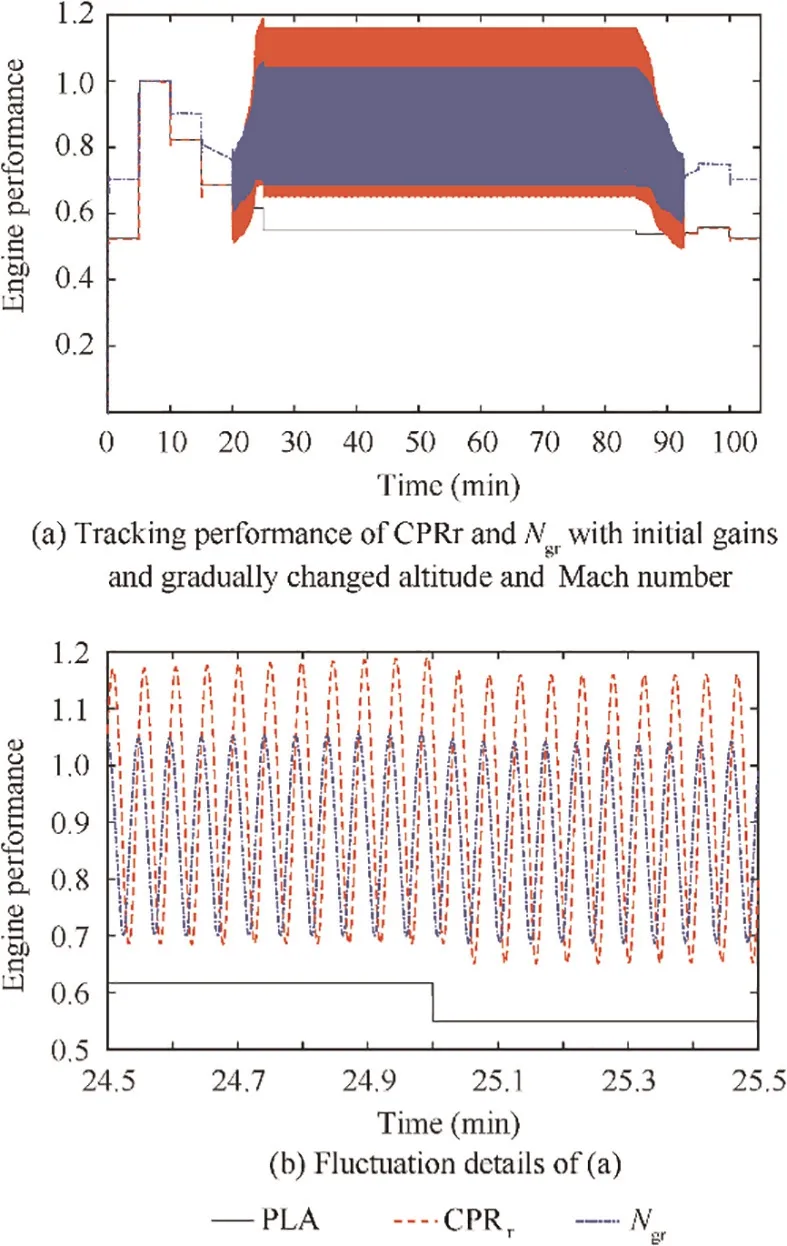
Fig.42 Tracking performance of CPRr and Ngr with initial gains and gradually changed altitude and Mach number.
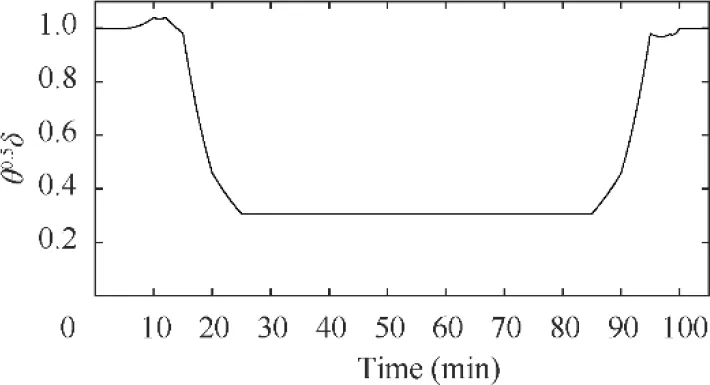
Fig. 43 Change of during the whole flight mission.
In Table 21, the flight mission simulation with parameter configuration 2 has the least response time,overshoot,tracking error and acceleration. However, almost all the data for the performance indices and penalty items of configuration 1 are too bad to be accepted. The main reason for this is that the constant gain values are not suitable for both low conditions and high conditions which has been discussed in Sections 4 and 5. In addition, as the CPR cannot achieve the value of PLA during the cruise and BOD segments because of deviation in parameter configuration 1, the response time of these two flight condition segments are very long (see Table 22). This makes the total response time of parameter configuration 1 is much longer than that of other two configurations.The comparison between configuration 1 and configuration 2 shows that the control performance has been greatly improved after controller optimization.
As for the configuration 3, it can be seen that the fuel consumption is fewer than configuration 2 and CPR tracking error is equal to configuration 2 while other indices are much worse than configuration 2. This means the steep change in altitude and Mach number could get the benefits of fuel saving although it may induce the safety problems. This verifies the fact that in order to save fuel, the aircraft should accelerate and climb to the stratosphere as soon as possible under the premise of ensuring safety.
It can be seen from the Table 23 and Table 24 that the response times of BOD, descent and approach condition are zero. The reason for zero response time is that the definition of reaching a flight condition is that the difference between CPR and PLA setting is less than 0.15. Moreover, the PLA settings for cruise, BOD, descent and approach are quite approximate to each other. This means there exists some CPR value that can meet the requirement for the four flight conditions at the same time and thereby the response time would be zero.
9. Conclusion

Table 20 influence factors of fluctuation for fluctuating flight conditions.
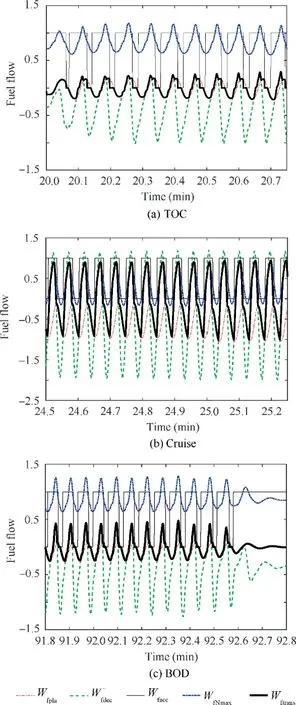
Fig. 44 Fuel flow of different transient loops in Min-Max selection.


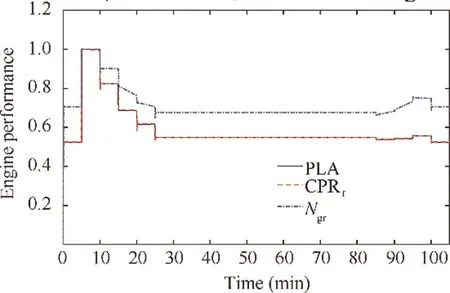
Fig. 45 Tracking performance of CPRr and Ngr with optimized gains and gradually changed altitude and Mach number.
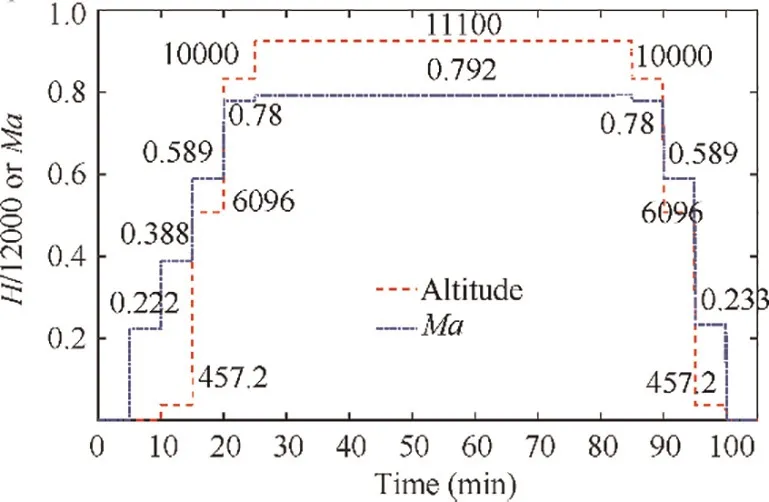
Fig. 46 Step changed altitude and Mach number during flight mission.
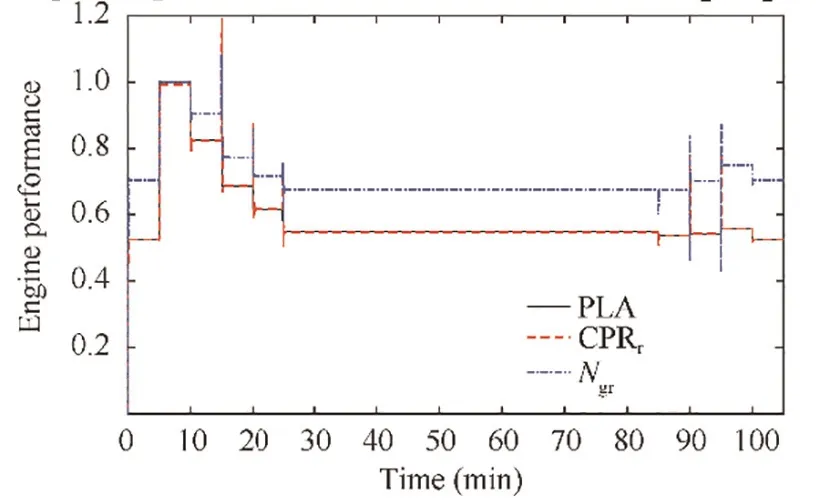
Fig. 47 Tracking performance of CPRr and Ngr with optimized gains and step changed altitude and Mach number.
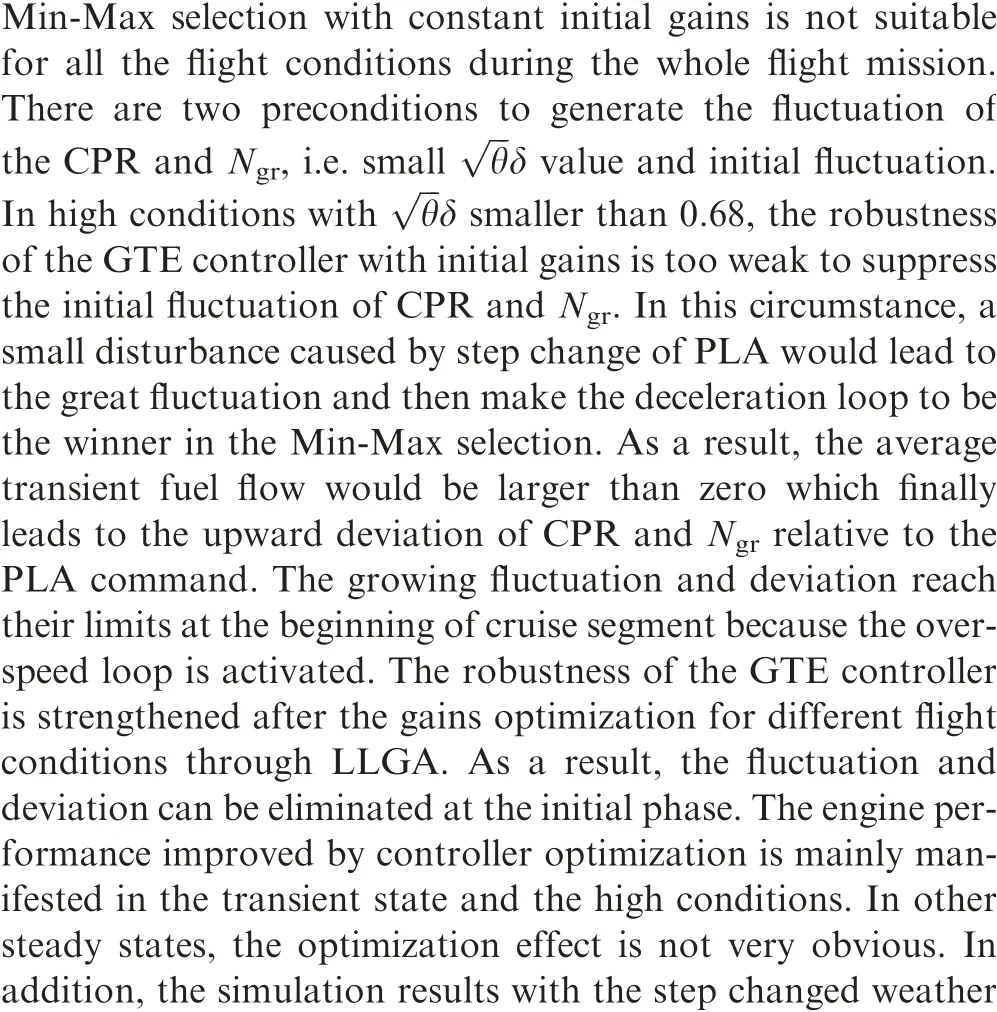

Table 21 Control performance of the flight mission with different parameter configurations.

Table 22 Specific control performance of the flight mission with configuration 1.

Table 23 Specific control performance of the flight mission with configuration 2.

Table 24 Specific control performance of flight mission with configuration 3.

Declaration of Competing Interest
The authors declare that they have no known competing financial interests or personal relationships that could have appeared to influence the work reported in this paper.
Acknowledgement
sThe authors are grateful to the anonymous reviewers for their critical and constructive review of the manuscript. Great appreciation should also be delivered to Aero-engine Corporation of China (AECC), China Scholarship Council (CSC) and China Aviation Powerplant Institute (CAPI) for offering the precious opportunity to LIU Yinfeng to study in Cranfield University.
Appendix A
See Table A1 and Table A2
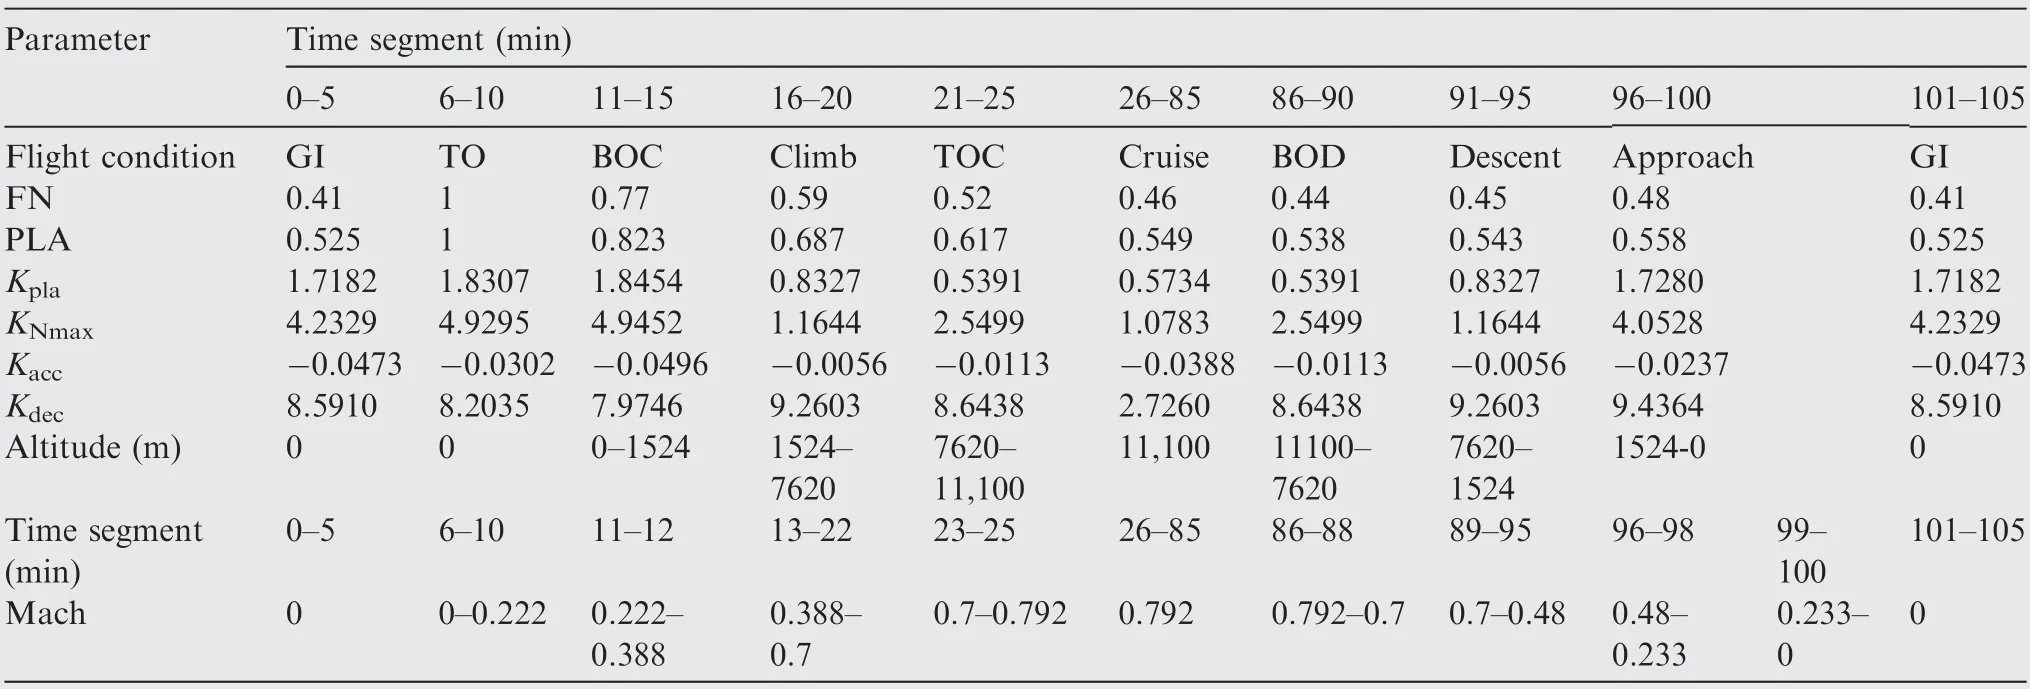
Table A1 Parameter settings during the Flight mission.

Table A2 Performance and penalty items for different flight conditions before and after optimization.
 CHINESE JOURNAL OF AERONAUTICS2021年4期
- CHINESE JOURNAL OF AERONAUTICS的其它文章
- Time delay compensation in lateral-directional flight control systems at high angles of attack
- Dual stability enhancement mechanisms of axial-slot casing treatment in a high-speed mixed-flow compressor with various tip clearances
- Development cost prediction of general aviation aircraft using combined estimation technique
- Improvement on shaped-hole film cooling effectiveness by integrating upstream sand-dune-shaped ramps
- Modeling and parameter identification of linear time-varying systems based on adaptive chirplet transform under random excitation
- An experimental method to obtain the hard alpha anomaly distribution for titanium alloy aeroengine disks
