Advanced optimization of gas turbine aero-engine transient performance using linkage-learning genetic algorithm: Part I, building blocks detection and optimization in runway
Yinfeng LIU, Soheil JAFARI, Theoklis NIKOLAIDIS
a Aero Engine Test Department of Hunan Aviation Powerplant Research Institute, (AECC), Zhuzhou 412002, China
b Centre for Propulsion Engineering, School of Aerospace Transport and Manufacturing (SATM), Cranfield University,Cranfield MK43 0AL, UK
KEYWORDS Aeroengine control;Building block detection;GA;Global optimization;GTE;LLGA;Min-Max controller
Abstract This paper proposes a Linkage Learning Genetic Algorithm(LLGA)based on the messy Genetic Algorithm (mGA) to optimize the Min-Max fuel controller performance in Gas Turbine Engine (GTE). For this purpose, a GTE fuel controller Simulink model based on the Min-Max selection strategy is firstly built. Then, the objective function that considers both performance indices (response time and fuel consumption) and penalty items (fluctuation, tracking error, overspeed and acceleration/deceleration)is established to quantify the controller performance.Next,the task to optimize the fuel controller is converted to find the optimization gains combination that could minimize the objective function while satisfying constraints and limitations. In order to reduce the optimization time and to avoid trapping in the local optimums, two kinds of building block detection methods including lower fitness value method and bigger fitness value change method are proposed to determine the most important bits which have more contribution on fitness value of the chromosomes.Then the procedures to apply LLGA in controller gains tuning are specified stepwise and the optimization results in runway condition are depicted subsequently. Finally,the comparison is made between the LLGA and the simple GA in GTE controller optimization to confirm the effectiveness of the proposed approach. The results show that the LLGA method can get better solution than simple GA within the same iterations or optimization time. The extension applications of the LLGA method in other flight conditions and the complete flight mission simulation will be carried out in part II.
1. Introduction
Since the birth of turbojet engines in the 1940s, the aero gas turbine has been developing in the direction of higher thrustweight ratio, lower fuel consumption, higher security, longer service life and greater flexibility.In order to satisfy these requirements, the complexity of the engine structure has greatly increased. As a result, the number of control parameters increases dramatically, which induces great challenges for the engine controller. In this circumstance, the further improvement of the gas turbine performance is largely dependent on the optimization of control performance. The main difficulties for the aero-engine controller optimization at present are illustrated below:
1.1. No analytical solution for controller’s gains tuning
As the increasing of the control parameters,the control system architecture and control logic become more and more complex.For instance,the fuel control system of a single shaft turbojet gas turbine has 14 parametersand this number rises to 20 for the integrated flight/propulsion control system in an unmanned aerial vehicle.Apparently, much more parameters need to be designed and tuned for the complex engines with more architectures such as turbofans and turboshafts. As a result, it becomes very difficult or even impossible to establish the analytical functions to describe the control process, which means using analytical methods to find the global optimization control performance is reaching the limits, especially for the advanced high-quantity controllers with large number of variables.
1.2. Compromise between different control objectives
A good controller should have fast response, small tracking error and fluctuation of output. As for the aero-engine controller, fewer fuel consumption and some safety limitations(over-speed, over-temperature, etc.) should also be taken into consideration.However,these control objectives are in conflict with each other and unable to reach their optimal states at the same time. For example, too fast response will induce overshoot and may cause serious safety problems, while too strict limitations on over-speed and acceleration will greatly prolong the response time and lead to bad tracking performance. As a result,a good aero-engine controller designer should be able to compromise between different control objectives and set appropriate requirements and limitations for these control indices according to the practice and usage requirements.
1.3. Quantify the overall control performance
In order to optimize the controller parameters through global optimization algorithms, a function to quantitatively evaluate the control performance must be established rather than simply describe as good, bad or just so-so. This function is called objective function or fitness function,and the function value is often called fitness value. According to the specific optimization problem, the best control performance may correspond to either the highest or lowest fitness value.The objective function should conclude all the necessary control performance indices and assign appropriate weight coefficients to them according to their importance. However, the importance of each control objective is always conformed through the experiences and hard to define quantitatively.
1.4. Too many local optimization solutions
After establishing the objective function, the optimization problem is converted into finding the appropriate value of the controller parameters to be adjusted that can minimize or maximize the objective function. As mentioned above, different control performance indices conflict with each other,which means the objective function cannot be a monotonic function and many local optimizations exits in the multidimension searching space. In fact, the number of local optimizations will increase exponentially as the increase number of parameters to be adjusted. How to avoid trapping in the local optimization has become a big challenge for Gas Turbine Engine (GTE) controller optimization.
1.5. The conventional optimization algorithms are time consuming and sometimes are not affordable
As for the new complex aircraft engines, many parameters should be designed and tuned simultaneously for the optimal engine and aircraft performance.This means the optimization time is extremely important for a practical optimization algorithm, especially when applied on the real-time optimization occasions. However,for most of the global optimization algorithms,the computational efforts increase exponentially as the increasing number of parameters to be optimized.On the other hand, a proof of convergence to global optimization is still an unsolved issue in Meta-heuristic Global Optimization (MGO)algorithms.Under this circumstance, the engineers tend to increase the iterations to make sure of the convergence, which would in turn increase the computational time.
In order to cope with the difficulties mentioned above, the MGOs based on the philosophy of biological evolution and biological study within a colony are introduced into the engineering control fields, and good results have been acquired during their applications in GTE controller optimization.The representative ones among these MGOs are Genetic Algorithm (GA), Particle Swarm Optimization (PSO), Ant Colony Optimization(ACO),Invasive Weed Optimization(IWO),and Bee Colony Optimization (BCO). Jafari et al. applied competent genetic algorithm, PSO and differential evolution algorithm in gains tuning of aero-engine and wind turbine.The results show that MGO algorithms performs much better in searching the optimal control parameters combination than trial and error manually, which means MGO methods have great potential in GTE controller design.
Genetic algorithms are a kind of optimization algorithms inspired by evolution which guide the search through the solution space by using natural selection and genetic operators,such as crossover, mutation, and the like.In GA, each chromosome represents a solution to the problem,and the genes on the chromosome corresponds to a parameter to be optimized.A group of chromosomes is called a population like the conception of population in biology which consists of a group of individuals. As for the GTE controller gains tuning problem, each gain value is expressed as a gene, and each gains combination corresponds to a chromosome. A group of chromosomes means a large number of gain value combinations.The philosophy of tuning gains with GA is searching the gains value combination that could bring in the best control performance by genetic operators within the pre-defined gains boundary.However,by increasing the number of optimization parameters,the efficiency of global optimization operators will be decreased. This is due to independency of some optimization parameters that makes the operators of the algorithms ineffective.One of the high potential solutions for this problem introduced in computer science is detection of the linkage between the parameters.
On the chromosome, some genes can bring in better fitness value than others and some genes can greatly influence the fitness value when they are regarded as a whole. The group of genes that can greatly improve the chromosome fitness value is called the Building Block (BB).Each BB constitutes a partial solution to the problem.In order to avoid being split during crossover process, the genes belong to a BB needs to be put together. The process to detect BBs and arrange the genes in the BB together is defined as linkage learning, after which the optimization algorithm can perform the mixing task efficiently and accurately and avoid doing unnecessary crossover between the parameters which do not belong to a BB.In order to resolve the problem caused by the uncertain relationship between variables, a large number of Linkage-Learning Genetic Algorithms (LLGA) have been proposed.The widely used LLGA methods include messy Genetic Algorithm (mGA),Bayesian Optimization Algorithm (BOA),Probabilistic Expression Genetic Algorithm (PEGA),etc. In addition, Goldberg applied Walsh function on detecting the BBs.All of these LLGA methods have great potential in GTE controller optimization problems.
This paper explores the application of a LLGA method based on mGA in GTE controller gains tuning to optimize the transient performance of the engine while satisfying engine physical control modes.The use of this approach will enhance the performance of the optimization algorithm noticeably and will result in an optimal performance for the engine and the controller. For this purpose, Section 2 introduces the process of building the engine controller model; Section 3 illustrates the methodology of LLGA applied in control performance optimization; Section 4 explores the process of establishing the control performance objective function and then the controller gains tuning process is formulated as an engineering optimization problem in Section 5; after this, the philosophy of the LLGA used in this paper is illustrated in Section 6;two types of BB detection methods are studied in Section 7;The procedures of applying LLGA in controller gains tuning are specified in Section 8 and a case study is carried out in runway condition in Section 9. Moreover, the comparison between the LLGA and the simple GA in GTE controller optimization is made to verify the advantage of the LLGA method in Section 10. Finally, the conclusion is made in Section 11.Part II of this paper extends the applications of the LLGA method to other flight conditions and then simulates a complete flight mission with different control parameter configurations. Based on the results obtained from different flight phases, performance analysis will be presented and a correlation for engine controller gains tuning will be proposed for turbojet engines.
2. Control requirements and controller design
2.1. Introduction of the GTE and its control modes
In this section, a GTE controller model will be built in Simulink based on the turbojet engine TRI 60-1. The engine specification is shown in Fig. 1.The geometry of the engine is fixed and thus the fuel flow supplied to the combustor becomes the only control variable. The regulation of engine thrust can be realized through adjusting the fuel flow supplied to the combustion and this is exact the main function of a GTE controller.
A GTE control system should meet the requirements of engine thrust regulation and safety constraints.At steady state,the engine should be able to provide appropriate thrust according to the throttle command. The steady state fuel flow is not very difficult to determine because it can be calculated by some commercial gas turbine performance software such as Turbomatch(TM),an in-house tool developed and established in Cranfield University, and Gasturb,or acquired through the engine test. However, it is much more challenging to calculate the fuel flow in transient.Here the transient means the intermediate process between two steady state conditions or dynamic instabilities during steady state caused by some disturbances.Transient and dynamic instabilities may push the engine components beyond their physical limitations, and then result in the loss of thrust or possible engine damage.The aerodynamic instabilities may cause to the local rotating stall in the compressor and finally result in the longitudinal mass flow fluctuation called surge.A sudden increase in fuel flow may lead to the stall or surge while a rapid fuel decrease may cause to flame out. Moreover, other physical limitations, including engine over-speed and over temperature,may occur due to the excess fuel injection.Therefore,the fuel flow not only influences the control performance, but also relates to the engine safety.
2.2. Control structure design
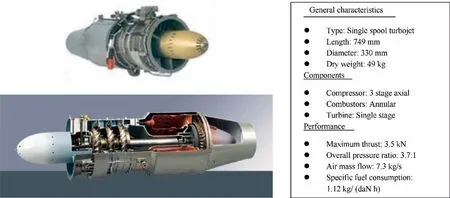
Fig. 1 Schematic and characteristics of modelled turbojet engine.17.
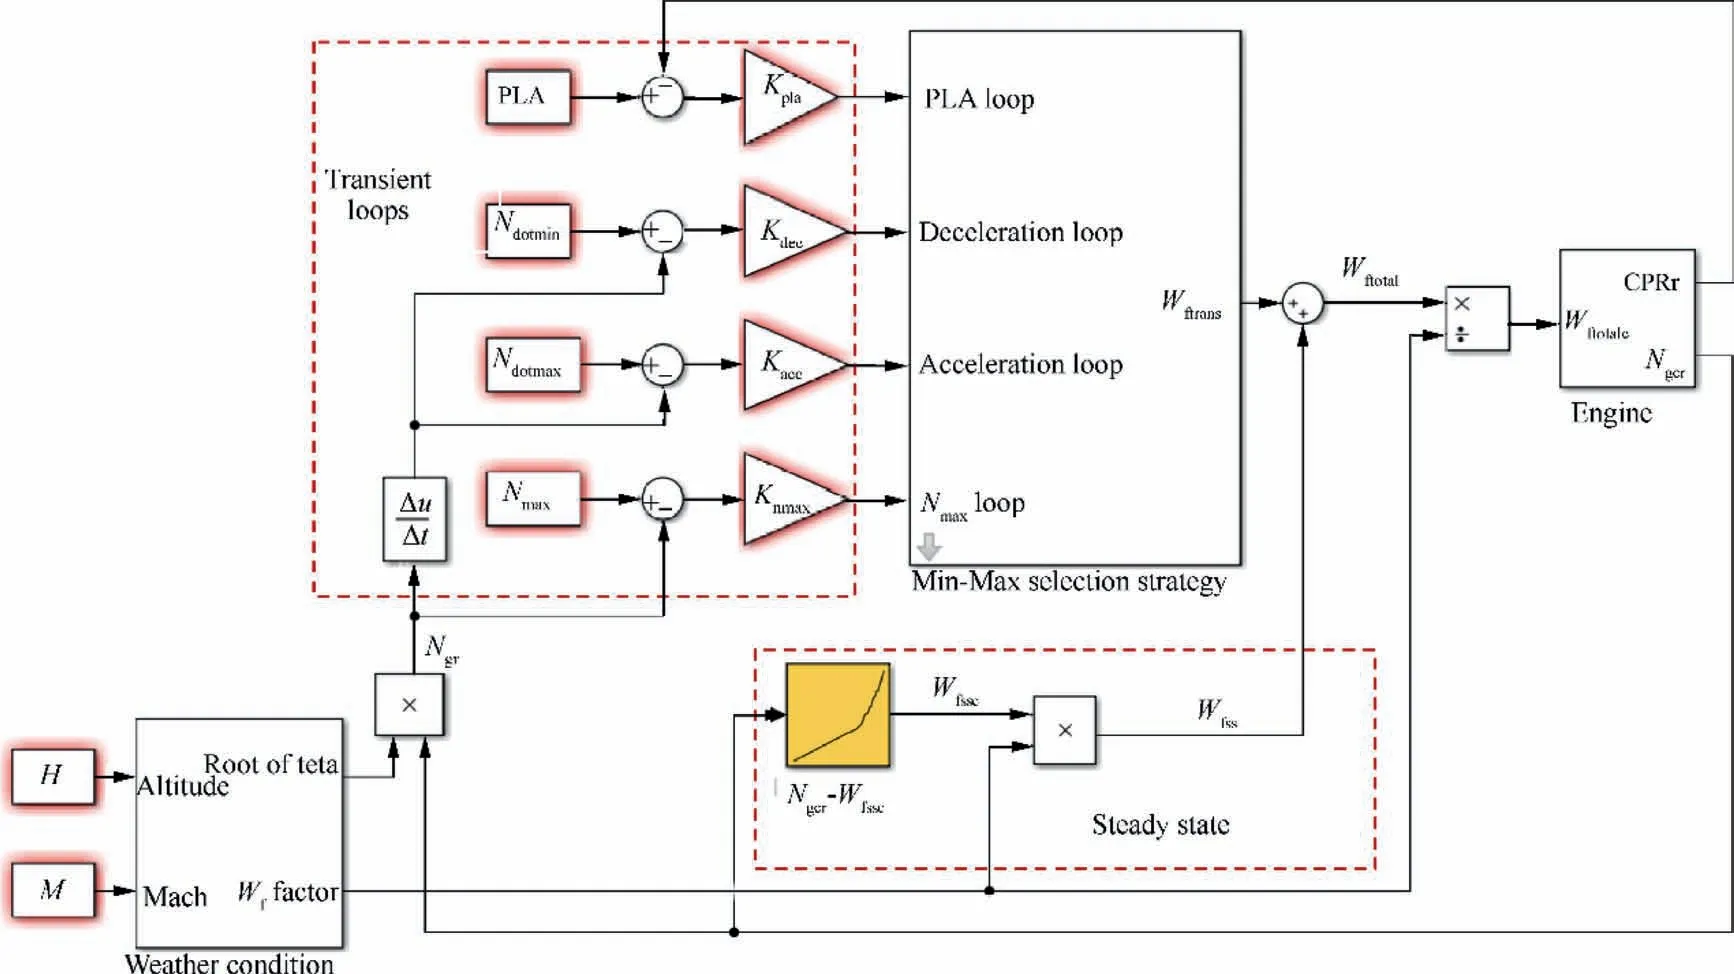
Fig. 2 Schematic of aero-engine fuel controller structure.
The controller Simulink model designed for the single-spool turbojet engine in this paper is shown in Fig. 2. In this GTE controller, the Compressor Pressure Ratio (CPR) is selected as the parameter to deliver the Pilot Lever Angle (PLA) command.The controller can be divided into a steady state control mode and a transient control mode. The fuel flow supplied to the engine is the sum of the steady state fuel flow and the transient fuel flow. In the steady-state control mode, the control loop is a speed-fuel schedule to provide the minimum fuel flow to maintain the current rotational speed.The transient control mode is a Min-Max controller which consist of a PLA control loop and several physical limitation control loops(e.g.to limit the maximum acceleration, deceleration, turbine inlet temperature,engine shafts rotational speeds,etc.)to make sure of the tracking performance and safety concerns. At any instantaneous,only one control loop in the Min-Max controller is activated by the pre-defined selection rule, and the activated control loop is called the winner loop at that moment. As a result,all the engine control loops are satisfied simultaneously.This method has been widely used by well-known manufacturers and research institutes(e.g.Rolls-Royce,MTU Aero Engines,Volvo Aero Corporation,Fiat Avio,Techspace Aero S.A,Lufthansa Technik AG, Aerospatiale, Chalmers University of Technology AB, National Technical University of Athens,Technische Universita¨t Mu¨nchen, Universita¨t Stuttgart,Universite´ Catholique de Louvain).In this paper,the transient part of the Min-Max controller contains four control loops: PLA loop, deceleration limitation loop, acceleration limitation loop and rotational speed limitation loop. The PLA loop is the main transient control loop which provides the necessary fuel flow to track with the PLA command. The deceleration loop and the acceleration loop are aimed to prevent the engine from flame out and surge respectively.In addition, the speed limitation loop protects the engine from overspeed. All of the four transient loops are designed as the proportional control loops with the feedback control gains K,K, Kand Krespectively. The schematic of this Min-Max control structure is shown in Fig 3.The Min-Max selection rule and the fuel flow supplied to the engine are defined in Eqs. (1) and (2) respectively.

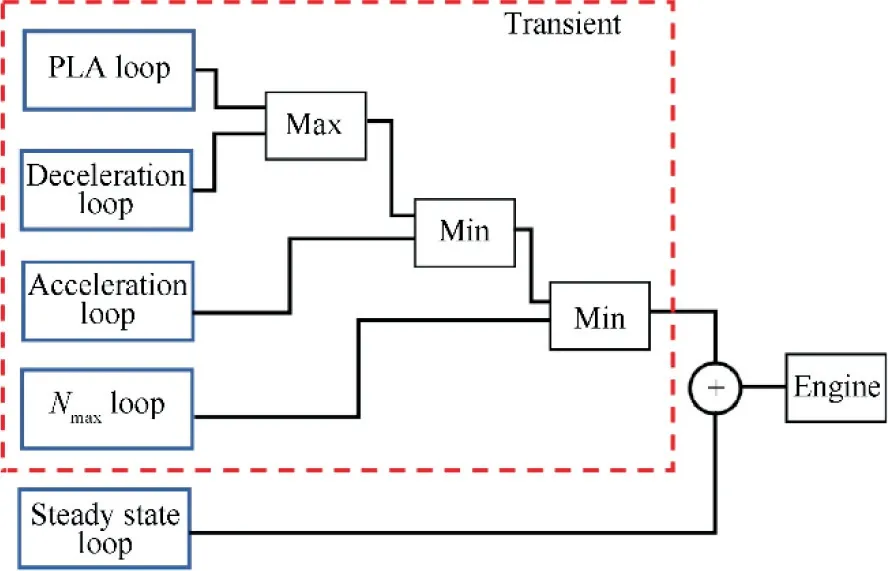
Fig. 3 Min-Max control strategy for the single spool turbojet engine.5

where Wis the fuel flow in transient control mode; W,W,Wand Ware the fuel flows in the transient control loops of PLA loop, deceleration limitation loop, acceleration limitation loop and rotational speed limitation loop respectively. Wis the fuel flow in steady state control mode;Wis the fuel flow supplied to the engine.
In order to simulate the flight conditions, the altitude and Mach number need to be taken into consideration and the control parameters will be corrected by weather conditions.Therefore, the weather condition block is added into the GTE controller model and the specific correction process will be illustrated in part II.
3. Methodology of LLGA applied in control performance optimization
The fuel flow control is the most important part in the GTE control system. However, it is very difficult to determine the transient fuel flow because the contradictory considerations such as response time, fuel consumption, fluctuation, overspeed, etc. should be balanced at the same time. As for the aero-engine controller shown in Fig. 2, the transient fuel flow is determined by the four gains K, K, Kand Kin the transient control loops. Therefore, finding the appropriate gains combination is the key to improve the control performance.
To optimize the GTE controller,the first step is establishing the objective function to evaluate the control performance.Obviously, the four gains in the transient control loops are the independent variables of the objective function.Therefore,the aim of transient performance optimization is simplified to finding the four gains value combination that could minimize the objective function.
As for the objective function, on the one hand, the performance indices such as response time and fuel consumption should be taken into consideration;on the other hand,the penalty items include error,over-speed,fluctuation and over acceleration/deceleration should also be contained. The first part will lower the fitness value, while the second part will increase the fitness value. As a result, a small change in the gains may induce the penalty and cause to the sudden increase of the fitness value. That is to say, having considered so many factors,the objective function has many local optimizations and the local optimizations always near the penalty trap. In order to avoid the numerous local optimizations and reduce the optimization time,the LLGA method is applied in controller gains tuning in this paper. The optimization process is depicted in Fig. 4, the LLGA adjusts the Min-Max loop gains according to the feedback control performance iteratively until the stopping criteria of the optimization problem are fulfilled.
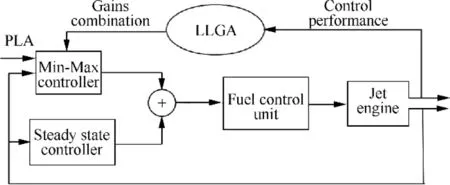
Fig. 4 Optimization process using LLGA.
4. Establish the objective function of control performance
4.1. Considerations of establishing the objective function
Establishing a good objective function is the most important key point and precondition for the optimization problem. A good objective function should be able to quantify the control performance appropriately.If there are more than one performance indices, weight coefficients should be assigned to each performance index according to their importance. However,performance is not the only thing that needs to be taken into consideration, because the good performance would always introduce some adverse effects,such as overshoot,undershoot,over-speed, over acceleration, etc. In reality, it is a common phenomenon that the better the controller performance is,the more adverse effects will be brought in. As a result, the control performance should be compromise with the adverse.In order to quantify the influence of these adverse effects and have a comprehensive evaluation on the control performance, penalty items are added to the objective function.
There are two forms of objective function: single-objective function and multi-objective function. Both two kinds of objective functions consist of two parts: performance index part and penalty part, which are shown in Eqs. (3) and (4)respectively. As for the gas turbine control performance, the performance index part usually considers the response time(including the acceleration and deceleration time)and fuel consumption, while the penalty part often takes the overshoot,undershoot,output error,over-speed,acceleration or deceleration, etc. into account.
Single-objective:
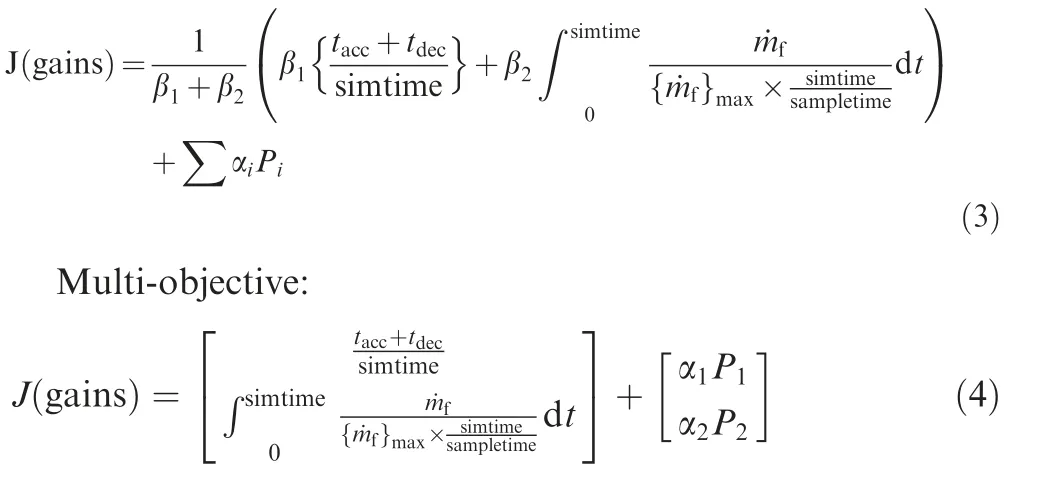
In the above equations, {˙m}is the maximum allowable fuel flow in any time step;simtime is the simulation time;sampletime is the time step; t is the time index; t, and tare acceleration and deceleration times; βis the weighting coefficients (set by the designer respect to the importance of objective function indices. ∑β=1); αis the weighting coefficients for penalty functions (set by the designer respect to the importance of penalty functions. ∑α=1); Pis the Penalty functions.
4.2. Determining which items should be included in the objective function
As mentioned above, the objective function should consider both performance and safety limitations, which means the objective function should be determined according to the specific problem. Fig. 5 shows an example of PLA command and the tracking performance of CPR and the response of rotational speed to illustrate the philosophy of control performance evaluation. In the figure, the PLA experiences a step increase from 0.6 to 1.0 at t=15 s and a step decrease from 1.0 to 0.7 at t=30 s. This PLA command is used to simulate the changes from ground idle to take-off and from take-off to flight idle.The tand tare the rise time and decline time of the CPR when the PLA has an upward and downward change;tand tare the oscillation time before the rise of PLA and after the decline of PLA respectively; area1 and area2 are the areas between the curves of CPR and PLA during tand trespectively. Taking overall consideration of control performance and safety factors, the transient performance can be quantified by the objective function in Eq. (5).

where RT is the normalized response time; FC is the normalized fuel consumption; Pis the penalty for oscillation during 0-15 s;Pis the penalty for oscillation during 30-45 s;Pis the penalty for the error between CPR and PLA;Pis the penalty for over-speed;Pis the penalty for over acceleration;Pis the penalty for over deceleration. The specific definition of each item in the objective function will be discussed in Section 4.3.
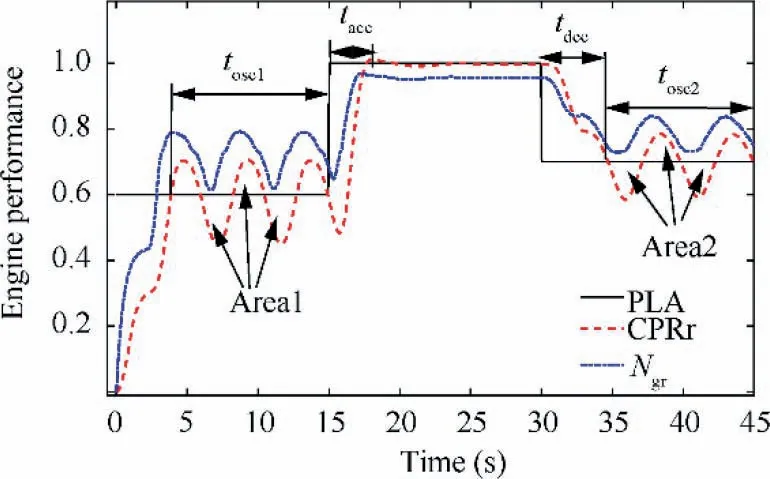
Fig. 5 Tracking performance of CPR with PLA and rotational speed response.
For the military aero-engines, the response time is much more important than the fuel consumption, while for the civil aero-engine,both the two performance indices are very important. For the sake of simplicity, each performance index and penalty item is assumed to have the equal importance, which means β=β=0.5 and α=α=α=α=α=α=1/6.Obviously, the lower the values of RT, FC and P-Pare,the better control performance the controller will have, and also the lower the objective function value will be.As a result,the problem to acquire the optimal gas turbine transient performance has been converted to finding the best gains combination which could minimize the value of this objective function.
4.3. Specifying and normalizing the performance indices and penalty functions
The items in the objective function should be specifically defined and normalized so that the control performance can be quantified and the weight coefficients can totally reflect the importance of each item.The methodology of normalizing an item is dividing it by an appropriate value and making sure each normalized item would be approximately included in the range of [0,1].
For the case shown in Fig.5,the response time is defined as t+t. The past experience showed that the response time varies between 11 s and 15 s,so divide it by 12 can be regarded as the normalized response time, i.e. RT=(t+t)/12.
As for the fuel consumption, the normalization reference can be the fuel consumption under the ideal condition that the CPR could track with the PLA command perfectly during the 45 s(denoted as FC).The normalization reference can be calculated by Eq. (6).

where W,W,and Wrepresents the fuel flow when the CPR is 0.6, 1.0 and 0.7 respectively. As a result, the ratio between the real fuel consumption FCand FCcan be taken as the normalized fuel consumption, i.e. FC=FC/FC.
With the same philosophy as the performance indices normalization, the definitions of the penalty functions P-Pare specified in Table 1.
5. Presenting the problem solution in chromosome
After establishing the objective function, the next phase is using LLGA to find the appropriate gains combination that generates the minimum objective function value (sometimes also called fitness value). The first step to apply LLGA for gains tuning is presenting the gains value on the chromosomes.Considering the less computational time and simplicity in genetic process, the gains value will be converted into binary code in chromosomes. These chromosomes have four genes which correspond to the four gains respectively. The boundaries of the gains are acquired through the past experience which are specified in Table 2. The accuracy of solution is set to be 0.2%, then the number of bits in each parameter is 9 which can be acquired through Eq.(7).As a result,the total number of bits in a chromosome is 36, as shown in Table 3.

The relationship between the binary code and real value of the gains is depicted in Eq. (8).
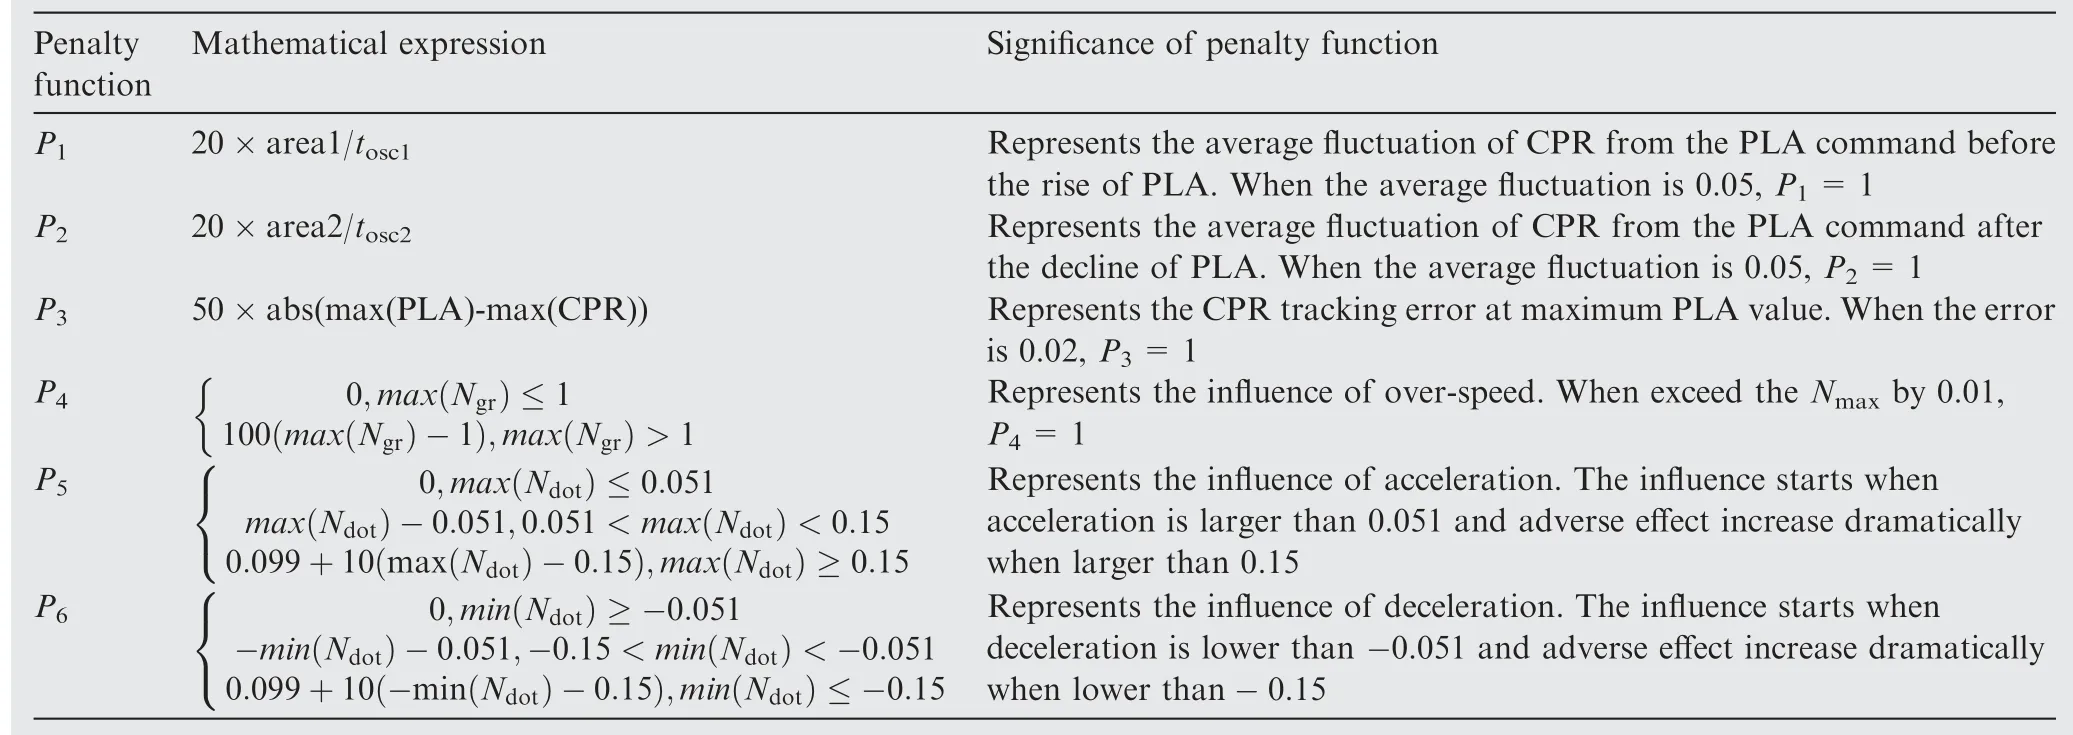
Table 1 Specification of penalty functions.

Table 2 Boundary of gains.

Table 3 Gains presented in a chromosome.

where Kis one of the four gains; lower_boundis the lower boundary of Kshown in Table 2; upper_boundis the upper boundary of Kshown in Table 2; xis the value of jbit on the gene of Kshown in Table 3.
6. Philosophy of the LLGA used in this paper
As a probabilistic global search method, Genetic Algorithm(GA) was introduced by Hollandbased on the combination and generation of DNAs and Chromosomesthat mimics the metaphor of natural biological evolution. GA operates on a population of individuals as potential solutions,each of which is an encoded string (chromosome), containing the decision variables (genes).
The pseudocode of a GA could be summarized through the following five main steps:
1. Creating an initial population P.
2. Evaluation of the performance of each individual pi of the population, by means of a fitness function.
3. Selection of individuals and reproduction of a new population.
4. Application of genetic operators: Crossover and Mutation.
5. Iteration of Steps 2 to 4 until a termination criterion is fulfilled.
To start the algorithm, an initial population of individuals(chromosomes) is defined. A fitness value is then associated with each individual,expressing the performance of the related solution with respect to a fixed objective function to be minimized.
As for the GTE controller optimization problem, there are two big challenges: too long simulation time of the Simulink model shown in Fig. 2 and too many local optimizations in the searching space. The test results have shown that the simulation time of the Simulink model is about 0.7 s a run,which means most of the optimization time will be cost in simulating the Simulink model. Therefore, from the aspect of computational time, the Simulink model should be run as fewer times as possible. This means the number of fitness evaluations should be as small as possible. As a result, if we want to limit the optimization time within one hour, the fitness evaluation times should be no more than 5143.However,from the aspect of increasing the probability of finding the global optimization,more chromosomes are needed to cover the searching space,which means the increasing of fitness evaluation times. The aim of the LLGA method proposed in this paper is to balance the two contradictory issues mentioned above, i.e. to find the global optimization using smaller population size and fewer generations. This LLGA method combines the advantage of the mGA in searching the global optimization and the advantage of the BBs detection in reducing the searching domain.
The process of the mGA consists of two phases—primordial phase and juxtapositional phase.At the initial generation of the primordial phase, a large number of chromosomes are generated,and each of the chromosome contains a substring which is a potential BB. In this phase, the population size is reduced as the generation increases,because the individuals with higher fitness value(which means the substrings are not likely to be the BBs)are eliminated. In the juxtapositional phase, the mGA is similar to the simple GA and the population size keeps constant. In this phase, the mGA combines the selected BBs to generate better chromosomes.The huge population size at the initial generation will reduce the probability of omitting the global optimization, which is also the reason to select mGA as the basement of the LLGA in this paper.
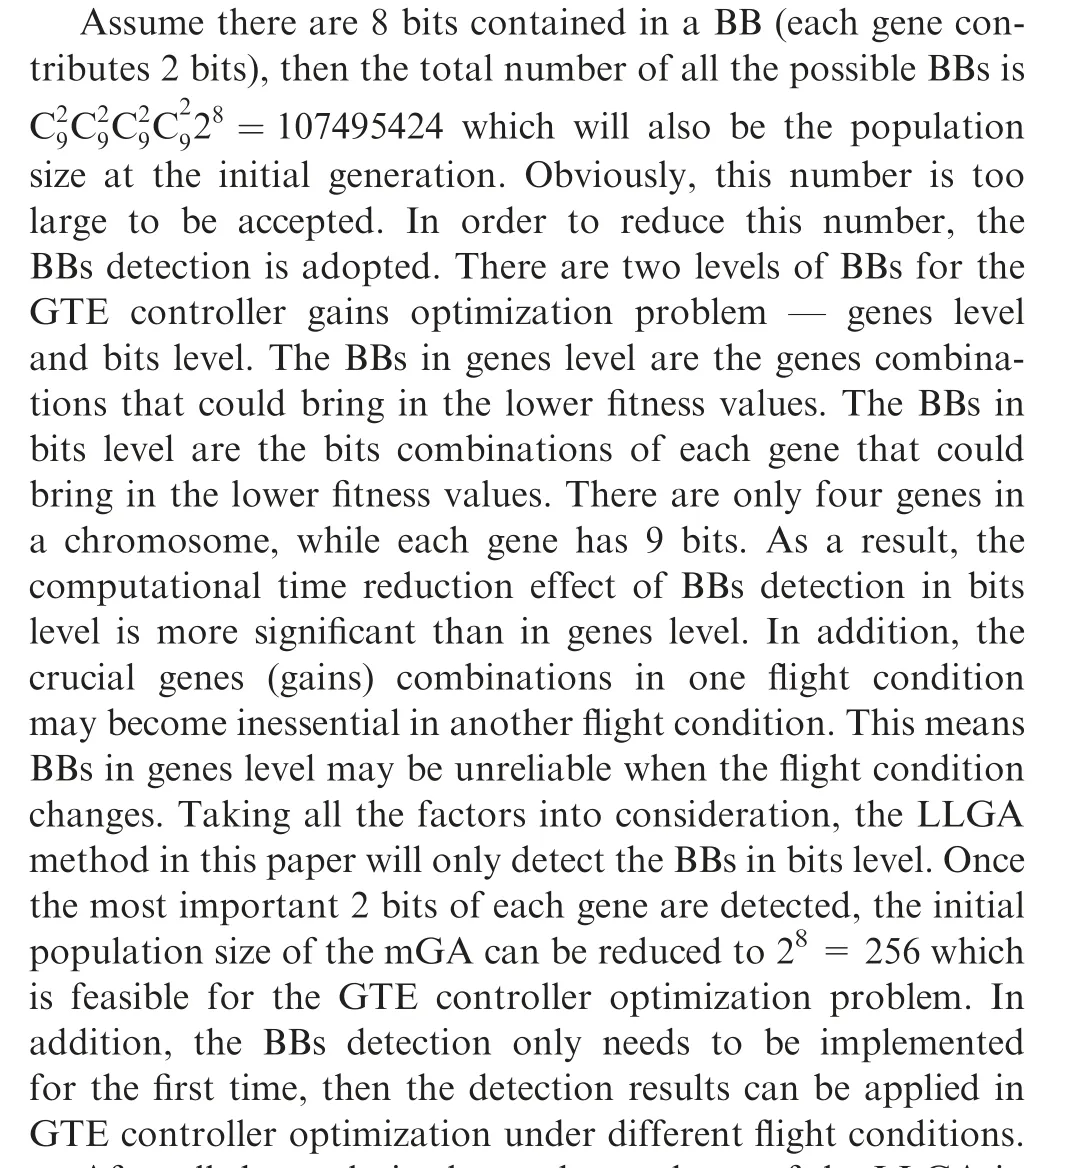
After all the analysis above, the roadmap of the LLGA in this paper is determined as below:
1. Detect the 2 bits BB for each gene(illustrated in Section 7);
2. Randomly generate 256 chromosomes and assign 0 or 1 to these 8 BB bits without repetition. These chromosomes are the initial population for the mGA (illustrated in Section 8.1);
3. Set the parameters for the mGA and run the genetic process(illustrated in Section 8.1).
7. Detecting the BB of each gene
In this section,two BB detection methods are proposed.One is based on the definition mentioned in section 1 that the chromosomes contain BB tend to have a lower fitness value. The other is according to the assumption that the most important bits (BB) are the bits that the fitness value is most sensitive to. In other words, the change of these bits can bring in the biggest change in the fitness value. Both of them will be illustrated next.
7.1. Method Ⅰ: Lower fitness value method


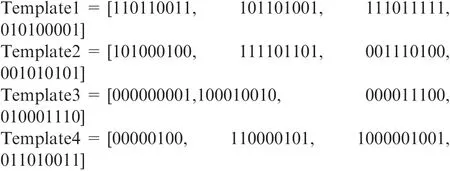
According to this idea,the number of 4×576=2304 chromosomes are generated. Input the 2304 gain groups into the Simulink model and get 576 average fitness values of the 576 location & value combinations. In theory, the first 2 bits of each gene are the most important, because the values of the gains are largely dependent on the values of the first 2 bits.Table 4 shows the ten location & value combinations of each gene whose corresponding chromosomes have the lowest fitness value.It can be seen from the table that the fitness values in each gene list are very close to each other, which makes it very difficult to distinguish the BB.
According to the results in this table, it can be seen that when the first 2 bits of gene1 have the value 1 and 0 respectively, the chromosomes tend to have the lowest fitness value.Then it can be confirmed that the combination (a=1,a=0)is the BB for gene1.As for gene2,all of the ten lowest fitness values equal to 1.3709, we cannot confirm the BB. For gene3, the combinations (c=0, c=0) and (c=0, c=0)have almost the same fitness value, we still cannot tell which should be the BB. For gene4, we can determine that the first 2 bits are the most important, but still unsure that whether(d=1,d=0)or(d=1,d=1)is the BB cause they have the same fitness value. All of the uncertain factors come from the random templates. If we use enough number of random templates, the generated top fitness values will become distinguishable and the lowest fitness value bits combination will reach the theory result. However,more templates means more computational time, that is not what we want.
7.2. Method II: Bigger fitness value change method
If change the values of some bits, the fitness value will also be changed.The bigger the fitness value changed means the more important the correspond changed bits are.Randomly select 2 bits from one gene,the total number of location combinations for all genes is CC9 =144. For each location combination,assign 0 or 1 randomly for the selected 2 bits and generate 4 location & value combinations. The other 34 vacant bits of each combination will be filled by a randomly generated template. For each location combination, calculate the difference value between the maximum and minimum fitness values of the 4 corresponding location and value combinations. For the sake of eliminating the influence of random template on BB detection,three random templates (shown below)are used for filling the 34 vacant bits. The average difference value of the same location combination filled by three templates will be more reliable.

Table 4 BB detection results using lower fitness value method.
Template1=[010111000, 111101101, 001011111,100100011]
Template2=[100111001, 110101000, 110001100,011001001]
Template3=[011101101, 000110101, 101010011,001011100]
According to this idea, the number of 144×4×3=1728 chromosomes are generated. Input the 1728 gain groups into the GTE controller model and get the objective function values, and finally acquire the 144 averaged difference value (36 for each gene). Table 5 shows the ten location combinations of each gene which have the biggest averaged difference value.It can be seen from the table that the difference values in each gene list are very distinguishable.For gene1,gene2 and gene3,the first 2 bits correspond to the biggest fitness value difference, which means the location combinations (a, a), (b,b), (c, c) are the BBs. For gene4, the location combination(d, d) only brings in the second largest fitness value difference, while the largest fitness value difference corresponds to the combination of(d,d).This conflict with the theory result is also caused by the insufficient number of random templates.Anyway, the existing results in Table 5 are good enough to confirm the theory that the first 2 bits of each gene are the BBs of the chromosomes.
By comparing method Ⅰand method II,it can be concluded that:
· Method Ⅰcan find BBs with location and value, while method II can only find BBs with location;
· The BBs detecting results of method II are much more distinguishable than method Ⅰ;
· The random templates influence in method II is much less than in method Ⅰ, which makes the detecting results of method II are much more reliable than method Ⅰ.
8. Using LLGA to minimize the objective function
8.1. Initialize the population and set the parameters for mGA
The population size in the primordial phase is dependent on the number of BBs. As the BBs are the important code segments in the chromosome and can be regarded as the partial solutions to the problem, each BB should appear at least once in the initial population. In Section 7, it has been confirmed that the first 2 bits of each gene are the BBs. As a result, 0 or 1 is assigned to these 8 BB bits, then the bit &value combination number is 2=256. The other 28 vacant bits of the 256 chromosomes are filled by 256 differentrandom templates respectively. The aim of using 256 different random templates is to enrich the diversity of the initial individuals as much as possible. After this process, the searching space sized 2has been evenly divided into 256 subspaces and each subspace has a chromosome. As a result, the convergence of genetic process is greatly accelerated and the probability of omitting the global optimization is greatly reduced. According to the Ref. 24, the population size in juxtapositional phase is 10-200; the crossover ratio is 0.4-0.99;the mutation ratio is 0.0001-0.1. Considering the balance between the computational time, convergence speed, and keeping population diversity, all the genetic process parameters are depicted in Table 6.

Table 5 BB detection results using bigger fitness value change method.
8.2. Primordial phase
In this phase, the population size is reduced in a certain ratio(usually by half) at every generation. As for the optimization problem in this paper, the genetic process is shown as below:
Calculate the fitness value of the 256 initial chromosomes;Select 128 individuals with lower fitness value as the parent group of the next generation and mark them with the number 1-128;
Apply the four operators below on the parent group to generate the offspring group;
Elites selection
Select 0.05×128≈6 individuals with the lowest fitness value from the parent group as the elites and copy them to the elite domain of the offspring group shown in Table 7.
Mutation
a. Randomly select and copy an individual from the parent group;
b. Randomly select 2 bits from the copied individual and change the values of the 2 bits.Send the mutational individual to the mutational domain in Table 7;
c. Repeat step a and b for 0.02×128≈3 times.
Cut/splice
The cut/splice operator used in this paper develops from the uniform crossover operator.This kind of cut/splice operator could generate offspring with more diversity which is beneficial for avoiding the local optimization.Fig.6 depicts the working principle of this cut/splice operator and its detail process is described as below:
For i=(0.02+0.05)×popsize+1:0.5×popsize
a. Randomly select 2 individuals P,Pfrom parent group as the cut/splice parents;

Table 7 Chromosome store for offspring group.
b. Randomly select 1 bit from Pand copy this bit to the corresponding bit of the ioffspring individual. Repeat the process for a random number of 1-36 times;
c. Fill the vacant bits of the ioffspring individual with the corresponding bits of the P. Send the generated offspring individual to the cut/splice domain1 in Table 7;
d. Randomly select 1 bit from Pand copy this bit to the corresponding bit of the (i+(0.43)×popsize)offspring individual.Repeat the process for a random number of 1-36 times;
e. Fill the vacant bits of the (i+(0.43)×popsize)offspring individual with the corresponding bits of the P.Send the generated offspring individual to the cut/splice domain2 in Table 7.
End
Reproduction
The reproduction in this paper adopts the tournament selection strategy.Randomly select 2 individuals from the parent group and send the one with lower fitness value to the reproduction domain in Table 7. Repeat the selection step for 0.07×popsize time.
Calculate the fitness value of the 128 individuals in Table 7;Select 100 individuals with lower fitness value from Table 7 as the parent group of the next generation and mark them with the number 1-100;
Apply the four operators on the 100 individuals to generate the offspring group and set them as the initial population of the juxtapositional phase.
8.3. Juxtapositional phase
In this phase, the population size keeps constant and the parameters for genetic process has been depicted in Table 6.The genetic operators are the same as primordial phase and the genetic process is shown as below:
For generation=3: MaxGeneration
Calculate the fitness value of the popsize individuals;
Apply the four operators on these individuals to generate the next generation.
End

Table 6 Parameters for mGA process.

Fig. 6 Sketch map of cut/splice operation.
9. The optimization results in runway
In the runway,the aircraft usually starts from ground idle condition where it stays on the ground and keeps static. At idle condition, the aero engines run in the minimum power setting that could only supply the minimum required power. Then, it accelerates to reach to takeoff phase in which the aircraft leaves the ground at the end of runway and becomes airborne.For light aircraft, usually full power is used during takeoff.The PLA command as shown in Fig. 5 is used to simulate the changes from ground idle to take-off. Using the LLGA according to the procedures specified in Section 8 to optimize the controller gains, the fitness value convergence versus the evolution generation is shown in Fig. 7. The standard deviation of the fitness value of all individuals in each generation is shown in Fig.8.The standard deviation has a great decrease in the first 3 generations, then it maintains at a relative high level during the generations of 4-20 and finally experiences an obvious reduction in the last 10 generations. The standard deviation reduction in the first 3 generations is caused by the elimination of the high fitness individuals and the reduction of the population size in the primordial phase. As the numerous local optimizations in the searching space and the character of the LLGA in keeping the population diversity, the standard deviation will not converge in a small number of generations and this is benefit for searching the global optimization.
The final optimization results are depicted in Table 8. The next step is to simulate the GTE controller model with the optimized gains and the initial gains respectively, then get the engine performance as shown in Table 9 and Fig. 9. It is shown that the fitness value is reduced from 1.0907 to 0.9931 after optimization. The RT is reduced by 6.7% while the FC is almost the same. This achievement is promising because in the runway the response time is the main concern and the fuel consumption could be compromised due to the short time of the flight phase. As for the penalty items, the fluctuation (P,P) and the tracking error (P) are greatly reduced, while the maximum deceleration value (P) has some increase. Overall,the benefits brought in by the optimization greatly outweighs the side effects. In Fig. 9, the CPRis the relative compressor pressure ratio and the Nis the relative shaft rotational speed(normalized with the design point values).
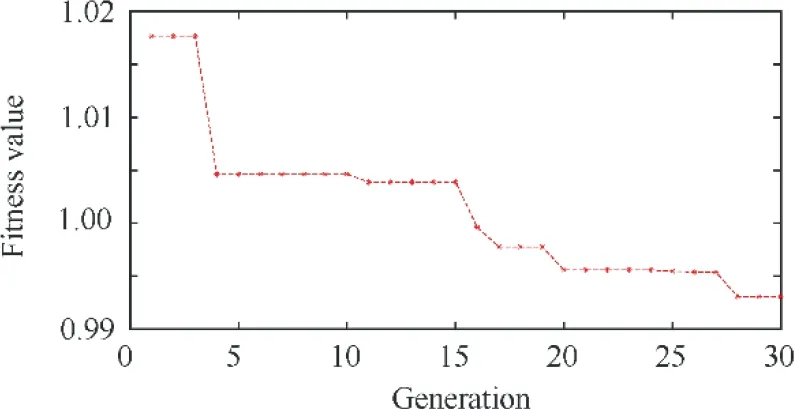
Fig. 7 Static convergence of the minimum fitness value.
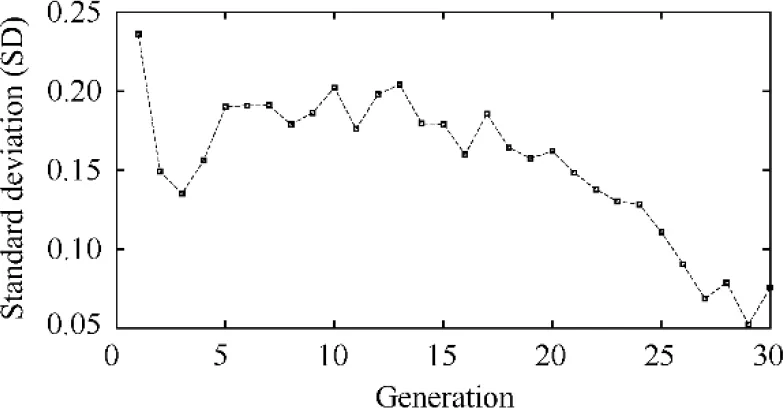
Fig.8 Standard deviation of the fitness value at each generation.
The GTE controller should limit the rotor acceleration and deceleration to prevent the surge in compressor and flame out in combustor. Fig. 10 shows the variation of the rotor speed derivative.In the figure,both the rotor speed derivative before and after optimization have not exceeded the safe bounds.The Ncurve is smoother after optimization which is caused by the reduction in fluctuation of the rotational speed.Moreover,the increase in the maximum deceleration value means the optimized controller has used the safety margin for the lower bound to improve the engine performance.
10. Comparison between LLGA and simple GA
In order to confirm the effectiveness of utilizing linkage learning in GA method,the optimization results of LLGA and simple GA are compared in this section. All the genetic parameters of the simple GA are set the same as that in the juxtapositional phase of LLGA which has been shown in Table 6.In order to eliminate the influence of randomness, each optimization method is run for 15 times and all the results discussed in follow are the average values of the 15 runs.
The optimization process history of the two methods is depicted in Fig. 11.In the figure, the average minimum fitness value in the first generation of LLGA is lower than that of simple GA, this verifies the fact that after BBs detection the convergence rate is much accelerated.Moreover,the optimization results of LLGA is better than simple GA at any generation,although the difference in fitness value decreases as the generation increases.This means the advantage of LLGA will standout when there is a limitation on iterations or optimization time.

Table 8 Optimized controller parameters.

Table 9 Performance and penalty function values before and after optimization.
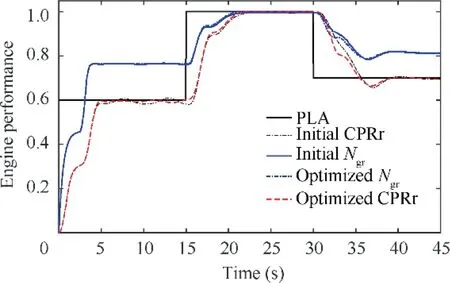
Fig. 9 Engine performance before and after optimization.
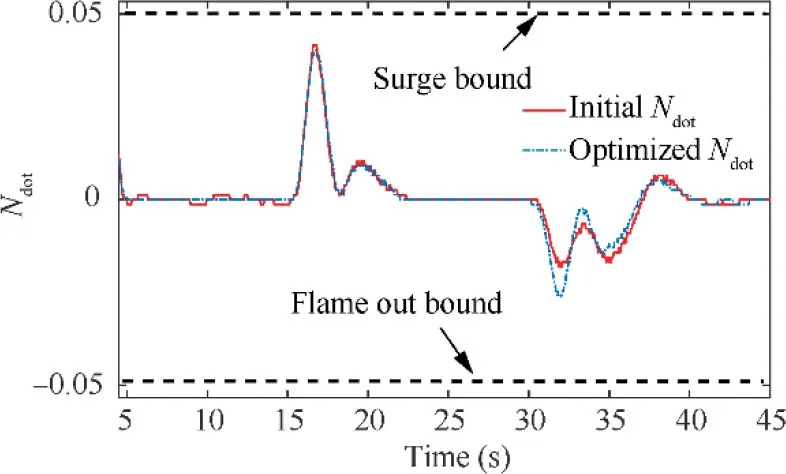
Fig. 10 Derivative of engine rotor speed before and after optimization.
The final optimization results are shown in Table 10.As the population size of the first two generations (primordial phase)for LLGA is larger than that of the simple GA, the optimization time of LLGA is a little longer than simple GA.Nevertheless,the LLGA method is more time saving than simple GA to achieve the same fitness value. If the GTE controller contains more gains to be adjusted, the advantage of LLGA will become more remarkable.
The comparison of dynamic convergence behaviour of the two methods is shown in Fig. 12. Their standard deviations of the fitness value are intertwined with each other. This is because both of the two methods adopt the same uniform crossover operator which keeps their population diversity remain at the same level.
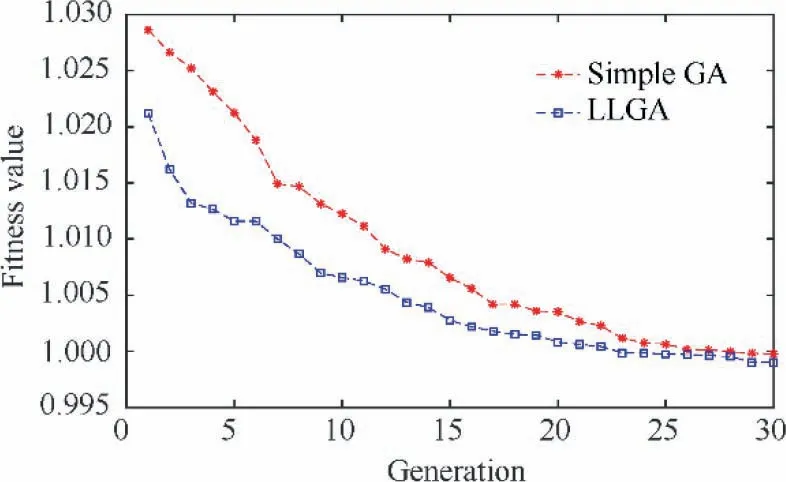
Fig.11 Comparison of static fitness convergence for LLGA and simple GA.
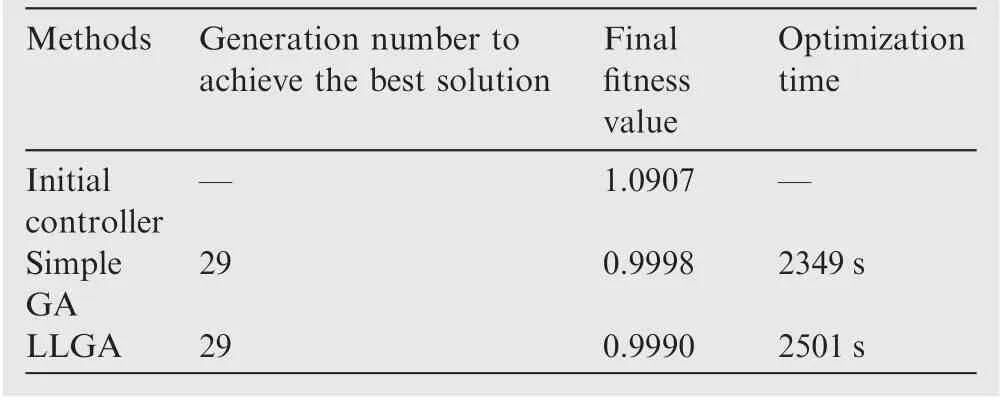
Table 10 Average optimization results for 15 runs.
The standard deviation of the minimum fitness for the 15 runs at each generation is shown in Fig.13.It can be seen from the figure that when the generation number is larger than 14,the standard deviation of the minimum fitness for different runs based on LLGA is lower than that of the simple GA.This means the reliability of LLGA is better than simple GA when the generation is larger than a certain number.
11. Conclusion
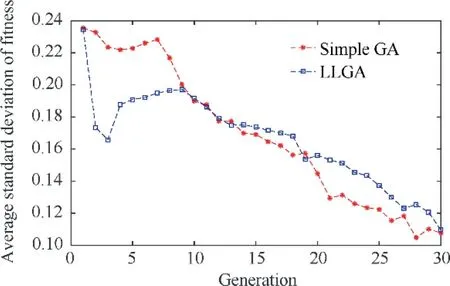
Fig.12 Comparison of the average standard deviation of fitness value for 15 runs at each generation.
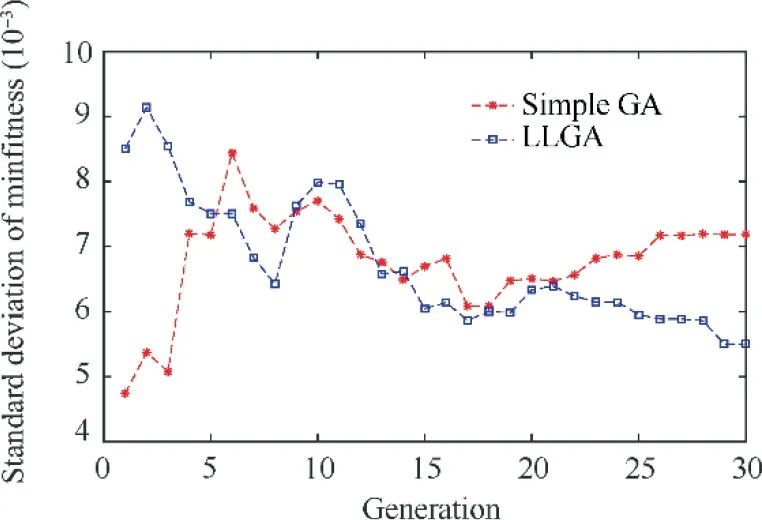
Fig. 13 Standard deviation of minimum fitness for 15 runs.
A methodological approach for the fuel flow controller gains tuning problem in GTE based on LLGA is presented in this paper.In order to achieve this goal,a GTE fuel flow controller model is built in Simulink. In this controller model, the fuel flow supplied to the engine is the sum of the steady fuel flow and the transient fuel flow which is the winner of Min-Max selection strategy from the four transient loops, PLA loop,Nloop, acceleration loop and deceleration loop. As a result, the four gains in the transient loops, K, K, Kand Kbecome the key factors to improve the control performance. After designing the controller, the methodology of using LLGA to tune the gains is illustrated in detail. Firstly,the objective function that considers both performance indices and penalty items is established to quantify the control performance. The performance indices are response time and fuel consumption, while the penalty items include fluctuation,tracking error, over-speed, acceleration, and deceleration.Therefore,the task to optimize the fuel controller is converted to find the optimization gains combination that could minimize the objective function. Secondly, in order to avoid trapping in the local optima and reduce the optimization time,the LLGA based on mGA is applied in searching the best controller gains combination. Two kinds of BBs detection methods, lower fitness value method and bigger fitness value change method,are proposed to determine the most important bits on the chromosomes to accelerate the searching speed.The detection results show that the first two bits of each chromosome are the BBs. Thirdly, the specific procedures to apply LLGA on gains tuning problem are illustrated. At last, the LLGA method is used for gains tuning in the runway flight conditions from idle to takeoff. The simulation results show that after optimization the response time is reduced by 6.7%while the fuel consumption is almost the same as the initial performance. As for the penalty items, the fluctuation and the tracking error are greatly reduced, while the maximum deceleration value has some increase. Overall, the benefits brought in by the optimization greatly outweighs the side effects. Finally, the comparison between the LLGA and the simple GA in GTE controller optimization is made in this paper, the results show that the LLGA method can get better solution than simple GA within the same iterations or optimization time. In addition, the searching results of LLGA are more reliable than simple GA. In this paper, only the BBs on bits level are detected. However, in reality, there are more parameters need to be tuned for the two shafts or three shafts GTE. In this case, the relationship between parameters become very important and thus exploring the linkage on genes level is the next important research point.
Declaration of Competing Interest
The authors declare that they have no known competing financial interests or personal relationships that could have appeared to influence the work reported in this paper.
Acknowledgement
sThe authors are grateful to the anonymous reviewers for their critical and constructive review of the manuscript. Great appreciation should also be delivered to Aero-engine Corporation of China (AECC), China Scholarship Council (CSC) and China Aviation Powerplant Institute (CAPI) for offering the precious opportunity to LIU Yinfeng to study in Cranfield University.
 CHINESE JOURNAL OF AERONAUTICS2021年4期
- CHINESE JOURNAL OF AERONAUTICS的其它文章
- Time delay compensation in lateral-directional flight control systems at high angles of attack
- Dual stability enhancement mechanisms of axial-slot casing treatment in a high-speed mixed-flow compressor with various tip clearances
- Development cost prediction of general aviation aircraft using combined estimation technique
- Improvement on shaped-hole film cooling effectiveness by integrating upstream sand-dune-shaped ramps
- Modeling and parameter identification of linear time-varying systems based on adaptive chirplet transform under random excitation
- An experimental method to obtain the hard alpha anomaly distribution for titanium alloy aeroengine disks
