Investigation on surface roughness, residual stress and fatigue property of milling in-situ TiB2/7050Al metal matrix composites
Yifeng XIONG, Wenhu WANG, Yaoyao SHI, Ruisong JIANG,Chenwei SHAN, Xiaofen LIU, Kunyang LIN
a Key Laboratory of High Performance Manufacturing for Aero Engine, Ministry of Industry and Information Technology, School of Mechanical Engineering, Northwestern Polytechnical University, Xi’an 710072, China
b Engineering Research Center of Advanced Manufacturing Technology for Aero Engine, Ministry of Education, School of Mechanical Engineering, Northwestern Polytechnical University, Xi’an 710072, China
c School of Aeronautics and Astronautics, Sichuan University, Chengdu 610065, China
KEYWORDS Fatigue life;Metal matrix composite;Residual stress;Three-dimensional surface roughness;TiB2 particle;Two-dimensional surface roughness
Abstract For higher efficiency and precision manufacturing,more and more attentions are focused on the surface roughness and residual stress of machined parts to obtain a good fatigue life.At present, the in-situ TiB2/7050Al metal matrix composites are widely researched due to its attractive properties such as low density, good wear resistance and improved strength. It is of great significance to investigate the machined surface roughness, residual stress and fatigue life for higher efficiency and precision manufacturing of this new kind material. In this study, the surface roughness including two-dimensional and three-dimensional roughness, residual stress and fatigue life of milling in-situ TiB2/7050Al metal matrix composites were analyzed.It was found from comparative investigation that the three-dimensional surface roughness would be more appropriate to represent the machined surface profile of milling particle reinforced metal matrix composites. The cutting temperature played a great role on the residual stress.However,the effect of increasing cutting force could slow down the transformation from compressive stress to tensile stress under 270°C. An exponential relationship between three-dimensional roughness and fatigue life was established and the main fracture mechanism was brittle fracture with observation of obvious shellfish veins,river pattern veins and wave shaped veins in fracture surface.
1. Introduction
In modern aviation and aerospace industries, to archive the goal of high efficiency and precision manufacturing,increasing attention has been paid on improving surface roughness and residual stress,which would have an impact on the fatigue life or service life, for machined parts.As a kind of promising materials,due to its outstanding properties,the in-situ TiBparticle reinforced aluminum metal matrix composites(in-situ TiB/Al MMCs) attract more and more scholars from various research such as material preparation,property improvement and analysisand a few machining performance investigations.It is very important and significant to have a full understanding of the surface roughness, residual stress and fatigue property for high efficiency and precision manufacturing of this new kind material.
For particle reinforced metal matrix composites(PRMMCs), many scholars have performed investigations mainly on the surface roughness,residual stress and fatigue life of SiC particle reinforced aluminum metal matrix composites(SiC/Al MMCs).It was found that there would be machining defects such as pits, voids, microcracks, grooves,protuberances, matrix tearing on the machined surface. Wang et al.carried out high speed milling tests on SiC/Al MMCs with polycrystalline diamond (PCD). It was noted that the most significant milling parameter for surface roughness was milling speed, followed by the interaction between feed rate and milling speed, then the feed rate. Besides, the surface texture was quite irregular due to the presence of particles. Pramanik et al.found that the surface residual stress of SiC/Al MMCs would be compressive while it would be tensile stress for matrix aluminum alloy. Besides, the surface roughness of SiC/Al MMCs was greatly influenced by particle fracture or pull-out at low feeds.Lin et al.analyzed the effect of tool wear and tool nose radius on residual stress for turning TiB/7050Al MMCs. It was concluded that the residual stress was always compressive due to the existence of particles.With increasing tool nose radius, the residual stress decreased and tended to be tensile.Huang et al.investigated the fatigue performance improvement of SiC/Al MMCs with shot peening.It was stated that the compressive residual stresses near the surface region and improvement of the stability of residual stresses field were both important to fatigue life of SiC/Al MMCs.As for in-situ TiB/Al MMCs,only a few researches have been reported on the machining performanceand it is vital to carried out investigations on the machined surface quality such as surface roughness,residual stress and fatigue property for high efficiency and precision manufacturing.
On the other hand,the International Standardization Organization standard defines the two-dimensional (2D) surface topography parameters and the average roughness R, which is widely used, is defined of the profile height distribution (z)over an assessment length (L) as following:

It can be seen that the 2D surface roughness greatly relies on the sampling line L such as location and direction in the machined surface.Due to the machining defects such as pits,voids, grooves on the machined surface of PRMMCs, the 2D surface roughness value varies greatly along different sampling line. However, the three-dimensional (3D) surface roughness,the average roughness Sand the surface root mean square roughness S,represents the machined surface profile of whole assessment area A as below:

Wang et al.carried out comparative analysis of 2D and 3D surface roughness for milling SiC/Al MMCs.It was found that the 3D surface roughness was more adaptable to describe the machined surface topography of SiC/Al MMCs.
Thus, in this study, investigations were performed on the surface roughness, residual stress and fatigue property of this new material in-situ TiB/Al MMCs for high efficiency and precision manufacturing. The 2D and 3D surface roughness was comparatively analyzed and the effect of cutting parameters on machined surface roughness was studied. The residual stress in the machined surface and subsurface was also deeply investigated with analyzing the effect of cutting force and temperature. At last, the fatigue property and fracture surface of machined specimens were observed and a fatigue life prediction model based on the 3D surface roughness was established.
2. Experimental procedures
2.1. Materials and cutting tools
The in-situ TiB/7050Al MMCs and specimens used in this study,as presented in Fig.1,was provided from Shanghai Jiao Tong University and it was prepared with an exothermic reaction process via KTiFand KBFmixed saltsas shown in Eq. (5). The mechanical properties of in-situ TiB/7050Al MMCs, particle size and chemical composition of matrix is listed in Tables 1-3 respectively. Due to the terrible tool wear,the PCD milling toolswere selected and Table 4 shows the specification of PCD tools applied during dry milling process.
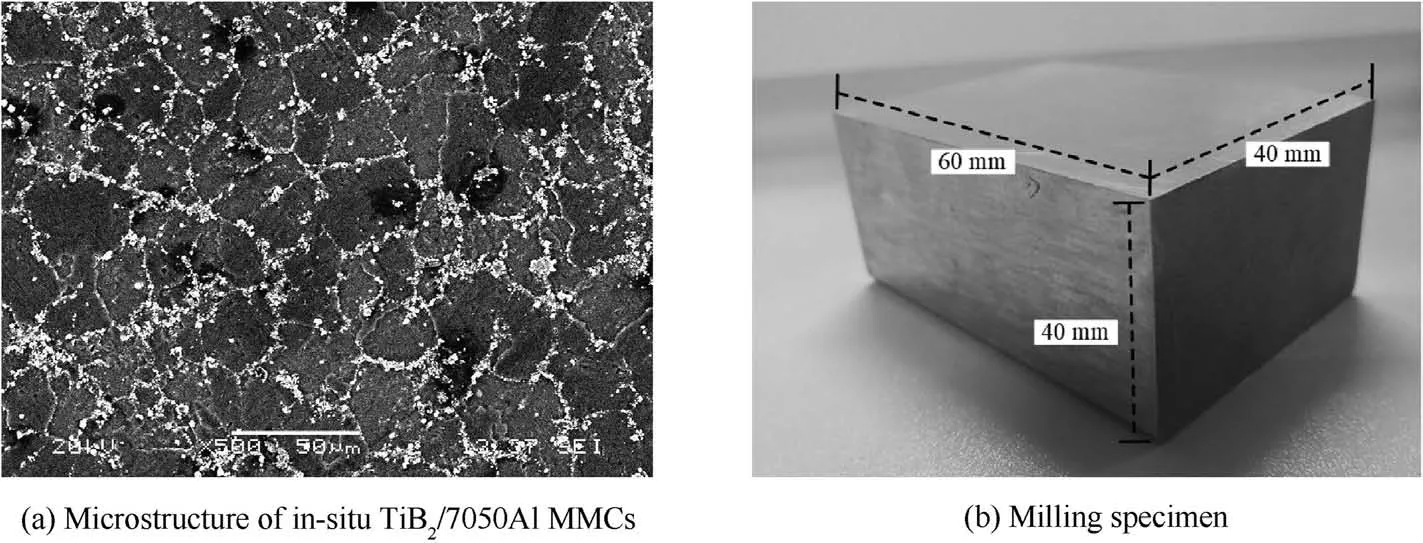
Fig. 1 Material and specimen used for experiments.

Table 1 Mechanical properties of in-situ TiB2/7050Al MMCs.

Table 2 Particle size and volume of in-situ TiB2/7050Al MMCs.

2.2. Experiment design and measurement
The milling tests were performed on a YH-VT850Z CNC as shown in Fig. 2(a). During milling, the cutting forces were recorded with the Kistler 9255B three-component piezoelectric dynamometer and the cutting temperature of machined surface was tested using a Fluke Ti400 thermal image.According to Quan,the surface emissivity of in-situ TiB/7050Al MMCs was calibrated as 0.32 to ensure measurement accuracy. After milling process, the 2D surface roughness and 3D surface roughness was measured with the MarSurf XT20 presented in Fig. 2(b).
In this study, the average roughness Rand root mean square roughness Rwas selected for 2D surface roughness measurement with a 6 mm sampling length.While,for 3D surface roughness, the average roughness Sand the surface root mean square roughness Swas measured among a 6 mm×6 mm square. As shown in Fig. 3(a), surface roughness of five areas of each machined surface was investigated to have an insight of the influence of measuring location on surface roughness. As presented in Fig. 3(b), the 2D surface roughness was measured along X, Y and 45° directions to investigate the effect of measuring direction on surface roughness and the roughness was marked as R,R,R,R,Rand R.
Besides, the machined surface residual stress was measured by LXRD MG2000 with Co-Ka radiation. The residual stress distribution under machined surface was also measured after electrolytic polishing with a solution of HCl:HF:HO=2:3:95 (60 s for peeling 5 μm). At last, a group of fatigue tests were carried out to investigate the fatigue property and the influence of surface roughness on fatigue life. As presented in Fig. 4, the fatigue life tests were performed on a QBG-50 fatigue life testing machine under 240 MPa.The loading frequency was about 96 Hz and the stress ratio r=-1.The surface roughness of fatigue specimens was measured before fatigue life tests. After fatigue tests, the fracture morphologies of specimens were analyzed with the Tescan VEGA3 SEM.
The cutting parameters such as cutting speed v,feed rate f,cutting depth a(axial depth of cut) and cutting width a(radial depth of cut)of milling process were investigated.A set of single-factor tests as listed in Table 5 were carried out to investigate the influence of cutting parameters on machined surface roughness and residual stress. The orthogonal milling tests in Table 6 were performed for regression modeling of surface roughness and residual stress. After tests and regression modeling, the cutting parameters for fatigue life tests were determined according to the established models to make the surface roughness vary from each other.

Table 3 Nominal chemical composition of matrix.

Table 4 Specification of PCD tools used in milling tests.
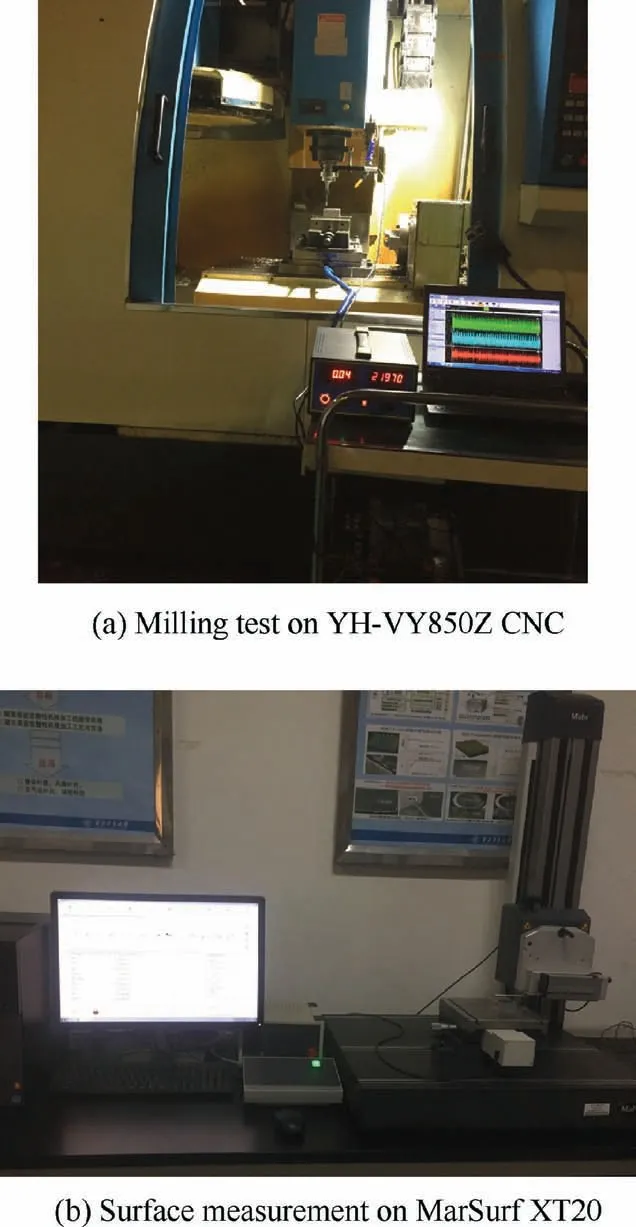
Fig. 2 Milling machine and surface roughness measuring equipment.
3. Results and discussions
3.1. Comparative analysis of 2D and 3D surface roughness
To have a deep and comprehensive understanding of 2D and 3D surface roughness for milling in-situ TiB/7050Al MMCs,the measured results and standard deviations of machined surface roughness was presented in Fig. 5, Tables 7 and 8.
It can be seen from Fig. 5(a) that the 3D roughness values S, Sof five measured areas in one machined specimen surface vary little from each other.While the 2D roughness values R,Ralong X,Y and 45°directions of five areas differ greatly with each other. Fig. 5(b) presents the standard deviation of 2D and 3D surface roughness values of all measured areas.It is obvious to us that the fluctuation of 2D roughness values is much bigger than that of 3D roughness from the great difference in standard deviation, which indicates that the tested location areas would influence the 2D surface roughness value greatly. It means that you can obtain a small R, Rvalue if you choose a right measuring area in the machined surface.Or, the measured 2D roughness values would be three times as big as last tested results, as presented in Fig. 5(a), when it was measured in another area. Besides, as listed in Table 8,the standard deviations of Rand Rof all 15 tested results are still much bigger than that of 3D surface roughness.Thus,it could be noted that the measuring area in the machined surface has a significant influence on the 2D surface roughness.However, for 3D roughness as shown in Fig. 5(a), the roughness value changes little with different measuring areas. Then,the average value of these five results would be more appropriate to describe the surface profile of the machined surface with using 3D surface roughness.
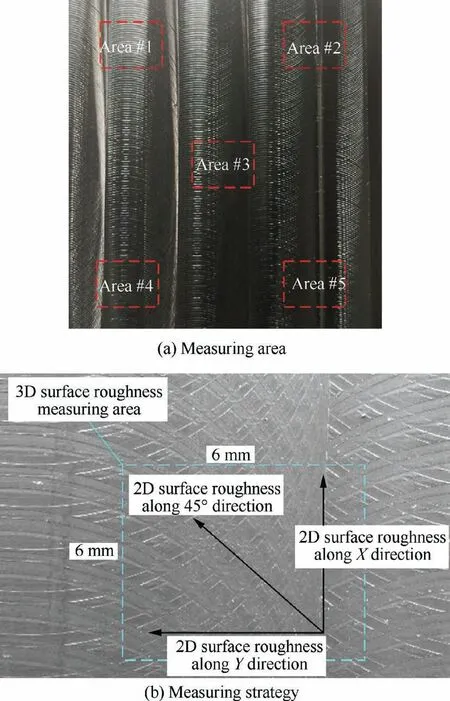
Fig. 3 Measurement for 2D and 3D surface roughness.
As for 2D surface roughness, it was further studied along different measuring directions as shown in Fig. 6. It can be seen from Fig. 6(a) and (b) that Rand Rvalue along X,Y and 45° directions varies greatly. The big difference between standard deviations along different directions in Fig.6 indicating that except for measuring location,the measuring direction also has an important impact on the 2D surface roughness for milling in-situ TiB/7050Al MMCs.
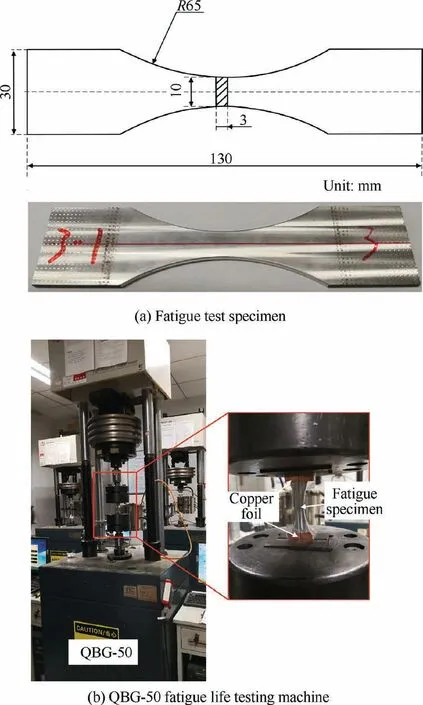
Fig. 4 Fatigue life test.
Fig. 7 shows the surface topography of milling in-situ TiB/7050Al MMCs. It can be seen that there would be a secondary milling area (or overlapping area) resulted from the effect of cutting width during milling process. The surface of secondary milling area would be machined twice and the surface texture would be smoother as shown in Fig.7(b).Then,with a result, the roughness value would be small when the measuring direction or sampling line across this smooth area.As shown in Fig.7(a),the 2D roughness along Y and 45°directions would be small compared with that along X direction.However, with changing the measuring area, the X direction could be the only one across the smooth secondary milling area, which would result in small roughness along X direction but large ones along Y and 45°directions.This is also another reason that why the measuring area could have an impact on the 2D surface roughness.
On the other hand,as shown in Fig.7(c),typical machining defects such as groove, material smearing, cutting edge mark and protuberance, which would have a great influence on the measured 2D roughness values, would be produced in the machined surface for in-situ TiB/7050Al MMCs. As a result,the 2D roughness values would differ a lot with sampling line crossing and not crossing these defects. From analysis and results above, it could be concluded that the measuring direction also has a vital effect on the 2D surface roughness.
However,for 3D roughness,it represents the surface profile of the whole area which contains the machining defects area,secondary milling area and a lot of 2D roughness results along different directions. It shows much more information about the machined surface with using 3D roughness instead of 2D roughness. Besides, from all the standard deviation results in Fig.8,it is clearly to us that the 3D surface roughness is much more stable in measuring and describing the surface profile of in-situ TiB/7050Al MMCs.Compared with 2D roughness,the effect of defects, measuring location and direction on measured results is much smaller with using 3D roughness. It is more appropriate to apply 3D surface roughness for measuring the machined surface of milling in-situ TiB/7050Al MMCs.
Fig. 9 presents the influence of cutting parameters on 3D surface roughness Sand S. To study the effect of secondary milling area on roughness, it is defined using an overlapping ratio K as following:

where W is the width of overlapping area in Fig.7(b)and D is the diameter of milling tool, astands for the cutting width.
It can be seen from Fig.9 that the surface root mean square roughness Swas larger than the average roughness Sand they showed similar tendency with cutting parameters increasing. The 3D roughness Sand Sincreased with increasingfeed rate or cutting depth due to the increasing cutting force.However, with increasing cutting speed, the cutting force decreased resulting in reducing tool wearand the 3D roughness decreased accordingly.As for increasing overlapping ratio K, the smooth secondary milling area increased at the same time. As a result, the 3D roughness decreased with increasing overlapping ratio K. Besides, the value S/S, which describes the distribution of peak and valley in the machined surface,kept being 1.2 with a very small fluctuation indicating that the 3D roughness results were stable enough to represent the machined surface profile of milling in-situ TiB/7050Al MMCs.
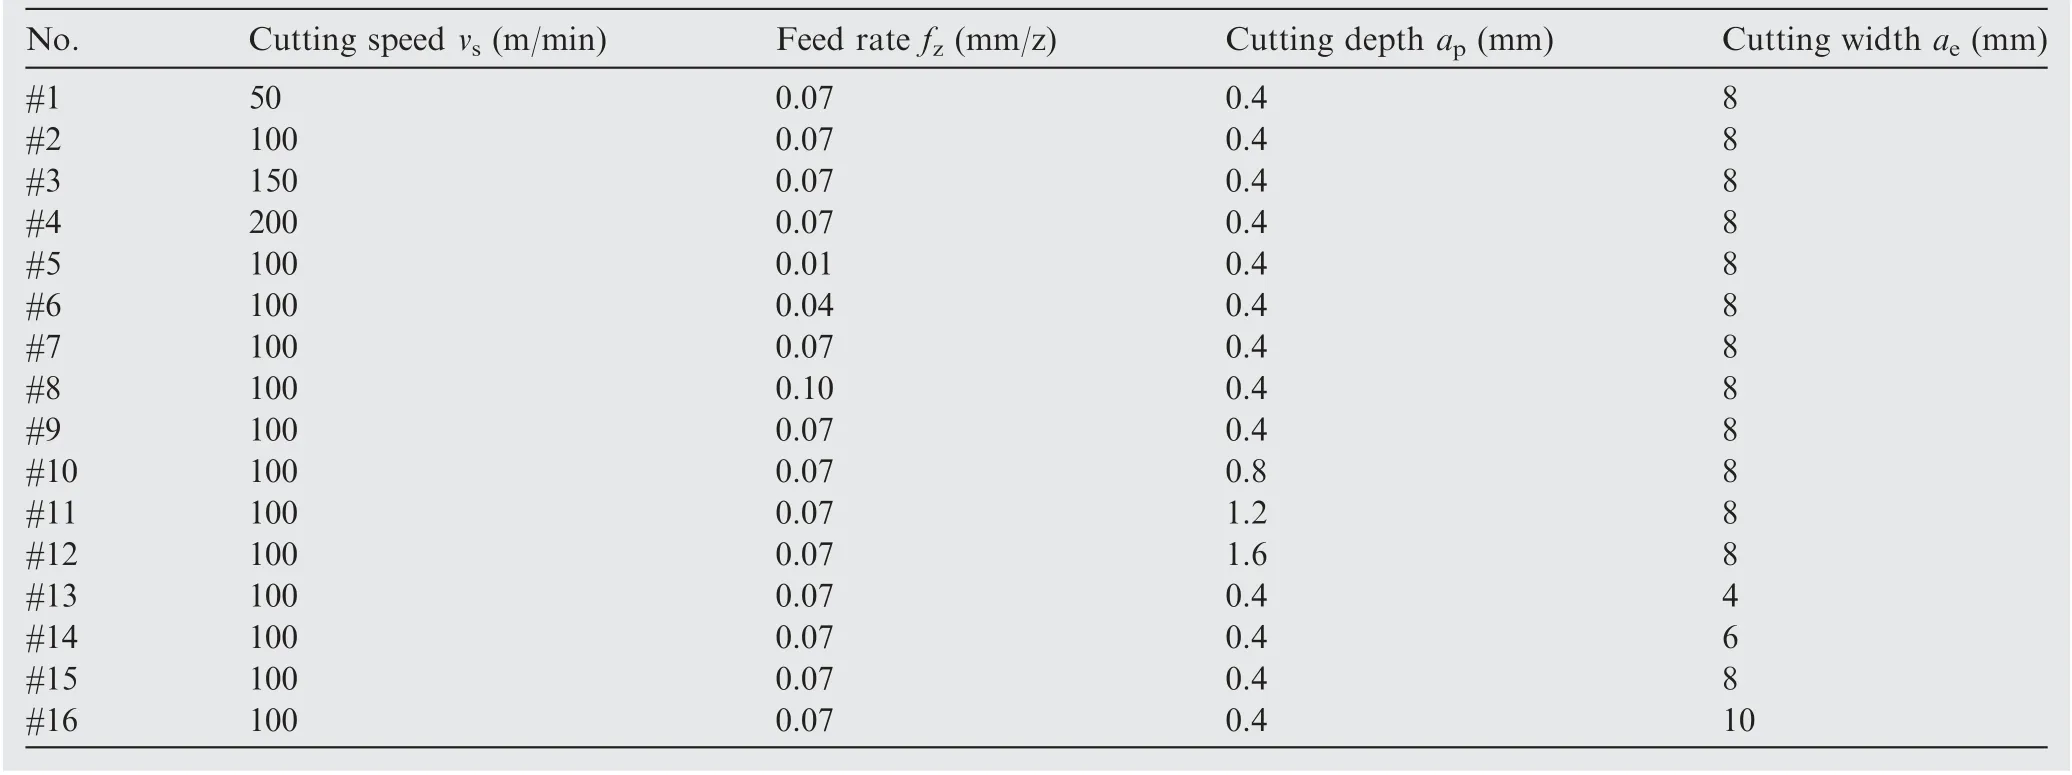
Table 5 Cutting parameters for single-factor milling tests.
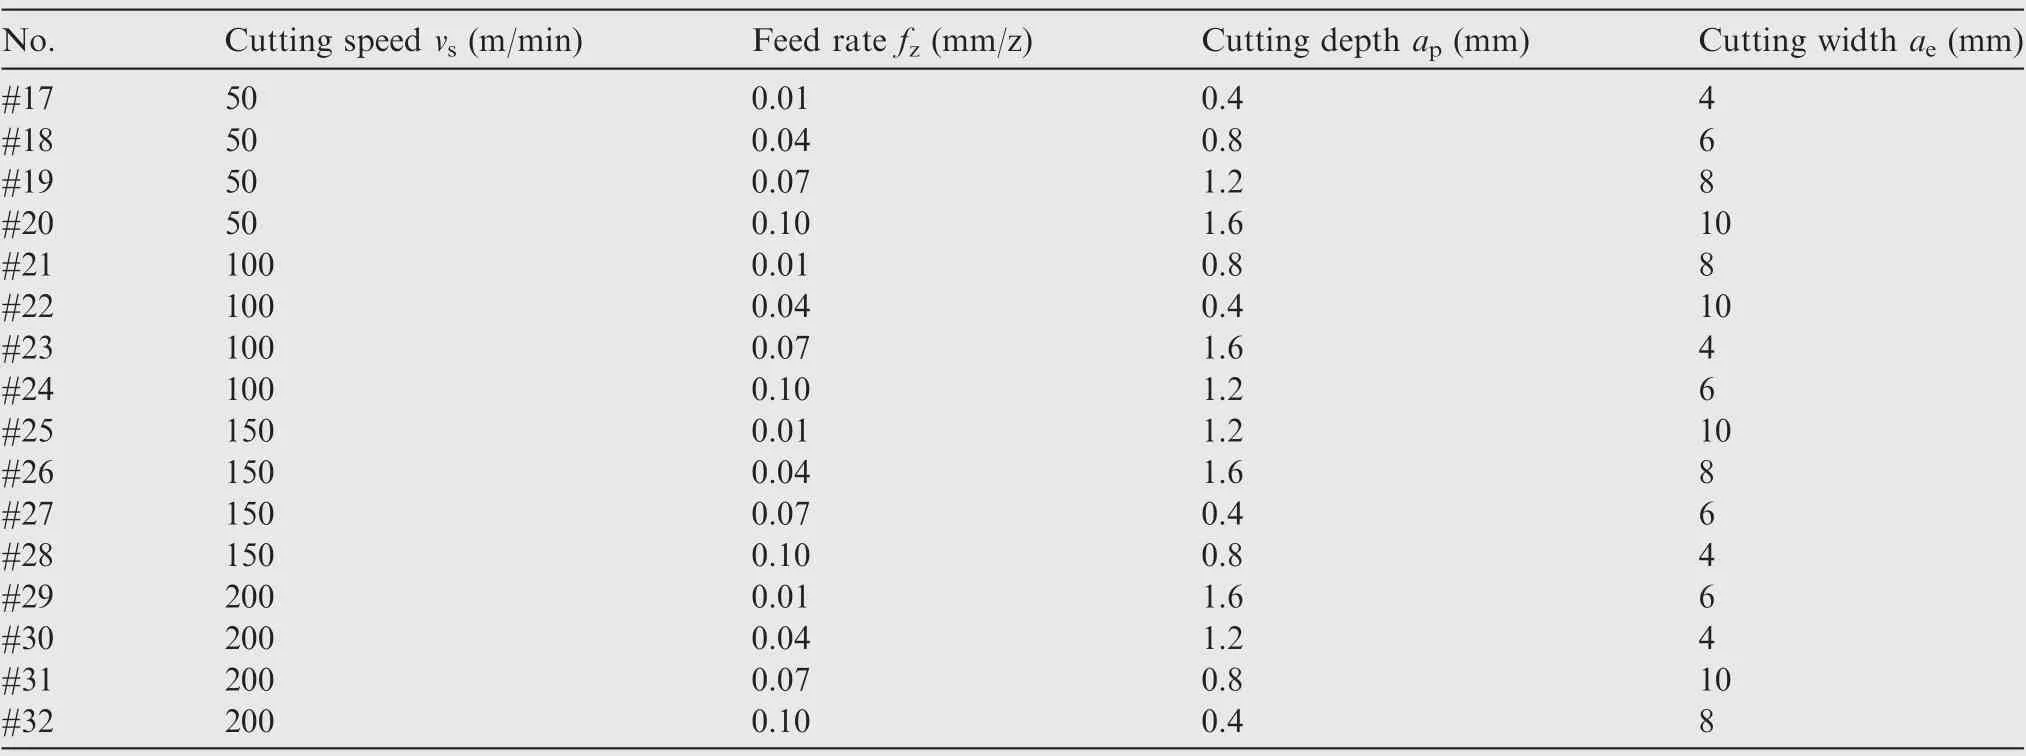
Table 6 Cutting parameters for orthogonal milling tests.
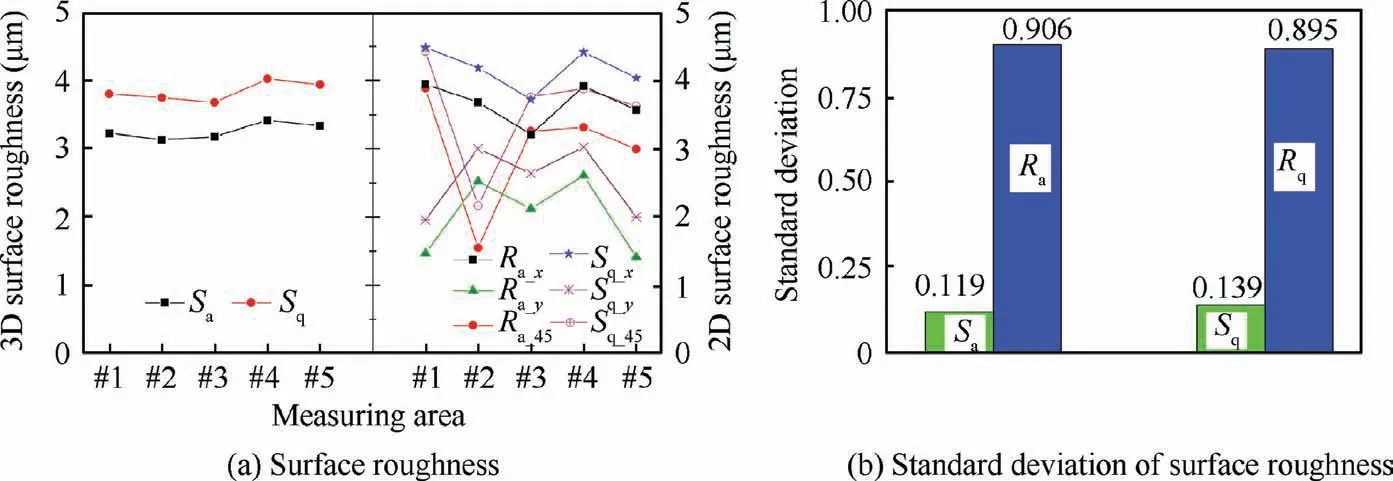
Fig. 5 Results of 2D and 3D surface roughness of five measured areas.

Table 7 Results of 2D and 3D surface roughness (μm).

Table 8 Standard deviation of surface roughness results of all five measured areas.

Fig. 6 Analysis of 2D surface roughness of five measured areas.
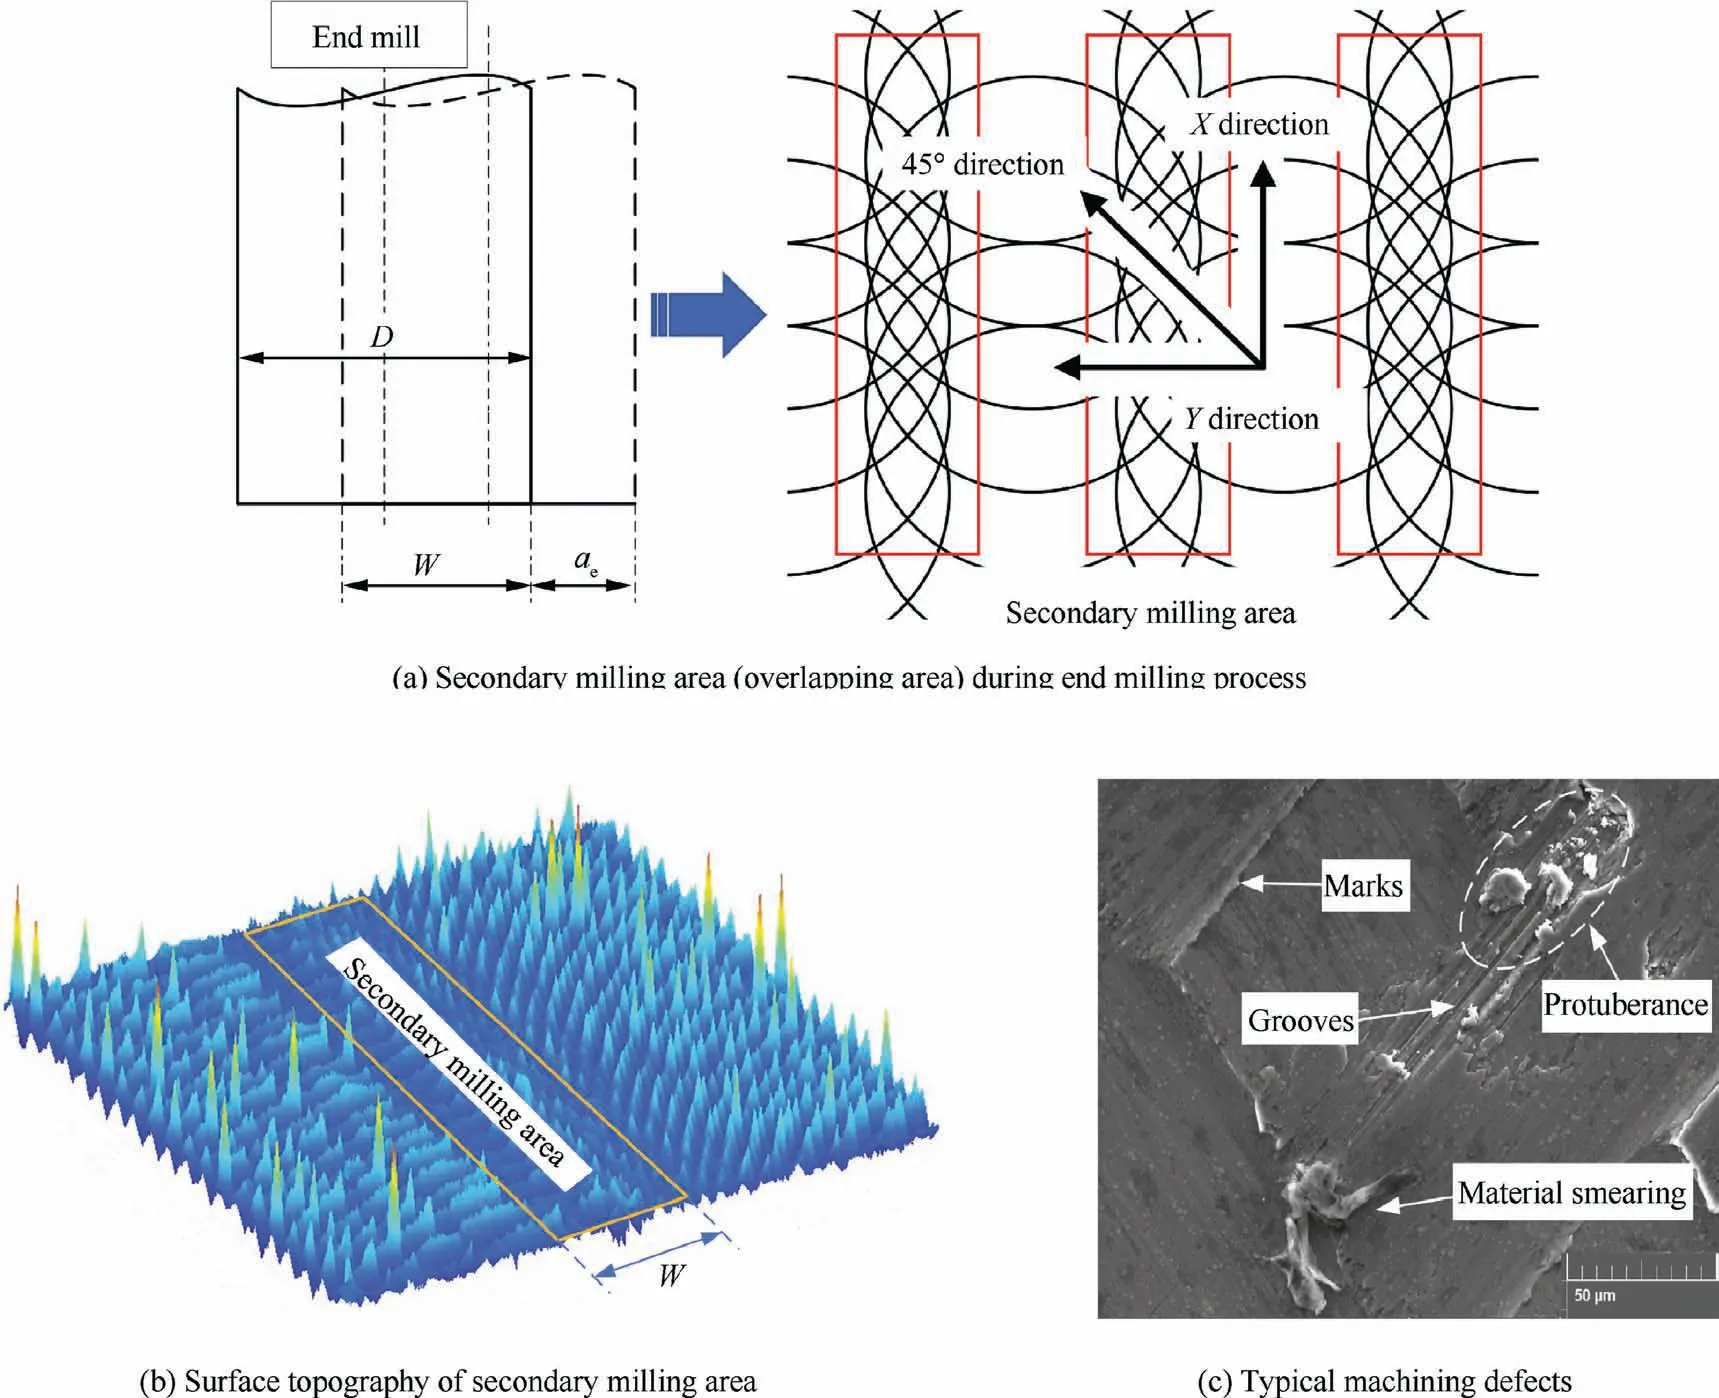
Fig. 7 Surface profile of in-situ TiB2/7050Al MMCs.
A relationship between the 3D surface roughness and cutting parameters is established as Eq. (7) and (8). The analysis of variance (ANOVA) results of Eqs. (7) and (8) are listed in Tables 9 and 10 respectively.

For further analyzing the influence of cutting parameters,the relative sensitivity of cutting parameters on 3D surface roughness is shown in Fig. 10. It is obvious to us that cutting depth and feed rate has the highest effect on the 3D roughness.And among all parameters, the effect of cutting speed on 3D roughness is the minimal. In order to obtain a smoother machined surface, much more attention should be paid on the feed rate and cutting depth.
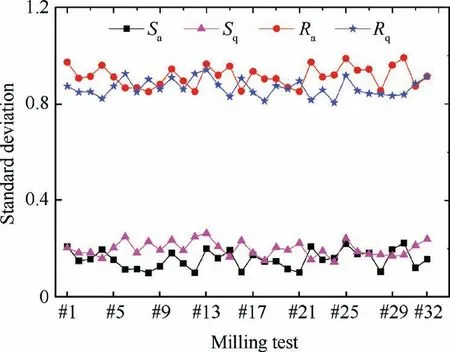
Fig. 8 Standard deviation results of 2D and 3D surface roughness of all milling tests.
3.2. Residual stress of machined surface and subsurface
The residual stress of machined surface is presented in Fig. 11 with the resultant cutting force and machined surface cutting temperature. It can be seen that the surface residual stress of in-situ TiB/7050Al MMCs was all compressive stress, which ranged from -90 MPa to -180 MPa. With cutting speed or depth increasing, the compressive residual stress decreased accordingly. While as feed rate or cutting width increased,the compressive residual stress decreased slightly as shown in Fig.11(b)and(d). Besides, it could also be found that surface residual stress shares a similar tendency with cutting temperature as cutting parameter increased, which indicated that cutting temperature had a dominant effect on the surface residual stress. In Fig. 11(b) and (d), the cutting temperature basically kept lower than 270°C while the compressive residual stress decreased slightly with feed rate, cutting width and temperature increasing.But in Fig.11(a)and(c)which the cutting temperature mostly was higher than 270°C,the compressive residual stress decreased sharply and showed a strong tendency to transform into tensile residual stress. In addition,with temperature exceeding 270°C, there showed no obvious sign in reducing the tendency to transform into tensile stress no matter the cutting force decreased or increased as presented in Fig. 11(a) and (c). And in Fig. 11(b) and (d), the surface residual stress kept a large compressive stress with cutting force increased under 270°C. This is because that around 270°C, the in-situ TiB/7050Al MMCs began to be softened by high cutting temperature, which could be found and concluded from our previous study.Based on this, the effect of plastic deformation under cutting force on compressive residual stress decreased with soften proceeding or temperature increasing. While under 270°C, it still seems difficult for the matrix material to be softened and the plastic deformation kept a large compressive residual stress.
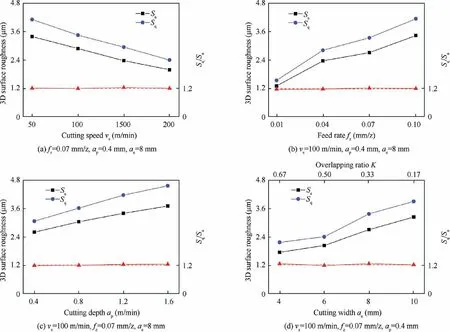
Fig. 9 Influence of cutting parameters on 3D surface roughness.

Table 9 ANOVA results of Eq. (7).

Table 10 ANOVA results of Eq. (8).

Fig. 10 Relative sensitivity of cutting parameters on 3D surface roughness.
Thus, from analysis above, it could be concluded that cutting temperature has a significant influence on surface residual stress with a strong tendency to transform into tensile stress.However,the cutting force still keeps a significant influence on stabilizing the compressive stress just under 270°C.In order to produce compressive residual stress for longer service life, the cutting temperature during milling in-situ TiB/7050Al MMCs should not be much higher than 270°C.
To investigate the subsurface residual stress, 12 groups of specimens were selected among all 32 group experiments as listed in Table 11 with marking selection standard. The detailed subsurface residual stress of Table 11 is presented in Fig. 12.
It can be seen from Fig.12 that the compressive subsurface residual stress decreased exponentially along the distance to the machined surface.The depth of compressive residual stress layer ranges from 40 to 70 μm.And a relationship between surface residual stress σ and cutting parameters is built as Eq.(9)with the ANOVA results listed in Table 12:

3.3. Fatigue property
Fig.13 presents the relationship between fatigue life Nand 3D surface roughness S. With roughness Sincreasing, the machined surface became increasing unsmooth with more and more peaks and valleys in the surface, where would produce surface stress concentration. As a result, the fatigue life of milling in-situ TiB/7050Al MMCs decreased with Sincreasing. Besides, the fatigue life could keep longer than 1.0×10with Ssmaller than 3.0 μm.A fatigue life prediction model based on the 3D surface roughness Sis presented as following and the ANOVA results of Eq. (10) is listed in Table 13.

For further analyzing the fatigue property of in-situ TiB/7050Al MMCs, the fracture surface of fatigue specimens was investigated. Fig. 14 showed the typical fracture surface topography of fatigue specimens.
As shown in Fig.14(a),three zones:fatigue source region/-fatigue crack initiation site (Region I); crack propagation region (Region II); fast fracture region (Region III) could be obviously observed in the fracture surface. The fatigue source region generated in the machined surface and the fracture directions could also be clearly observed as marked red in Fig. 14(a). Besides, it was found that the crack propagation region was basically a plane and large, which indicated that the crack propagation speed was large and the ductility of in-situ TiB/7050Al MMCs was reduced with existence of particles. In Fig. 14(b), the fatigue striations such as shellfish and river veins, which resulted from plastic deformation, could be clearly observed. But the large space between striations still states that the brittle fracture was the main fracture mechanism.
Fig. 15 shows some fatigue dimples in the fracture surface.Due to small particles, the ductility of in-situ TiB/7050Al MMCs was reduced in some degree. However, with over 90% aluminum in the matrix material, it also showed a few ductile fracture features during cyclic loading process. From analysis above,it could be noted that the fracture mechanisms of in-situ TiB/7050Al MMCs was mainly brittle fracture with a few ductile fracture features.
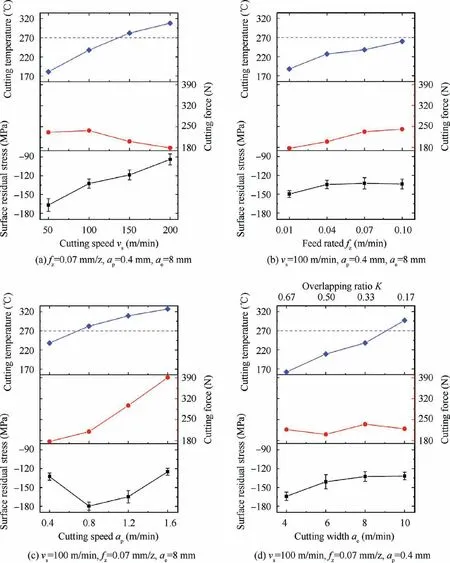
Fig. 11 Influence of cutting parameters on surface residual stress.

Table 11 Cutting parameters of selected specimens for subsurface residual stress analysis.
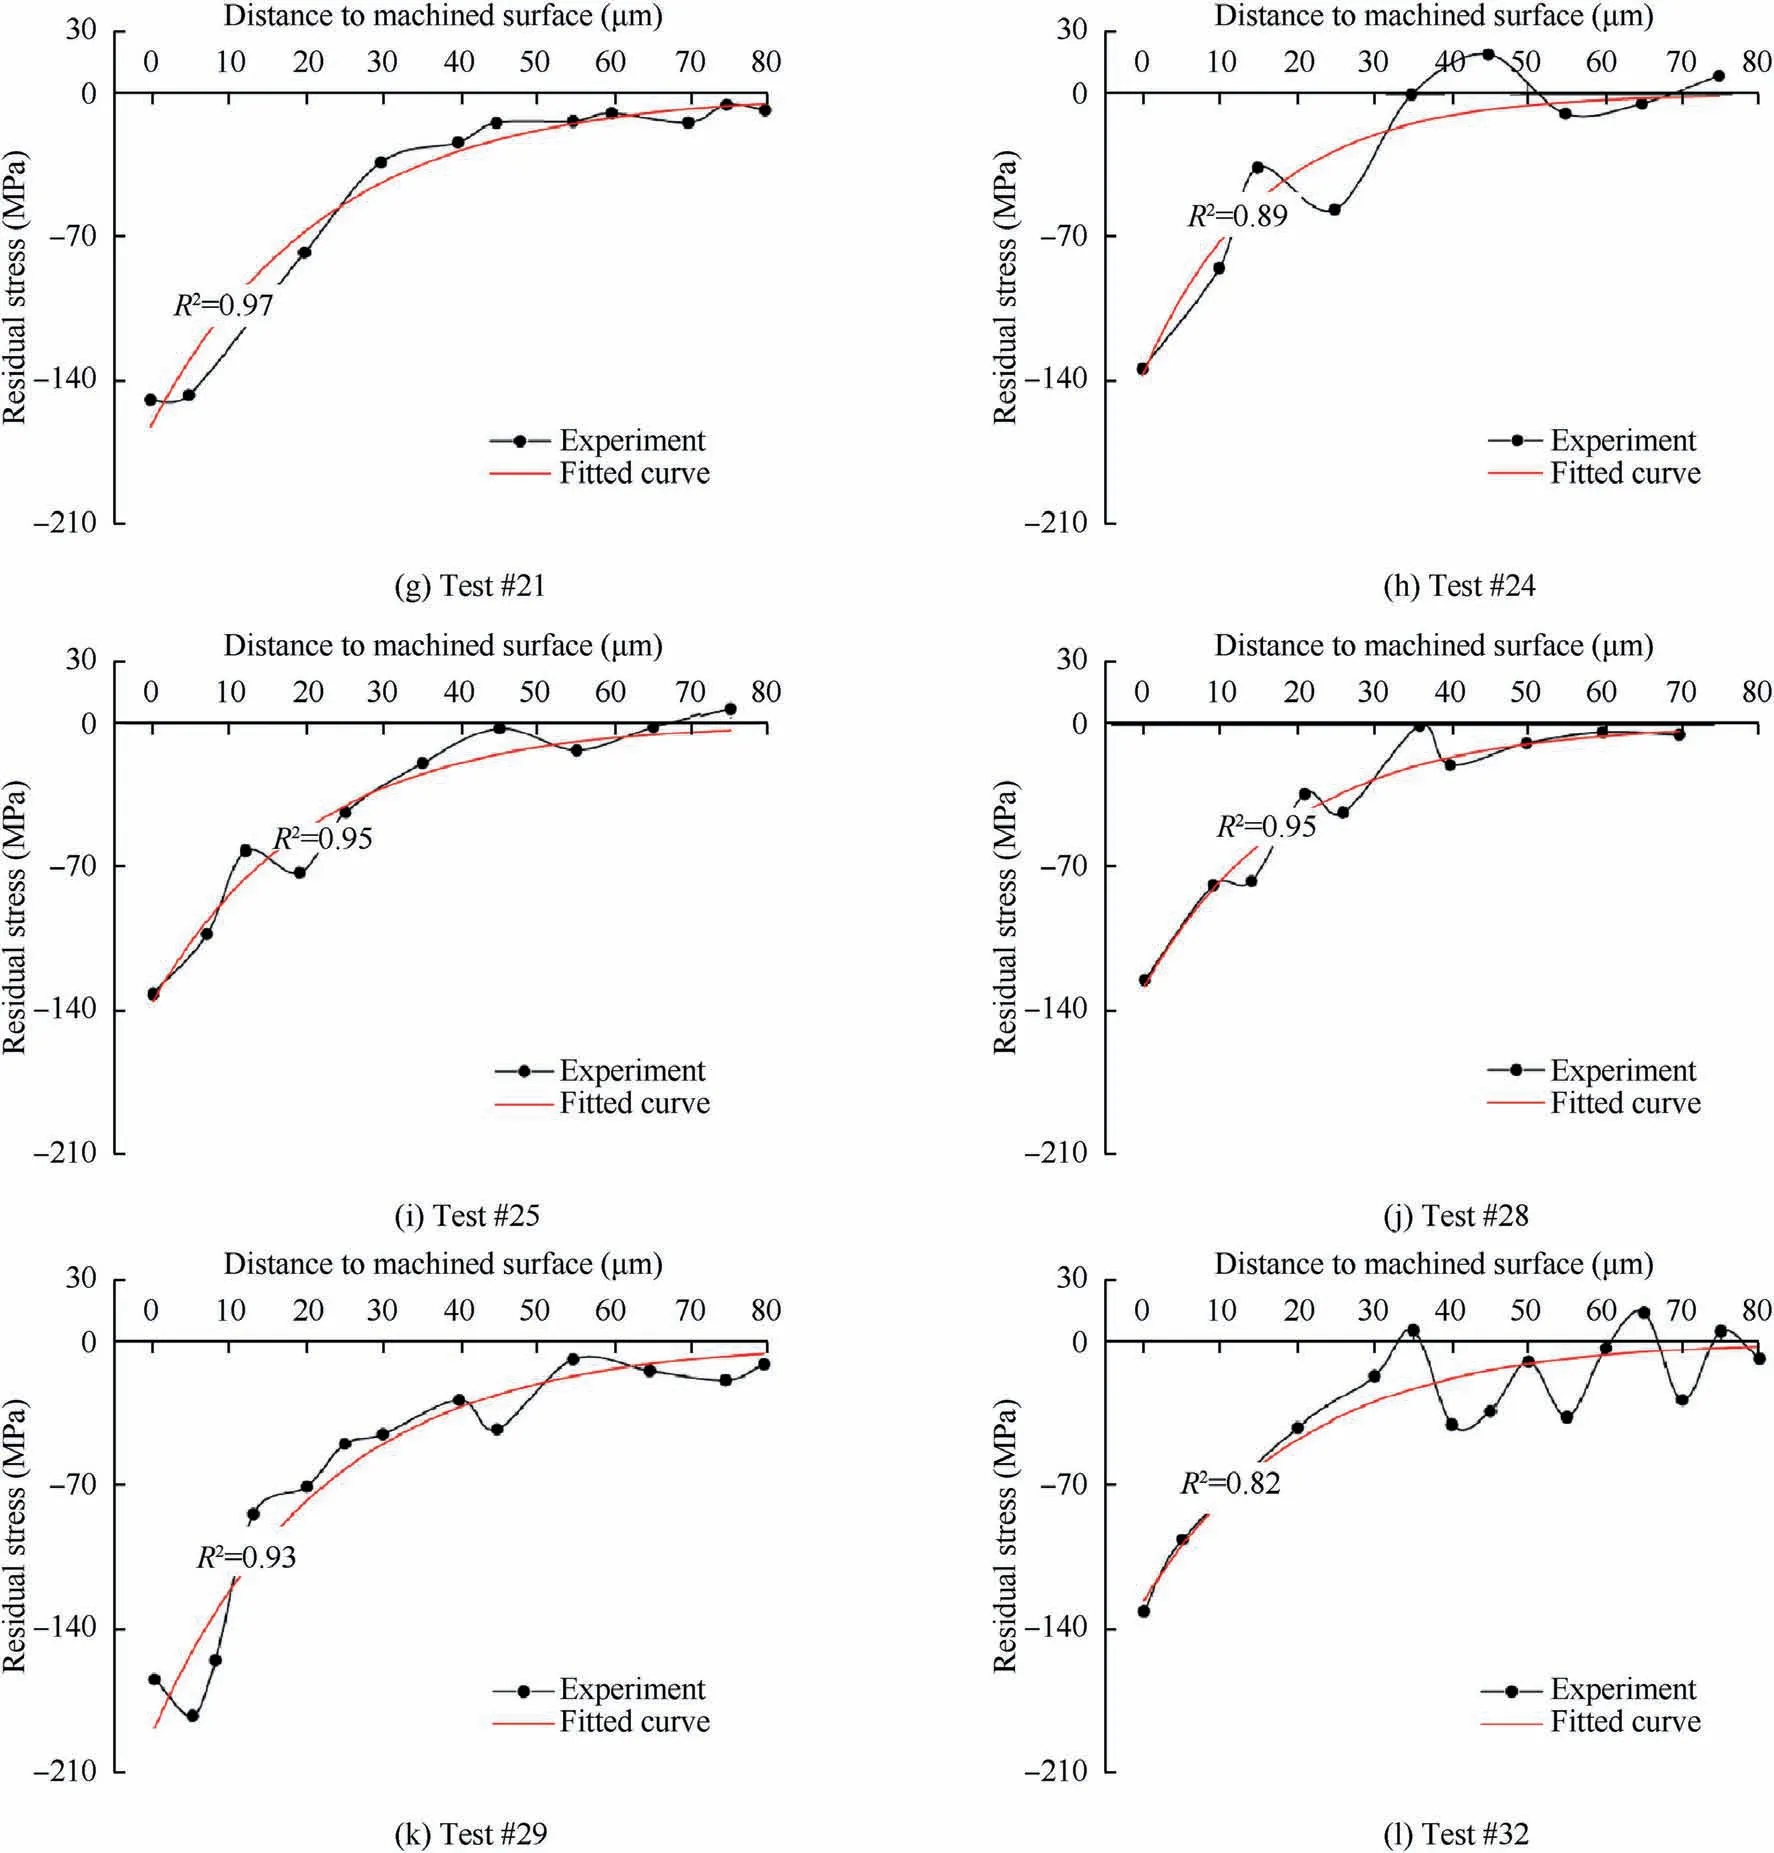
Fig. 12 Subsurface residual stress.
4. Conclusions
In this study, the 2D and 3D surface roughness, surface and subsurface residual stress, fatigue property of end milling insitu TiB/7050Al MMCs was fully investigated. Based on the results and analysis, following conclusions can be drawn:
(1) It was found that the measuring location, direction and machining defects would have a significant influence on the 2D surface roughness. From comparative analysis and standard deviation results,it is appropriate to apply 3D surface roughness to represent and describe the machined surface profile for milling in-situ TiB/7050Al MMCs.
(2) The influence of cutting parameters and secondary milling area on 3D surface roughness was investigated.It was found that Sand Sshowed a similar tendency with cutting parameters increasing. The 3D surface roughness was sensitive to the change of feed rate and cutting depth. With cutting speed or overlapping ratio increased, 3D surface roughness decreased accordingly while it increased as feed rate or cutting depth increased.
(3) The machined surface residual stress of milling in-situ TiB/7050Al MMCs was compressive stress. As cutting speed or cutting depth increased, the compressive surface residual stress deceased sharply. However, it decreased slightly with feed rate or cutting width increased.In subsurface,with depth increasing,the subsurface residual stress decreased exponentially. The depth of compressive residual stress layer was about 40-70 μm.

Table 12 ANOVA results of Eq. (9).
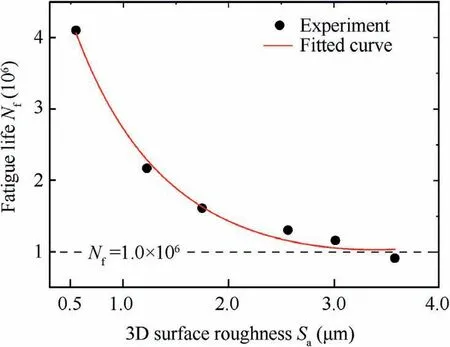
Fig. 13 Relationship between fatigue life Nf and Sa.
(4) The cutting temperature has a significant influence on surface residual stress with a strong tendency to transform into tensile stress. However, the cutting force still keeps a vital effect on stabilizing the compressive stress just under 270°C. To produce compressive residual stress for longer service life,the cutting temperature during milling in-situ TiB/7050Al MMCs should not be much higher than 270°C.
(5) The fatigue life of in-situ TiB/7050Al MMCs was longer than 1.0×10with Ssmaller than 3.0 μm. As Sincreased,the fatigue life decreased and a fatigue life prediction model for milling in-situ TiB/7050Al MMCs based on 3D surface roughness was established as below:


Table 13 ANOVA results of Eq. (10).
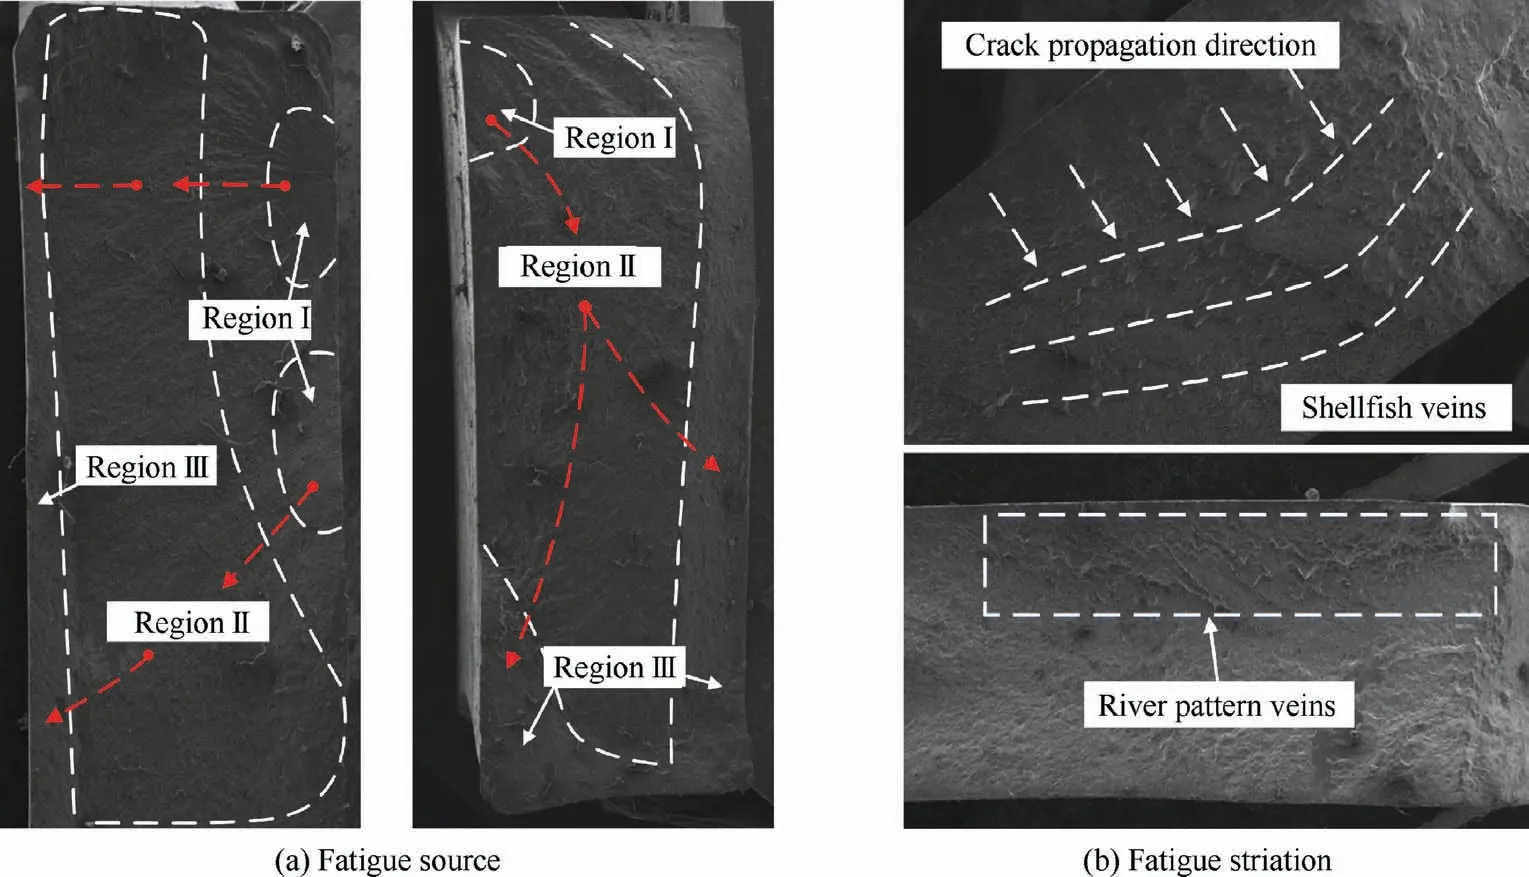
Fig. 14 Fracture surface topography.
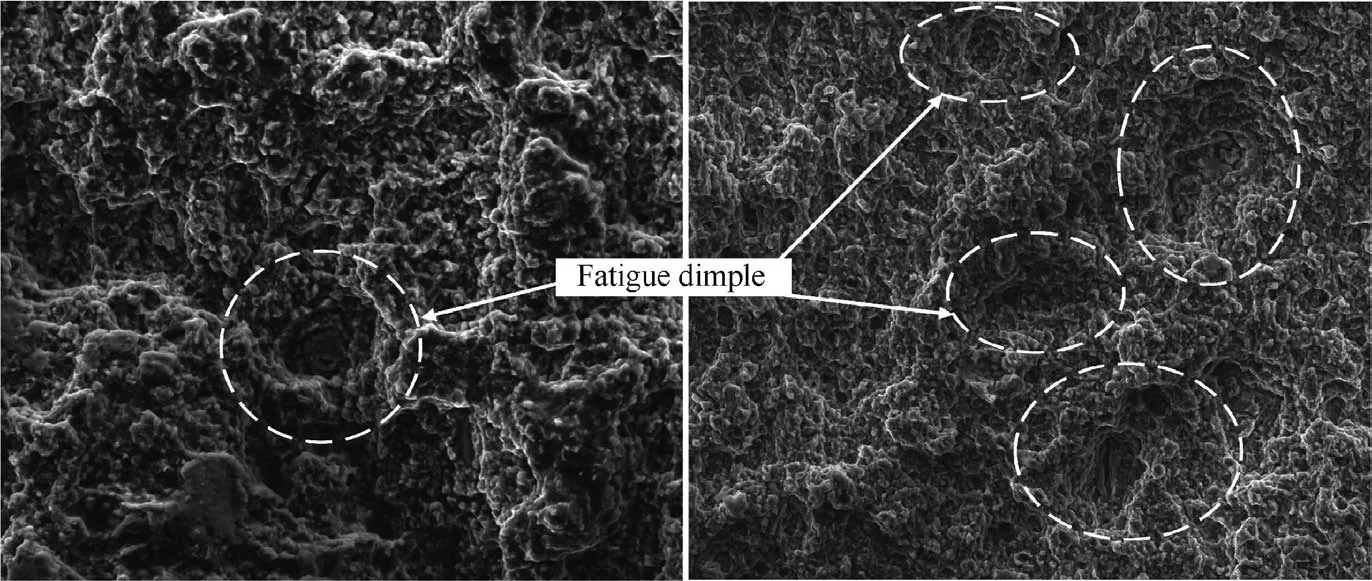
Fig. 15 Fatigue dimple.
From analysis, the fracture mechanisms of in-situ TiB/7050Al MMCs was found to be mainly brittle fracture with a few ductile fracture features.
Declaration of Competing Interest
The authors declare that they have no known competing financial interests or personal relationships that could have appeared to influence the work reported in this paper.
Acknowledgement
sThis study was co-supported by National Natural Science Foundation of China (No. 51775443), National Science and Technology Major Project of China (No. 2017-VII-0015-0111).
 CHINESE JOURNAL OF AERONAUTICS2021年4期
- CHINESE JOURNAL OF AERONAUTICS的其它文章
- Time delay compensation in lateral-directional flight control systems at high angles of attack
- Dual stability enhancement mechanisms of axial-slot casing treatment in a high-speed mixed-flow compressor with various tip clearances
- Development cost prediction of general aviation aircraft using combined estimation technique
- Improvement on shaped-hole film cooling effectiveness by integrating upstream sand-dune-shaped ramps
- Modeling and parameter identification of linear time-varying systems based on adaptive chirplet transform under random excitation
- An experimental method to obtain the hard alpha anomaly distribution for titanium alloy aeroengine disks
