A forced ignition probability analysis method using kernel formation analysis with turbulent transport and Lagrangian flame particle tracking
Qing XIE, Zhuyin REN,b,*, K WANG, Hongjun LIN, Shoutng SHANG,Wi XIAO
a School of Aerospace Engineering, Tsinghua University, Beijing 100084, China
b Institute for Aero Engine, Tsinghua University, Beijing 100084, China
c Aero Engine Academy of China, Beijing 101300, China
d AECC Shenyang Engine Research Institute, Shenyang 110000, China
e AECC Hunan Aviation Powerplant Research Institute, Zhuzhou 412000, China
KEYWORDS Bluff-body stabilized flame;Igniting process;Ignition criterion;Ignition probability;Lagrangian particle tracking
Abstract A forced ignition probability analysis method is developed for turbulent combustion, in which kernel formation is analyzed with local kernel formation criteria,and flame propagation and stabilization are simulated with Lagrangian flame particle tracking.For kernel formation,the effect of turbulent scalar transport on flammability is modelled through the incorporation of turbulenceinduced diffusion in a spherically outwardly propagating flame kernel model. The dependence of flammability limits on turbulent intensities is tabulated and serves as the flammability criterion for kernel formation.For Lagrangian flame particle tracking,flame particles are tracked in a structured grid with flow fields being interpolated from a Computational Fluid Dynamics (CFD) solution. The particle velocity follows a Langevin model consisting of a linear drift and an isotropic diffusion term. The Karlovitz number is employed for the extinction criterion, which compares chemical and turbulent timescales. The integration of the above two-step analysis approach with non-reacting CFD is achieved through a general interpolation interface suitable for general unstructured CFD grids. The method is demonstrated for a methane/air bluff-body flame, in which flow and fuel/air mixing characteristics are extracted from a non-reacting simulation.Results show that the computed ignition probability map agrees qualitatively with experimental results. A reduction of the ignition probability in the recirculation zone and a high ignition probability on the shear layer of the recirculation zone near the mean stoichiometric surface are well captured. The tools can facilitate optimization of spark placement and offer insights into ignition processes.
1. Introduction
The development of advanced low-emission gas turbine combustors such as those in aero-engines demands more careful design of ignition devices and their placement in a combustion chamber to ensure reliable ignition or relighting in case of flame blow-out particularly at high altitudes. For a successful forced ignition with electric sparks in gas turbines,four stages,i.e.,(A)energy deposition,(B)formation of a viable flame kernel, (C) flame kernel growth and flame propagation, and (D)flame stabilization, can be generally identified.The forced ignition process in laboratory turbulent flames and gas turbine combustors has been extensively studied experimentallyand numerically,showing that the forced ignition process is highly transient in nature and is intrinsically stochastic. Various factors can affect the development of spark kernels from the moment of energy deposition until the complete flame establishment. The most favorable ignition spots are influenced not only by the local equivalence ratio, but also by the time history of velocity fluctuations. The establishment of an ignition probability map for practical combustors by experimental means is practically challenging and expensive.
Unsteady three-dimensional simulations, especially Large Eddy Simulations (LES), are promising to shed lights on the transient ignition process. Simulations have been performed to explore various aspects of the behavior of a flame kernel and the subsequent flame evolution with gaseous fuelsand liquid fuels.For example,LES has been performed to study the transient ignition process in laboratory flames such as methane/air bluff-body flamesand jet flames.The ignition sequence has been studied in the full annular combustion chamber of a gas turbine by means of massively parallel LES.However, LES is very expensive if the ignition probability is to be calculated for every possible spark location.
Instead, local ignition criteria and reduced models have been developed for different stages of the ignition process.In conjunction with (unsteady) nonreacting simulations for the prediction of flow and mixing characteristics, the ignition probability map could be computed.For example,criteria that consider flammability, energy discharge, flame kernel growth,wall quenching, and upstream flame propagation respectively have been employed to compute the ignition probability map of a turbulent two-phase flame.The flame propagation criterion is to check if flame stabilization can be achieved by comparing the local flame speed and velocity. Neophytou et al.proposed a two-stage approach in which the criteria of flammability, energy discharge, etc. are employed to compute the probability for the kernel formation stage, and a Lagrangian particle tracking method is employed for flame propagation and stabilization in which flame particles are tracked throughout the flow domain. The local Karlovitz number is computed to check if flame particles can ignite the regions they pass through. With this two-stage approach, they studied the ignition process of a methane/air bluff-body flame, with the flow and fuel/air mixing information being extracted from a nonreacting LES.For both aforementioned approaches,the flammability criteria for kernel formation do not account for the effects of turbulent transport,which may not be appropriate at highly turbulent conditions since turbulent transport may inhibit the formation of a viable flame kernel before the stage of flame propagation.
In this study,following previous works,a forced ignition probability analysis method using kernel formation analysis with turbulent transport and Lagrangian flame particle tracking is proposed. The major contributions are flammability criteria accounting for turbulent transport,an improved estimate of the ignition temperature in the energy discharge criterion,and a general data interpolation interface for CFD simulations with unstructured grids.
In the following,reduced models and their integration with nonreacting CFD simulations for ignition probability prediction are firstly described in Section 2,followed by a demonstration of ignition map predication in a methane/air bluff-body flame in Section 3. Conclusions are drawn in Section 4.
2. Methodology
In this section, the criterion for kernel formation is reviewed with a focus on a Reduced-Order Model (ROM) with turbulent transport for flammability prediction. A Lagrangian particle tracking method is then introduced together with a local Karlovitz number criterion for modelling flame propagation and stabilization. Finally, the integrated CFD-ROM platform is described for computing the ignition probability map.
2.1. Kernel formation probability analysis
The following three criteriafor kernel formation, suitable for two-phase flows with liquid fuel,are employed.The first one is that the equivalence ratio must be within the flammability limits, i.e.,

where φand φare the lean and rich flammability limits,respectively, and they are in general flow-dependent. In this study,a one-dimensional kernel formation model,as described in Section 2.2, is employed to account for the effects of turbulent transport on flammability limits. For the ignition process in a two-phase flow,the available fuel is the fuel vapor and the fuel droplet that will evaporate at the spark location.As a consequence, the flammability of the mixture is evaluated by the total (gas+liquid) equivalence ratio.
The second criterionis that the energy deposit Emust at least increase the unburnt temperature Tof the gas mixture to its ignition temperature Tand bring the temperature of the cold liquid fuel Tto its saturation temperature T, i.e.,

where αis the volume fraction of the liquid,nis the number of space dimensions (2D vs. 3D), Nu is the Nusselt number,dis the size of the flame kernel,dis the diameter of the fuel droplet, ρ and ρare the gas and liquid densities, respectively,and Cand Care the specific heat of the gas and the liquid,respectively.Note that,with d=0 and α=0,Eq.(2)provides the gaseous limit of the criterion, i.e., the minimum ignition energy density for a gaseous mixture.The ignition temperature Tof the gas mixture depends on the equivalence ratio. In this study, as shown in Fig. 1, the ignition temperature is tabulated as a function of the equivalence ratio from the homogeneous auto-ignition process of premixed fuel/air mixtures at standard atmosphere (p=1 atm=101325 Pa). It is defined as the minimum initial temperature so that the corresponding ignition delay time is shorter than the representative ignition timescale in gas turbine combustors.In this study,this characteristic time is specified as 1 ms.
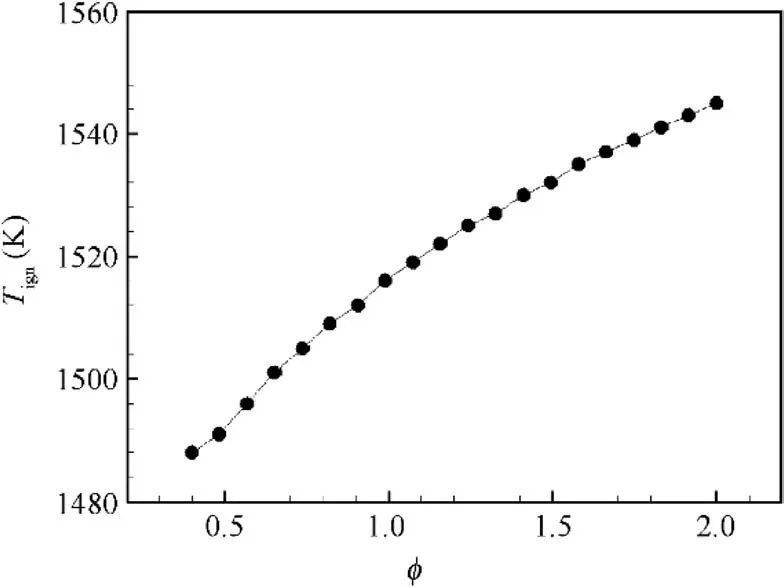
Fig.1 Computed ignition temperature of a methane/air mixture at p=1 atm.
To sustain the flame kernel and ensure that it can grow,the third criterion requires that the thermal diffusion to the surrounding gas must be slower than liquid fuel vaporization,i.e.,

As shown,Eq.(3)assumes that the combustion characteristic time is much shorter than tand t,and it is equivalent to

where Bis the mass Spalding number and Sh is the Sherwood number. This compares the kernel size dto the droplet size d.If the kernel size is too small compared to the droplet diameter, then heat diffusion is too fast compared to evaporation,and the flame cannot survive.
With the above three criteria for flame kernel formation,the probability map of kernel formation in turbulent flames can be computed through the following three steps. Firstly,with the mean mixture fraction and its variance being extracted from a non-reacting simulation, a beta probability density distribution function is used to generate many realizations of fuel/air mixtures for each location,which is 100 in this work. Then, the criteria are applied for individual samples at each location of the nonreacting flow. Finally, the percentage of events satisfying the criteria for successful kernel formation is counted to form the probability map of kernel formation.
2.2. Flammability limits accounting for turbulent transport
The following one-dimensional model with zone-dependent turbulent transportis employed to compute the flammability limits:


The turbulent diffusivity,D,which represents small-scale turbulence-induced diffusion during the flame kernel formation,is modelled using the idea of residual eddy viscosity,i.e.,

where Cis a model constant, and uand lare the turbulent fluctuation velocity and turbulence integral lengthscale that can be extracted from CFD simulations. Note that Δ is a zone-dependent characteristic lengthscale with the spherical flame structure being divided into a post-flame zone,a reaction zone, a preheat zone, and an unburnt zone, respectively. For turbulent flames in the thin reaction zone’s regime, turbulence has no direct impact on the reaction zone, and the associated turbulent diffusivity is zero in this zone. For the preheat and post-flame zones,the transport effect of turbulence eddies with sizes being comparable to or smaller than the corresponding zone thickness is modelled using Eq. (8) with individual characteristic lengthscales.For the unburnt zone,modeling for turbulent diffusivity is inessential since there is no scalar gradient in this zone.
In this study,the flame structure is parameterized based on the progress variable c, which is defined based on the fraction of carbon in species CO and COover that in all the carboncontaining species. The model parameters and boundaries between different zones have been calibrated using outwardly propagating ethylene/air flames under different turbulent intensities carried out in a constant-pressure spherical flame apparatus.
Numerically,Eqs.(5)-(7)are solved using an operator splitting scheme,which advances the system through sequential transport and reaction sub-steps. For each individual timestep, firstly only the transport processes are advanced for one time-step by solving the following equations using finite difference methods:


The spatial derivatives are discretized by second-order central difference, and temporal terms are discretized by the firstorder backward Euler method.During this transport sub-step,the velocity uis assumed constant. The species compositions and temperature are updated, so is the density with the given constant pressure. The chemical process is then advanced by integrating the following Ordinary Differential Equations(ODEs) for one time-step:

In this study, the In-Situ Adaptive Tabulation(ISAT)method is employed to accelerate chemistry integration. During the reaction sub-step, the species compositions, temperature, and density are updated. Lastly, the velocity uis updated using the updated density and Eq. (5) with the same discretization methods used for Eqs. (9) and (10).
2.3. Lagrangian flame particle tracking
Flame particle tracking is employed to analyze the flame propagation and stabilization process after successful kernel formation.Particles are tracked in a Cartesian grid with the solution fields being interpolated from a nonreacting CFD simulation as described in Section 2.4.The evolutions of flame particle locations and velocities are given by

where Xis the flame particle location, Uis the particle velocity in direction i,Uis the local mean velocity of the flow,Nis a normally distributed random variable with a zero mean and a unity variance,ωis the turbulent frequency which is related to the turbulent kinetic energy kand the dissipate rate εat the particle location through ω=ε/k, and Cis the model constant taken to be 2.0. Note that the velocity follows the simplified Langevin model consisting of a linear drift towards the local mean velocity and an added isotropic diffusion term.The random variable Nis different for each particle. As pointed out,a flame particle can represent a flame element if the flame propagation by molecular diffusion is small compared to turbulent dispersion,and neglecting propagation relative to the fluid for the movement of the flame particle is valid if the flame propagation speed is much lower than the turbulent fluctuating velocity.
During particle tracking, the flame particle exchanges the mass with the local cell through

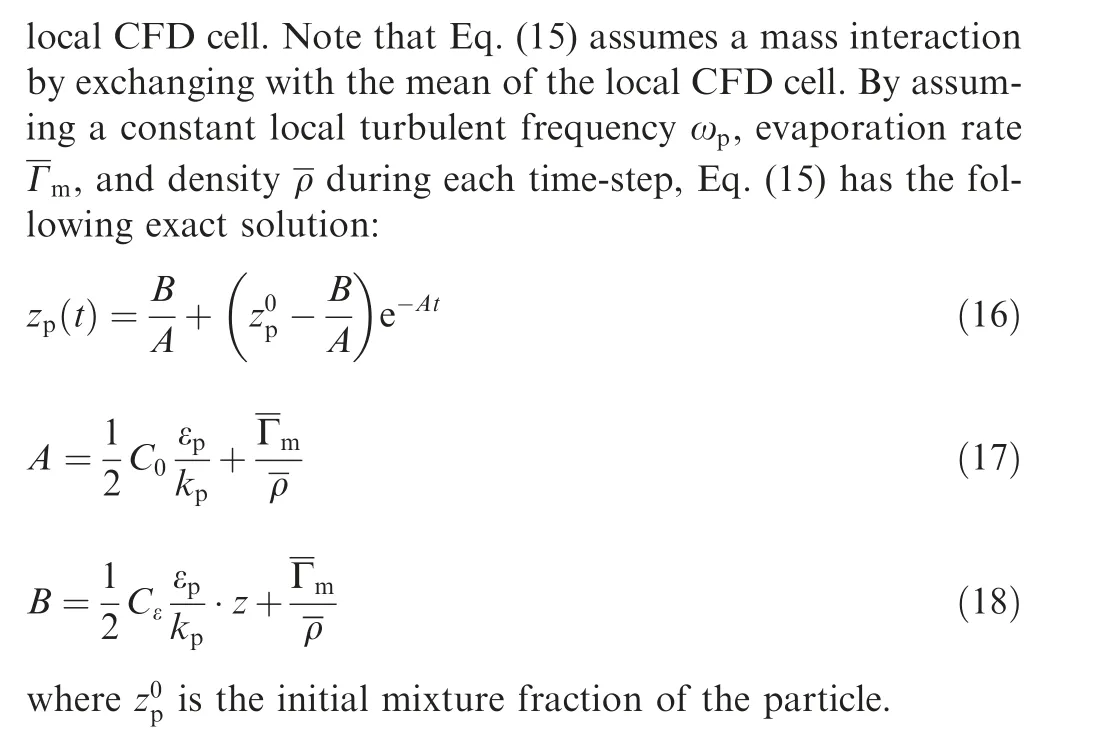
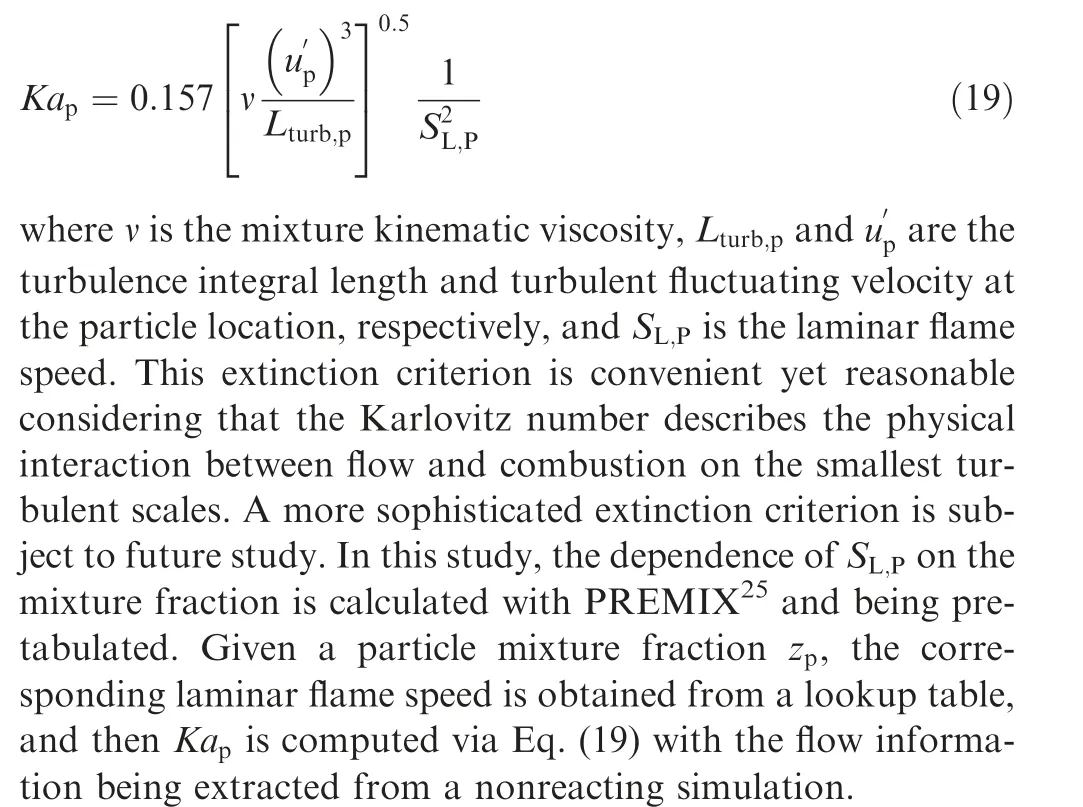
At the end of each time step,a criterion based on a Karlovitz number is used to assess if the flame particle extinguishes. A Karlovitz number Kais defined for each particle and compared to a critical value Ka.If Ka>Ka,the particle extinguishes.The Karlovitz number Kais defined as the ratio between the chemical timescale and the Kolmogorov timescale:
In the implementation, a tracking domain with structured grid cells is pre-specified, with the nonreacting CFD results being interpolated to this structured grid as detailed in Section 2.4.Flame particles are initially released from the ignition region.Their mixture fractions are drawn from a beta distribution given the mean and variance of the mixture fraction being extracted from the local cells,and their velocities are initialized from Gaussian distributions given the mean velocities and fluctuation velocities being exacted from the local cells.Once the flame particles are released from the ignition region,the flame particles are tracked through the following procedures:
Step 1. The cells in the structured grid have one of two states: unburnt or burnt. Initially, all cells are in the unburnt state. All grid cells that overlap with the spark volume are switched to the burnt state,and each of them releases a‘‘flame particle’’.
Step 2.A flame particle is tracked with the Langevin model in Eqs. (13)-(18), with the necessary CFD flow and mixture fraction information being linearly interpolated to the particle location.The velocity and position of particles are updated via Eqs. (14) and (13), respectively, and the flame particle composition is updated via Eq. (16). During its evolution, a flame particle could extinguish according to the Karlovitz number criterion, i.e., Eq. (19). When a particle extinguishes,it is no longer tracked.
Step 3.Every time a particle visits a grid cell in an unburnt state,the grid cell switches to a burnt state,and a new particle,with its own random velocity and mixture fraction being sampled from the local velocity and mixture fraction distributions,emits at the cell center and follows its own random walk. For each ignitor location, once all the active flame particles being tracked, the statuses of cells, e.g., burnt and unburnt, can be summarized. The Ignition Progress Factor (IPF),π, defined as the fraction of cells in a burnt state for a prescribed domain of interest, can be obtained to represent the likelihood of successful ignition. If the IPF is larger than a critical threshold IPF π, the ignition event is declared to be successful.
Step 4. For each spark location, many repetitions of flame particle tracking with different realizations are performed to obtain the successful ignition probability.In this study,60 repetitions for each spark location are performed. By repeating the process for different spark locations, maps of mean and variance of the ignition progress factor and ignition probability can be obtained.
2.4. Integrated CFD-ROM platform with a general data interpolation interface
The general data interpolation interface is based on the binary data format of Tecplot 360that admits generic structured and unstructured cells such as hexahedron,tetrahedron,triangular prism,pyramid,and their hybrids.Firstly,the original unstructured data from nonreacting CFD results is tabulated node by node using a k-dimensional tree.Then,the data is interpolated to user-specified structured cells.The interpolation is achieved through weighted averaging using the reciprocal distances between a target cell and its surrounding unstructured nodes.The surrounding unstructured nodes of the target cell are located using the n-nearest algorithm of the k-dimensional tree.
For a general flow configuration, the user-specified structured mesh is allowed to cover both the flow region and the region occupied by irregularly shaped solid parts of the combustor. One only needs to specify the spatial ranges and resolutions of the Cartesian coordinates of the tracking domain.Cells that locate outside the flow region will be tagged, and flame particles that enter these cells will no longer be tracked.
For particle tracking procedures, all the boundaries of the user-specified structured mesh are set to be ‘‘escape”, regardless of the physical boundary conditions.That is,once a flame particle moves out of the tracking domain, it is no longer tracked. To monitor how much volume of the combustor is ignited,the ratio of the number of burnt cells to the total number of cells in a prescribed domain of interest is calculated at each time step during the particle tracking process. This ratio is termed as the Ignition Progress Factor (IPF).
In this study,the domain of interest covers the central recirculation zone and the stoichiometric region, which is achieved by the following criteria: a rectangular box that is sufficiently large to encapsulate the recirculation and stoichiometric isosurface, a threshold for the velocity magnitude that aims to cover the recirculation zone, and a range of mixture fractions that aims to cover the stoichiometric region.
3. Results and discussion
3.1.Methane/air bluff-body flame:Configuration and numerical settings
In this study, the proposed method is demonstrated in a methane/air bluff-body flame.A steady-state Reynolds-Averaged Navier-Stokes (RANS) simulation of Case B in experimentshas been performed using the commercial software ANSYS Fluent, with the standard k-ε turbulence model and the partially premixed combustion model (with chemical reactions being turned off) being used to predict the flow and mixing fields. Specifically, the transport equations for the mixture fraction and its variance are solved to compute the fuel/air mixing fields. The mean and variance of the mixture fraction are needed for generation of realizations in conjunction with the beta Probability Density Function (PDF)for computing the kernel formation probability.The computational domain is sketched in Fig. 2(a). It is meshed with a structured grid of 6.28 million cells. The grid is refined in the recirculation zone with a resolution of 0.5 mm. The upstream part of the pipe is set to be the velocity inlet of air, with the inlet velocity being adjusted to ensure that the velocity at the exit of the bluff-body is 10 m/s. The fuel nozzle is set to be a velocity inlet with a velocity of 5 m/s. The downstream exit is an outlet boundary.All the remaining boundaries are set to be non-slipping walls.

Fig.2 Schematics of computational domain and flame,mean mixture fraction from RANS and computed Karlovitz number(the dashdot line marks the iso-surface of the stoichiometric mean mixture fraction, and the recirculation zone is marked by representative streamlines).
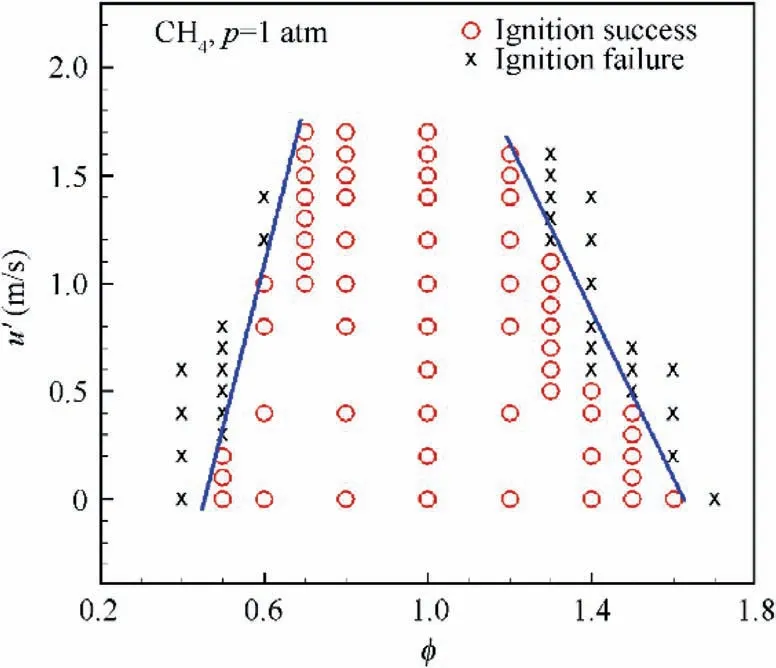
Fig.3 Simulated ignition events for methane/air spherical flames at p=1.0 atm under various φ (the turbulence integral lengthscale is 1 cm).
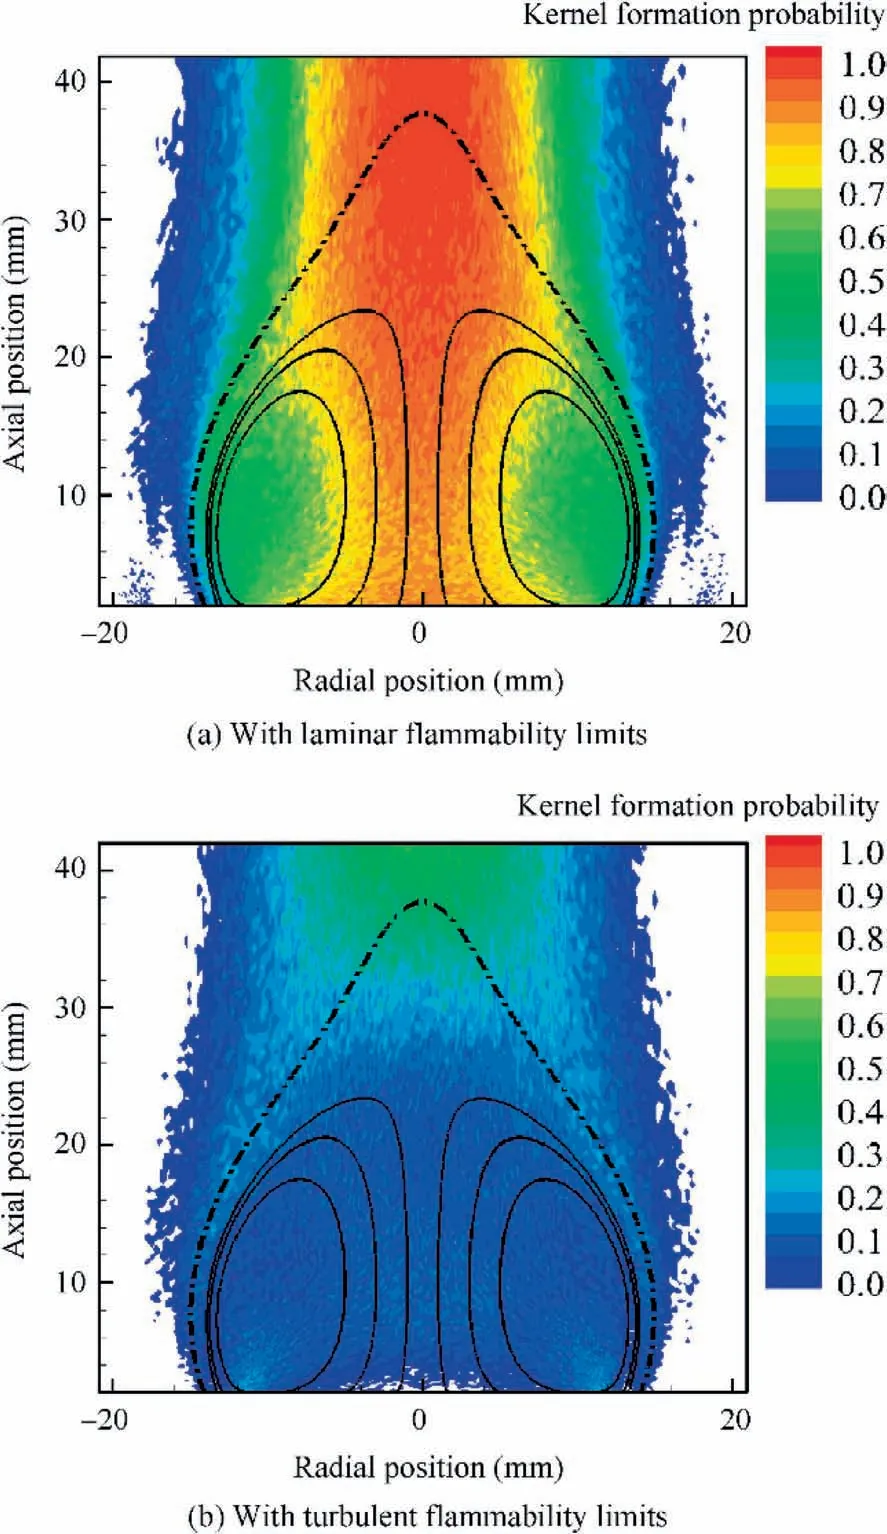
Fig. 4 Kernel formation probabilities predicted by flammability criterion with laminar flammability limits and turbulence effects(the dash-dot line marks the iso-surface of the stoichiometric mean mixture fraction).
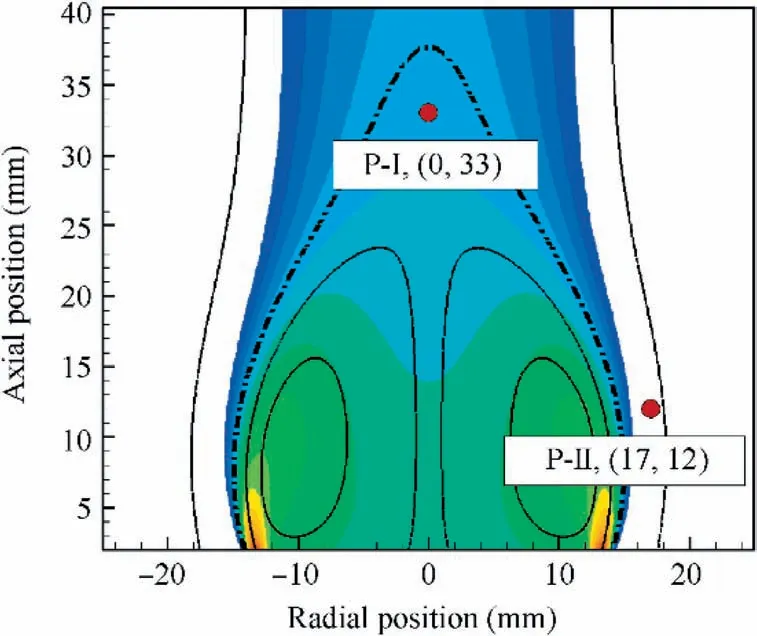
Fig.5 Contour of mean mixture fraction with spark locations PI and P-II being marked(the dash-dot line shows the iso-surface of the stoichiometric mean mixture fraction).
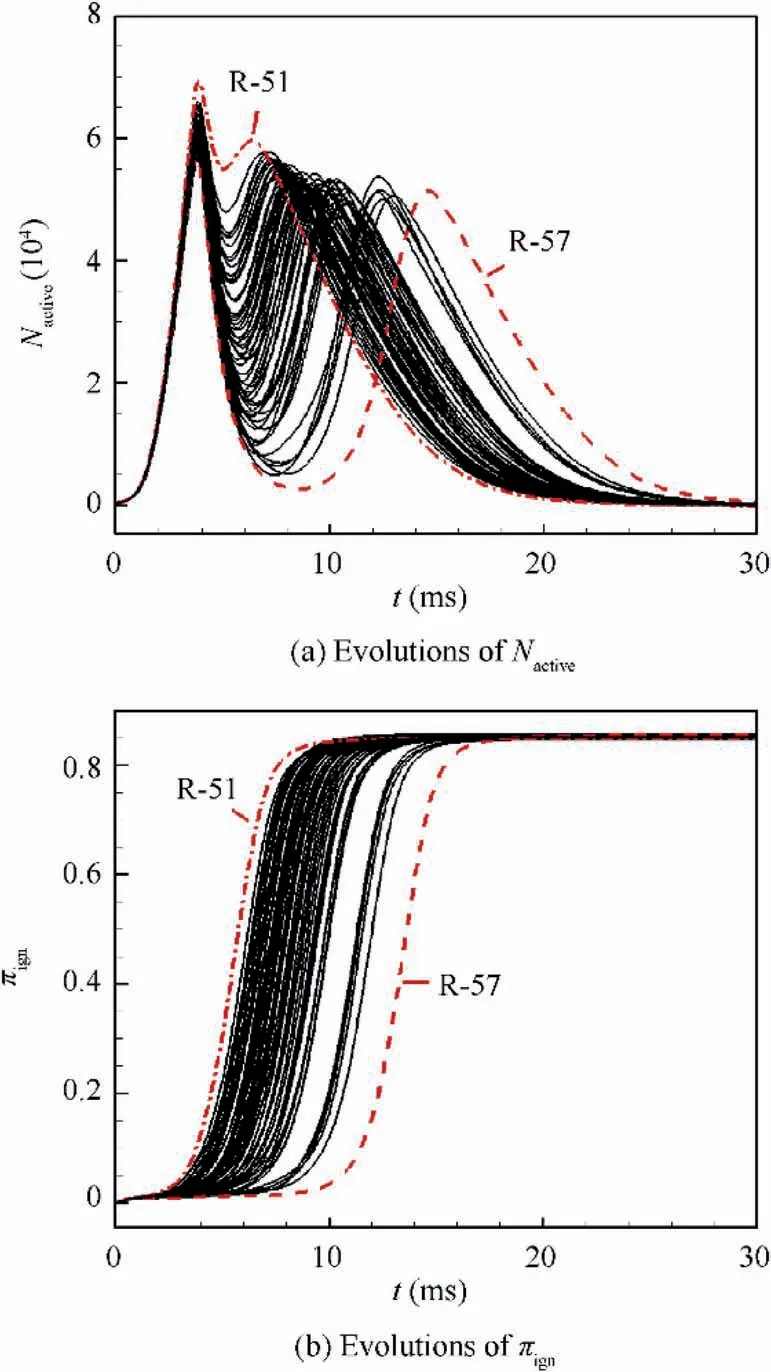
Fig. 6 Evolutions of Nactive and πign from 60 individual spark events at P-I with Kacrit =1.0 and laminar flammability limits(the evolution processes of the 51st and 57th spark events are marked by dash-dot and dashed lines, respectively).
Fig. 2(b) shows the computed mean mixture fraction.Compared to the experimental results,the computed isosurface of the stoichiometric mixture fraction is much elongated along the axial line. In addition, the simulation yields a higher mean mixture fraction in the recirculation zone.This has a pronounced effect on prediction of the kernel formation probability as shown below. Further improvement for the nonreacting simulation is subject to future study. In addition, Fig. 2(c) shows the computed Karlovitz number which is relatively large in the shear layer and the intense recirculation zone.
3.2. Flammability limits of methane/air mixtures
For methane/air mixtures, the calibrated 1D model, described in Section 2.2, with a 25-species methane mechanismis used to predict the flammability limits for methane/air mixtures under different turbulent intensities. In the calculation, a hot spot of 2000 K with 1 mm in radius, whose energy is higher than the minimum ignition energy, is used to initiate flows.Currently ignition is deemed ‘‘failure” if the flame kernel radius decreases after a sufficiently long time.
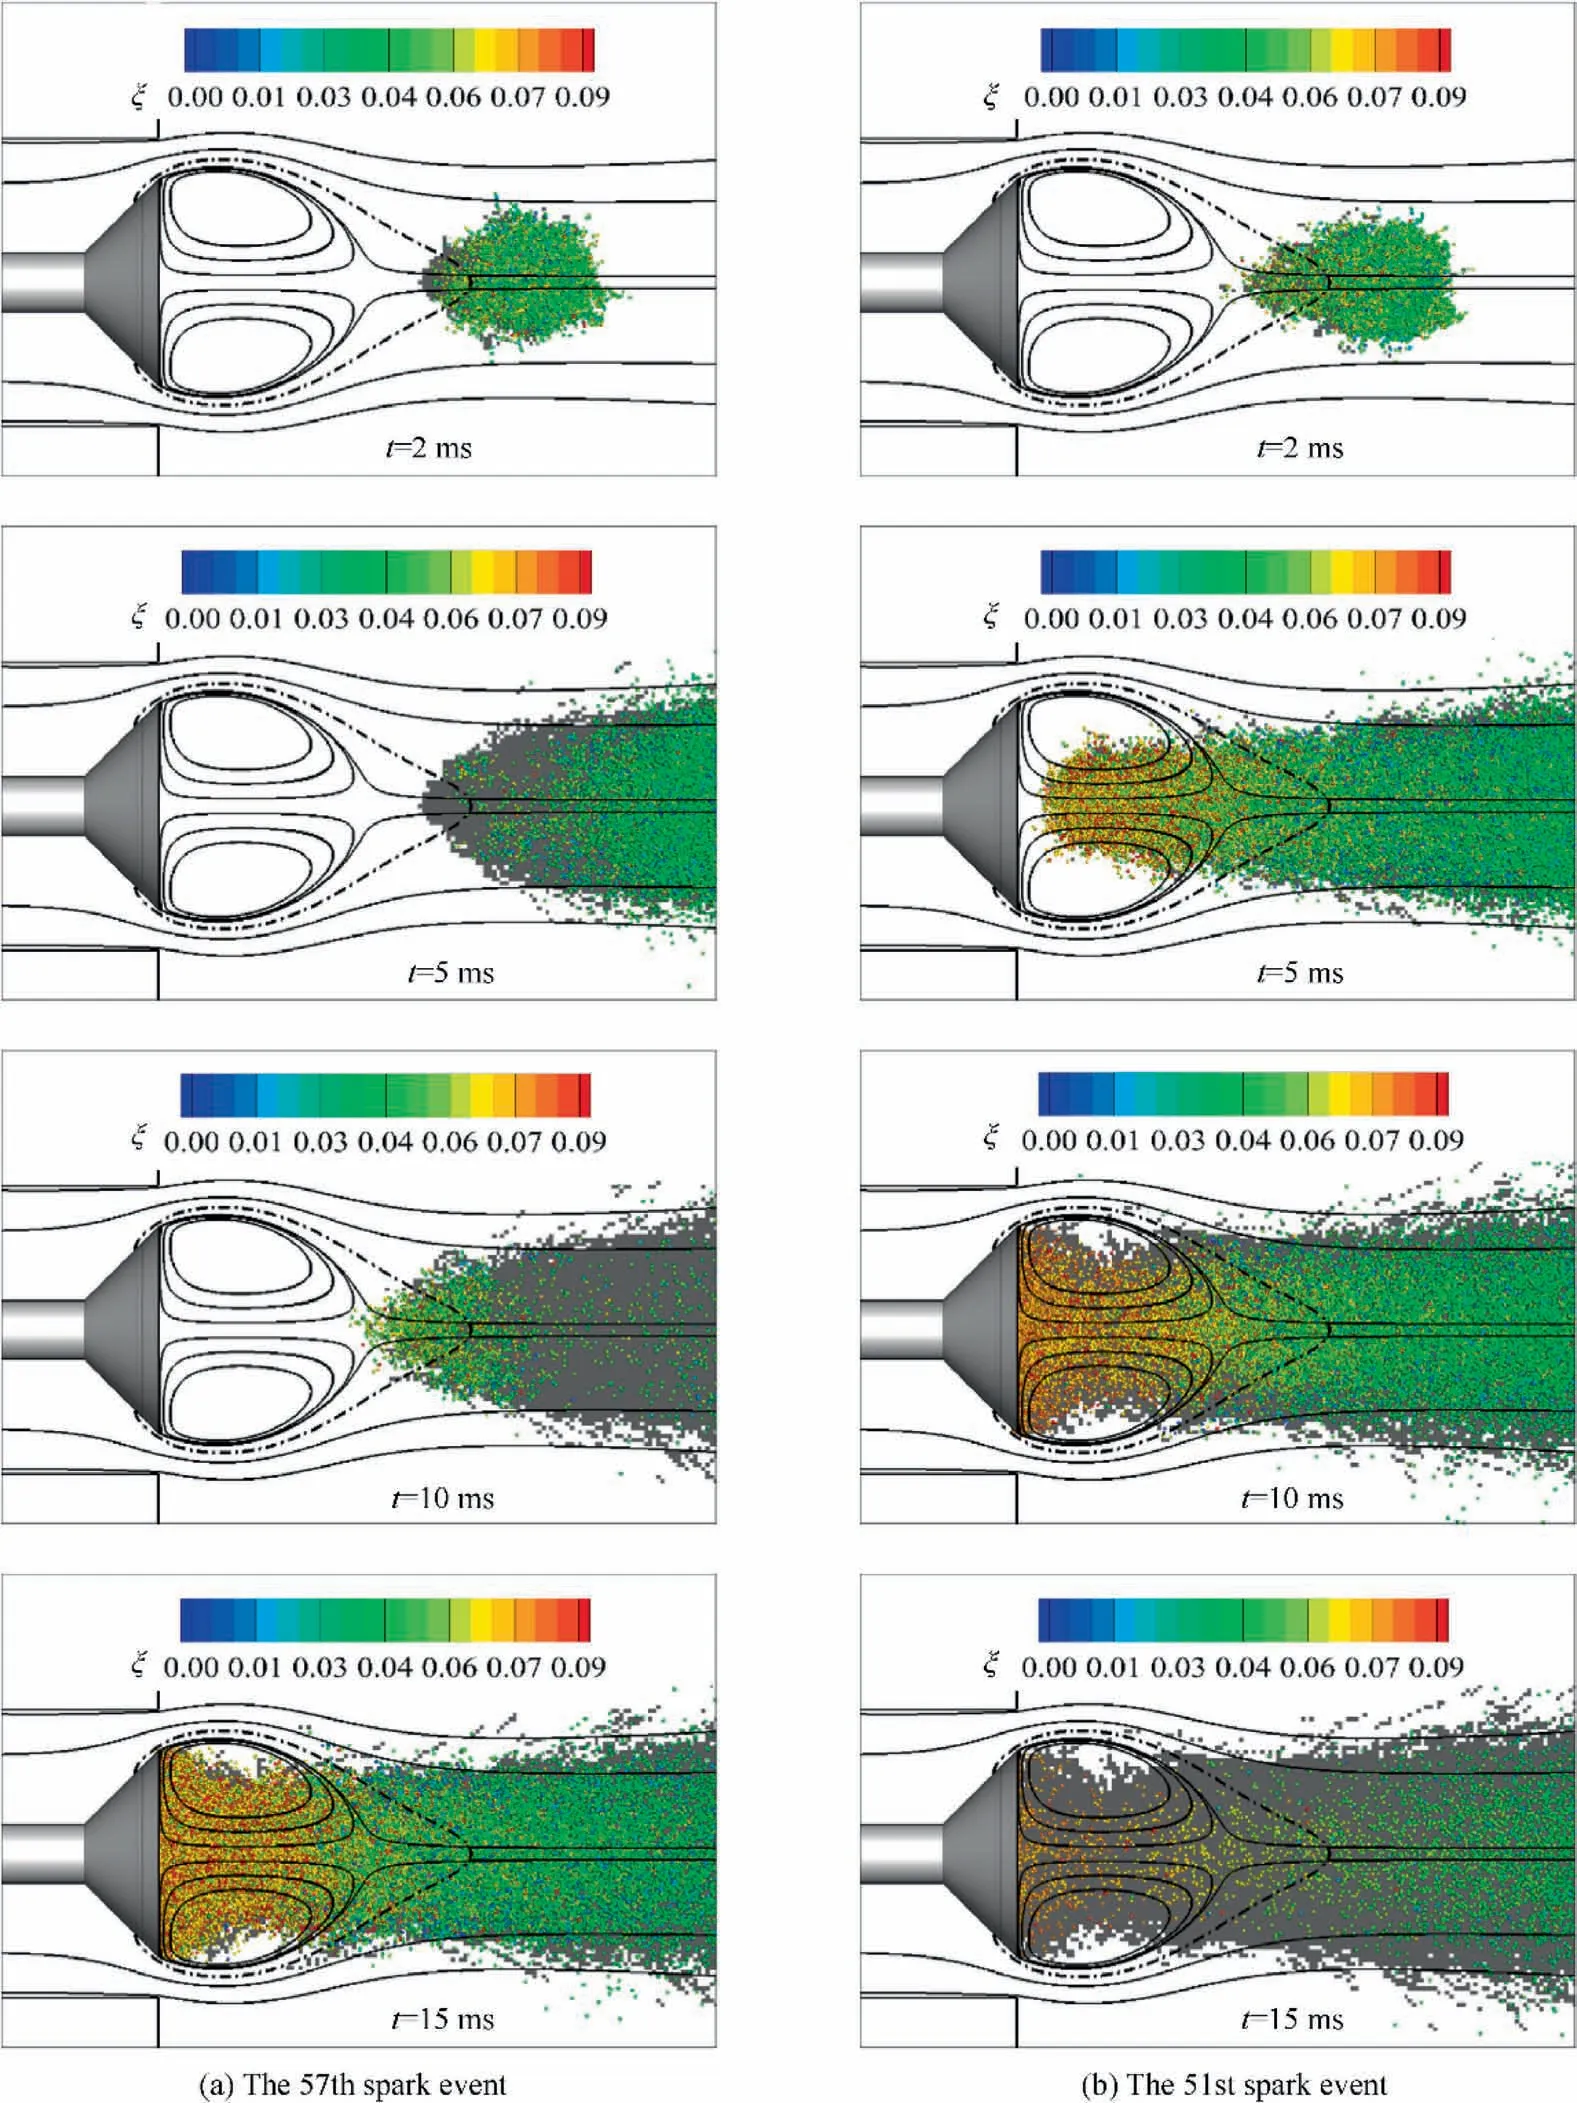
Fig. 7 Evolutions of particles and cell states for the 57th spark event and the 51st spark event at spark location P-I (white areas are unburnt, while grey areas are burnt; the particles are colored with their particle mixture fractions ξ, and the dash-dot line shows the isosurface of the stoichiometric mean mixture fraction).
As shown in Fig.3,the lean and rich limits for the laminar case, in equivalence ratios, are around φ=0.5 and φ=1.6, or in mixture fractions, ξ=0.0283 and ξ=0.0853,which are close to the reported valuesof 0.028 and 0.089.
The effects of turbulent transport on the flammability limits can be parameterized by the linear dependence of the limits,φand φ, on the turbulent fluctuation velocity, u. In this study, the four controlling limits are (u=0 m/s, φ=0.5),(u=1.6 m/s, φ=0.6), (u=0 m/s, φ=1.6), and(u=1.6 m/s, φ=1.2). In previous work,different slopes of changes have been considered for parametric studies of the turbulent transport effects on the kernel formation probability.
3.3. Kernel formation probability map
Fig. 4(a) shows the kernel formation probability without considering the effects of turbulent transport on the flammability limits.Compared with the flammability factor from the experiment,the calculated probabilities are much lower than those from the experiment in the recirculation zone. This is due to the fact that the predicted mean mixture fraction (>0.09) in the recirculation zone is higher than the experimental measurement and is higher than the rich flammability limit of 0.089.Note that, when computing the kernel formation probability,the second and third criteria introduced previously have no effects because of high spark energy and gaseous fuel.
In contrast, by accounting for turbulent transport effects on flammability, the kernel formation probabilities in the recirculation zone agree with those from the experiment(see Fig. 4(b)). This confirms the argument that turbulent fluctuations in the recirculation zone indeed inhibit the formation of viable flame kernels before the stage of flame propagation and can reduce the ignition probability. A parametric study of the rich flammability limitsshows that the kernel formation probability in the recirculation zone is more sensitive to the change of the rich flammability limit by turbulence. This is due to the fact that the predicted mixture fraction in the recirculation zone is relatively high. The large change of the rich flammability limit by turbulence can thereafter alter the kernel formation probability. In contrast, the kernel formation probability is not so sensitive to the change of the lean flammability limit by turbulence. It is also worth mentioning that the likelihood of a high kernel formation probability near the shear layer of the recirculation zone has been captured, and this agrees with the experimental result qualitatively. In addition, the likelihood of a high kernel formation probability in the shear layer is insensitive to the parameterization of turbulent transport effects. The large difference from the experimental ignition probability for the downstream recirculation zone is not surprising since the kernel formation analysis has not accounted for the flame propagation and stabilization stage. For the downstream region outside the recirculation zone, flame cannot be stabilized as shown by flame particle tracking in the following, even though a viable flame kernel can be formed.
3.4. Flame particle tracking
Flame particle tracking from two representative locations is used to analyze the flame propagation and stabilization process after successful kernel formation. As marked in Fig. 5,the ignitor location P-I is near the stoichiometric point along the axis and outside of the recirculation zone,while P-II is near the shear layer. The initial radius of the flame kernel is 2 mm.
3.4.1. Ignition process from two representative spark locations
Fig.6 shows the time evolutions of total number of active particles Nand ignition progress factor πfor all spark events at spark location P-I. The duration of the ignition process can be estimated from these curves as Nreaches zero,and it is evident that ignition lasts between 10 ms and 20 ms,which is similar to experimental observation.It can be seen from πin Fig. 6(b) that the 51st and 57th spark events represent the fastest and slowest ignition processes, respectively. The evolutions of particles and cell states for these two spark events are displayed in Fig. 7. The slowest and fastest spark events show similar ignition paths that flame particles firstly ignite the region downstream of the stoichiometric region along the axis, which corresponds to the first peak of the curves in Fig.6(a).Then after a short period,the flame particles propagate upstream into the central recirculation zone along the axis, which corresponds to the second peak of the curves in Fig. 6(a). Compared to the slow ignition process,the second peak of Nappears much earlier for the fast ignition process.The difference is mainly due to the effects of turbulence on the particle fluctuation velocity and mixture fraction.
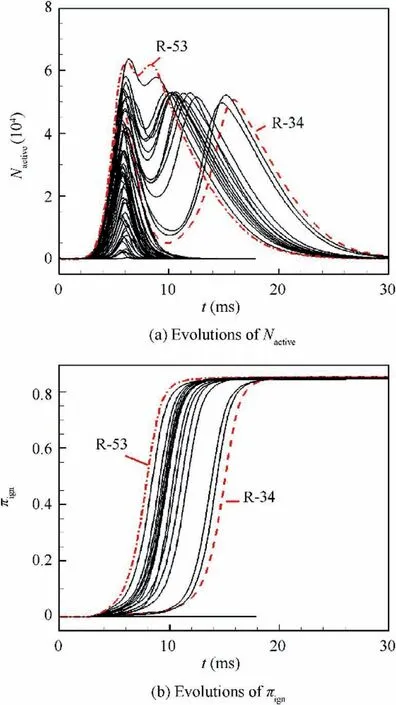
Fig. 8 Evolutions of Nactive and πign from 60 individual spark events at P-II with Kacrit =1.0 and laminar flammability limits(the evolution processes of the 53rd and 34th spark events are marked by dash-dot and dashed lines, respectively).
For spark location P-II, Fig. 8 shows the time evolutions of Nand πfrom all spark events. The ignition still lasts between 10 ms and 20 ms. Two peaks of Nare also observed. However, there is a slight difference in ignition path between the slowest and fastest ignition processes. As shown in Fig. 9, the flame particles in the 34th spark event firstly propagate along the stoichiometric line, and most of the particles move towards the axis, at t=3 ms, and then reproduce an ignition path similar to that at spark location P-I. However, for the 53rd spark event, a number of flame particles propagate towards the central recirculation zone before they reach the axis, which accelerates the whole ignition process.
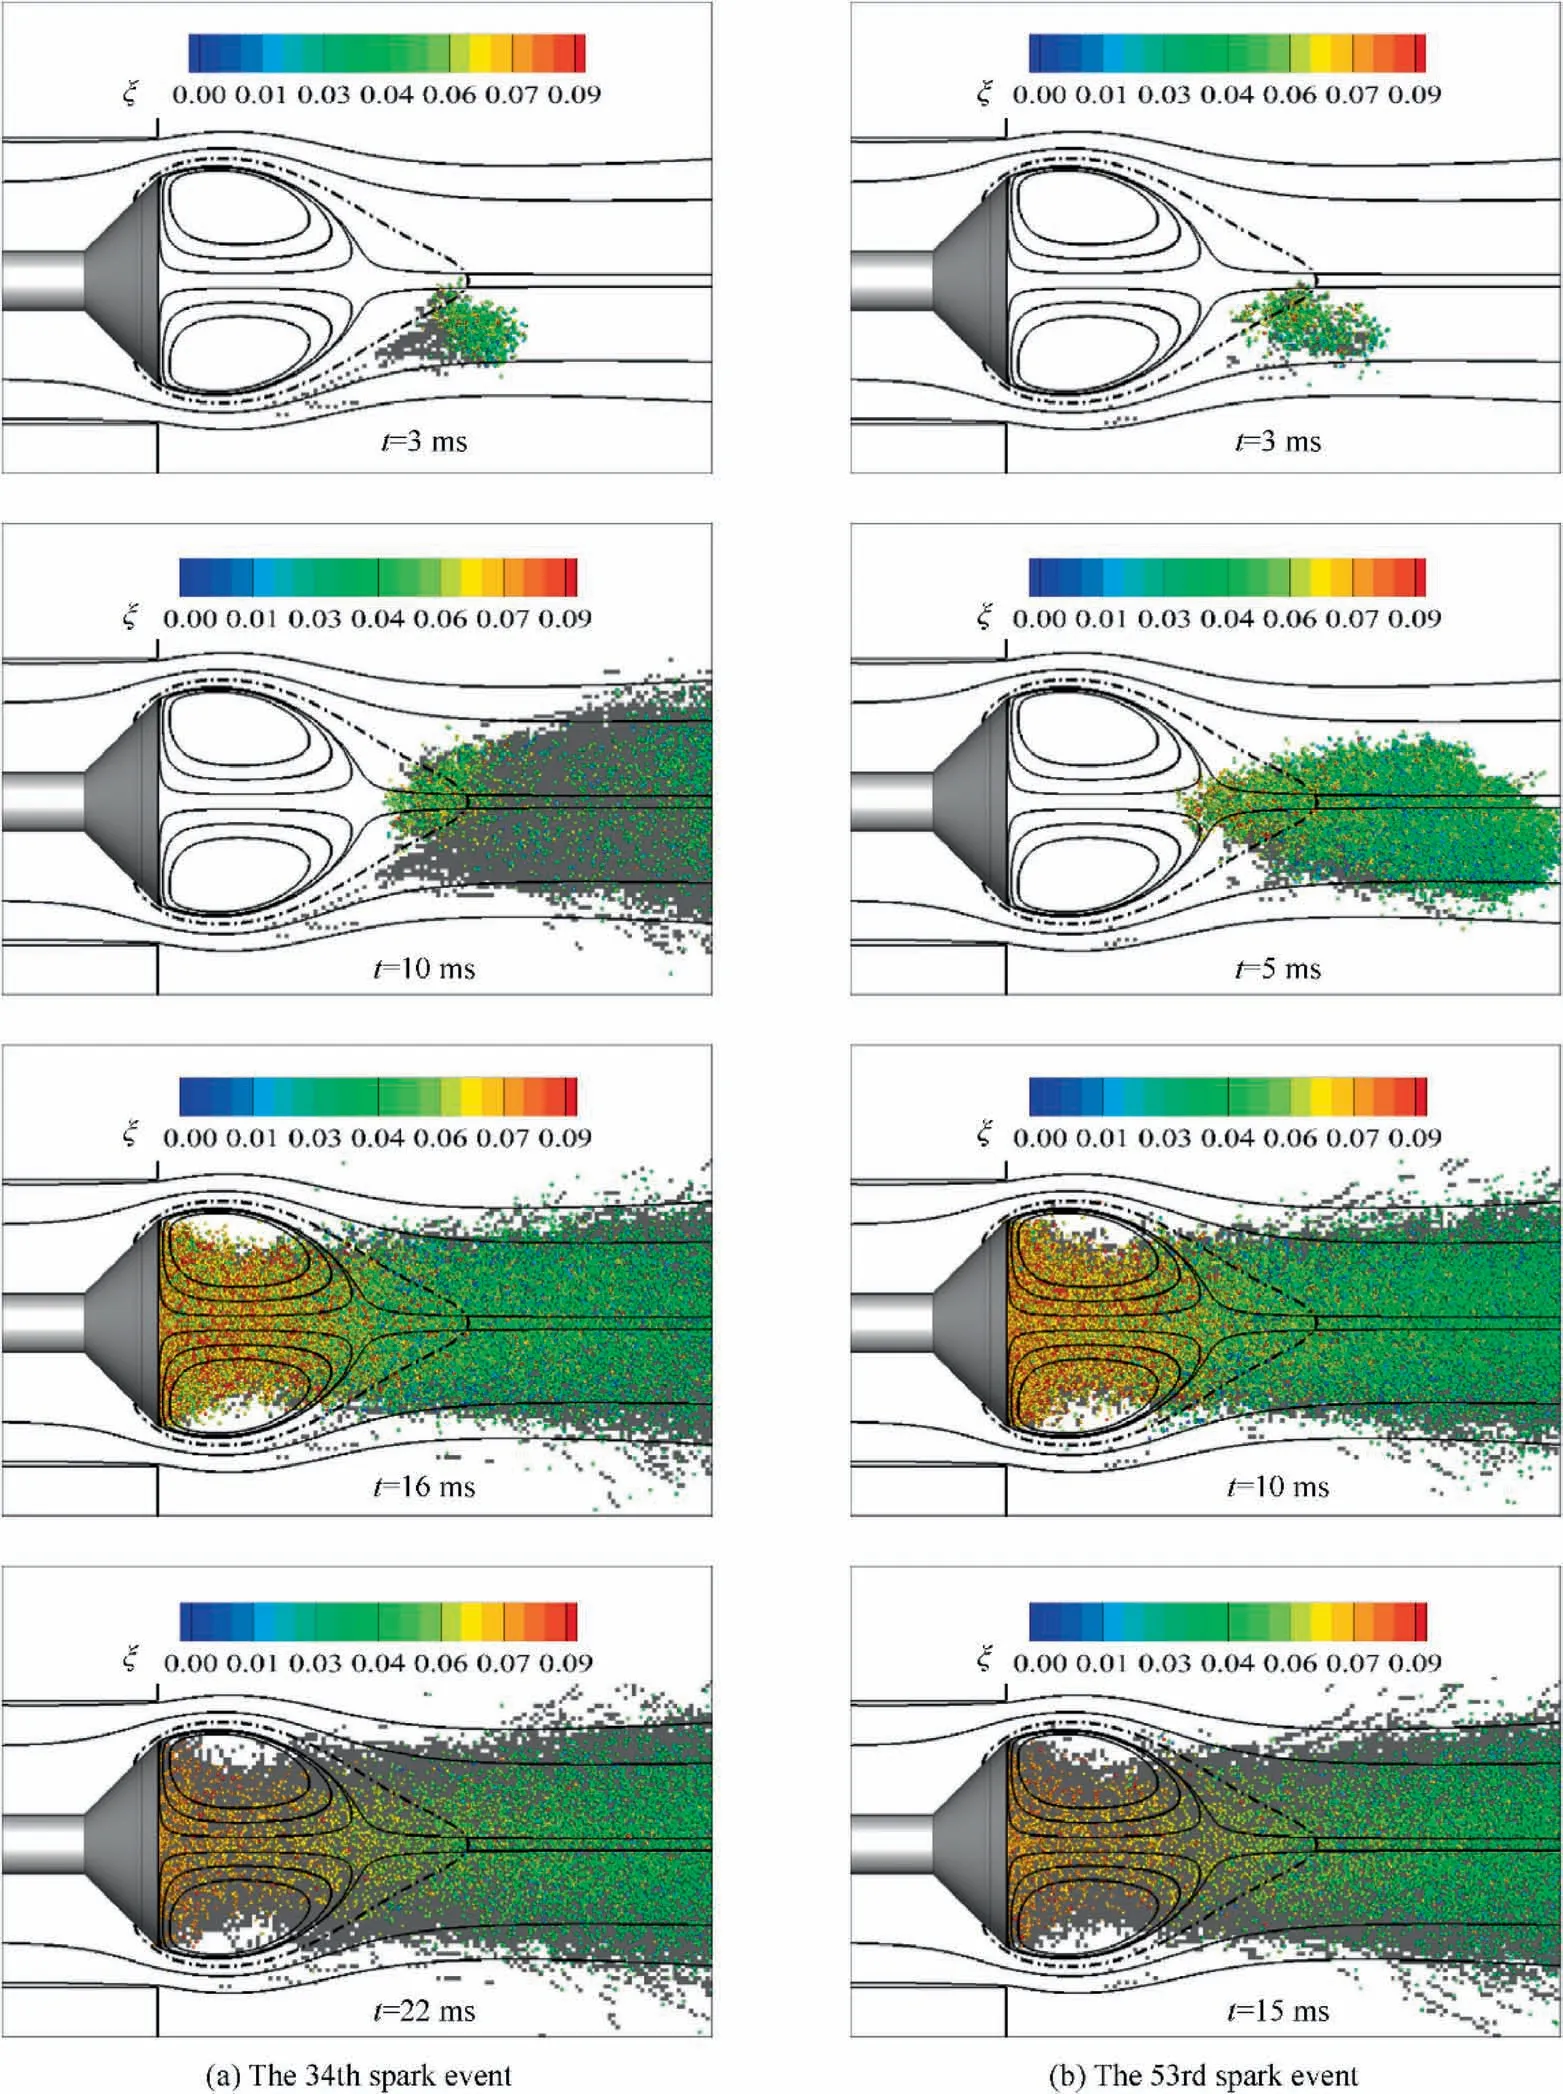
Fig. 9 Evolutions of particles and cell states for the 34th spark event and the 53rd spark event at spark location P-II (white areas are unburnt, while grey areas are burnt; the particles are colored with their particle mixture fractions ξ, and the dash-dot line shows the isosurface of the stoichiometric mean mixture fraction).
3.4.2. Effects of Ka-limit on ignition
As mentioned,particle state is determined by the particle Karlovitz number and flammability limits.Here,spark location PI is employed as an example to investigate the effect of Kaon the ignition process.Fig.10 shows the evolutions of Nand πunder different values of Ka.As the critical value of the Karlovitz number decreases,the duration of ignition increases,and πdecreases,until none of the flow region can be ignited.Note that the final value of πis quite close for successful ignition events in each case.
3.4.3. Effects of turbulence on ignition
Turbulence mixing narrows the flammability limits. Here,spark location P-I is employed as an example to investigate the effects of turbulent flammability limits on ignition. As shown in Section 3.2,turbulent flammability limits can be represented by two straight lines on the φ-uplane. Here, we fix the laminar flammability limits and adjust control points of the turbulent limits at u=1.6 m/s. Figs. 11 and 12 illustrate the effects of different rich and lean turbulent limits, respectively.Obviously,as the range of flammable equivalence ratios
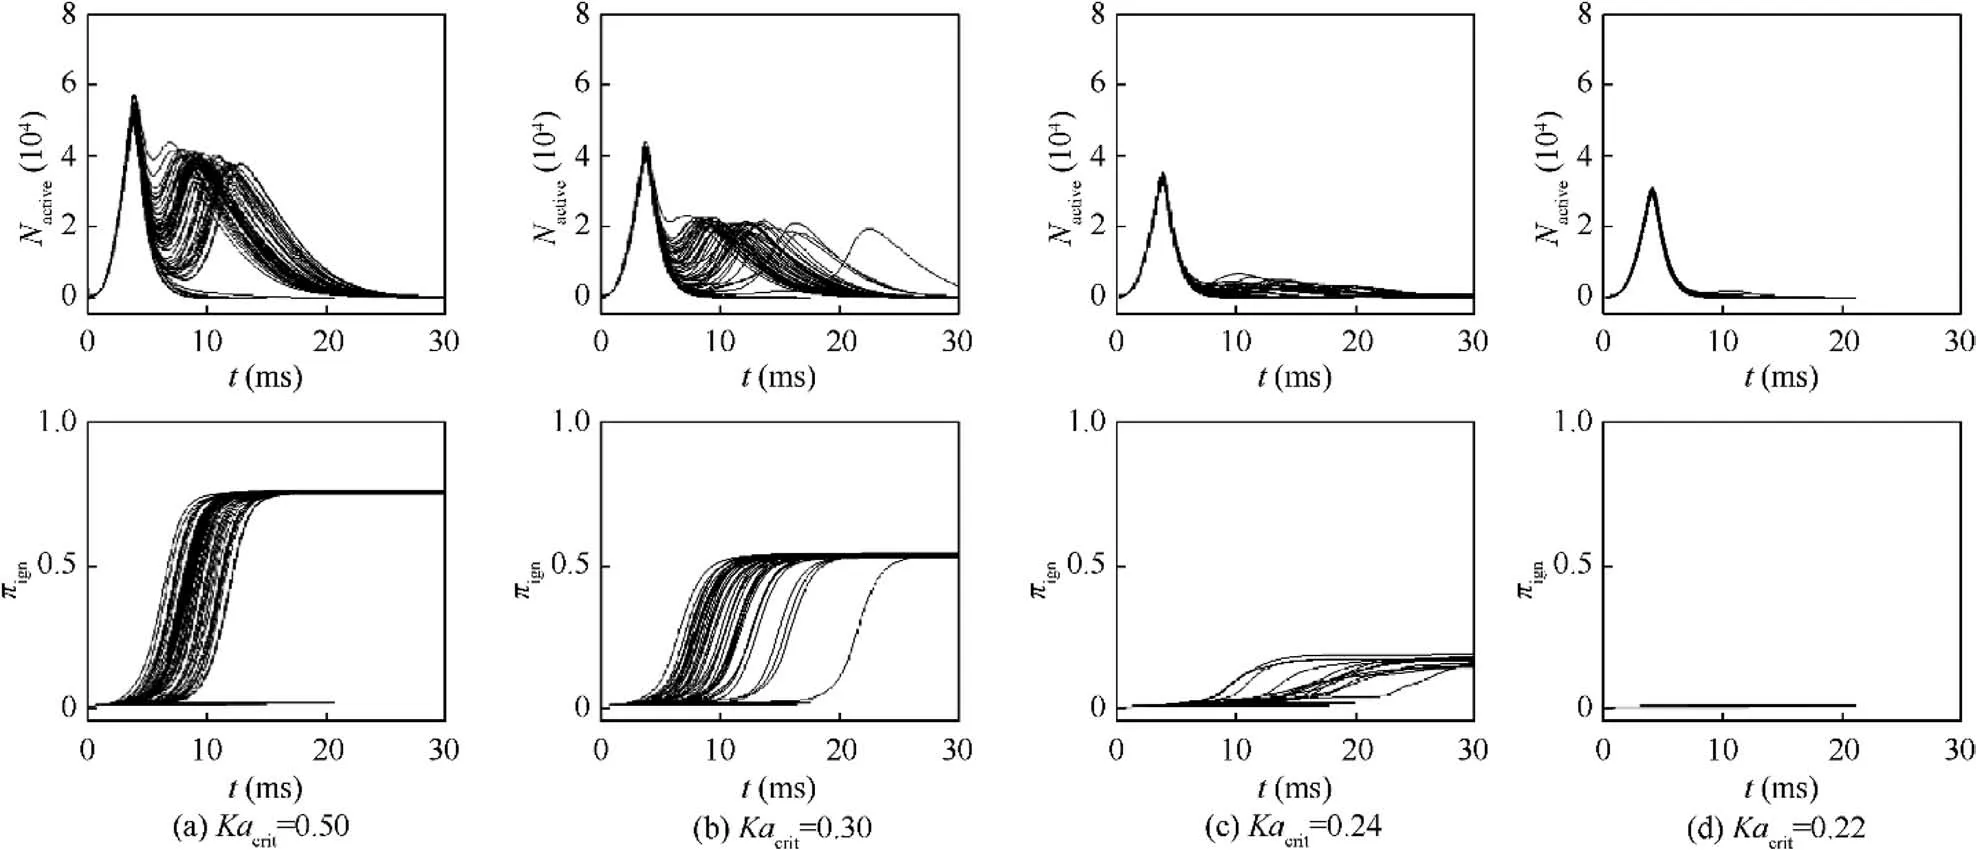
Fig. 10 Evolutions of Nactive and πign at spark location P-I with different values of Kacrit under laminar flammability limits.
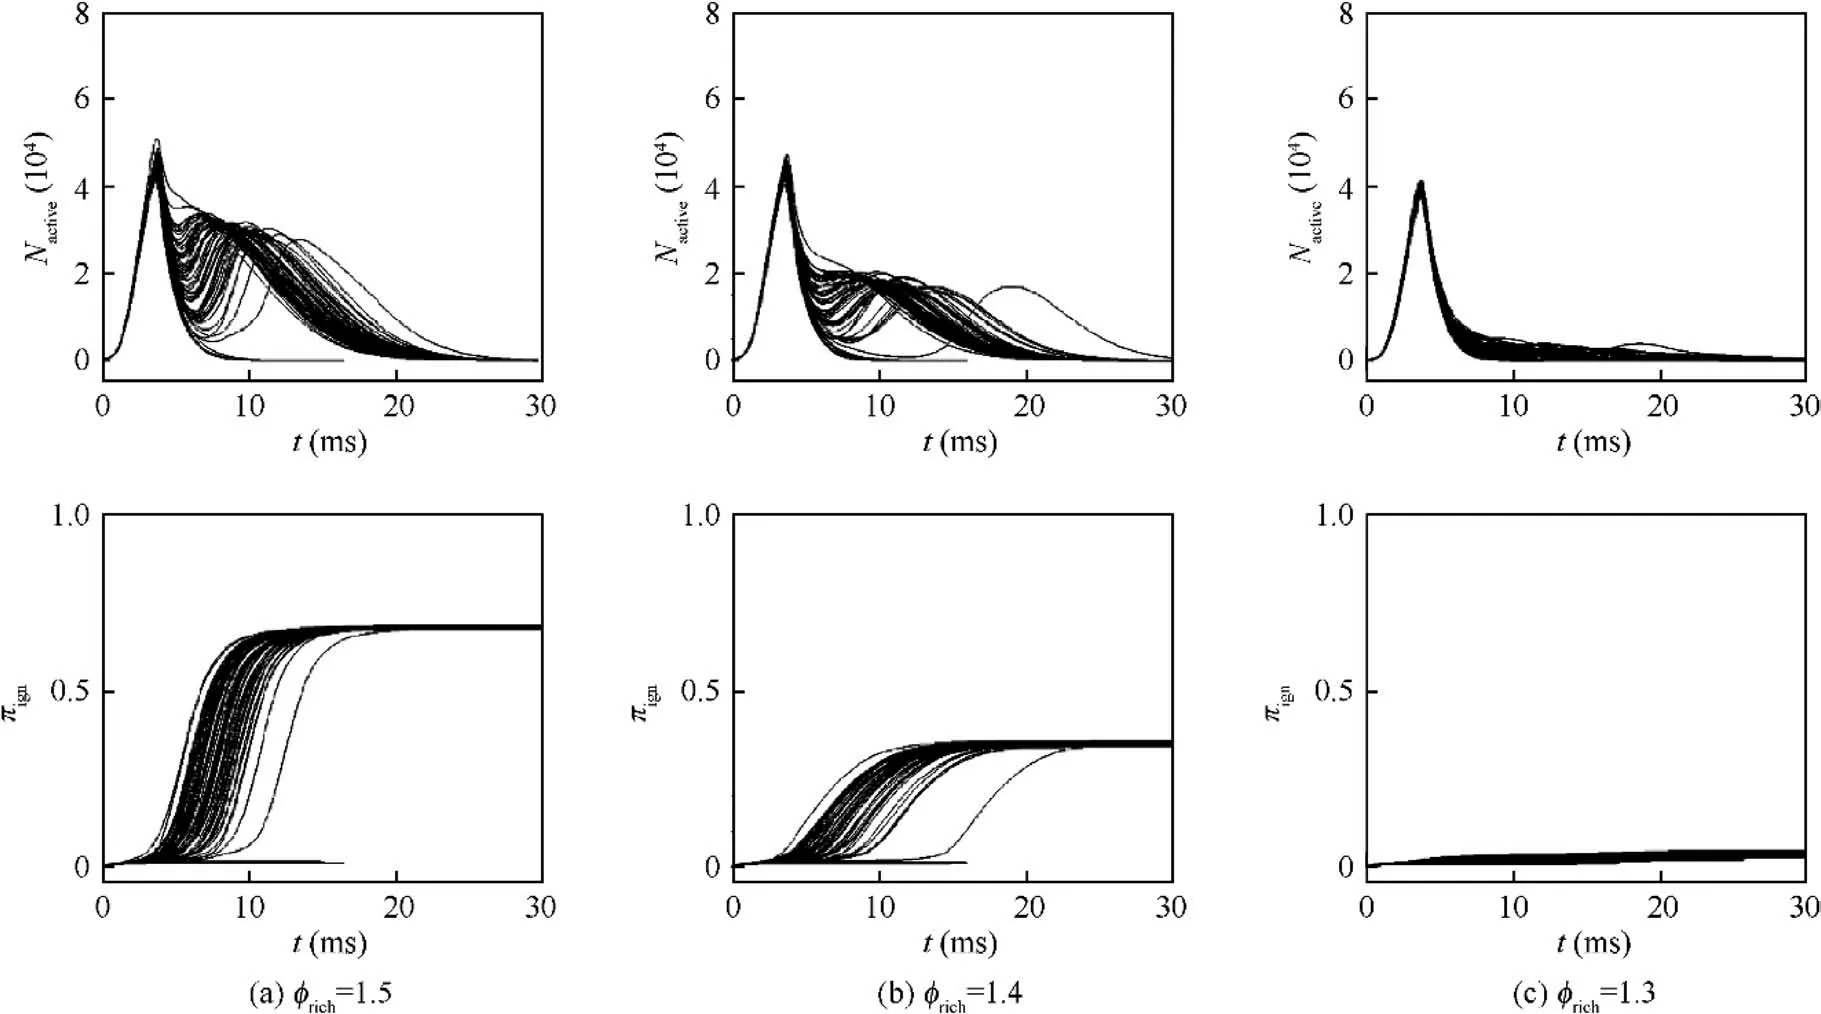
Fig. 11 Evolutions of Nactive and πign at spark location P-I with φlean =0.6 and different values of φrich under u′ =1.6 m/s.
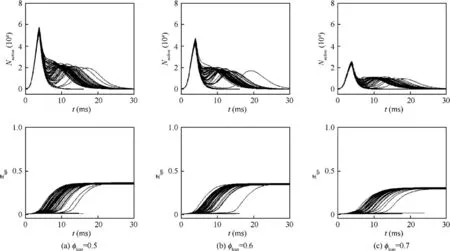
Fig. 12 Evolutions of Nactive and πign at spark location P-I with φrich =1.4 and different values of φlean under u′ =1.6 m/s.
narrows down, the duration of ignition increases, and πdecreases, showing a similar effect as decreasing Ka. Meanwhile, the rich turbulent flammability limits have much stronger effects on πcompared to those of the lean limits. Note that the final value of πis also quite close for different successful ignition events in each case.
3.5. Ignition probability map
For the methane/air bluff-body flame, the ignition processes are simulated at various spark locations with multiple ignition events at each location. The means and variances of the IPF πand the ignition probability Pare calculated for each spark location.Representative contours from parametric studies are shown in Figs. 13 and 14.
As shown in Figs. 13 and 14, with the rich flammability limit being slightly increased from 1.3 to 1.4, the IPF πdramatically increases.Under the same critical Karlovitz number,the distribution of the mean πis quite sensitive to the flammability limits. It is worth mentioning that the absolute value of the πhas no physical meaning since it depends on how to specify the domain of interest. In this study, for each case, a corresponding critical threshold πis determined based on the distributions of the mean and variance of the IPF πso that the region of most likely being ignited could be identified in the ignition probability map. Consequently,as shown in Figs. 13 and 14, the shapes of the ignition probability are similar even though the distributions of the mean IPF πare quite different.
The shape of the computed ignition probability is quite similar to that of previous work.In comparison with the experimental observation,a high ignition probability in the shear layer of the recirculation zone near the mean stoichiometric surface is reasonably predicted.In addition,low ignition probabilities inside the recirculation zone are also well captured.The discrepancy in the recirculation tip may result from the deficiency in the ROMs for ignition and the inaccuracy in the CFD predictions of flow and mixture fractions, which is subject to future study. The discrepancy in the prediction of the mean mixture fraction is illustrated by the isolines of the stoichiometric mixture fraction from CFD and the experiment.It is worth mentioning that the computed ignition probability depends on both the domain of interest and the critical threshold π. Instead of quantitative compassion, it is more meaningful to compare the shapes of ignition probabilities from the model and the experiment.

Fig.13 Ignition Progress Factor(IPF)and ignition probability map with πcrit =0.025,Kacrit =1.0,and turbulent flammability limits of φlean =0.6 and φrich =1.3(in Fig.13(c),the circle symbols represent the stoichiometric line in the experiment,3 and the dashed lines mark the region of high ignition probability in the experiment3).

Fig.14 Ignition Progress Factor(IPF)and ignition probability map with πcrit =0.24,Kacrit =1.0,and turbulent flammability limits of φlean =0.6 and φrich =1.4(in Fig.14(c),the circle symbols represent the stoichiometric line in the experiment,3 and the dashed lines mark the region of a high ignition probability in the experiment3).
4. Conclusions
In this paper,a forced ignition probability analysis method has been formulated, in which kernel formation analysis is performed with the criteria of flammability, energy discharge,and flame kernel growth, while flame propagation and stabilization are analyzed with Lagrangian flame particle tracking in conjunction with the Karlovitz criterion. The effect of turbulent transport on the flammability limits is accounted for through the incorporation of zone-dependent turbulenceinduced diffusion in a spherical flame kernel model. It shows that turbulent transport can significantly narrow the flammability range for successful kernel formation and has a more pronounced effect on the fuel rich flammability limit.
The approach has been demonstrated in a methane/air bluff-body flame with flow and fuel/air mixing characteristics being extracted from a nonreacting RANS simulation. Compared to experimental data,the simulation yields an elongated stoichiometric iso-surface in the flow direction and also a slightly larger mixture fraction in the recirculation zone. The kernel formation analysis shows that turbulent transport can inhibit the formation of a flame kernel before the stage of flame propagation. The computed kernel formation probability with the flammability limits being accounted for turbulent transport are substantially reduced in the recirculation zone,which agrees with experimental observations. The likelihood of a high kernel formation probability near the shear layer of the recirculation zone has been captured.
For flame propagation and stabilization, the flame particle tracking method reveals that both the critical Karlovitz number and flammability limits have pronounced effects on the ignition progress factor and therefore the ignition probability. Results show that a reduction of the ignition probability in the recirculation zone and a high ignition probability on the shear layer of the recirculation zone near the mean stoichiometric surface are well captured. For the methane/air bluff-body flame considered,further improvement in the ignition probability map relies on more accurate prediction of the nonreacting flow and mixing fields and a more sophisticated extinction criterion.
Declaration of Competing Interest
The authors declare that they have no known competing financial interests or personal relationships that could have appeared to influence the work reported in this paper.
Acknowledgement
sThis work was supported by the National Natural Science Foundation of China (No. 91841302), National Major Science and Technology Project (No. 2017-III-0007-0032), and Research Fund from Tsinghua University(No.2019Z08YJL03).
 CHINESE JOURNAL OF AERONAUTICS2021年4期
- CHINESE JOURNAL OF AERONAUTICS的其它文章
- Time delay compensation in lateral-directional flight control systems at high angles of attack
- Dual stability enhancement mechanisms of axial-slot casing treatment in a high-speed mixed-flow compressor with various tip clearances
- Development cost prediction of general aviation aircraft using combined estimation technique
- Improvement on shaped-hole film cooling effectiveness by integrating upstream sand-dune-shaped ramps
- Modeling and parameter identification of linear time-varying systems based on adaptive chirplet transform under random excitation
- An experimental method to obtain the hard alpha anomaly distribution for titanium alloy aeroengine disks
