A new component maps correction method using variable geometric parameters
Shochen LI, Hilong TANG, Min CHEN,b,*
a School of Energy and Power Engineering, Beihang University, Beijing 100083, China
b Aircraft Engine Integrated System Safety Beijing Key Laboratory, Beijing 100083, China
KEYWORDS Adaptive cycle engine;Component map correction;Performance model;Scaling factor;Variable geometric parameter
Abstract Accurate engine performance models are important for model-based performance evaluation of aero engine. The accuracy of the model often depends on engine component maps, so there is a need for a method that can accurately correct the component maps of the model over a wide range.In this paper,a new method for modifying component maps is proposed,this method combines the correction of the scaling factors with the solution process of the off-design working point, and uses the adjustment of the variable geometric parameters of the engine to change the position of the working line,in order to obtain more correction results and guarantee high accuracy in a wider range. The method is validated by taking the main fan of the Adaptive Cycle Engine(ACE), an ideal power unit for a new generation of multi-purpose and ultra-wide working range aircraft,as an example.The results show that the maximum error between the corrected component maps and the target maps is less than 1%.New possibility for more precise component maps can be realized in this paper.
1. Introduction
Aero engine performance prediction and correction plays an important role in the evaluation of the overall performance and the improvement of the accuracy of Gas Path Analysis(GPA). This technique requires accurate zero-dimensional engine models that can represent the real performance of aero engines, and the accuracy of these models depends mainly on the component maps.When there is a lack of complete component maps or there are differences between the maps used in the model and the real engine component characteristics, the engine model cannot be used for evaluating engine performance.For example,for the engine in pre-research stage,there is often no complete component maps,and generic component maps or component maps of similar aero engine are often used.If the selected component maps are not similar to the real maps, it may lead to problems such as inaccurate calculation results of engine performance at off-design points; Or for an engine that has been tested on the test-bed, the actual component characteristics after assembly may be deviated from the component characteristics obtained from the individual component experiments due to engine manufacturing tolerances,assembly errors, etc. Therefore, accurate correction or adaption of component maps to reduce the performance errors between the calculation model and the real engine are of great significance. The accurate models after proper correction can provide valuable information and data for both model-based and data-driven GPA methods.
In the past 30 years, many methods for correcting component maps had been proposed. The first type of among these methods was scaling of the existing component maps.
Early representative research could be found in Ref. 2 and Ref. 3. Stamatis et al.introduced a method for adapting gas turbine performance model. In this method, a concept of‘‘modification factor” was given. These factors could be used for changing the shape of generic component maps, and were integrated into the solution process of the operating point to obtain the optimal correction results.The method was applied to a single shaft industrial gas turbine.Lambiris et al.further proposed an improved method. An ‘‘external” type adaption was introduced in this paper,which performed adaption procedure outside the process of solving the engine working point.This method could be implemented in different engines of the same type, the author also applied this method to engine condition monitoring. A common feature of the two methods was that all the working points used were located on the same working line, and the component maps were modified by translating the corrected speed lines through a point correction without changing its shape, this places a high demand on the selected initial component maps to some extent.
Li et al.had done a lot of research on performance model adaption. The method was first used in engine design point performance adaption,in order to estimate the unknown component parameters at design point and better meet the target performance at the design point. An Influence Coefficient Matrix (ICM) based method and a Genetic Algorithm (GA)based method were proposed. Relationship between component parameters and engine performance parameters was established.The suitable component parameters were updated through the adaption algorithm by the engine performance parameters. This relationship is also the key point of the current paper.
This adaption idea was further used in multiple-point adaptive performance simulation carried out by the same authors,in order to reduce the error between the engine performance model and the real engine. The method was realized by using test data at the design point and multiple off-design points to adjust the values of a set of scaling factors,which were used for modifying component maps.The first article in 2009introduced a multiple-point adaptation method that linearizes the variation of the scaling factors around the design point and obtains the best scaling factor values by GA.Then the component maps were scaled by a linear scaling method.In 2011,the same authors proposed a nonlinear multiple points performance adaptation method using GA.This method described the scaling factors as a quadratic function associated with the corrected rotational speed (compressor and turbine) or the burner inlet pressure(combustor),and found the best coefficient values of the functions by GA.An improvement on this method was proposed in 2012,which used a least square method to determine the upper and lower bounds of the GA search range. In 2015, another article introduced an aero engine flight performance estimation method that did not rely on the component maps.This method established the quantitative relationship between engine gas path measurement parameters and component characteristics, predicted component characteristics through actual measurement parameters.The method was applied to an aircraft engine with different flight altitudes or flying Mach numbers, part-load operation,or with component performance degradation.
Other scaling methods could be seen in Ref.10 and Ref.11.Kong et al.proposed a scaling method for component maps based on system identification, which established the relationship between the scaling factors and the component characteristic parameters by polynomial equations. Miste´ and Beniniintroduced a more general and more automated method for component maps adaption,which would improve the accuracy of engine off-design point performance predictions. This method did not employ regression models of the scaling factors or component characteristics, but performed map modifications in an appropriate neighborhood of the multiple experimental points. Several constraints for component maps were defined and Nelder-Mead simplex method was chosen for the optimization algorithm.
A summary could be given for these ‘‘scaling” method:Based on the relationship between component characteristic and engine performance, accurate component maps were obtained by modifying generic component maps or generated during the scaling process.
Another type of correcting component map was setting a model for the curves directly, which could be referred as‘‘Regression-based model”.
Kong et al.proposed a GA-based component map generation method,which used polynomial function to express the relationship of pressure ratio, efficiency, corrected mass flow and corrected speed. Through the performance data of some working points, the GA is used to obtain the best coefficients for polynomial equations to describe the modified component maps.
Tsoutsanis et al.presented a novel component map generation method and further developed a new off-design performance adaption approach. This method used elliptic curves to represent the constant speed lines for pressure ratio and efficiency maps of the compressor,and the best coefficients that determined the shape of the curves can be obtained through GA method, so that the new component maps could better represent the true component characteristics, and the performance output by the model could better fit the engine test data. Based on previous work, the authors introduced another nonlinear adaption method for compressor and turbine maps,and applied it to performance diagnostics at steady states and transient conditions.
Yang et al.further proposed a new component map generation method in 2017. This method also chose elliptic equations as the mathematic model of the component maps. The initial maps were based on the operating points data,expressed by circle equations. Then through scaling, translation and rotation, the final maps were obtained. The coefficients that determined the shapes of the elliptic curves were generated through a multi-objective optimization scheme. The method was verified by generating an LM2500 compressor map, and was further applied in a dynamic gas turbine performance model.
The above methods could be summarized as follows: the curves of the component map were expressed by a series of expressions,and various optimization algorithms were used to modify the component maps, so that the error between the output of the calculation model and the real engine performance was as small as possible.
However, the correction of the component maps obtained through a few operating points does not guarantee a good correction result in all working states of the engine, because the selected engine operating points are mostly moved on the same working line. When the working state is far away from this working line, the accuracy of the correction result is often difficult to guarantee.
This paper proposes a new component maps correction method based on the implicit function relationship between the component characteristic scaling factors and the engine performance measurement parameters,looking for the quantitative relationship between component characteristics and engine performance. At the same time, by changing the variable geometric parameters of the engine, more operating points of the engine are obtained, and the characteristics of the components in the wider area can be corrected, thereby realizing the purpose of correcting the component maps through the engine performance more accurately. The advantages of this method are: 1) There is no need to establish a specific model of the scaling factors, and the solution process is embedded in the off-design points calculation process of the engine. 2) Acquisition of working points is easy to implement in engineering applications.The application object of this paper: Adaptive Cycle Engine (ACE), with more variable geometries, provides the possibility for the implementation of this method.
The main contents of this paper are shown as follows:Firstly, the basic structure of the ACE and the basic principle of the steady state performance calculation model are briefly introduced, then the component maps correction method is described in detail. Finally, the application result of the method on ACE is given.
2. Introduction of ACE structure and steady-state performance model
ture of a typical double bypass VCE, while the periphery is surrounded by a third bypass duct.
The subject of this paper is the ACE with Flade-fan stage.It includes a row of variable inlet guide vanes in the third bypass duct and a single compression stage extending from the second stage of main fan, this structure is called Flade.The air flow rate of the third bypass can be controlled by adjusting the angle of the inlet guide vane of the Flade. The main fan has two stages. After passing the main fan, the airflow flows into the second bypass duct and the Core Driven Fan Stage (CDFS). If the second bypass Mode Switching Valve(MSV)is closed,the second bypass is closed.The airflow completely flows into the CDFS Fig. 1.
After CDFS is a typical structure of a turbofan engine: the airflow is divided into two streams, one into the first bypass and one into the core machine. The main fan is connected to the Low-Pressure Turbine (LPT) on the low-pressure shaft,while the CDFS and High-Pressure Compressor (HPC) are connected to the High-Pressure Turbine (HPT) on the highpressure shaft. The airflow of the first and second bypass are mixed at the Front Variable Area Bypass Injector (FVABI)and then mixed with the low-pressure turbine gas at the Rear Variable Area Bypass Injector(RVABI).The mixed gas is discharged from the engine through the nozzle.
The ACE with Flade has more variable geometries to allow the engine to operate in four modes.When the second and third bypass are closed, the engine works in the one bypass mode(M).When the MSV of the second bypass is open and the third bypass is closed, the engine works in the double bypass mode(M). When the MSV of the second bypass is closed and the third bypass is open,the engine works in another double bypass mode (M), When all bypasses are open, the engine works in the triple bypass mode (M). These variables geometries allow the bypass ratio of the ACE to vary over a wider range,which can let ACE achieve good performance under various working conditions and reduce the spillage drag of the engine more effectively (compared to the conventional VCE). The main components of ACE with Flade, as well as the definition of the inlet and outlet section number of each component are shown in Fig. 1and Table 1.
2.1. Structure of ACE
With the development of technology, the next generation of fighters will be designed with all-weather, long-distance,multi-purpose as the main design goals. These new targets put new demands on aero engines and require good performance of the engine under various working conditions. Such as subsonic cruise, transonic climb and supersonic cruise.
The Variable Cycle Engine (VCE) can change the air flow of each bypass duct through its multiple variable geometric components, thereby changing the bypass ratio of the engine.Increasing the bypass ratio during subsonic cruise allows VCE to have some of the advantages of a turbofan engine,such as low Specific Fuel Consumption (SFC); and reducing the bypass ratio during supersonic cruise or transonic climb can provide the engine with certain advantages of a turbojet engine, such as high specific thrust. This feature can let VCE meet the needs of good performance under a variety of conditions. The ACE is a new type of VCE that can change the engine’s bypass ratio over a wider range to achieve better performance.As a new concept of VCE,ACE has the basic struc-
2.2. Steady-state performance model of ACE
The steady-state performance model of ACE is a zerodimensional engine model.It can be used to analyze the overall performance and control schedule selection of ACE under different working modes.The model consists of multiple calculation modules, design point calculations and off-design point calculations are the two main functions of the model.The main schematic diagram of model is shown in Figs. 2 and 3. More detail of ACE performance model can be found in Refs.23,24.
As shown in Figs. 2 and 3, component characteristics and engine cycle parameters are required to input in advance before design point calculation. The main performance data(thrust, SFC, pressure ratio, etc.) of the engine design point,various thermodynamic parameters (total temperature, total pressure, etc.) and key geometry parameters can be obtained by design point calculations.
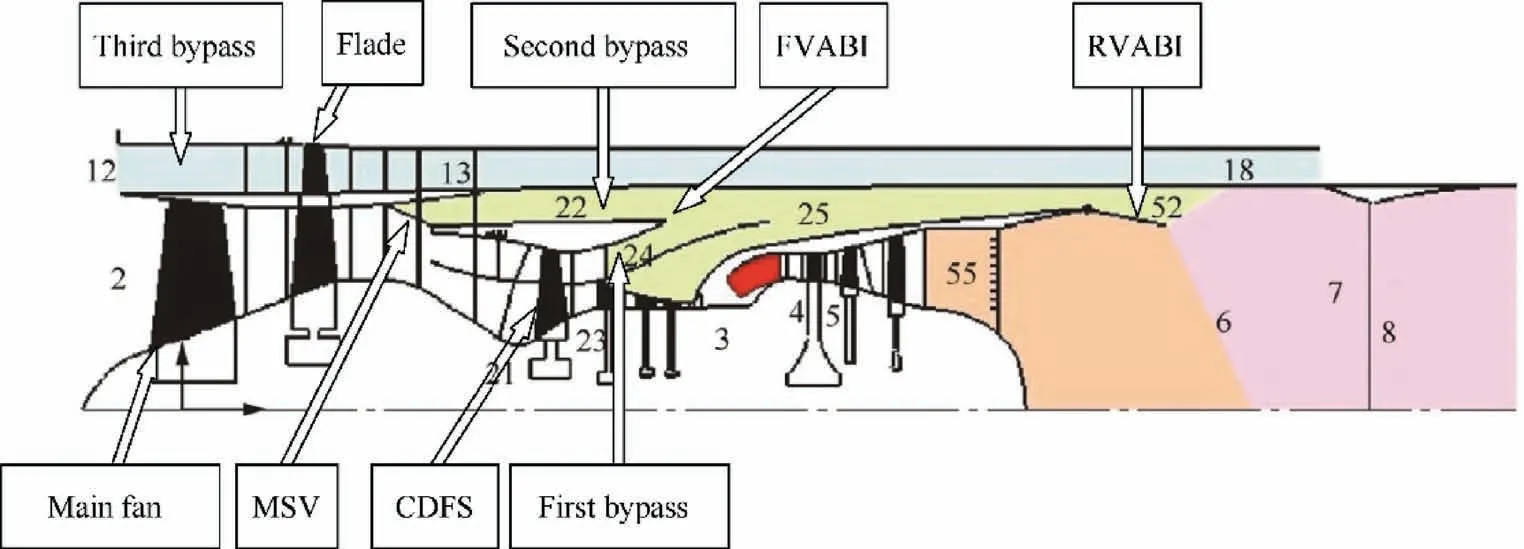
Fig. 1 Main components of ACE with Flade23.
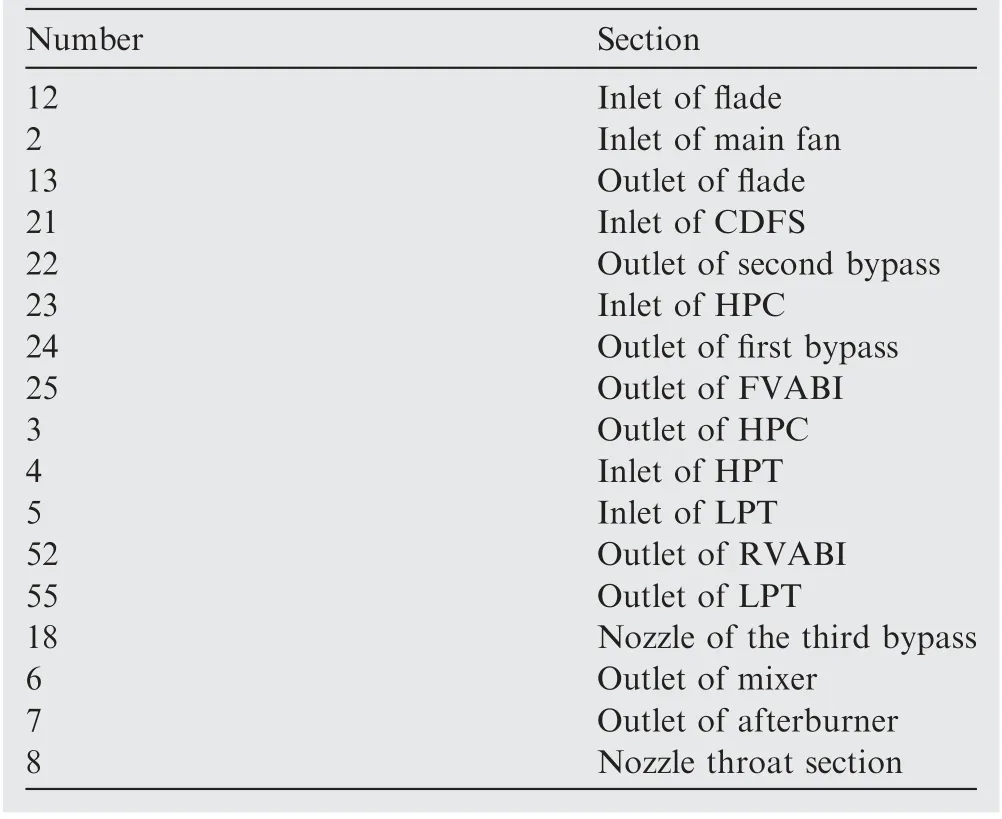
Table 1 Definition for sections of ACE24.
Off-design point calculation is the process of solving the component operating points under off-design conditions. The performance of the engine at the off-design point depends on the balance work of each component. The balance work of each component under off-design conditions should meet the balance working equations, including power balance equation for each rotor, the flow compatibility equation between connected gas components, the static pressure balance equation at the mixing parts, etc. Iterative calculations are performed until all balance working conditions are met. At the end of the iteration, the overall performance results for the ACE engine are output.The three calculation modes are single point characteristic calculation, speed-altitude characteristics calculation and throttle characteristics calculation.
The ACE engine design point studied in this paper is set at 0 km, Ma=0, and the engine’s working mode is M.
3. Component maps correction method
In this section, the detail of the correction method will be given. The definition of scaling factor is described at first in Section 3.1, followed by mathematical description and the specific principle of the correction method.
3.1. Definition of scaling factor
In the design point calculation process,the initial modification of each component map is required.Taking the main fan as an example. The main fan pressure ratio, corrected air mass flow and efficiency can be obtained through the calculation process,then the characteristic of the main fan at design point is uniquely determined on the component map, which can be

Fig. 2 Design point calculation module.

Fig. 3 Off-design point calculation module.
recorded as π,W,η.At the same time,the initial component maps are input into the performance model as a twodimensional matrix related to corrected speed and the beta line value.These two parameters at the design point will also be given in the input design parameters.Then the performance of the main fan at design point can also be obtained by twodimensional interpolation of component maps, which can be recorded as π’,W’,η’.The performance of the design point given by the above two methods may not completely coincide, as the initial component maps cannot represent the actual performance of each component. At this time, the scaling factor is introduced to correct the existing component maps, so that the performance of the main fan obtained by the two methods is consistent at the design point. The scaling factors of the main fan can be defined as Eqs. (1)-(3):
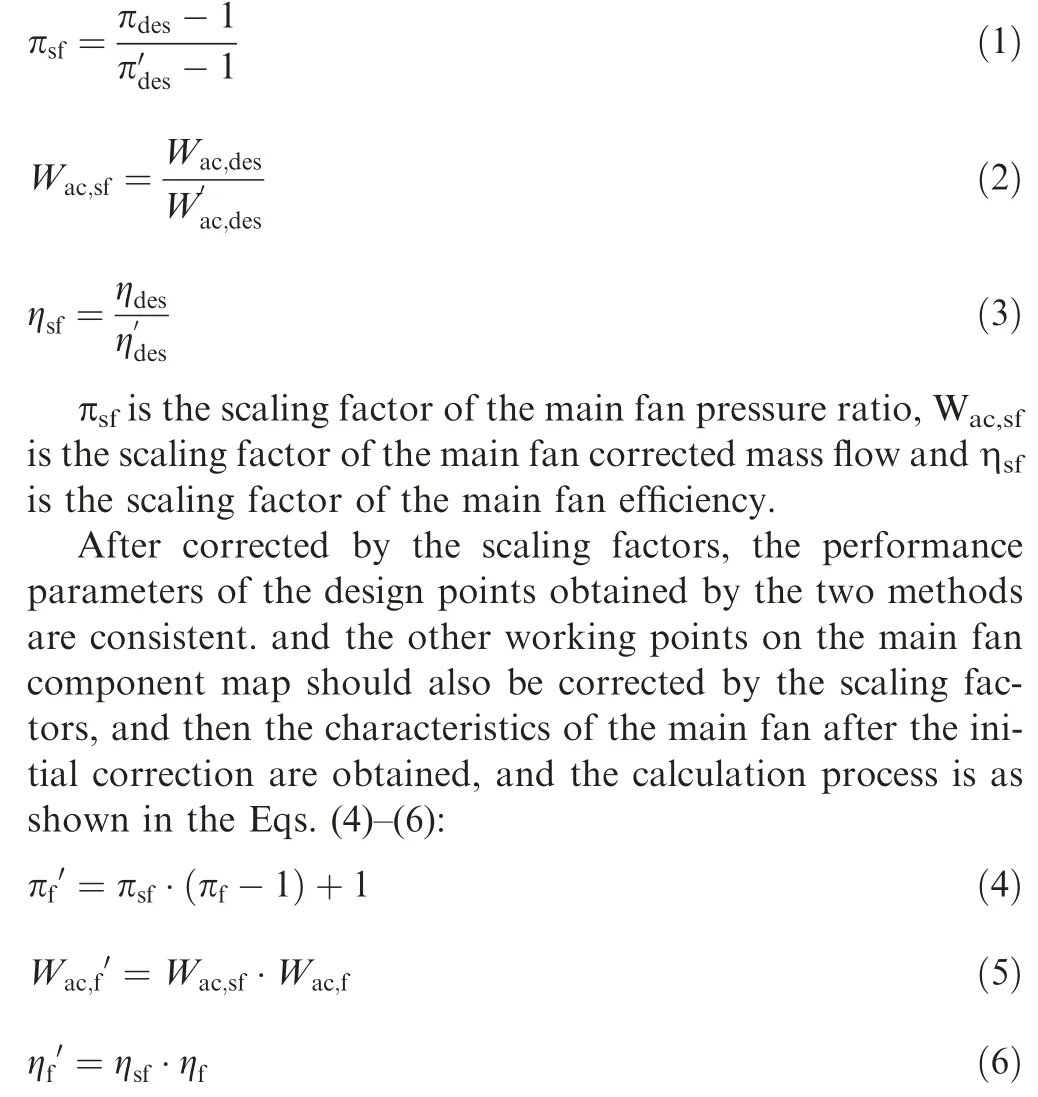
Where π’,W’, η’are the new component characteristics corrected by the scaling factors, and π, Wand ηare the component characteristics before the correction. The modified component maps will be used for subsequent off-design point calculations. For other components, similar scaling factors definitions and initial component maps corrections should also be made during the design point calculation.
3.2. Mathematical description
During the operation of an aero engine,performance changes in any component will influence the engine overall performance.Compressor fouling, turbine erosionand other gas path faults, or foreign-object damage and other accidental events,will cause component characteristics to deviate from normal working conditions, then further influence the whole engine performance. So, there is a quantitative relationship between component characteristics and engine performance,that is to say,engine performance depends on the working states of the components,and the condition of the components can be represented by a set of individual measurement parameters.The goal of the proposed correction method is to correct the component maps so that it can more accurately reflect the actual component operation and reduce the performance error between the model and the real engine. As mentioned in Section 3.1,by changing the scaling factors,the shape of the component maps can be changed, the scaling factors can be described as the independent variables in this quantitative relationship, defined as a vector x. During engine test or actual operation, many measurement parameters reflecting engine performance, such as high- and low-pressure rotor physical rotational speed,important section total temperature and total pressure, thrust and SFC, can be obtained. These parameters will be influenced by component characteristics,i.e.,influenced by the scaling factors, therefore, the measurement parameters can be described as the dependent variables in this quantitative relationship, defined as a vector y. In addition, control schedules(defined as a vector u)and ambient conditions(defined as a vector v) are other two influence factors of measurement parameters.To conclude,the relationship can be described as Eq.(7):
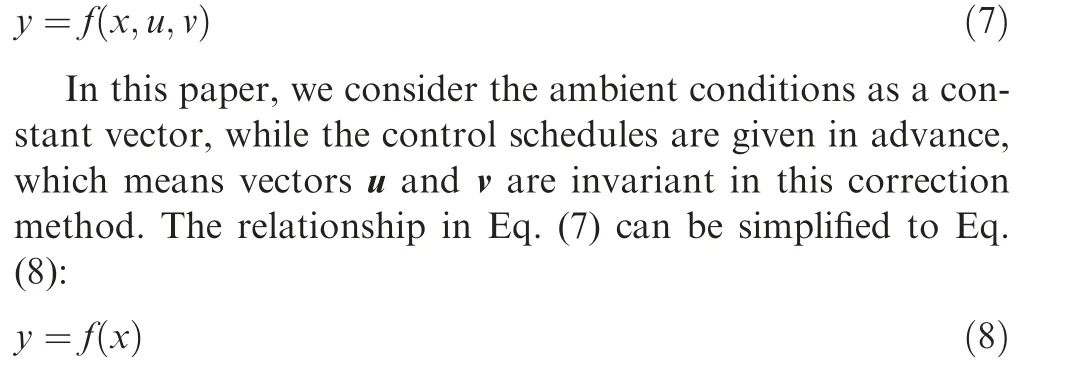
Our goal is to solve the most suitable scaling factor vector x by measurement parameter vector y, this can be seen as an inverse solution process of Eq. (8). It is necessary to use some mathematical method to solve this quantitative relationship reversely. In this case, the algorithm for solving the engine off-design working point is needed.
3.3. ACE off-design point solving process
In the ACE steady-state performance model, the method for solving off-design points is Newton-Raphson algorithm. In the thermodynamic cycle calculation, there are mutual constraints between various components, the specific operating points of some components cannot be directly obtained during the calculation process. Some parameters of the components need to be given by trial,in order to complete the thermal calculation. Take main fan as an example, the corrected speed and the beta line value are required to determine the corrected mass flow,pressure ratio and efficiency,so that the parameters of the fan outlet section can be calculated. These parameters can be defined as guess parameters.However,the engine operating state obtained by such ‘‘test” parameters may not completely satisfy the balance working conditions, so several balance equations need to be set to test and correct the guess parameters. The ACE has multiple operating modes, different operating modes and control schedule have different guess parameters and balance equations. In this paper, the correction of the component maps is implemented under the condition of 0 km, Ma=0, Mworking mode and the control schedule is to keep the physical rotational speed of the low-pressure rotor constant. Under this working mode and control schedule, there will be seven guess parameters, and seven balance equationsare shown as follow:
1) Flow compatibility of the HPT inlet.The calculated corrected mass flow Wof the HPT inlet shall be the same as the corrected mass flow Wobtained by interpolation on the HPT component map.
2) Power balance of the high-pressure rotor. The HPT,HPC and CDFS should meet the power balance conditions Lη=L+L, where ·is the mechanical efficiency of the HPT, Lis the power of HPT,Lis the power of HPC,and Lis the power of CDFS.
3) Flow compatibility of the LPT inlet.The calculated corrected mass flow Wof the LPT inlet shall be the same as the corrected mass flow Wobtained by interpolation on the LPT component map.
4) Power balance of the low-pressure rotor. In the Mworking mode, the Flade is in operation, so the LPT,the main fan and the Flade should meet the power balance conditions L·=L+L, where ηis the mechanical efficiency of the LPT, Lis the power of LPT, Lis the power of main fan, and Lis the power of Flade.
5) FVABI static pressure balance. In the Mworking mode, the MSV of the second bypass is open, and the airflow of the first bypass and the second bypass is mixed in the FVABI, the static pressure at the first bypass outlet Pshould be equal to the static pressure at the second bypass outlet P.
6) RVABI static pressure balance.The LPT outlet gas and mixture of the first and second bypass is mixed in the RVABI, and the static pressure at the outlet of the LPT Pis equal to the static pressure of the mixture P.
7) Nozzle throat section area balance: The calculated nozzle throat section area Ashould be equal to the actual engine nozzle throat section area A.
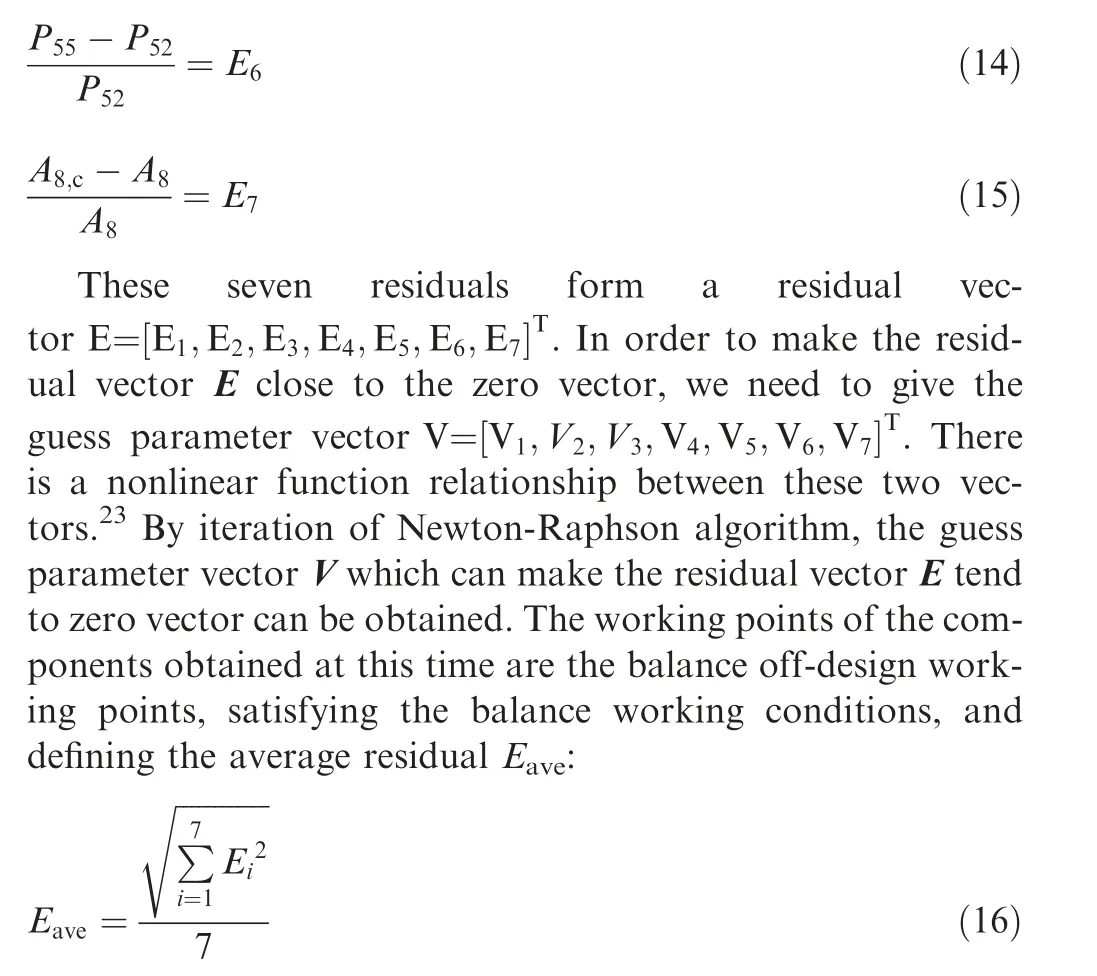
When the initial guess parameters are input, there is no guarantee that the seven balance equations are satisfied at the same time. Therefore, seven residual equations are generated corresponding to the seven balance equations, which can be seen in Eqs. (9)-(15), and the symbols are as shown in Table 2.It is only necessary to make Ereach the accuracy requirement, that is, the convergence condition is satisfied, and the iteration ends.The flow chart of the off-design solving process is given in Fig. 4.
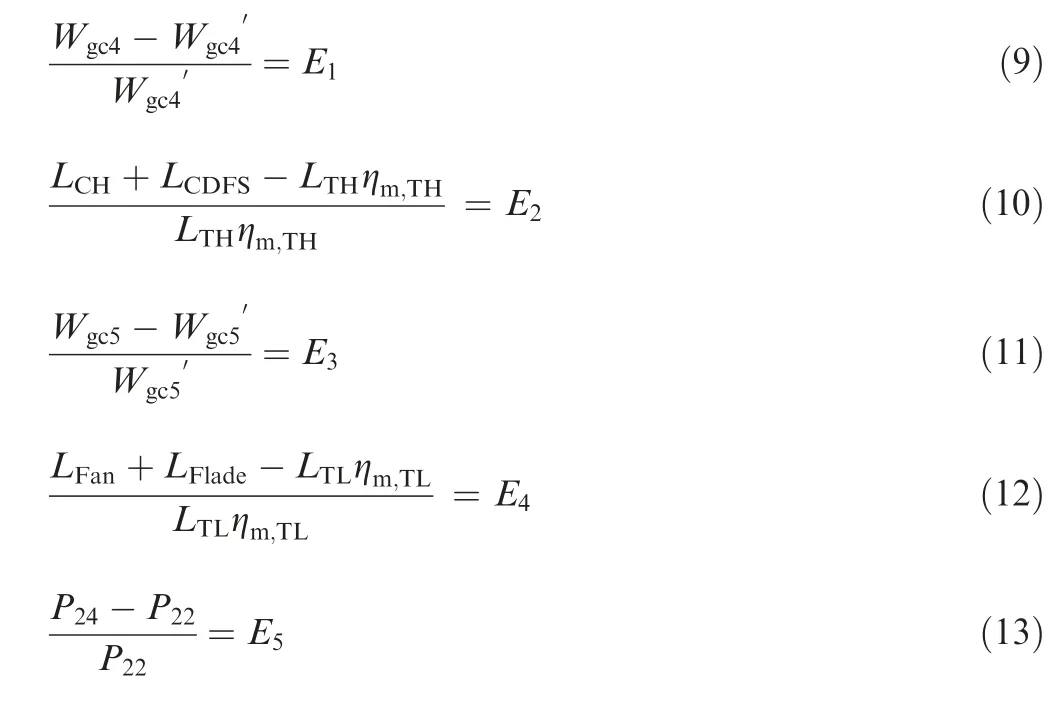
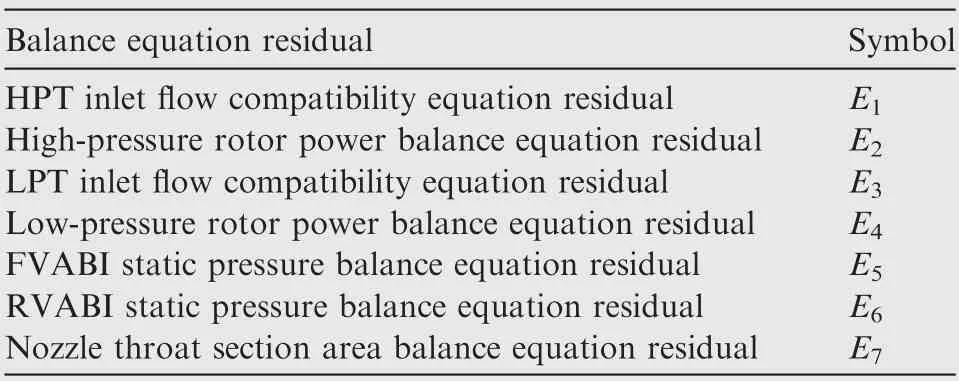
Table 2 Symbol corresponding to each residual.
3.4. Improvement of ACE engine off-design point solving model
The method proposed in this paper is based on the off-design working point solving process mentioned above, and some improvements need to be implemented so that the solving model can be used for component maps correction.
For the component maps to be corrected,a series of scaling factors values can be obtained during the calculation of design point: each compression components of ACE (Flade, main fan, CDFS and HPC) will get three scaling factors: the corrected mass flow scaling factors,the pressure ratio scaling factors and the efficiency scaling factors. Each turbine components will get two scaling factors: the work parameter scaling factors and the efficiency scaling factors. These scaling factors can change the shape of the component map.For convenience of description, the scaling factor vector is defined as SF:

The number of scaling factors n in the vector is determined by the number of components that need to correct.For example,when the component maps of the main fan and Flade both need to be corrected, n=6.
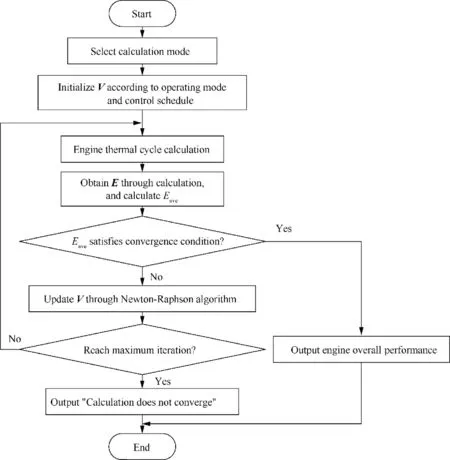
Fig. 4 Off-design performance solving process.
Both the component maps to be corrected and the target component maps can be used to obtain the corresponding ACE overall performance. Differences will appear between the results of the engine performance measurement parameters obtained by the two sets of component maps. defining measurement parameter as X, and an expression of the residual between the measurement parameters Ecan be given:
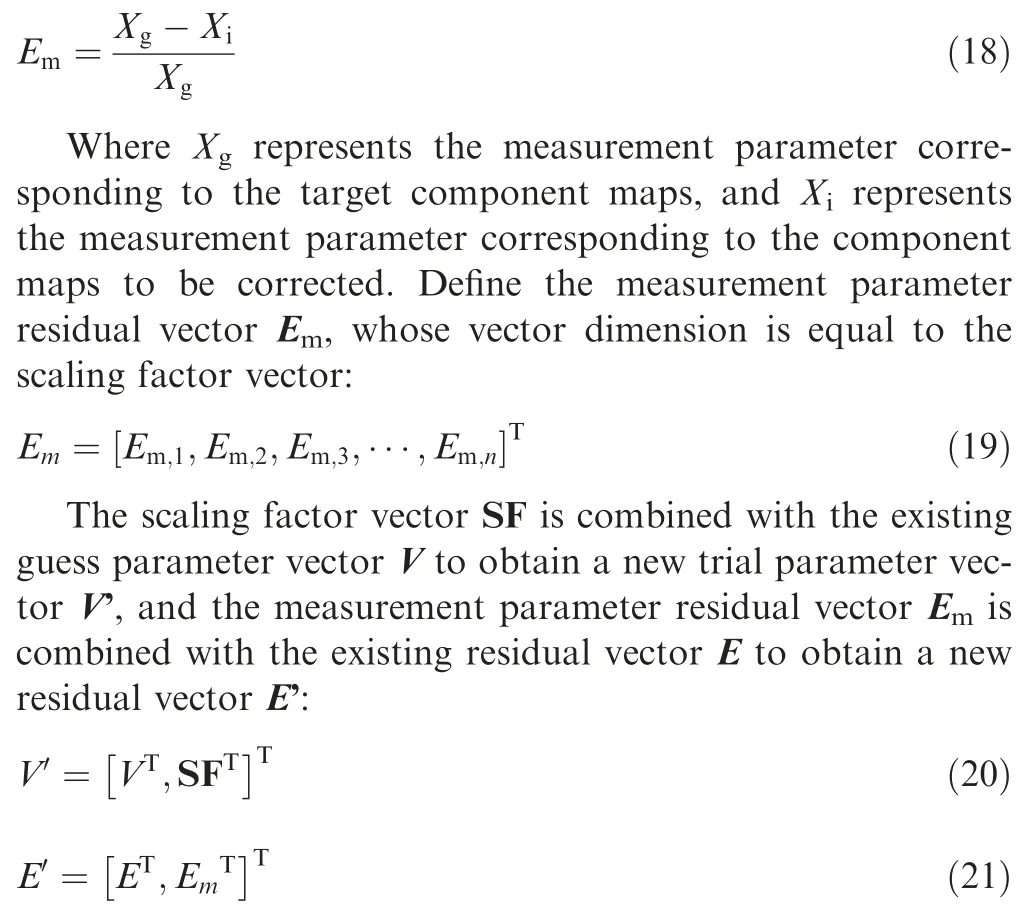
Taking V’ as a new independent variable and E’ as a new dependent variable, Through the Newton-Raphson iteration,the new guess parameter vector V’ which makes the E’ vector tend to zero vector is obtained, and a new balance off-design working point is obtained. Defining a new average residual E’:

When E’ reaches the accuracy requirement, that is, the calculation satisfies the convergence condition, the iteration ends. At this time, the off-design working point satisfies the balance working condition and the measurement parameter constraint condition, and the result contains the new component map scaling factors value. By correcting the working point using the new scaling factors and Eqs. (4)-(6), it is possible to approximate the component maps to the target ones.
3.5.Correction method for more working points on the corrected speed line
Through the method proposed in the previous section,the correction of the working point can be realized. However, if only the flight conditions, the using conditions and the control schedule are change to influence the working state of the engine, all the working points before and after the correction will only be on the same working line, If the component performance difference on the corresponding corrected speed line away from this working line is too large,it is difficult to ensure the correction accuracy over a wide range on the component map. Fig. 5 shows an example of correction result with one working point, the values in Fig. 5 are dimensionless, which is the ratio of the actual values to the design point values. It can be seen that away from this working point, the corrected map is still far away from the target map.
Therefore,adjusting the working line is necessary to obtain more working point correction results on the same corrected speed line to realize the overall correction of the component map.
In this paper,the method of adjusting the working line is to change the variable geometric parameters of the engine which can make the working line move upward or downward. For low-pressure rotor, adjusting the nozzle throat section area A,the LPT nozzle guide throat area Aand mixer bypass inlet area Acan change the working line of the main fain and LPT. For high-pressure rotor, changing the LPT nozzle guide throat area Aand HPT nozzle guide throat area Acan influence the position of CDFS, HPC and HPT. Therefore, by actively adjusting these variable geometric parameters, we can get more off-design working points on the same corrected speed line. Fig. 6 shows the trend of main fan working line change when adjusting A, where Arefers to the ratio of actual Ato the design value of A.
It should be noticed that some component characteristics in ACE are multi-angle characteristics, which means when adjusting the angle of component’s variable guide vanes, the component map will also change. In this paper, the angle of all variable guide vanes remains unchanged during the correction process. Under the control schedule of keeping constant low-pressure physical rotational speed and the consistent ambient conditions, we can adjust the working point position on the same corrected speed line, as shown in Fig. 6.
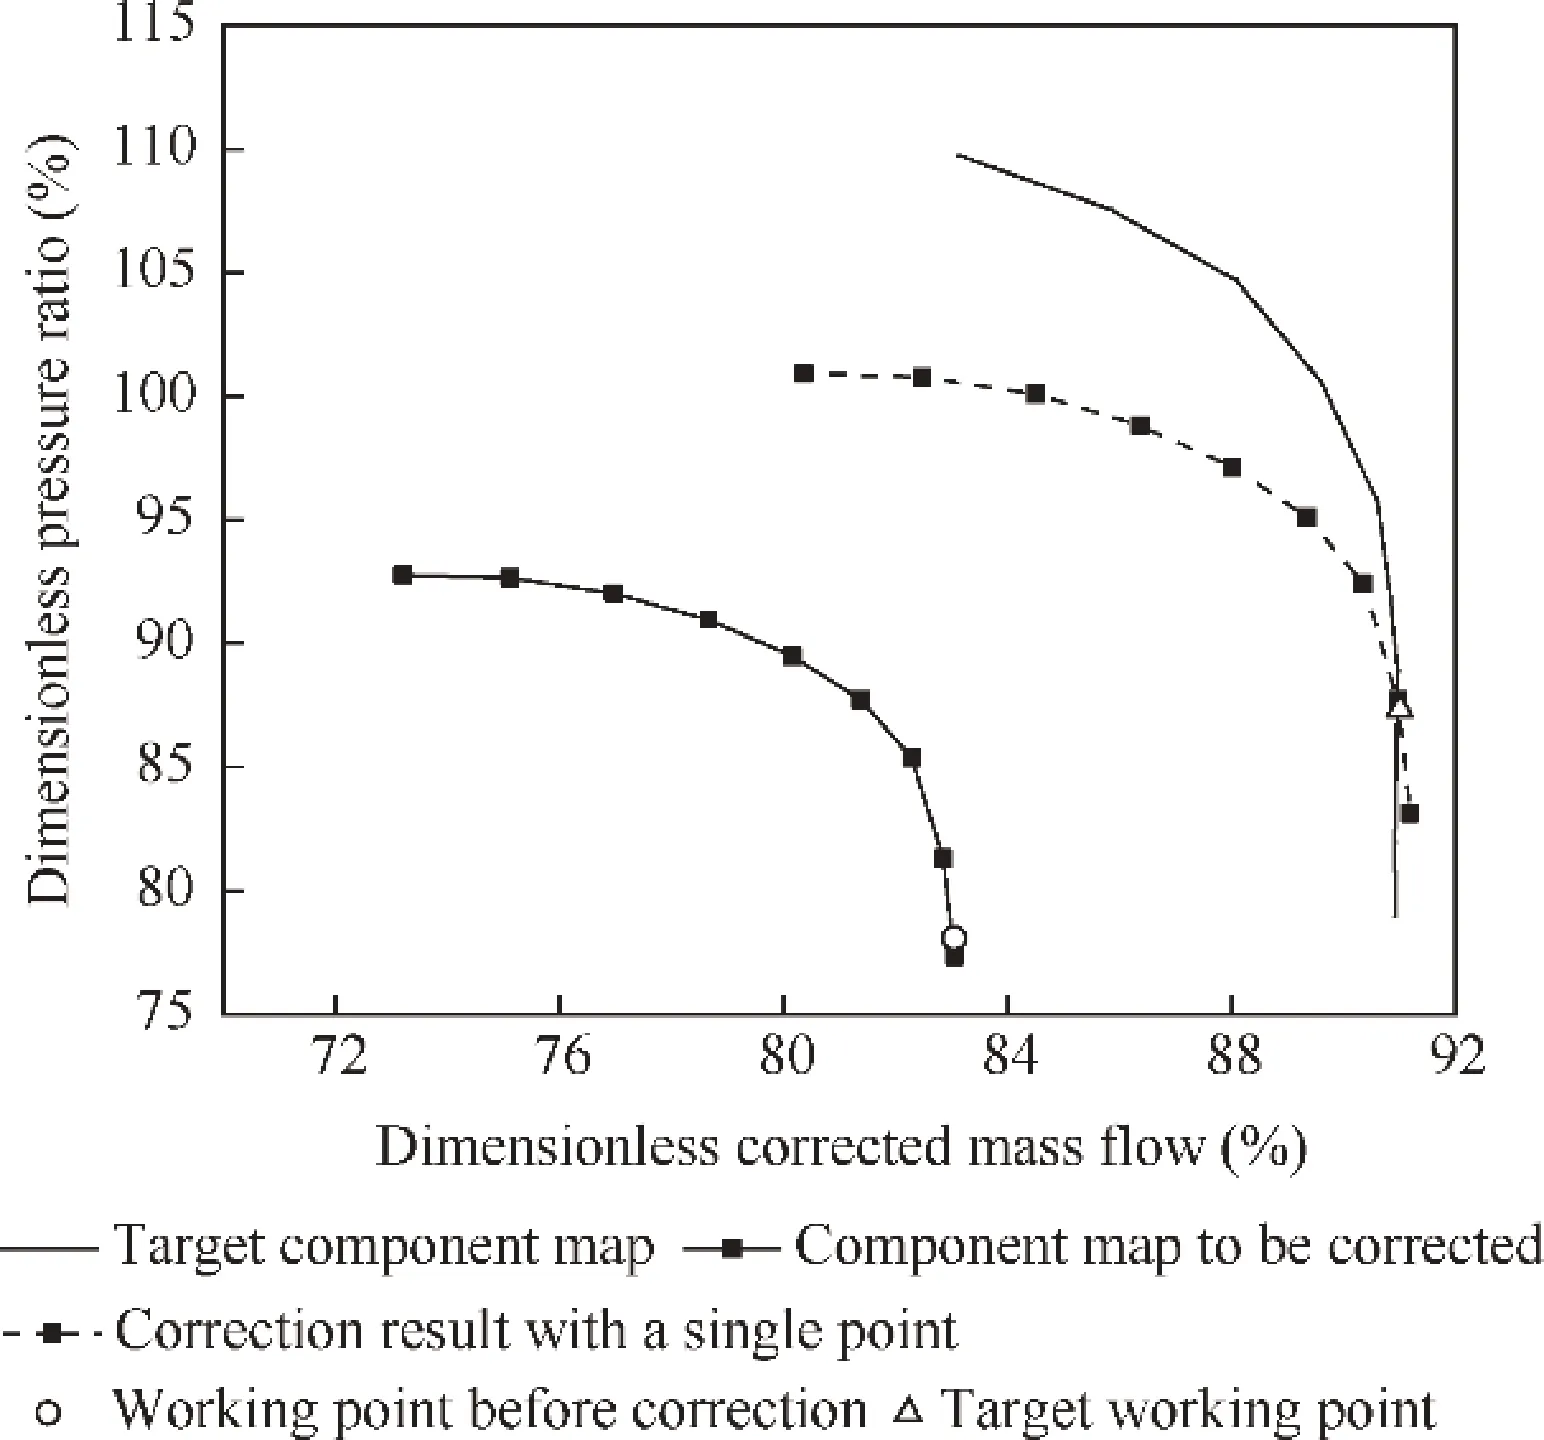
Fig. 5 Correction result with a single point.
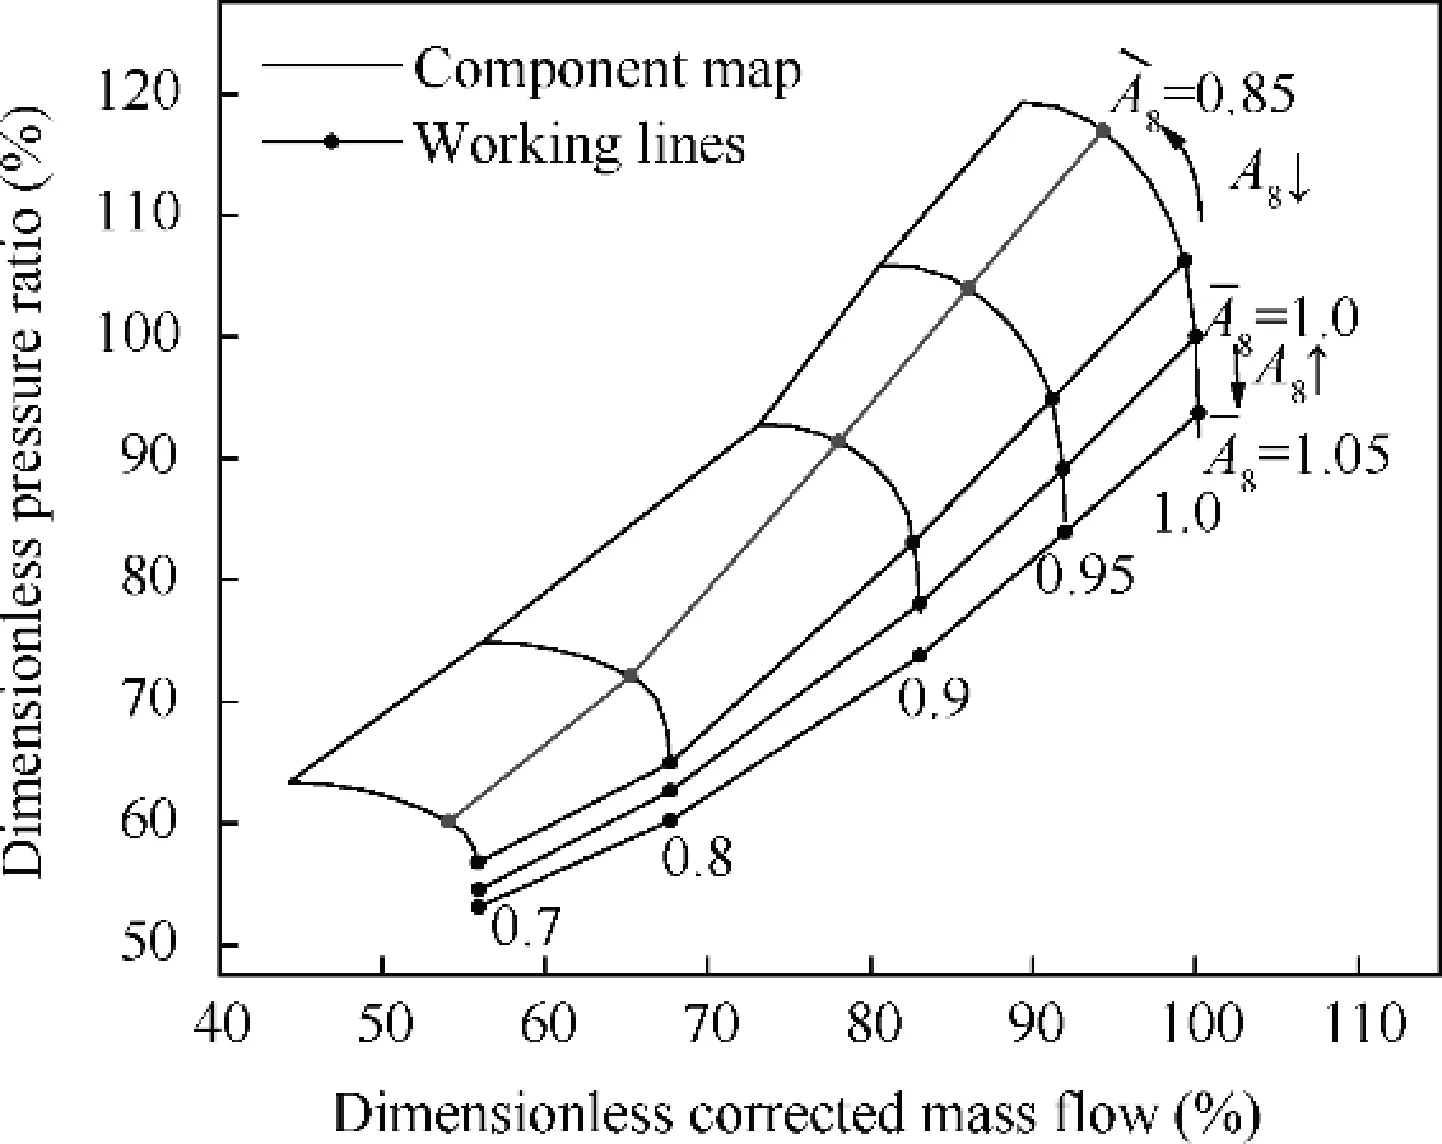
Fig. 6 Main fan working line movement trend when adjusting A8.
When the number of off-design working points is enough,the shape of the entire corrected speed line can be basically simulated, which looks like a ‘‘rotation” of the previous correction result of Fig. 5. This correction idea is shown in Fig. 7. When the corresponding off-design working points on the corrected speed line of the two sets of component maps are corrected by the algorithm, the quantitative relationship between the two groups of component maps can be established, that is, the purpose of making the characteristics of the component to be corrected close to the target component characteristics can be achieved.
4. Application of component map correction method in ACE
4.1. Comparison of two sets of initial component maps
Because ACE is still in the pre-research stage,this paper selects two sets of existing engine component maps as the component maps of ACE. After scaled at the design point, one set represents the ‘‘target component maps” and the other represents‘‘component maps to be corrected”. Our goal is to modified the‘‘ component maps to be corrected ”to be as close as possible to the ‘‘target component maps” by the correction method. Figs. 8-10 show a comparison of the two component maps of the ACE main fan, CDFS, and HPC. The values in these figures are dimensionless,which is the ratio of the actual values to the design point values.
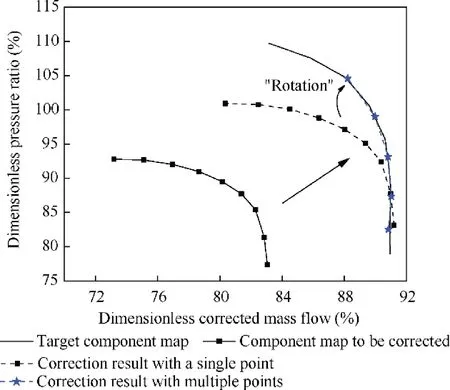
Fig. 7 Schematic diagram of multiple points correction.
It can be seen from Figs.8-10 that the component maps of the main fan are the most different among the three components. It is found through calculation that the engine thrust calculated from the two sets of component maps (containing only different main fan), the difference at the same working point can be up to 10%.The difference in engine performance caused by different CDFS and high-pressure compressors is only about 1%.
From Fig. 8, we can analyze the reasons for the above results. Although the main fan component map is modified at the design point by the initial scaling factors, in the wide range of off-design point area deviating from the design point,the characteristics of the two groups still have large differences at different corrected speeds, resulting in a large difference in engine performance when working at off-design points. For CDFS or HPC,after modified at the design point,the two sets of component maps are very close overall,and the component characteristics at the off-design point are almost the same as well, so there is almost no difference in engine performance.For the method proposed in this paper, it is decided to select the main fan as an example to introduce the component map correction method. This method is also applicable to other components.
4.2. Sensitivity analysis of measurement parameters
In the ACE steady-state performance model, the parameters determining the shape of the main fan component maps are the three component characteristic scaling factors: pressure ratio scaling factor,corrected mass flow scaling factor and efficiency scaling factor. For convenience of explanation, three parameters are used to represent these three scaling factors:SFstands for pressure ratio scaling, SFfor corrected mass flow scaling factor and SFfor efficiency scaling factor.To find the relationship between engine performance and main fan component characteristics,a quantitative relationship between engine performance measurement parameters and three scaling factors needs to be established. For ACE, similar to conventional aero engines, there are many measurement parameters that reflect engine performance, such as total temperature and total pressure of critical sections, high- and low-pressure rotor speeds,and so on.For the above-mentioned relationships to be established, we should first find the engine performance measurement parameters that have a strong relationship with these three scaling factors. Therefore, A sensitivity analysis of the measurement parameters needs to be performed at first. Figs. 11 and 12 show the trends of several engine measurement parameters when the three scaling factors are changed by 1% and 5%, respectively. The measurement parameters selected for sensitivity analysis are listed in Table 3.
It can be seen from Figs.11 and 12 that when scaling factor,that is, the independent variable changes by 1% and 5%,respectively, each measurement parameter, that is, the dependent variable has the same change trend, but the degree of change is different.Under the same independent variable variation, the larger the variation of the dependent variable, the more sensitive the measurement parameter is to the change of the scaling factor.It can be seen from the figure that the fuel flow W, the HPC outlet total pressure Pand the main fan outlet total pressure Pare the three measurement parameters most sensitive to the variation of the three scaling factors.Therefore, we select these three engine performance measurement parameters as the target of the correction. By correcting the three component map scaling factors of the ‘‘component maps to be corrected”, the values of the three measurement parameters are approximated to the values of the corresponding measured parameters obtained by the ‘‘target component map”, and the purpose of correcting the component maps can be achieved.
4.3. Correction method for main fan
In the process of correcting component maps, the two sets of component map should be first brought into the calculation model to calculate the corresponding engine performance and obtain a series of measured parameter values. The engine performance measurement parameters obtained from the two sets of component maps are different at off-design points,including the three measurement parameters mentioned above:fuel flow W,HPC outlet total pressure P,and main fan outlet total pressure P. Then, the error between the three measurement parameters can constitute three new residuals E,Eand E, three component performance scaling factors SF,SF, SFconstitute three new guess parameters independent variables V, Vand V. The three new residual expressions are:
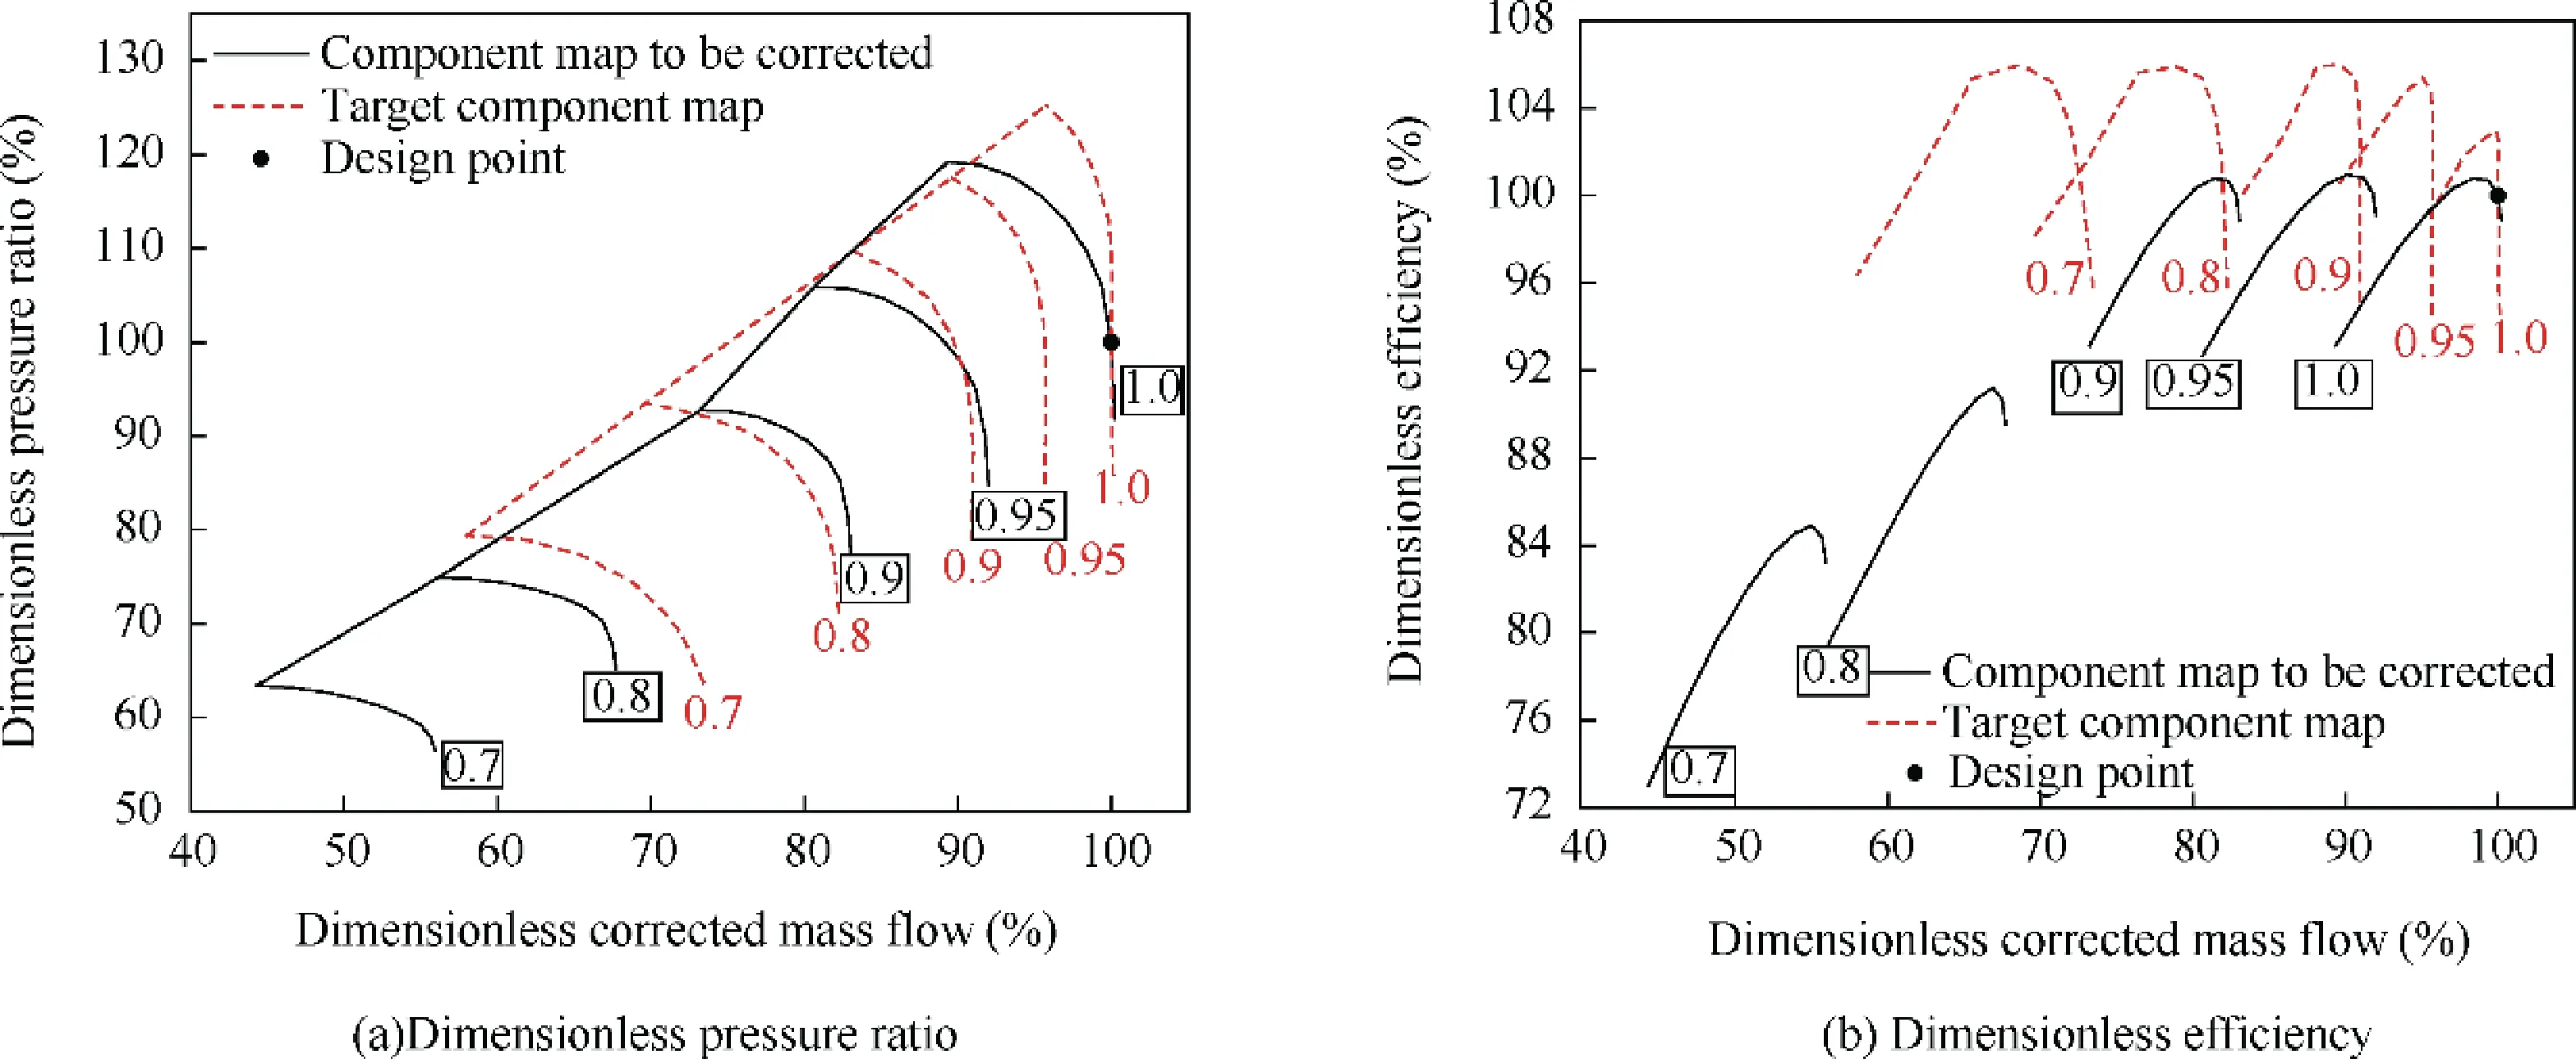
Fig. 8 Component maps of main fan.
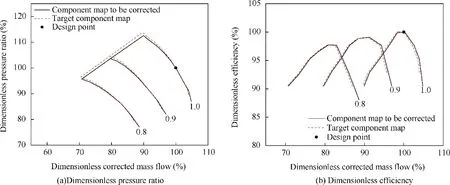
Fig. 9 Component maps of CDFS.
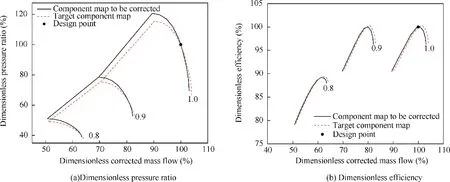
Fig. 10 Component maps of HPC.
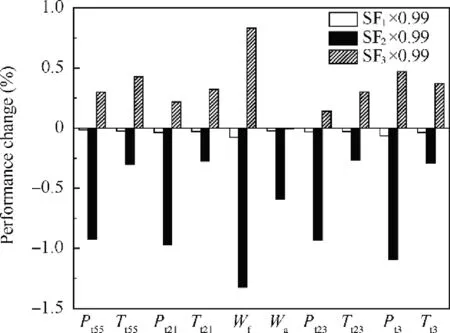
Fig.11 Sensitivity analysis(scaling factors are changed by 1%).

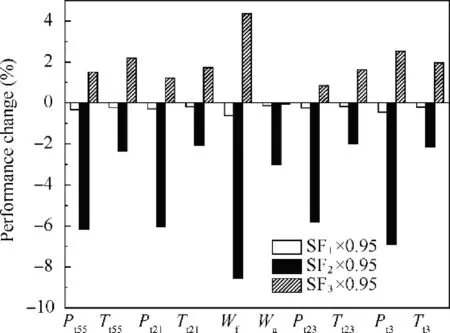
Fig.12 Sensitivity analysis(scaling factors are changed by 5%).

Among them, W, P, Prepresent the fuel flow, the HPC outlet total pressure, and the main fan outlet total pressure calculated by the ‘‘component maps to be corrected”.W, P, Prepresent the fuel flow, the HPC outlet total pressure, and the main fan outlet total pressure calculated by the ‘‘target component maps”.
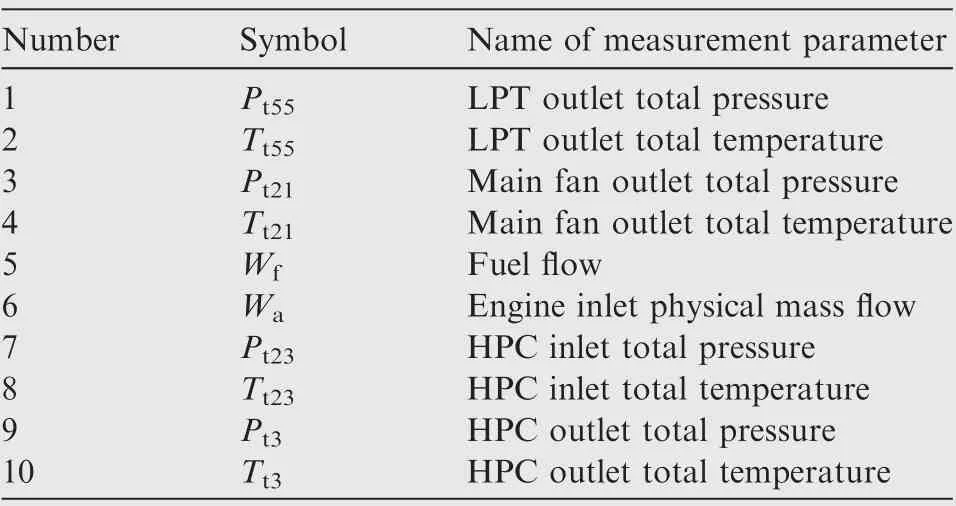
Table 3 Measurement parameter symbols and corresponding names.
The new guess parameter vector can be obtained from Eq.(20):
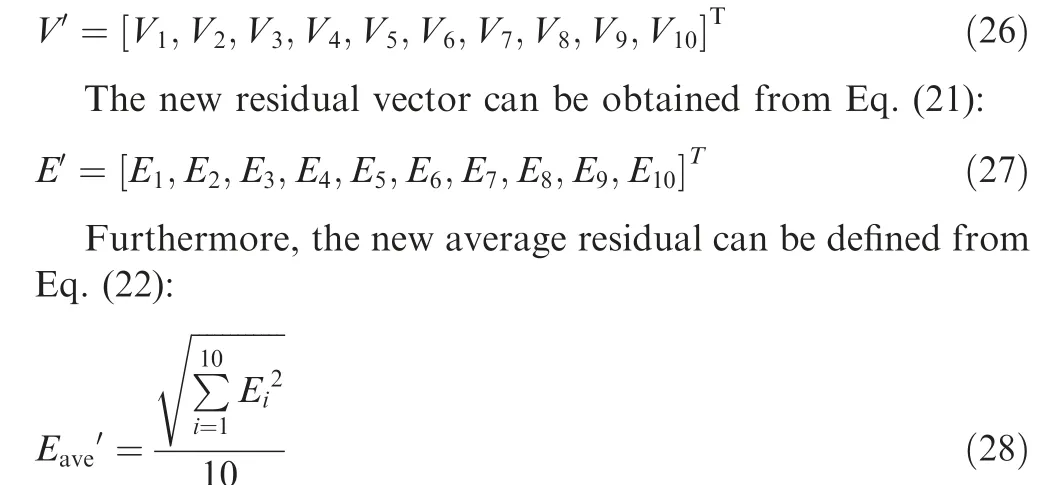
When this new average residual satisfies the convergence condition, the iteration of model ends.
In Fig. 8, ‘‘component maps to be corrected” has been scaled once at the design point, and the initial values of the three component characteristic scaling factors SF, SF, and SFare defined as SF,SFand SF,the values are shown in Table 4.
4.4. Calculation results and analysis
This section mainly introduces the correction results obtained by the new component map correction method for the main fan.
(1) Correction results on the same working line
First, defining the nozzle throat section area adjustment factor as φin Eq. (29):

when φand other variable geometry parameters remain the same, the off-design working line of the engine components is uniquely determined. In different flight states, the offdesign working points of the engine components only move on the working line. First, given φ=1.0, by controlling the flying height to 0, Ma=0, and changing the rotational speed of the low-pressure rotor in the control schedule, the correction results of multiple off-design working points on the same working line can be obtained in Fig.13,the data in the figure is dimensionless.
As shown in Fig.13,an off-design working point is selected on each corrected speed line of the ‘‘component map to becorrected”. the ‘‘△” symbol represents the corresponding corrected position of the off-design working point on the‘‘component maps to be corrected”.It can be seen from the Fig.13 that the corrected off-design working point basically falls on the‘‘target component map”. The deviation between the two sets of component characteristics before and after correction is shown in Tables 5 and 6.

Table 4 Initial value of main fan scaling factors.
Tables 5 and 6 show that the correction results are basically coincident with the target value. The maximum error is about 0.8%,which is more than 20%before correction.The working point No. 5 is located on the corrected speed line where n=1.0, which is the design point. Since the two sets of component map are initially scaled at the same design point, the component characteristic at working point No.5 are the same.
Table 7 shows the new value of the three scaling factors after the correction of the five working points. Fig. 14 shows the change in the three scaling factors as a function of the relative corrected speed.

As shown in Table 7,under the constraints of the three performance measurement parameters, the new component characteristic scaling factors are obtained for each working point.When the method is applied to correct the component maps,it is only necessary to use the corresponding scaling factors to correct the corresponding working point,and the new position of the off-design working point is the target one. The results of Fig. 14 show that the three scaling factors are substantially monotonic with the change in the relative corrected speed.
(2) More correction results of off-design working points after changing φ.
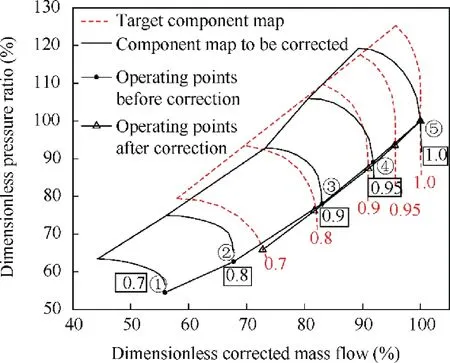
Fig. 13 Correction results of component maps on the same working line.
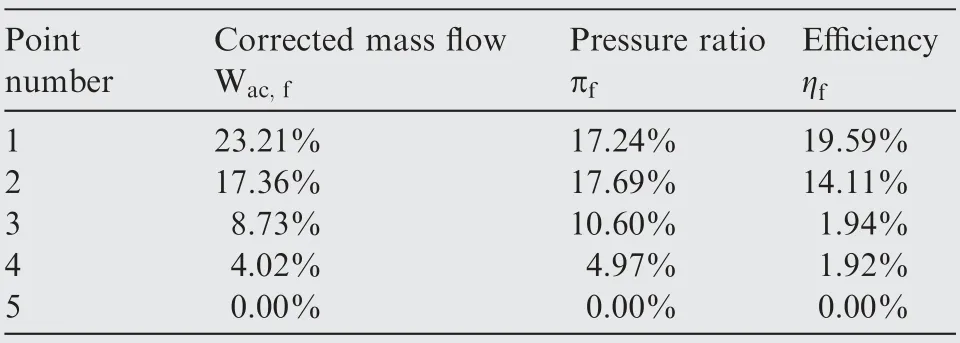
Table 5 Corresponding working point performance error before correction.
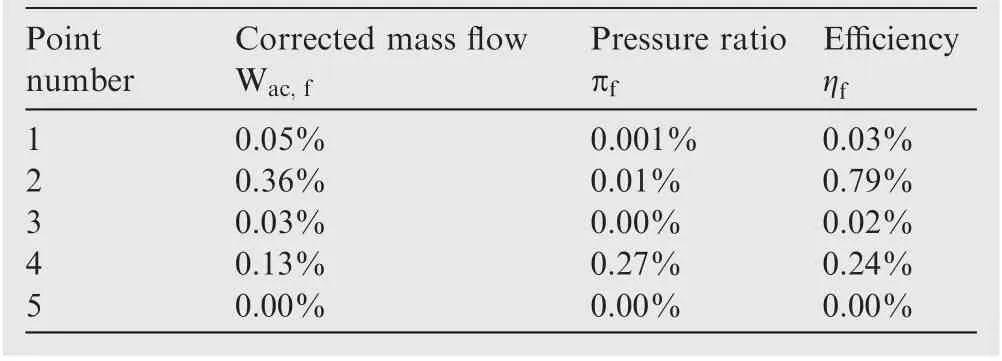
Table 6 Corresponding working point performance error after correction.
In order to obtain more working point correction results,the variable geometric parameters need to be adjusted. On the basis of the correction of a single working line, the main fan working line is changed by adjusting φto obtain the correction result of more off-design working points on the same corrected speed line. Figs. 15 and 16 show the correction results of the main fan ‘‘component maps to be corrected” in different φ. It should be noticed that the data in the figure is dimensionless,and the data is the ratio of actual component characteristics to the design component characteristics.
On each corrected speed line,5-6 off-design working points are selected for correction, at each point, the position of the corrected off-design working point and the new component characteristic scaling factor are calculated. The shape of the corrected speed line can be corrected or predicted by correcting a plurality of off-design working points on the same line, and the corrected component map can be obtained after several corrected speed lines are corrected properly.
It can be seen from Figs. 15 and 16 that the corrected offdesign working point of the ‘‘component maps to be corrected” basically coincides with the target value. Tables 8 and 9 show the error comparison before and after the correction on the same corrected speed line by different φ. The n=0.9 relative corrected speed line is used as an example to illustrate.
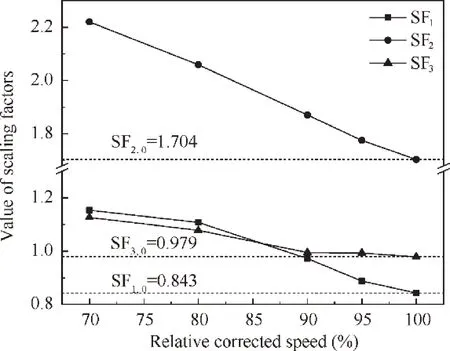
Fig.14 Scaling factor value after correction of the same working line.
Figs.17 and 18 show the corresponding correction relationship between five off-design working points on the same relative corrected speed line n=0.9 (the numbers in the figure correspond to the numbers of the working points in Tables 8 and 9). The corrected off-design working points can basically describe the shape of the‘‘target component maps”,the correction method establish the quantitative relationship between the two component maps.
It can be seen from Tables 8 and 9,Figs.17 and 18 that the correction of the relative corrected speed line n=0.9 has achieved the intended purpose, and the maximum correction error of the five off-design working points is below 0.3%.The correction results obtained for other corrected speed lines are similar, and the maximum correction error is below 1%.
(3) Correction results of the corrected thrust and SFC
Thrust and SFC are the most important parameters to measure the performance of aero-engine. The proposed correction method takes the engine performance measurement parameters as the target and approximates the ‘‘component maps to be corrected” to the ‘‘target component maps”. The calculation results show that the corrected measurement parameters and the off-design working points of the components have reached the expected target, and the error is below 1%. In the process of correction, the thrust and SFC of the engine have also been corrected. Fig. 19 show the calculation results,the values in Fig. 19 are dimensionless.
Fig. 19 show the results of the correction of the thrust and SFC under the control of different nozzle area section adjustment factors φ. It can be seen from the figure that the thrust and SFC correction results under various working conditions have reached the expected target. After the ‘‘component mapsto be corrected” is corrected to approximate the ‘‘target component maps”, the thrust and SFC of the engine at the corresponding off-design working point are also corrected at the same time,and the maximum correction error is less than 1%.

Table 7 Scaling factor values after correction.
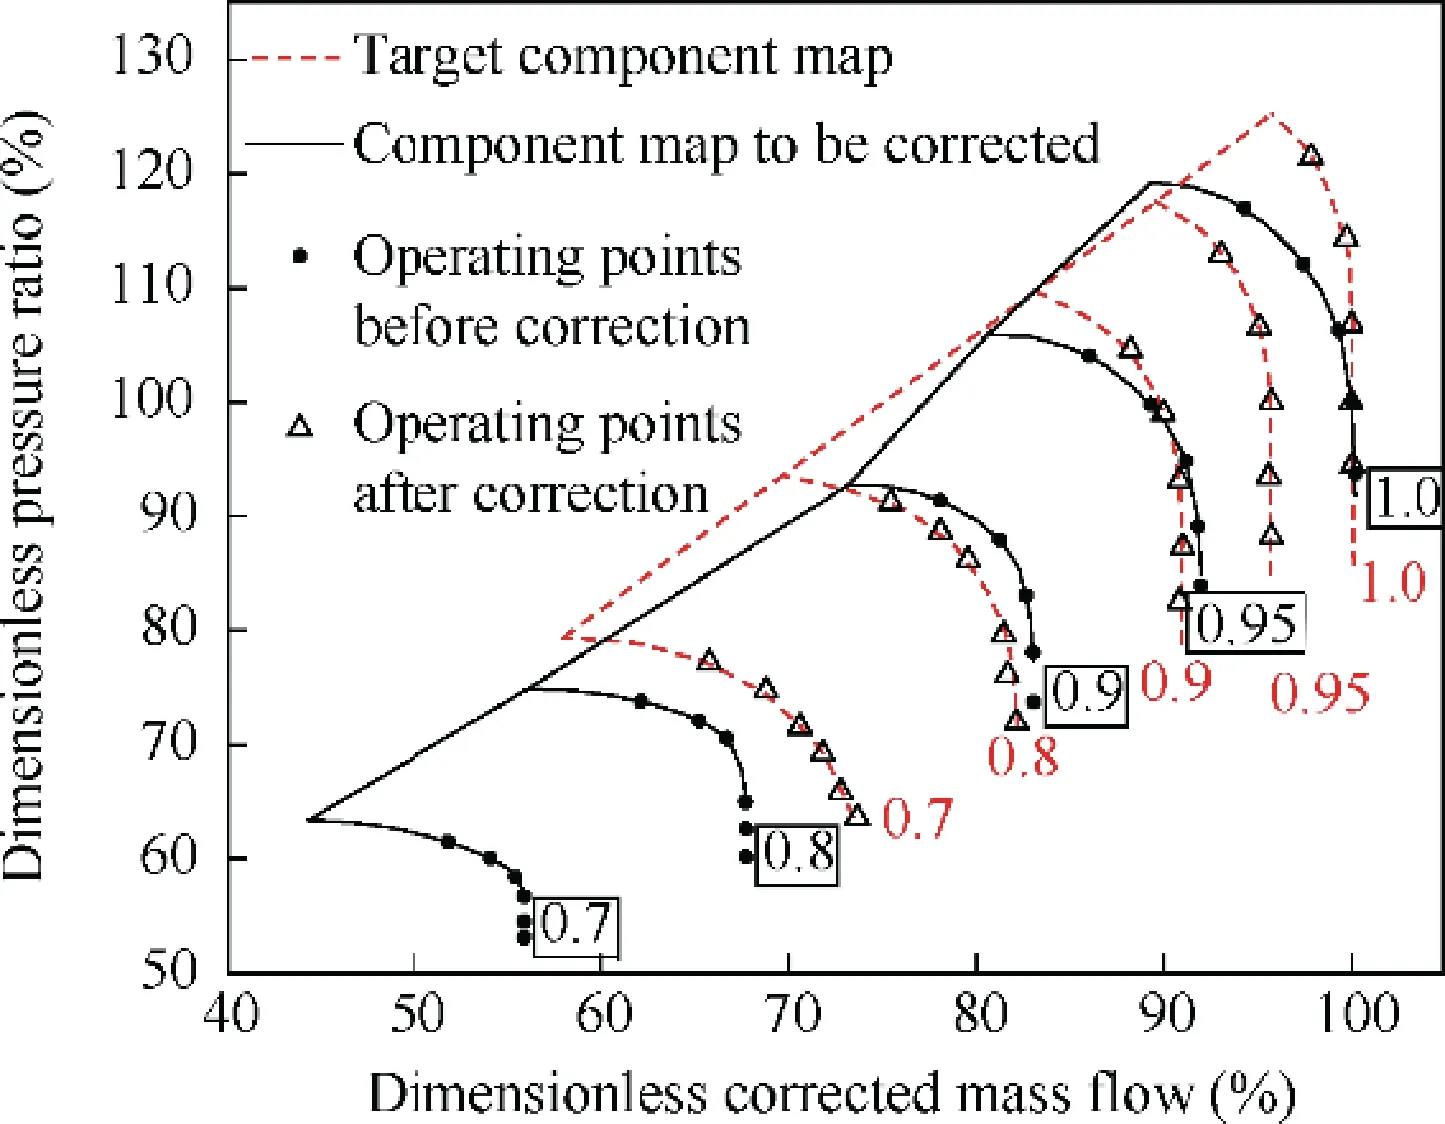
Fig. 15 Main fan pressure ratio correction result.
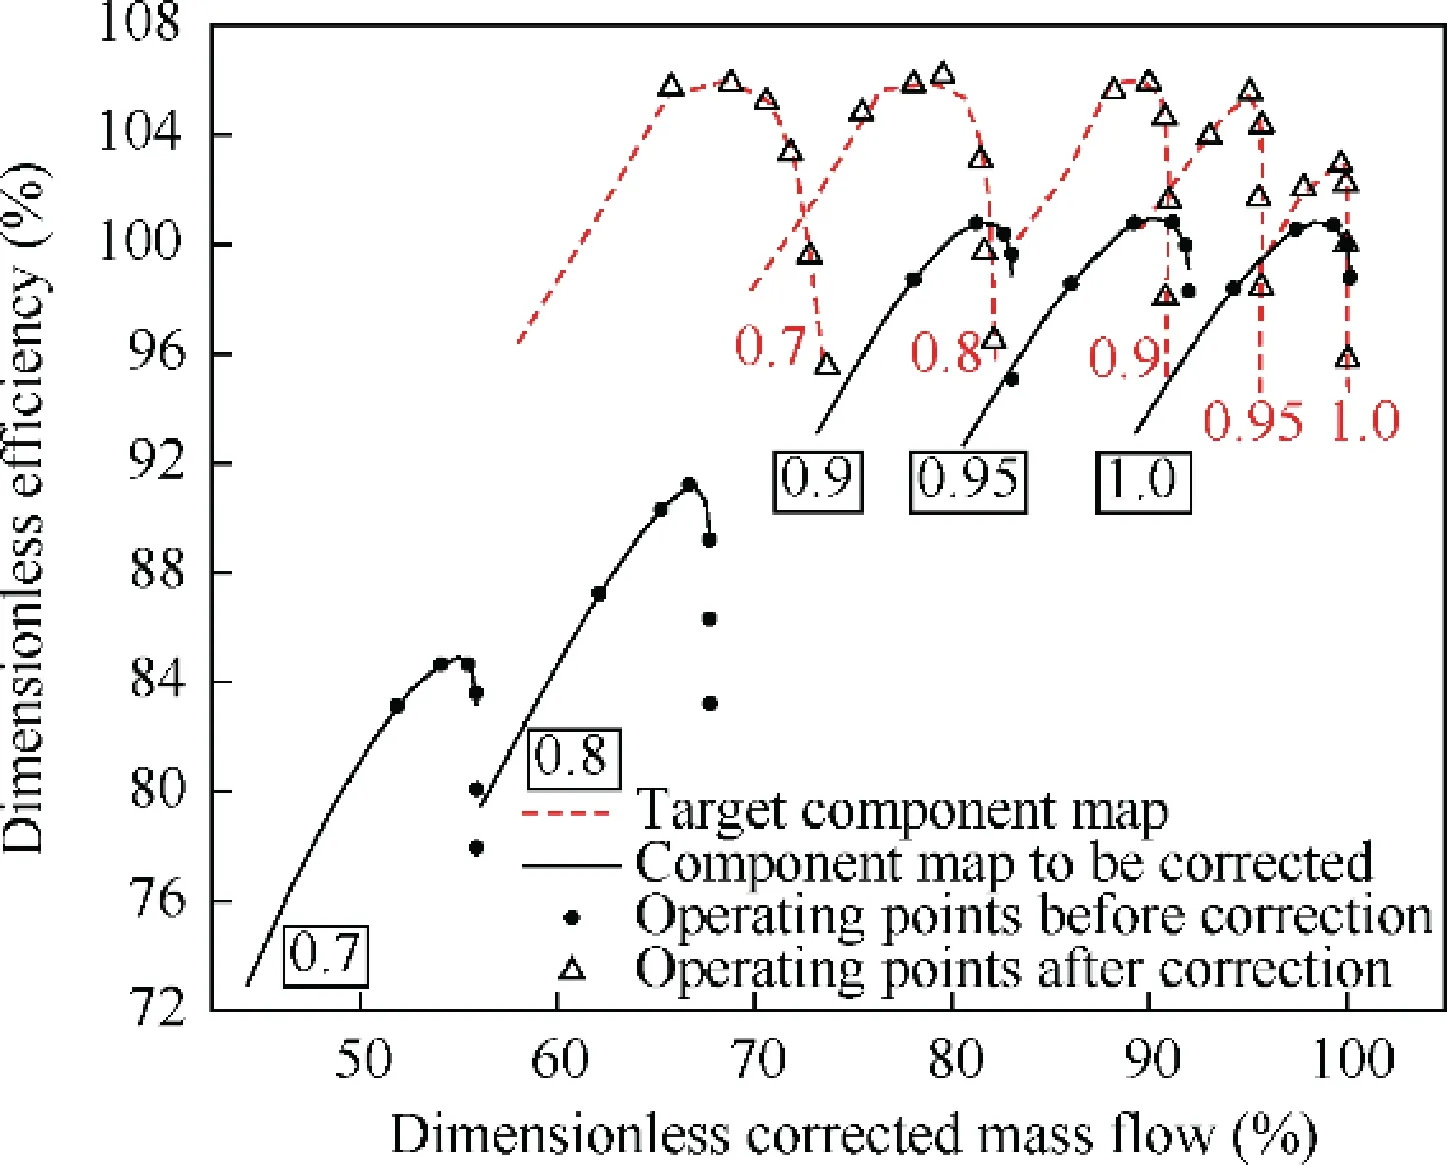
Fig. 16 Main fan efficiency correction result.
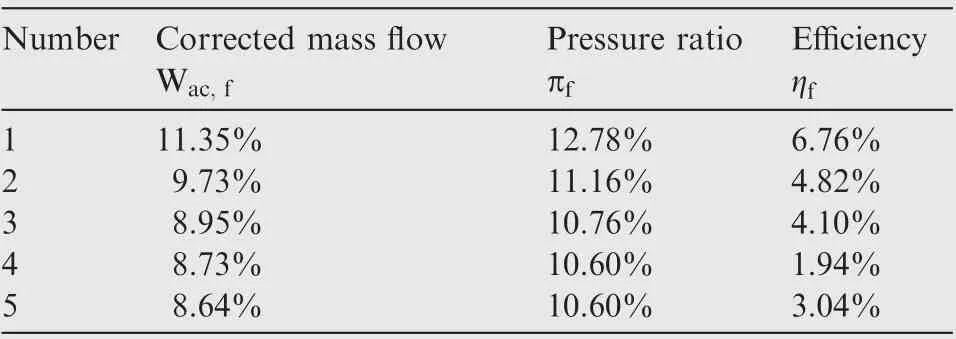
Table 8 Corresponding working point performance error before correction (n-cor=0.9).
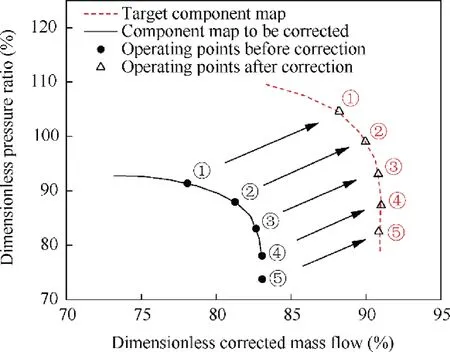
Fig. 17 n-cor=0.9 pressure ratio correction.
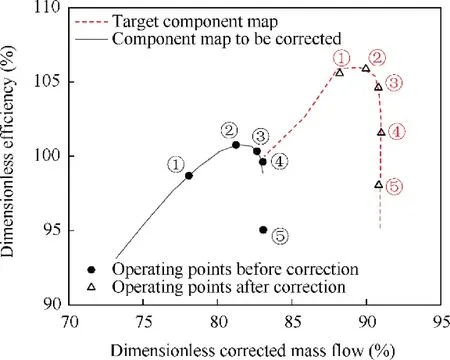
Fig. 18 n-cor=0.9 efficiency correction.
Through the above calculation of the ACE main fan,it can be seen that the new proposed correction method has reached the expected target. That is, using the engine performance measurement parameters obtained by target component maps to predict and correct the maps of the component. so that the component maps that need to be corrected can more accurately describe the actual component characteristics of the engine.
5. Conclusions
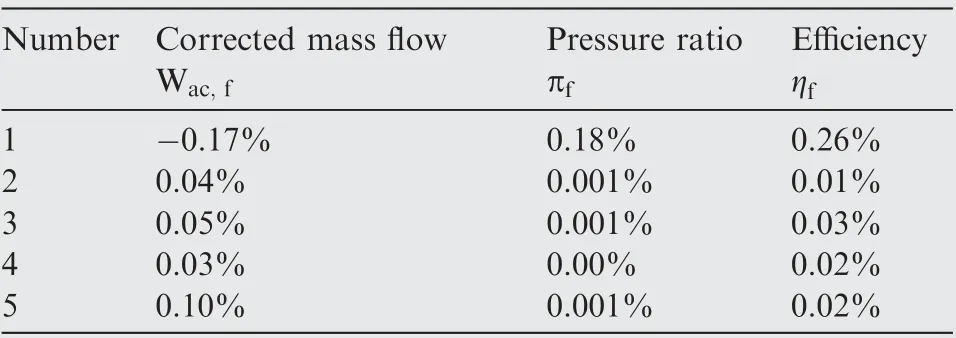
Table 9 Corresponding working point performance error after correction (n-cor=0.9).
A new method for correcting component maps is presented in this paper, in order to reduce the error between component characteristics used in the calculation model and the actual component performance.This new method integrates the variable geometry parameters into the component maps correction process,so that more working points correction results can be obtained and more accurate modified component maps. This method has a good application on ACE The conclusions are shown below:
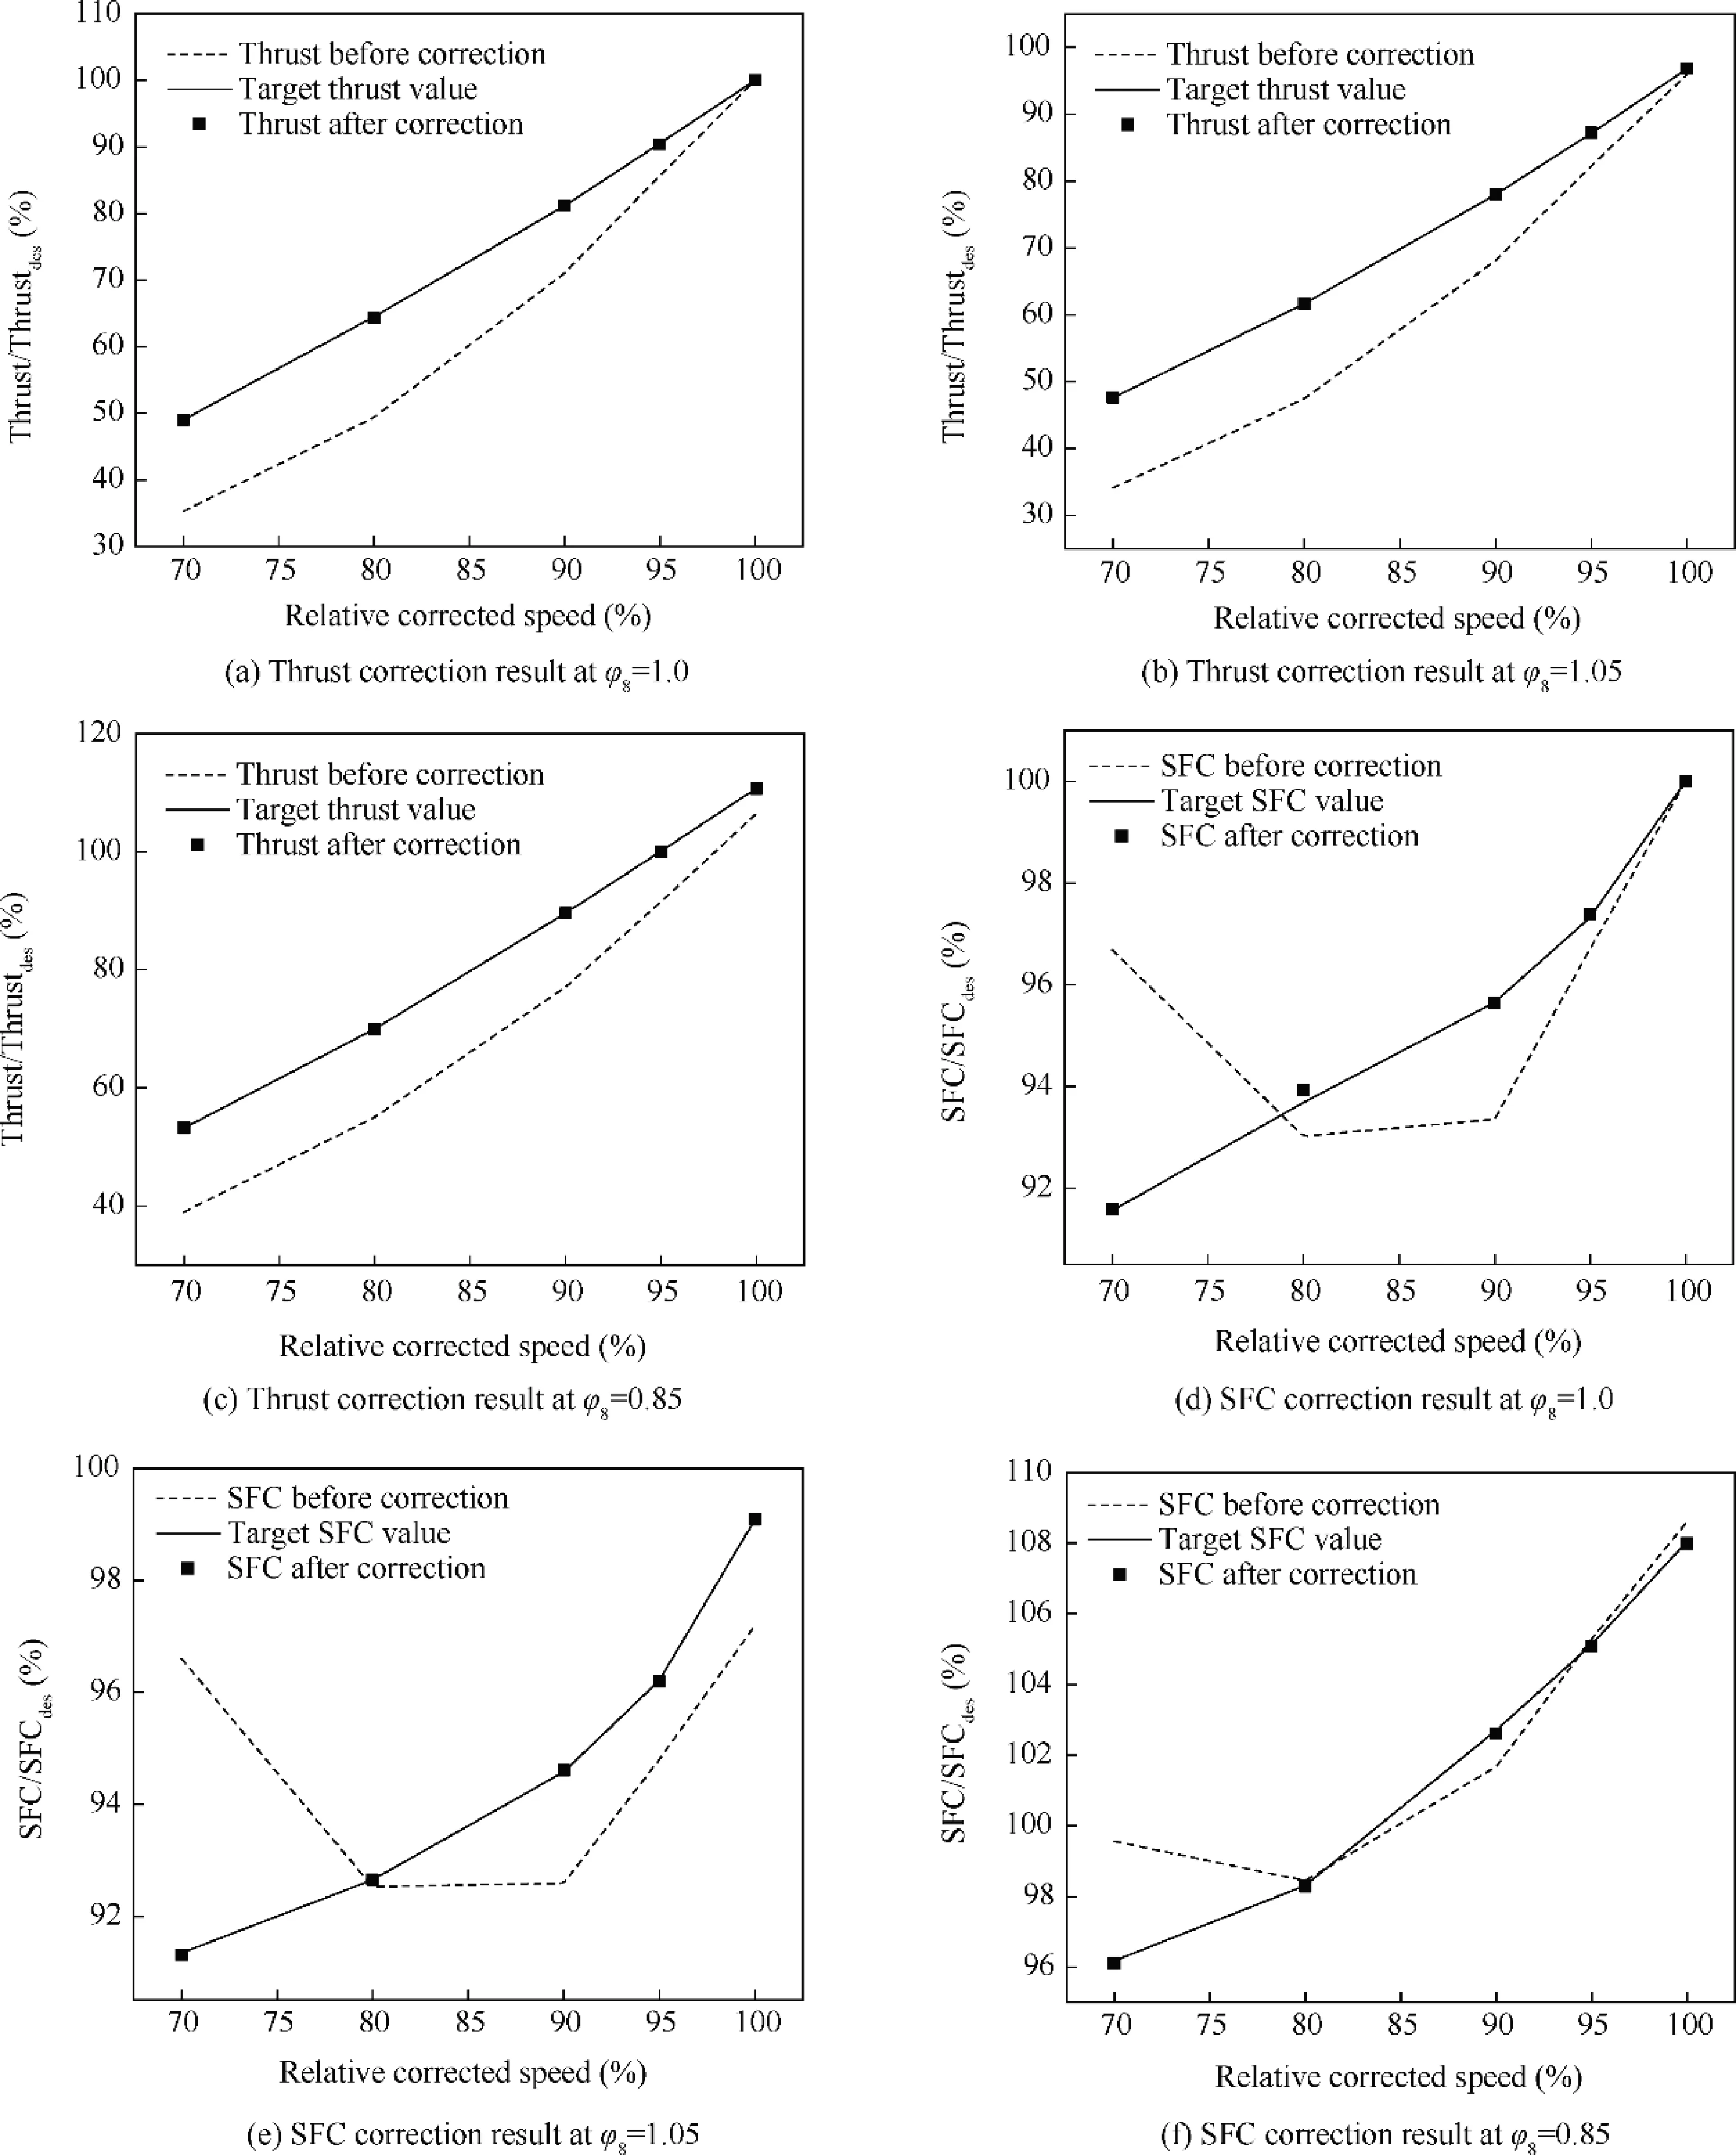
Fig. 19 Thrust and SFC correction result at different φ8.
(1) The new correction method establishes the quantitative relationship between engine performance and component characteristic, which can correct or predict more accurate component maps that close to actual component performance. The method improves the engine off-design working point solving model, adds parameters which can determine the shape of component maps(e.g. scaling factors) to the guess vector and integrates the engine performance measurement parameters into the constraint of the off-design working point solution.There is no need to establish specific model for parameters that control the component maps, the solving process is synchronized with the engine off-design working point solving process.This advantage can guarantee faster calculation speed and more accurate correction results.
(2) By applying the variable geometry parameters of an aero-engine into the improved performance model, this correction method can realize component map correction over a wider range far away from the design point.More working points on the same corrected speed line are corrected by adjusting some variable geometry parameters, and the shape of the component map can be simulated by these corrected working points.
The method is implemented into ACE performance model by taking the main fan stage of ACE as an example, and get good correction results. The maximum correction error for the main fan component map is below 1%.
This method can provide reference for the adjustment of the component maps and the correction of the engine model,and can be used for engine condition monitoring and fault diagnosis to provide an accurate correction for the applied engine performance model.
Declaration of Competing Interest
The authors declare that they have no known competing financial interests or personal relationships that could have appeared to influence the work reported in this paper.
Acknowledgement
sThis research was funded by National Nature Science Foundation of China (NSFC) (Nos. 51776010, and 91860205). The author is thankful for the support from Collaborative Innovation Center of Advanced Aero-Engine, china.
 CHINESE JOURNAL OF AERONAUTICS2021年4期
- CHINESE JOURNAL OF AERONAUTICS的其它文章
- Time delay compensation in lateral-directional flight control systems at high angles of attack
- Dual stability enhancement mechanisms of axial-slot casing treatment in a high-speed mixed-flow compressor with various tip clearances
- Development cost prediction of general aviation aircraft using combined estimation technique
- Improvement on shaped-hole film cooling effectiveness by integrating upstream sand-dune-shaped ramps
- Modeling and parameter identification of linear time-varying systems based on adaptive chirplet transform under random excitation
- An experimental method to obtain the hard alpha anomaly distribution for titanium alloy aeroengine disks
