Multiple air route crossing waypoints optimization via artificial potential field method
Bizho PANG, Wei DAI, Xinting HU, Fuqing DAI, Kin Hut LOW,*
a School of Mechanical and Aerospace Engineering, Nanyang Technological University, Singapore 639798, Singapore
b Air Traffic Management Research Institute, Nanyang Technological University, Singapore 637460, Singapore
c School of Air Traffic Management, Civil Aviation University of China, Tianjin 300300, China
KEYWORDS Adaptive method;Air route network;Air traffic control;Potential field;Structure optimization
Abstract Air route crossing waypoint optimization is one of the effective ways to improve airspace utilization, capacity and resilience in dealing with air traffic congestion and delay. However,research is lacking on the optimization of multiple Crossing Waypoints (CWPs) in the fragmented airspace separated by Prohibited,Restricted and Dangerous areas(PRDs).To tackle this issue,this paper proposes an Artificial Potential Field(APF)model considering attractive forces produced by the optimal routes and repulsive forces generated by obstacles. An optimization framework based on the APF model is proposed to optimize the different airspace topologies varying the number of CWPs,air route segments and PRDs.Based on the framework,an adaptive method is developed to dynamically control the optimization process in minimizing the total air route cost. The proposed model is applied to a busy controlled airspace. And the obtained results show that after optimization the safety-related indicators: conflict number and controller workload reduced by 7.75% and 6.51% respectively. As for the cost-effectiveness indicators: total route length, total air route cost and non-linear coefficient,declined by 1.74%,3.13%and 1.70%respectively.While the predictability indicator, total flight delay, saw a notable reduction by 7.96%. The proposed framework and methodology can also provide an insight in the understanding of the optimization to other network systems.
1. Introduction
As the number of civil aviation transport increases rapidly in recent years, the demand for airspace resources is getting greater. The air transport volume of China, for instance,increases at an annual speed of over 10% in the past decade,whereas the growth of Air Route Network (ARN) is less than 3.5%.Such unmatched growth of ARN widens the gap between the supply and demand of airspace resources, which would cause severe air traffic congestion and flight delays.The implementation of Required Navigation Performance(RNP),Free Routing Airspaceand other new operational schemes have provided new opportunities to unlock the potential of airspace. There are, however, many regions and countries unable to support the new approaches in a short-term period. In most regions, flight operations still rely on traditional ARN which is based on fixed navigation facilitates.
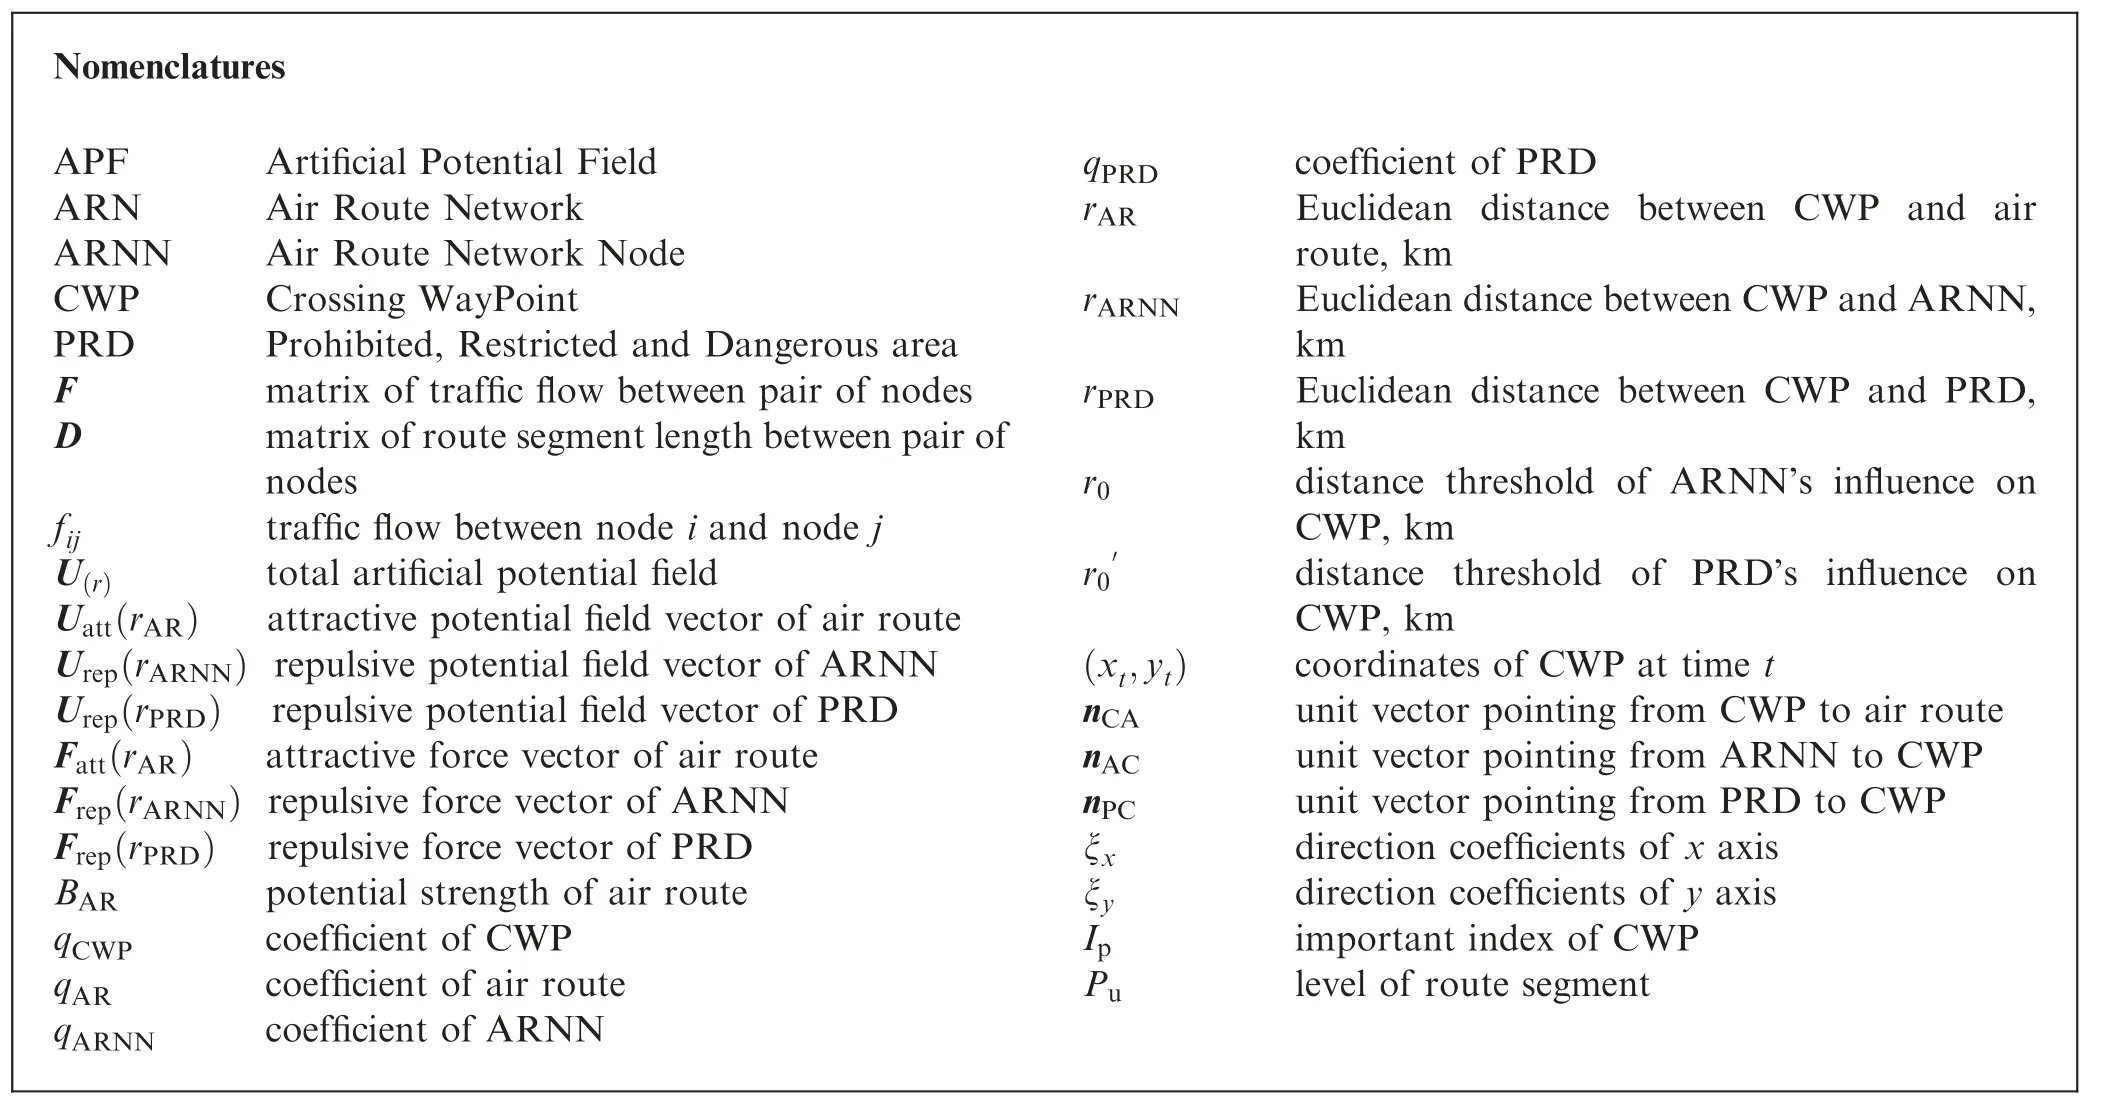
Nomenclatures APF Artificial Potential Field ARN Air Route Network ARNN Air Route Network Node CWP Crossing WayPoint PRD Prohibited, Restricted and Dangerous area F matrix of traffic flow between pair of nodes D matrix of route segment length between pair of nodes fij traffic flow between node i and node j U(r) total artificial potential field Uatt(rAR) attractive potential field vector of air route Urep(rARNN) repulsive potential field vector of ARNN Urep(rPRD) repulsive potential field vector of PRD Fatt(rAR) attractive force vector of air route Frep(rARNN) repulsive force vector of ARNN Frep(rPRD) repulsive force vector of PRD BAR potential strength of air route qCWP coefficient of CWP qAR coefficient of air route qARNN coefficient of ARNN qPRD coefficient of PRD rAR Euclidean distance between CWP and air route, km rARNN Euclidean distance between CWP and ARNN,km rPRD Euclidean distance between CWP and PRD,km r0 distance threshold of ARNN’s influence on CWP, km r0′ distance threshold of PRD’s influence on CWP, km(xt,yt) coordinates of CWP at time t nCA unit vector pointing from CWP to air route nAC unit vector pointing from ARNN to CWP nPC unit vector pointing from PRD to CWP ξx direction coefficients of x axis ξy direction coefficients of y axis Ip important index of CWP Pu level of route segment
Air route network consists of fixed nodes (including airports and boundary nodes),air routes and Air Route Network Nodes (ARNNs).CWP, among all kinds of ARNNs, referring to the node which connects three or more air route segments, is essential for air route network.The airspace with CWPs is the vulnerable place where air traffic congestion,flight delay and accident are more likely to happen,and CWP is also the bottleneck of the ARN when it comes to the operation of air traffic.Therefore, the spatial distribution and quantity of CWPs determine the performance of ARN in terms of safety, capacity, economy etc.. Hence, the research on the design and optimization of CWPs and air route network attracts considerable attention from worldwide. And the research on the optimization of traditional and highdemand ARN is still rewarding and critical.
Current research on ARN from different communities can be generally classified into two groups.The first group focuses on basic elements of ARN, where CWP, air route length and crossing angles were carefully studied. The ARN design problems were proposed by Doan et al.in 2004,and the key structure of ARN, crossing waypoints, was studied. Dai et al.investigated the influence of CWP’s angles on airspace efficiency based on different preferences from airspace users,and the results demonstrated that there were optimal value intervals of CWP’s angles, which facilitate to reduce fuel consumption and emission of flights.In another study,to increase the efficiency of airspace use,Zhang et al.proposed an entry strategy of CWP and analyzed the time-slot availability of CWP. Obtained results showed that different route length under fixed deviation angles of CWP will influence the airspace efficiency. Choi et al.performed numerical experiments to investigate the terminal route topology taking uncertainties of real-world operations into consideration. Cai et al. studied the large-scale CWP optimization problems using particle swarm optimizerand weighted random grouping method.Their results showed that Particle Swarm Optimization (PSO) algorithm performed well in diminishing the computational complexity of large-scale optimization model,while weighted random grouping method had a good performance of converging a preferable solution for CWP location problems.
Another group of ARN research works on the whole air route network optimization. A Floyd-Warshall shortest path algorithm was proposed by Riviere and Brisset, and it was claimed that the proposed algorithm had better performance than those existing algorithmswhen it comes to optimizing the ARN path. The influence of Prohibited, Restricted and Dangerous areas (PRDs) in ARN optimization was also studied. Wang and Gonginvestigated the optimization problem of ARN with PRDs using Cellular Automata (CA) model,and an optimization model was developed with the total operational costas the objective function to enhance the performance of ARN in segmented airspace. Hossain et al.proposed an evolutionary computational framework to optimize the trade-off between capacity and safety of air transportation network. Dai and Zhengstudied and optimized the en-route intersection structure based on air traffic flows.And a memetic algorithm was used to identify the vital edges of air route network.Based on large-scale flight tracking data,Ren and Lideveloped a data-driven model to recognize the traffic flow pattern and ARN characteristics, and a case study was made to compare networks between China and the US in terms of actual behavior and complexity of an air traffic network. In other studies, complex network theory was employed to investigate the structure and features of airport network,as well as the network resilience.
Despite studies on ARN optimization as mentioned above,more efforts in developing a flexible, efficient and integrated framework for ARN optimization are still required.In addition,there are also less works on the optimization for both large-scale ARN and basic air route structures with or without PRDs.Such studies are crucial to rapid-growth civil aviation industry and huge-demand airspace in the near future.Hence,this paper will dedicate to investigating a flexible, efficient and integrated method for ARN optimization problem.To do so,APF method will be introduced and improved to solve the problem.
As one of the effective methods for network optimization,APF has firstly been extensively used in robotics in applications of real-time obstacle avoidance for mobile robots,waypoint location optimization and path planning.In recent years, APF is also introduced in transportation fields,like UAV path and trajectory planningand obstacle avoidance, car-following modeland adaptive cruise control for autonomous vehicles.These studies show that the APF method has a good performance in point-to-point (origin to destination or object to obstacle) potential field modeling.The high-computation and application using APF have also extensively covered in recent years.These findings will benefit the optimization of large-scale air networks. However,the above-mentioned APF models cannot be directly used in the optimization of ARN, in which the characteristics are not limited to a point-to-point scheme but point-to-line(CWP-to-Air Route) as well. In the ARN, straight line between two fixed nodes can be seen as optimal route in terms of the shortest distance. From this point of view, in the development of potential field model, attractive force should be equally generated along the optimal route. Nevertheless, this requirement exceeds the modeling capacity of current APF methods. To satisfy these requirements, a novel APF model is proposed in this paper aiming for the optimization of CWP location problems.
In the remaining of this paper, the APF model for CWP locations optimization is developed. A framework of integrated optimization on CWPs is also generated for different airspace topologies by varying the number of crossing route segments and the constrain of PRDs in fragmented airspace.An adaptive method is then explored to control the optimization process to minimize the total air route cost. Finally, simulation results are presented to validate the feasibility and effectiveness of proposed model.
2. Modelling for CWP optimization problems
2.1. Methodology
The overall workflow of the research work presented in this paper is illustrated as Fig. 1. The airspace modeling information is introduced with latitude and longitude coordinates of CWP, ARNN and PRD’s boundaries, as well as traffic flow in air routes.An improved APF model is then developed based on the characteristics of ARN and air traffic operation,including the development of attractive and repulsive potential fields,and the analysis of coefficients of potential fields. After that,simulations are conducted to verify the viability and performance of proposed APF model.
As to airspace modeling information, for computational convenience,the latitude and longitude coordinates of airspace information were converted into Cartesian coordinate system using Mercator projection. The main purpose of this study is to optimize the location of CWPs. Therefore, in the modeling of ARN network, only the CWPs’ locations are changeable while the ARNNs and PRDs are fixed. Management of vertical trajectory is a key element to the flight efficiency, but the actual flight level is mostly a result of tactical operation.In this study, the ARN is considered two-dimensionally.
The improved APF model is developed by constructing potential fields in the areas of interest, including attractive and repulsive potential fields.The total potential field is the linear superposition of all attractive potential fields and repulsive potential fields.
The attractive potential field is only generated by optimal air routes, the direct line between ARNNs, for the closer the CWP come to the optimal air routes, the less distance will be travelled by flights, and the better performance of ARN will be achieved in terms of total air route costs. The strength of the attractive potential field is weighted proportionally to the traffic flow, defined as the number of flights which utilized the air route in one day, for the purpose of minimizing the total distance for all flights.
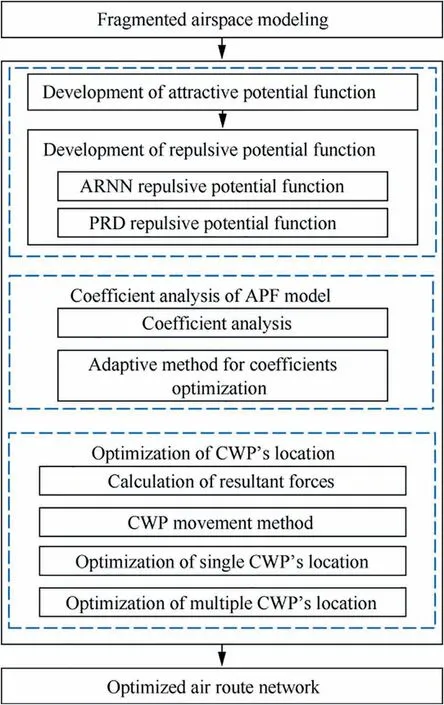
Fig. 1 Overall workflow of this paper.
The repulsive potential fields are generated by two components, fixed ARNNs and PRDs. The ARNNs can be airport,air route point, etc., which generally have limitations for air traffic operation, such as capacity constrain. If the distance between CWP and ARNN is too small, little space will be remained for the maneuver of flights (flight level changes or flight path changes), causing difficulties for flights to operate at normal speed or flight level, thus may result in the increase of flight time and fuel consumption in this area. Hence, the ARNNs generate repulsive potential fields to keep the distance from CWP.And the strength of repulsive potential field generated by ARNN is also proportional to the traffic flow of it.The other repulsive potential field is generated by PRD, for CWP is not allowed to enter the PRD. Once the attractive and repulsive potential fields are established,the total potential field will be computed accordingly, and the total forces imposed on CWP will also be determined by taking the derivative of the potential field function.
Since the total force is contributed by two types of force(attractive force from optimal routes, repulsive forces from ARNN and PRD), the magnitude of all forces will determine the resultant force’s magnitude. While the magnitude of these three forces are determined by force coefficients.Therefore,the value of three types of force coefficient are analyzed by simulation studies,and an adaptive method is proposed to dynamically control the force coefficients to better optimize the ARN’s configuration.
2.2. Fragmented airspace modeling with APF
APF is originally based on the idea that robot is attracted by the target while repelled by obstacles which generate repulsive forces to avoid collision.The idea of the APF model this work proposed is that CWP is attracted by optimal air routes which generate attractive forces while repelled by fixed ARNNs and PRDs, both of which generate repulsive forces.
The schematic diagram of a fragmented airspace structure with CWP, ARNNs, PRDs and air route segments is illustrated in Fig.2.The model is based on a Cartesian coordinate system. Filled cycle stands for CWP whose coordinate is presented as (x, y). The hollow cycle stands for fixed ARNNs and their coordinates are (x, y), (x, y), ..., (x, y). Note that l,l,lare route lengths beween ARNN and CWP. Dotted lines present the ideal air routes, which are the direct connection between two pertinent nodes, generating attractive force along the route to attract CWPs. The polygons shown in the diagram are PRDs, which are the constrains for this model, yielding repulsive force. Solid line represents the original air routes. Solid line with arrow presents attractive force vector and dash line with arrow stands for repulsive force vector.
The matrix of Air traffic flow F in the areas of concerned is defined as

where frepresents the traffic flow between ARNN i and ARNN j.
The matrix of route segment length in the ARN is defined as

where Dindicates the actual flying distance between ARNN i and ARNN j.
The geographical coordinates of airspace elements are given in [(P, Q)] which are converted into Cartesian coordinate system as [(X, Y)]
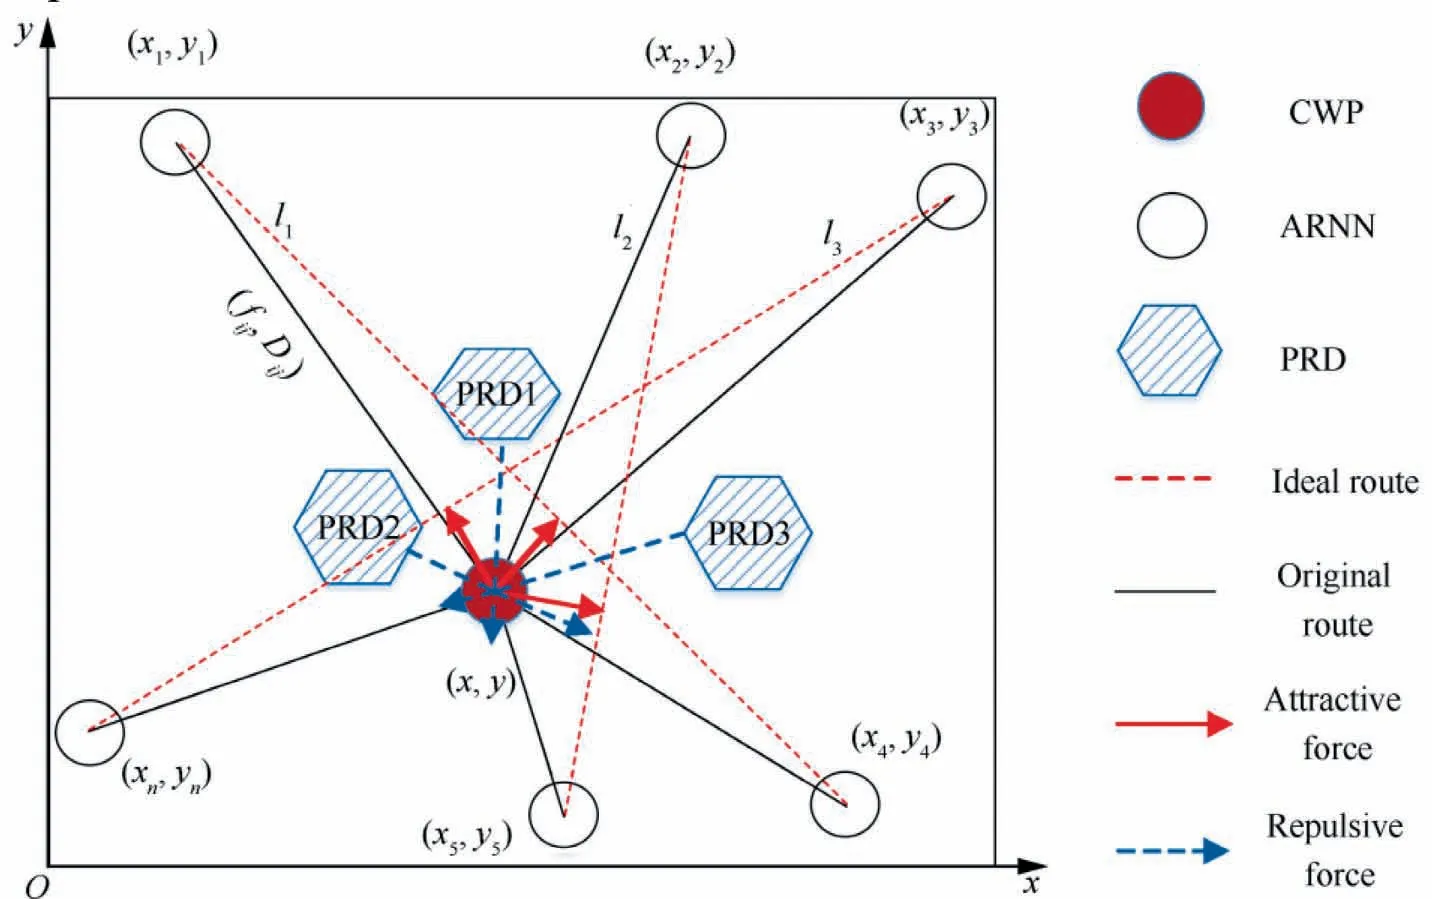
Fig. 2 Schematic diagram of fragmented airspace topology.

in which (x, y) is the coordinate of node n.
2.3. Key performance areas for ARN evaluation
To evaluate the performance of proposed model on CWP optimization problems, the optimality properties are selected and introduced from Key Performance Areas (KPAs) of ICAO GANP Doc. 9750.Three related KPAs are selected as: (A)safety, (B) cost-effectiveness, (C) predictability.
(1) Safety is the top priority in aviation industry. In this work,two safety-related indicators (A)conflict number,(B) controller workload are used to evaluate the safety performance of optimized ARN.A well-recognized simulation platform in ATM field (Total Airspace and Airport Modeler: TAAM) is used for the case study and to generate the results of these indicators.
(2) Delivering the maximum benefit with the minimum cost is always the pursuit of many aviation stakeholders.From a global optimization view, this work proposes three cost-effectiveness indicators:
(A) Total length of route. This is the sum of all route segment. By shortening the total route distance,the distance related indicators like fuel consumption and flight time will be reduced accordingly,given a same velocity.
(B) Total air route cost. The air route cost is defined as the length of route products the number of flights in the route. Total air route cost is the sum of all route costs, denoted as Eq. (4). This indicator is main for prioritizing the route with more flights to achieve the global optimality.

(C) Non-Linear Coefficient of ARN. This indicator is defined as NLC=(Actual distance)/(Euclidean distance), and the distance here represents the length between ARN nodes. This is to evaluate how close the optimized route approximates the theoretically ideal route.
(3) Effective predictability can significantly reduce the costly buffers for all aviation stakeholders. Total flight delay, as one of the key factors, will be evaluated and analyzed by simulation studies using TAAM platform.
3. APF modelling for CWP optimization
Artificial potential field is generated in the concerning area according to the preference of air route optimization. Total potential field is a linear superposition of all attractive potential fields and repulsive potential fields, presented as

where U (r ) refers to the total potential field.Note that U(r )is the attractive potential field which is generated by optimal air routes, it is therefore equal to U(r).U(r ) is the repulsive potential field which consists of U(r) and U(r),referring to potential fields generated by fixed ARNNs and PRDs, respectively.
3.1. Attractive potential field
Current APF model defines the attractive potential as a function of the relative distance between the target and the controlled object, which does not meet the requirements of modeling ARN’s characteristics in this work. A novel attractive potential function is designed in this study to capture the behavior of ARN modeling based on APF method.
As shown in Fig.3,where point A and point B refer to two fixed ARNNs and the distance between them is d.The shortest distance between CWP and the optimal route (the direct line between A and B)is h.When the location of CWP varies in this area, the flight length between A and B, defined as l=l+l, changes accordingly. Therefore, the lis mostly concerned in CWP optimization because it is directly related to flight time and fuel consumption. The closer the CWP gets to the optimal route,the higher efficiency of air traffic will be achieved. It can be easily found that the movement of CWP impacts lthe most when it moves in a direction perpendicular to line AB. The value of such impact, presented as δl/δh, has three characteristics:
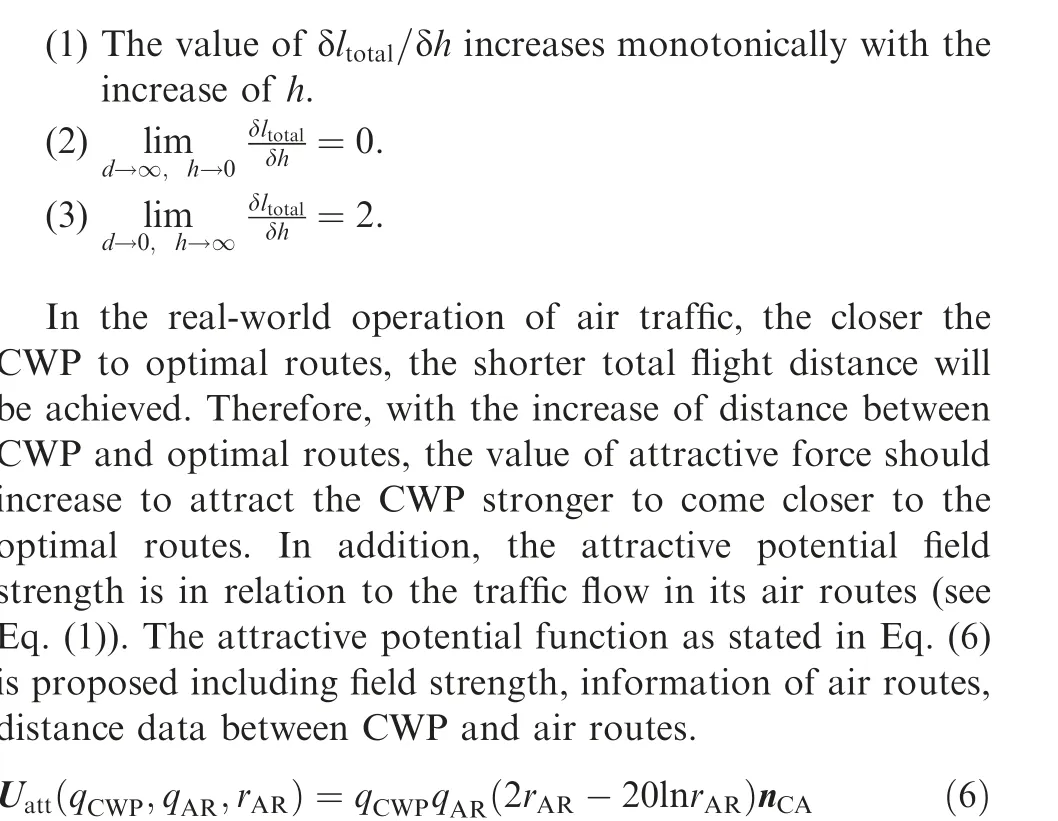
where Uis the attractive potential function and ris the Euclidean distance between CWP and air route. Note that qis the coefficient of CWP, which is proportional to the air traffic flow crossing the CWP, while qis the attractive force coefficient. Note that nis a unit vector pointing from CWP to air route.

Fig. 3 Distance relationship between CWP and optimal route.
Force vector function can be calculated by taking the derivative of the potential function as

Since the width of conventional air route is 20 km, so the distance between air route’s boundary and center line of air route is 10 km,which is also the minimum value of r.Therefore, the value interval of rcan be obtained as r∈[10,+∞) km.
Here, we can see the main advantages of the proposed attractive potential field is shown as solid line in Fig. 4. When the CWP is far from the optimal air route,the attractive force will be constantly big to attract the CWP coming closer to optimal air route.When the distance becomes short,the attractive force will drop dramatically to zero once the CWP is on the air route. Based on Eq. (7), the upper and lower limits of attractive force can be illustrated as Eq. (8) and Eq. (9).
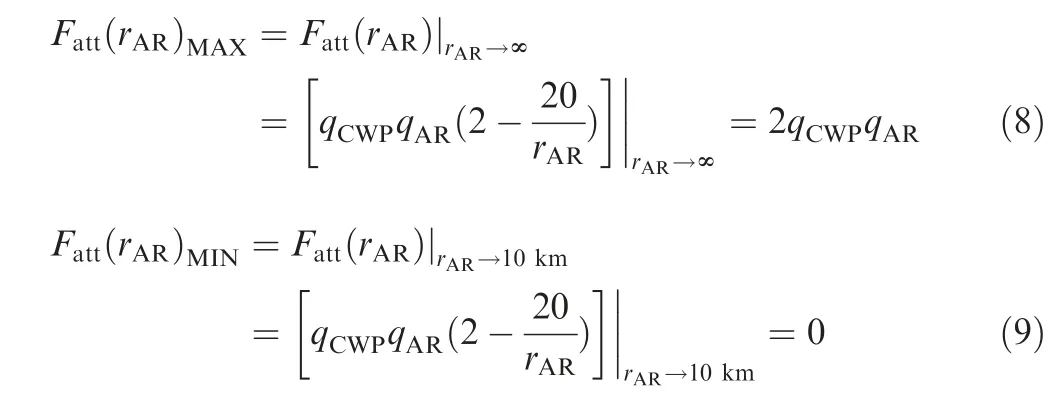
Assuming qand qare both the positive integer and equal to 1, the F(r)approximately equals to 2 while the F(r)equals to 0. With the increase of the r, we can see a dramatic rise of attractive force, which presents that once CWP is far from the optimal route,the attractive forces will become big attracting CWP coming closer to optimal routes.
3.2. Repulsive potential field
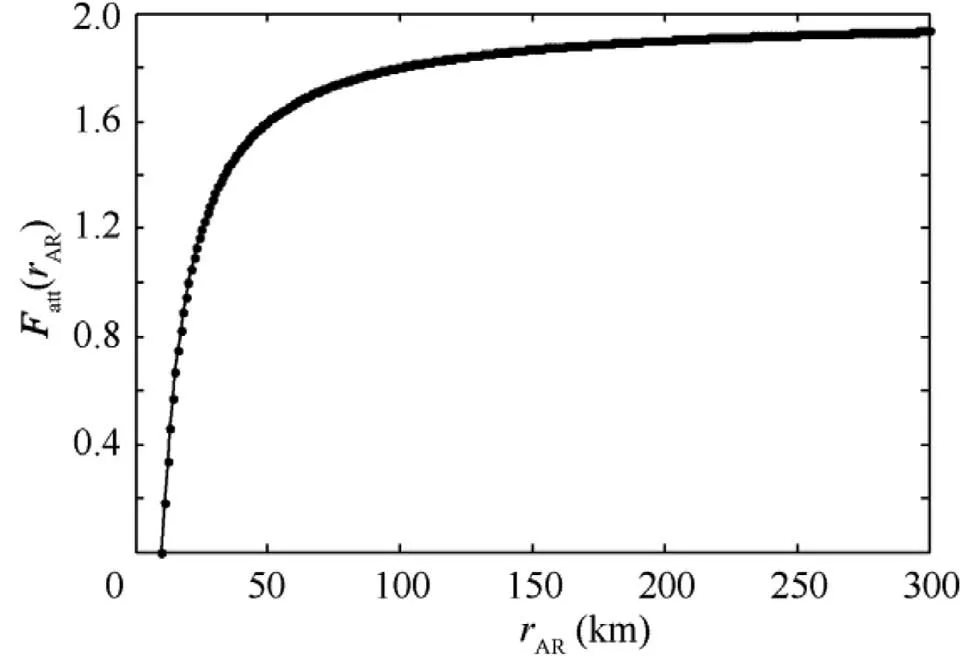
Fig. 4 Attractive force distribution along with the distance rAR.
Conventional APF method presents repulsive potential fields generated by obstacles to avoid collision. In this study, the repulsive fields are developed according to the impact of ARNN and PRD on flight operations. Fixed ARNNs are boundaries of ARN or airport,and they always have constrictions for air traffic operation such as ARNN capacity limits or passing time interval limits, causing traffic congestion and flight delays in busy airspace. CWP, as one of the ARNNs,also has constrictions.A distance smaller than a certain threshold between CWP and ARNN will reduce the availability of timeslot and lead to flight delays of air traffic.Hence, in this model ARNNs generate repulsive forces to keep CWP away further than the influence threshold.The second portion of repulsive field is generated by PRDs. As flights are not allowed to enter PRD airspace, PRD can be considered as the obstacle. The total repulsive potential field is the vector superposing of the two potential parts.
3.2.1. ARNN repulsive potential field
ARNN generates repulsive potential field within the influence threshold.And the filed strength is the function of the distance rbetween ARNN and CWP. As rdecreases, the repulsive field strength will increase. The repulsive potential filed strength also has linear relationship with ARNN’s field energy and CWP’s field energy, which are the function of air traffic flow. The more air traffic crossing the ARNN or CWP, the more field energy they will possess. The ARNN repulsive potential function is denoted as

where qis the field coefficient of ARNN,which is proportional to the number of air traffic flow.ris the distance threshold of ARNN’s influence on CWP, exceeding this threshold,the ARNN’s potential field will have no influence on CWP.Based on previous research,the value of ris given as 70 km in this work. Note that nis a unit vector pointing from ARNN to CWP.
Force vector function pointing from the ARNN to CWP is presented as
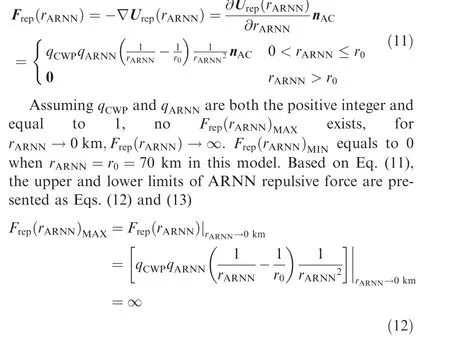

In this model,with the decrease of distance between ARNN and CWP,the repulsive force reaches the maximum ∞,meaning that ARNNs and CWPs will not merge. Therefore, the number of ARNNs and CWPs will remain unchanged after optimization.
3.2.2. PRD repulsive potential field
PRD is regarded as obstacle which generates repulsive force to repel CWP freeing from collision with it. The PRD repulsive potential function is presented as
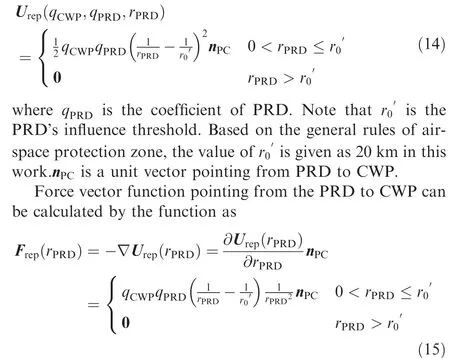
Assuming qand qare both the positive integer and equal to 1, no F(r)exists, because when r→0 km,F(r)→∞. F(r)equals to 0 when r=r=20 km.By virtue of Eq.(15),the upper and lower limits of PRD repulsive force can be illustrated as Eqs. (16)and (17)
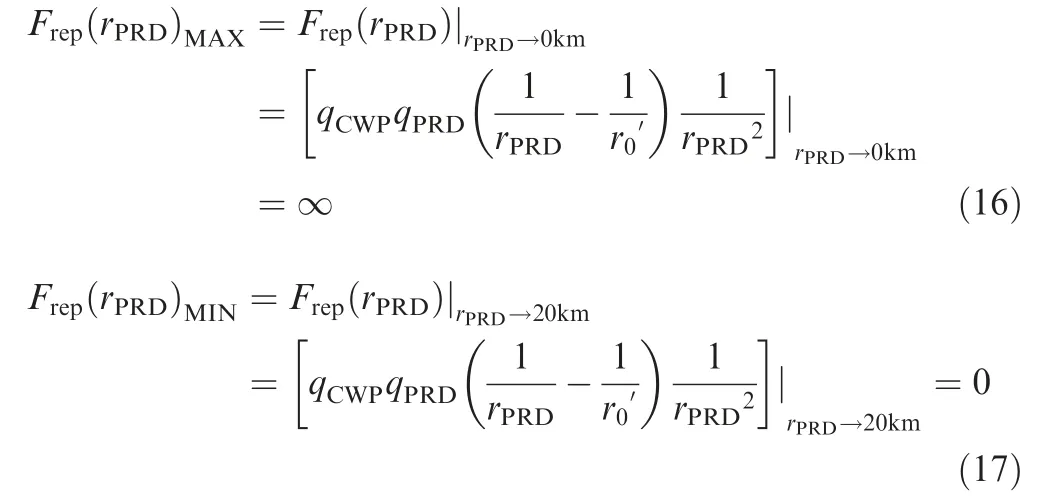
In this model, with the decrease of distance between PRD and CWP, the repulsive force will reach the maximum ∞,which means CWP will never enter the PRDs violating airspace rules in terms of air traffic operation in fragmented airspace.
4. Coefficient analysis of APF model
The resultant force imposed on CWP is determined by three types of forces. Coefficients q,qand qdetermine the magnitude of each force,affecting the result of CWP location optimization. A reasonable sensitivity analysis of these values of coefficients is required.
4.1. Sensitivity analysis
Sensitivity analysis is carried out to study the impact of q,qand qon optimization results. The total force on the CWP is the vectorized sum of the three forces affected by the aforementioned coefficients and there is no constent term. Therefore, if all of the three coefficients are multiplied by a constant, only the velocity of CWP movement will be affected while the direction of CWP moment will not change.In other words, the moving direction of CWP solely relies on the relationship among the coefficients. Considering the fact that the original location of most CWPs are not within 70 km from ARNNs,coefficients qand qshould be more significant to influence the results. Thus, instead of studying the coefficients in a three-dimensional solution space, an analyzing strategy is used in this research,which assumes that one of the coefficients is constant while the other twos are changing.
Simulations are conducted with optimization indicators:(A) total air route cost M (Eq. (4)); (B) distance between CWP and PRD. Coefficient qis give as 1, and the value interval of other two coefficients are given as q∈[1,10]and q=[0,1000]. Based on the simulation results of single coefficient’s influence on CWP’s location optimization, the step size of these coefficients is given as 1 and 100 for qand qrespectively. In this case, 110 possible combinations of coefficient sets are obtained and simulated. The results are shown in Fig. 5.
With the results presented in Fig.5,two relationships of the coefficients can be concluded as:(A)with the decrease of q,the total cost and the distance will drop in way of nonlinear monotone continuity; (B) with the increase of q, the total cost and the distance will decrease in way of nonlinear monotone continuity.
4.2. Adaptive method for coefficient optimization
Based on the analysis results aforementioned, an adaptive method is proposed to determine the optimal coefficient set in the process of optimization to dynamically adjust the coefficient set for minimizing total cost M. The flowchart of this method is illustrated as Fig. 6.
Step 1. Initialize the coefficient set. Based on Fig. 5, the initial set can be given as [q,q,q]=[1,1,1000].
Step 2. Calculate the coordinate of CWP based on the total potential field.
Step 3.Calculate total route costs once the coordinate of CWP is obtained.
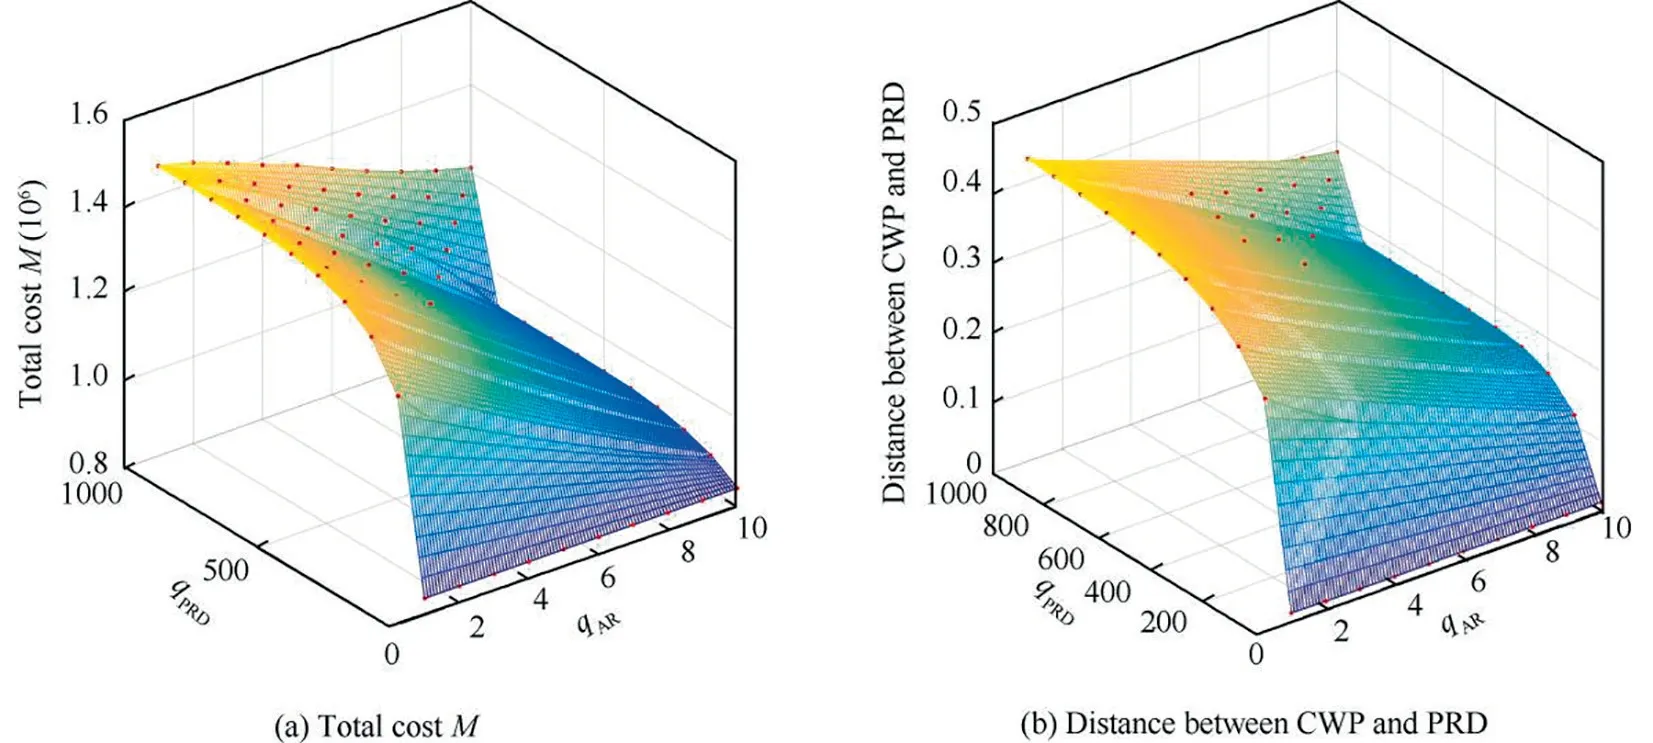
Fig. 5 Results of sensitivity analysis for force coefficients (qARNN =1).
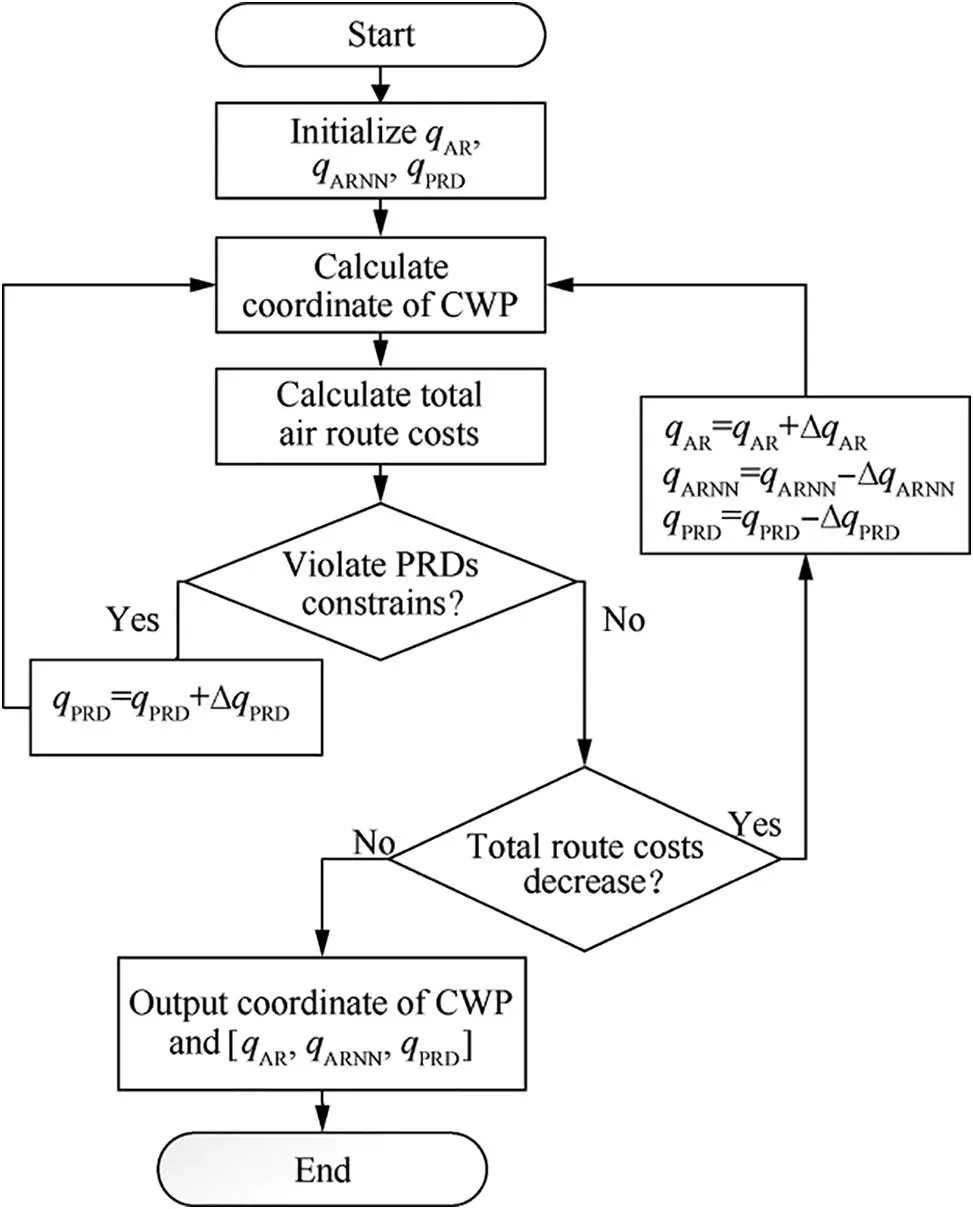
Fig. 6 Flowchart of adaptive method for APF’s coefficients analysis.
Step 4.Determine if the CWP violates the PRDs.If yes,increase q,thus increasing the PRD’s repulsive force accordingly to repel the CWP from the PRDs. If no,turn to Step 5.
Step 5.Determine if total air route costs M decreases.If yes,it indicates that M is at the decreasing direction(see Fig.5),then changes the coefficient set towards direction of minimizing the M. Specifically, increase qwhile decrease qand q. If no, it indicates that M remains unchanged or increases. Based on the relationships obtained from Fig. 5, the M will change with any one of the coefficients in the way of monotone continuity. So, the total cost M is minimized.
Step 6.Output the coordinate of the CWPs and the coefficient sets.
5. Optimization of CWP’s location for desired ARN
In previous sections, airspace model and the APF method are developed,as well as the APF coefficients analysis is conducted to optimize the total route cost. In this section, the angle constraint model will be investigated and incorporated in APF model before conducting the CWP location optimization.
5.1.Constraint of intersection angle between two adjacent routes
Air route crossing angle between adjacent routes,as an important factor in CWP structure, will significantly influence the safety and efficiency of air traffic operations. For instance, in the fundamental air route structures as shown in Fig. 7, the α,α,αare respective angles of converging, diverging and turning. Too small these angles will result in too close of the adjacent routes, which may lead to potential conflicts (conflict defines as the aircraft conflict box have overlaps). Besides, to avoid conflict between adjacent routes with small angle,larger safety separation is required, which will harm the traffic efficiency. Given that, this work considers the angle as a constraint in the CWP optimization process.
The illustration of the angle constraint is depicted in Fig.8.Point A and B are ARNNs,and point C is CWP.Note that θ is the intersection angle between two adjacent routes. To incorporate the angle constraint to the potential field, two issues need to be addressed: one is that what direction CWP moving to will result in the decrease of θ, and another is the relationship between θ and CWP’s coordinate (x,y ). As the Fig. 8 shows, the θ will not change with the moving of CWP alongside the circle, and will only change when CWP moving in direction which is perpendicular with line AB.Based on Cosine triangular relationship between the corners and trigonometric,we can obtain that the angle θ is the function of (x,y ).

Fig. 7 Illustration of intersection angle between adjacent routes.
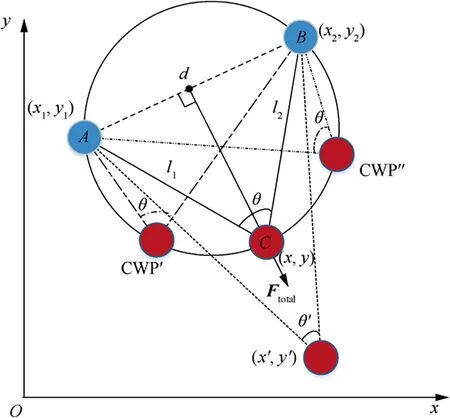
Fig. 8 Model of air route intersection angle constraint.
The relationship between the intersection angle θ and CWP’s coordinate (x,y ) can be denoted as

Each coordinate (x,y ) corresponds to an angle θ. In the optimization process, any obtained CWP coordinate will be evaluated to see if it meets the angle constraint.Based on existing research,we take 30°≤θ ≤180°.
5.2. Optimization of single CWP’s location
CWPs in the potential filed will be moved to approximate the optimal location based on the resultant force upon it. The resultant force (attractive force and repulsive force) imposed on CWP at time t can be calculated by taking the derivation of the total potential field, formulated as where m is the number of attractive objects(air route)and n is the repulsive objects.Note that nis the number of ARNN and nis the number of PRD, and n=n+n.

Assuming that (x,y) is the coordinate of CWP’s location at t moment. The location of CWP at t+1 moment can be then denoted as (x,y), and can be calculated as

where L is the step size of CWP generation. ξand ξare direction coefficients in terms of x axis and y axis. If the CWP is attracted to the negative direction of axis, then the ξ=-1, while ξ=1 when moving to positive direction of axis.
Based on resultant potential field function and resultant force function proposed in this paper, total attractive and repulsive forces imposing on CWP can be obtained.After that,the CWP will be driven to a new location by these obtained forces from the initial location. By doing so repeatedly, the optimized location of CWP will be achieved when reaching the optimality condition.The flowchart of this method is illustrated in Fig. 9.
5.3. Optimization of multiple CWPs’ locations
An assumption is made in this study that the total number of CWPs remains the same,which is the basis of multiple CWPs’location optimization. The optimization method can be devised as two parts: (A) determine the priority of CWPs;(B) develop a control law as a scheduler to optimize the locations of multiple CWPs. The performance of the proposed method will be verified in simulation section.
The optimization priority of CWPs is determined by two main factors: (A) traffic flow through the CWPs; (B) the level of route segment (e.g. main air route, flight path, temporary path, etc.). The priority of CWP is denoted as

where Iis the priority of CWP,which determines the sequence of optimization;Pis the level of route segment,the higher the level of the route is, the larger value of Pis; a and b are denoted as weight coefficients.
The control mechanism of optimizing multiple CWP’s location can be described as the following steps. Illustration of airspace with multiple CWPs is shown in Fig. 10. Assuming CWP1 has the highest priority while CWP3 has the lowest.
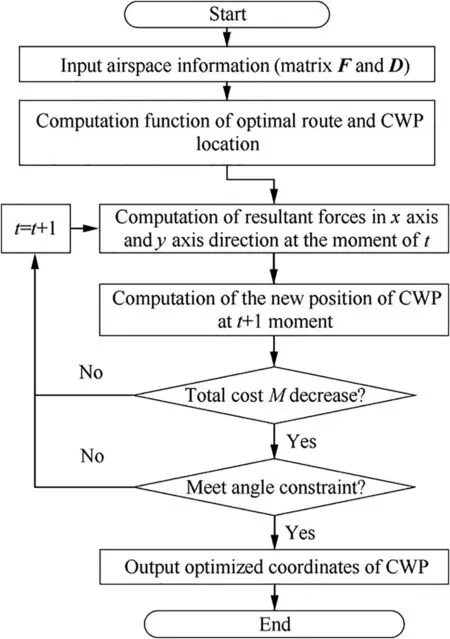
Fig. 9 Optimization flowchart of single CWP.
(1) Optimizing the location of CWP1 based on the method of single CWP optimization process.
(2) Optimizing the location of CWP2 based on the method of single CWP as well, after that,analyzing whether the change of CWP2’s location influences the CWP1’s location. In this example,CWP1 and CWP2 do not connect each other directly, so there is no influence on CWP1’s location after the optimization of CWP2’s location.
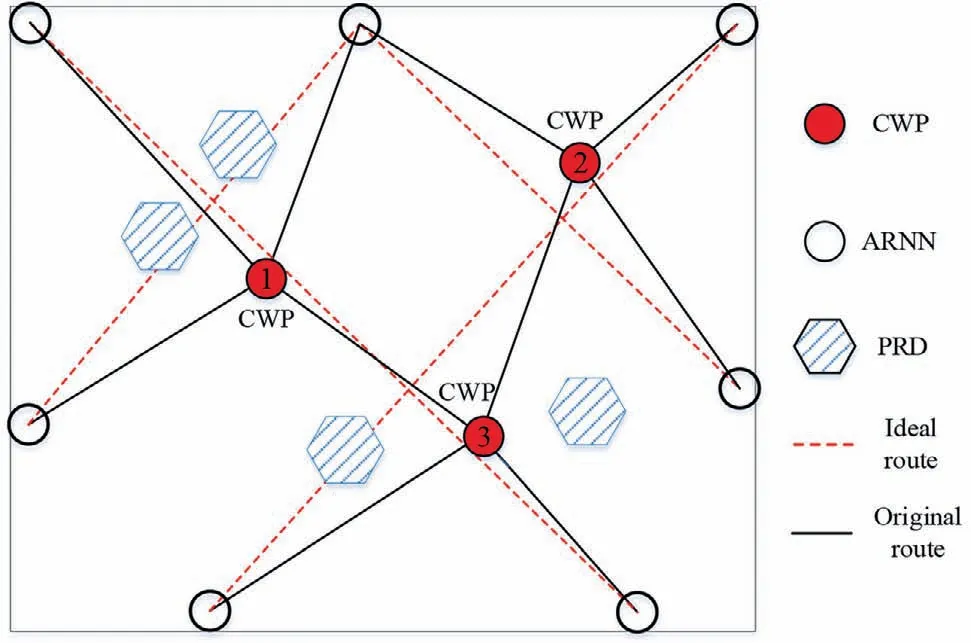
Fig. 10 Illustration of multiple CWPs’ network.
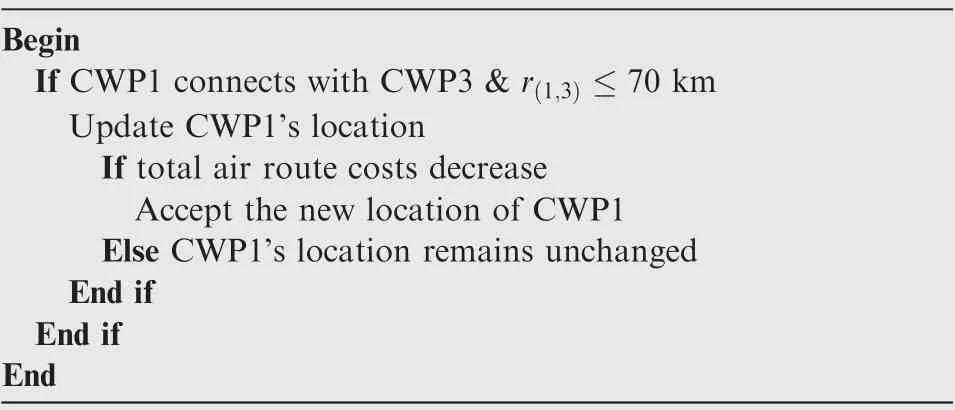
Table 1 Pseudocode of the control mechanism for multiple CWPs’ network optimization.
(3) Optimizing the location of CWP3. Because the CWP3 connects CWP1 and CWP2, there are repulsive forces imposed on CWP1, CWP2 and CWP3 respectively. The control mechanism is employed to solve this condition and its pseudocode is presented as Table 1.
5.4. Integrated optimization framework of CWPs
Integrated Optimization of CWPs is a framework developed to optimize different airspace topologies with or without PRDs.An overview diagram of how the framework works is depicted in Fig.11.The framework contains three parts,and the core of it is the procedure of optimizing single CWP(see Fig.9).Once the single CWP optimization process is completed, the optimization of multiple CWPs can be conducted based on optimizing sequence of CWPs and the control mechanism.
The framework proposed enables us to deal with a wide range of airspace topologies in real-life scenarios.For instance,it can optimize the local airspace with one or more CWPs and different route segments in the presence or absence of PRDs.It is also able to deal with the complicated airspace topologies with many CWPs in the presence of PRDs.
6. Simulation studies
In this section,simulations are carried out to evaluate the performance of the proposed method. The studies are conducted in two parts: (A) simulation is performed in real-life environment where one of the busiest controlled airspace with five control sectors is selected to validate the proposed model;(B) a simulated environment is produced to demonstrate the mutual influence among multiple CWPs and to validate the proposed optimization control mechanism.
6.1. Real-life controlled airspace environment
The air route network used in this study is under ATC in the upper airspace (above flight level 155). Airspace information is extracted from the Civil Aviation Authority of Chinese Aeronautical Information Publication. The airspace is divided into 5 sectors, covering 12 flight routes, 8 CWPs, 13 ARNNs,and 9PRDs. The air traffic in the simulation are the historical flight plan data recorded on 1st September 2016, which consists of 12,433 flights in the mainland China.While 2199 flights which passed through the simulation airspace are selected from the total database for this simulation. The aforementioned TAAM simulation platform is used in this research. Air route network within the selected airspace before and after optimization is shown in Fig. 12. Trajectory of CWP means that CWP moving under the action of given forces (the resultant force).Simulation results are presented in Fig. 13 and Table 2.
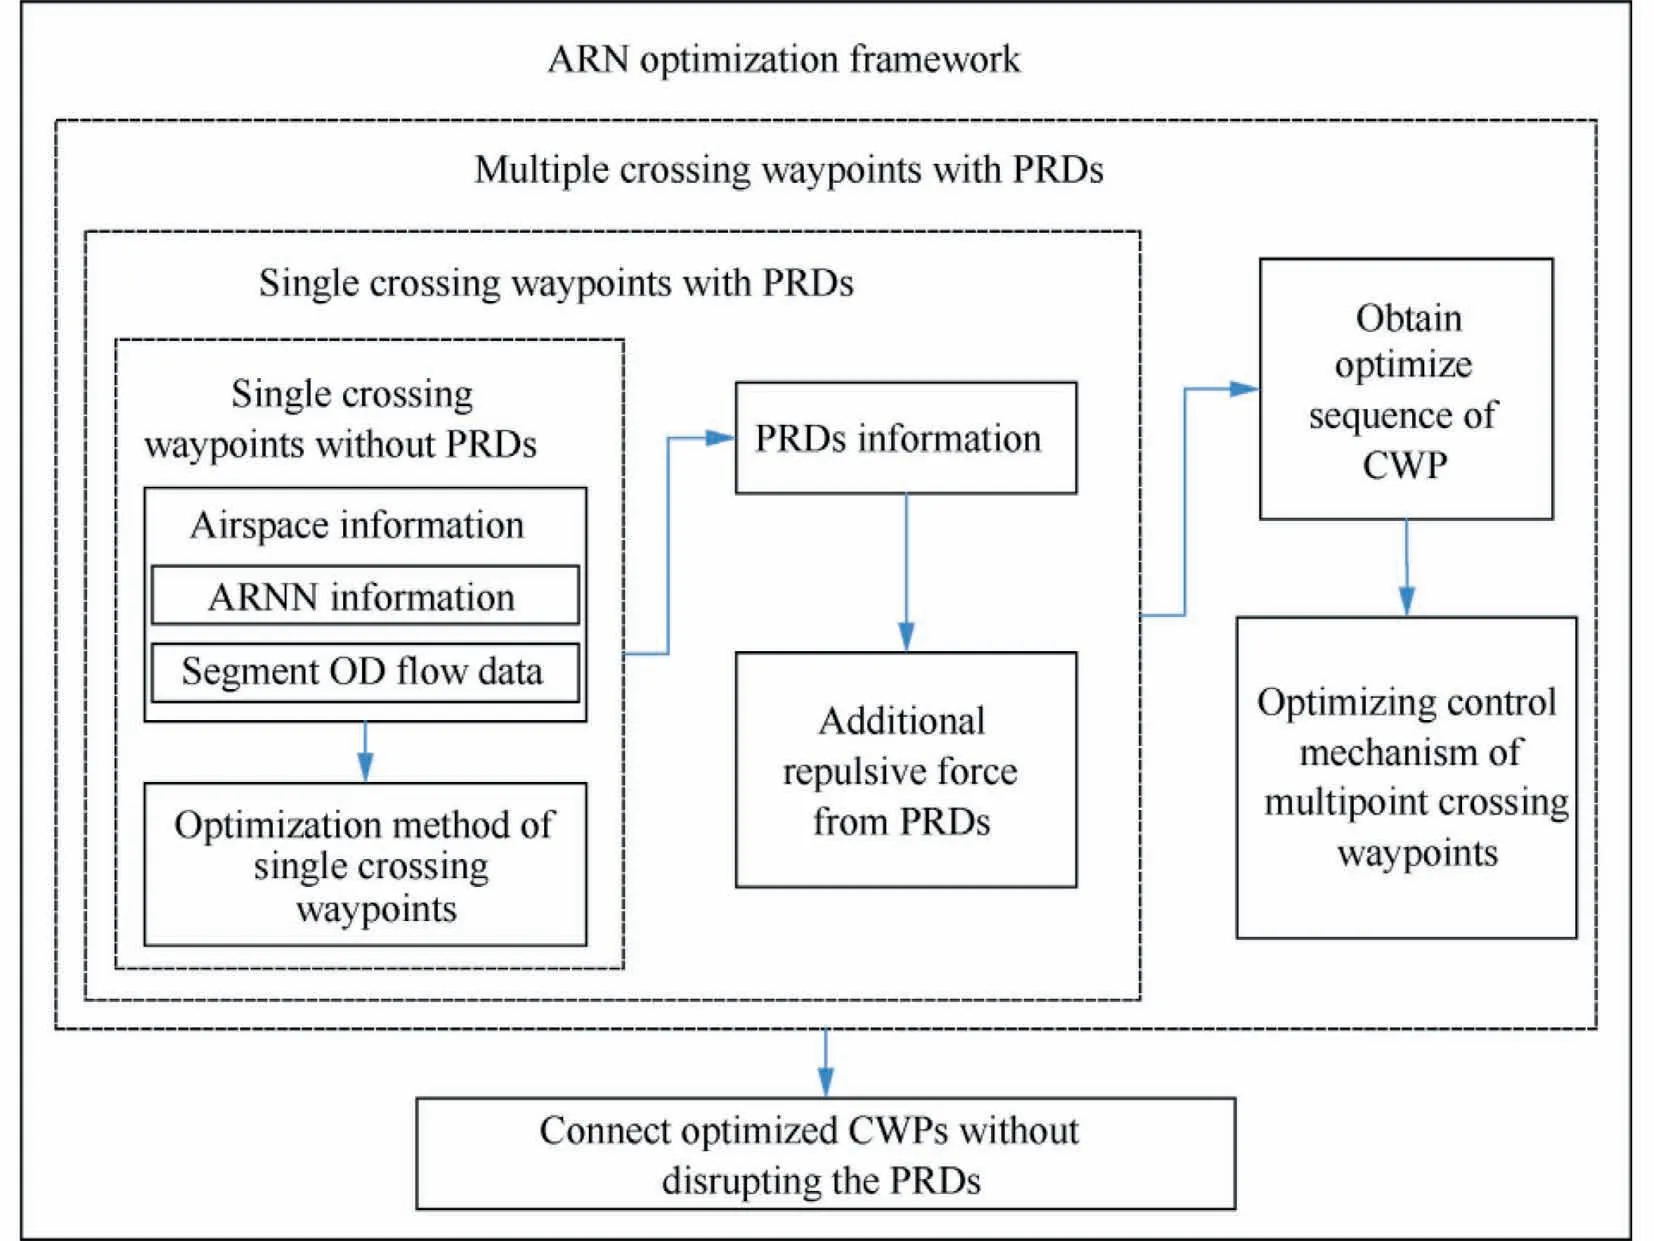
Fig. 11 Optimization framework of CWPs.
As we can see from Fig. 13, all indicators saw an improvement in most of the control sectors,while the average improvement is notable in terms of safety, cost-effectiveness and predictability areas.
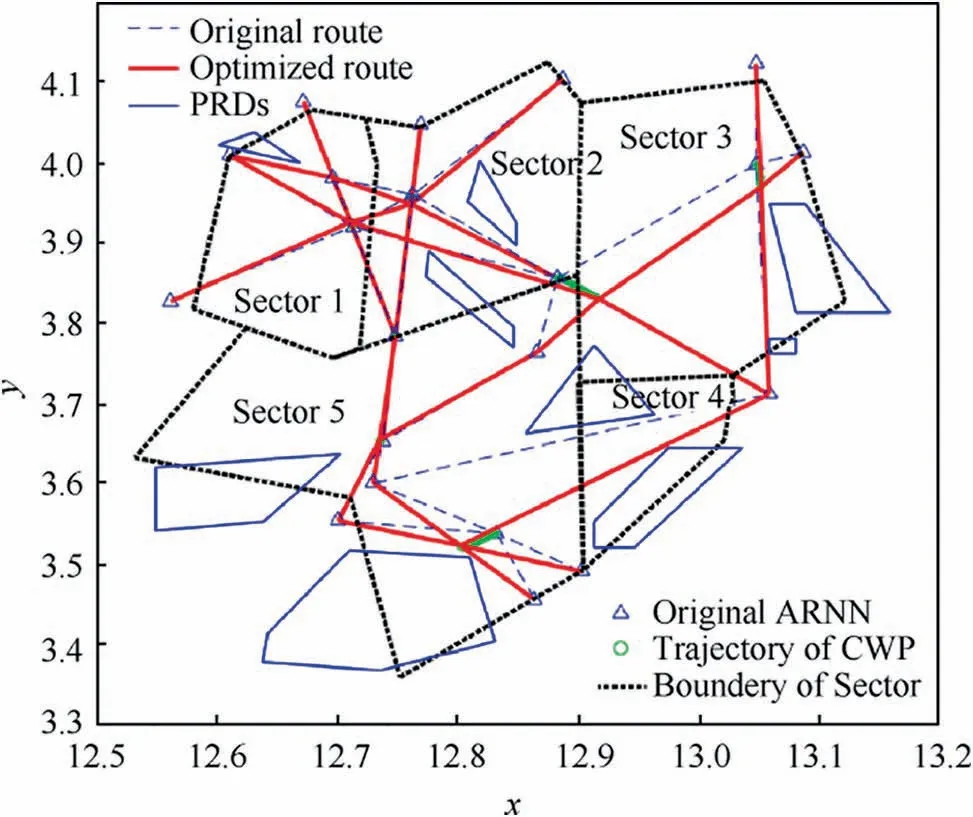
Fig. 12 Simulation result of air route network optimization.
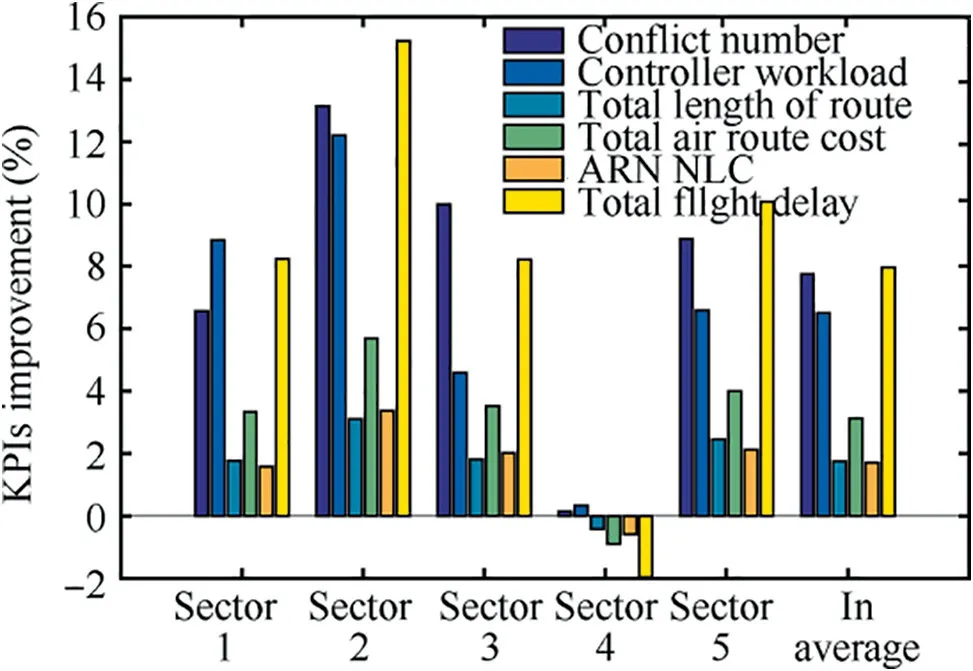
Fig. 13 KPIs improvement in each sector after optimization.
After optimization, the safety-related indicators, conflict number and controller workload, saw remarkable improvements,with the average reduction of 7.75%and 6.51%respectively. For the cost-effectiveness indicators: total length of route, total air route cost and NLC are reduced by 1.74%,3.13% and 1.70% in average. As to the predictability indicator: the total flight delay is reduced notably, with an average reduction of 7.96%, and the remarkable drop (15.22%) is in Sector 2 due to the fact that one of the CWPs is moved to Sector 3 after optimization. While the KPAs saw no significant differences in Sector 4, and the reason is that no CWP contained in this sector and the route length became longer after optimization. So, the route length related indicators (total length, total cost and NLC) became slightly worse and otherindicators were not changed notably either. Overall, the optimized air route network using the proposed mothed has a better performance in areas of safety,efficiency and predictability.

Table 2 Detailed results for each control sector.
6.2. Simulated environment for validation of mutual influences among multiple CWPs
The reason that the mutual influences among multiple CWPs are not obvious to observe in real-life environments is because of the two main reasons:(A)the sparsely distributed CWPs in real ATM operational environments; and (B) the portion of force in resultant force generated by CWPs is small when the distance between CWPs is large.
According to the existing research,in real-life environments, CWPs distributed sparely and rarely influence each other.What is more,in ATM operations,airspace with CWPs has more complexities and potential conflicts, resulting in heavy controller workload.Hence, in air route network planning and design process, CWPs will try to avoid being crowded. The demonstration area in this paper is one of the busiest Chinese controlled airspace with eight CWPs. The shortest distance between these CWPs is 65 km, shown in Fig. 12, Sector 1.
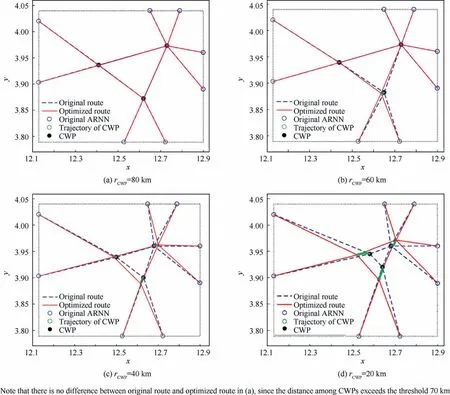
Fig. 14 Mutual influences among multiple CWPs in different route distances between them.
However,to demonstrate the mutual influences among multiple CWPs and validate the effectiveness of the proposed optimization method, a simulated environment is produced. The environment contains three CWPs surrounded by eight ARNNs. Different distances between CWPs are chose from 80 km, 60 km, 40 km and 20 km. Simulations are performed for each of the distances. The obtained results are given in Fig.14.
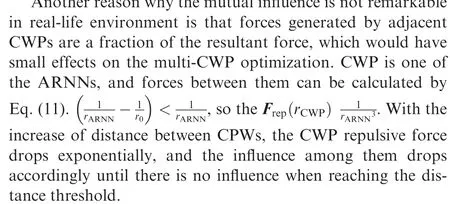
Based on the proposed repulsive potential field (Eq. (11)),beyond the distance threshold 70 km,CWPs will not influence each other. As Fig. 14(a) shows, the distance among the three CWPs is 80 km, and the locations of the CWPs are not influenced by each other,as the optimized routes are the same with the original ones. With the decrease of distance between the CWPs from 60 km to 20 km, the influences become remarkable.When the distance is 20 km shown in Fig.14(d),the three CWPs are all repelled by each other and moved away from each other while maintaining reasonable angles among adjacent routes.The results obtained in simulated environment validate the proposed control mechanism is effective for multiple CWPs optimization problems.
7. Concluding remarks
This paper investigates the air route network optimization problems based on APF method. An integrated optimization framework is proposed, and an adaptive coefficient model is developed to optimize the different types of airspace structure.Simulation results demonstrate the feasibility and effectiveness of proposed models. The main findings of this paper are presented as follows:
(1) This paper introduces potential field method into air route network optimization problems. The air route structure and air traffic flow characteristics are modelled as virtue force manners to optimize the complex airspace structure. Simulation results validate that the proposed method is effective for optimizing different types of airspace varying the number of CWPs, PRDs, etc.
(2) In the proposed APF method,an angle constraint model is developed for route structure optimization problem using virtue force field kind method.And an adaptive coefficient method is proposed based on sensitivity analysis to control the optimization process for minimizing the total air route cost in this work.
(3) Similar to the application of APF method in realtime obstacle avoidance in robotics, the method developed in this study also has potential to apply in real-time optimization problems.What is more,the proposed APF methodology and optimization framework can also be extended to the optimization of other real-world network systems. For instance, the proposed APF method could be applied to the urban low altitude air route network planning and optimization for unmanned aircraft operations.
Declaration of Competing Interest
The authors declare that they have no known competing financial interests or personal relationships that could have appeared to influence the work reported in this paper.
Acknowledgement
sThis research was supported by the Civil Aviation Authority of Singapore and the Nanyang Technological University, Singapore under their collaboration in the Air Traffic Management Research Institute.Any opinions, findings and conclusions or recommendations expressed in this material are those of the authors and do not reflect the views of the Civil Aviation Authority of Singapore.
 CHINESE JOURNAL OF AERONAUTICS2021年4期
- CHINESE JOURNAL OF AERONAUTICS的其它文章
- Time delay compensation in lateral-directional flight control systems at high angles of attack
- Dual stability enhancement mechanisms of axial-slot casing treatment in a high-speed mixed-flow compressor with various tip clearances
- Development cost prediction of general aviation aircraft using combined estimation technique
- Improvement on shaped-hole film cooling effectiveness by integrating upstream sand-dune-shaped ramps
- Modeling and parameter identification of linear time-varying systems based on adaptive chirplet transform under random excitation
- An experimental method to obtain the hard alpha anomaly distribution for titanium alloy aeroengine disks
