Characterization and life prediction of single-pass honing tool for fuel injection nozzle
Chngyong YANG, Ho SU, Showu GAO, Qingfeng AI, Yucn FU,Wenfeng DING,, Jiuhu XU
a College of Mechanical and Electrical Engineering, Nanjing University of Aeronautics and Astronautics, Nanjing 210016, China
b Kompetenzzentrum fu¨r Spanende Fertigung, Furtwangen University, Tuttlingen 78532, Germany
KEYWORDS Fuel injection nozzle;Life prediction;Single-pass honing tool;Tool contour evolution;Tool stiffness
Abstract Single-pass honing is an important machining method for finish machining of holes,which can meet the requirement for high efficiency and consistency of holes. Characterization and life prediction of single-pass honing tool are necessary to improve the machining accuracy of holes honed, especially dimension accuracy. Single-pass honing tool is a single layer abrasive tool with fixed dimension, which still remains problematic for characterization and life prediction.For fuel injection nozzles with bore diameter under 1 mm, the stiffness of the single-pass honing tool is poor. This article presents a novel analytical model that predicts life of the tool with poor stiffness. Firstly, according to the bore diameter and dimension tolerance, the single-pass honing tool is designed and manufactured.Based on the prepared single-pass honing tool,the measurement and characterization methods are established.Furthermore,the tool wear tests are carried out,and the tool contour evolution model is established to predict the tool life.
1. Introduction
Fuel injection nozzles belong to the hot end part of aeroengines, which require materials to have the comprehensive properties of high-temperature resistance and high strength.Take the mainstream aero-engine as an example, generally the fuel nozzles are made by martensitic stainless steel and nickel-based superalloy,which have excellent comprehensive performance, and without exception are typical hard-to-cut materials. The difficulties in machining are mainly reflected in large cutting force, severe machining hardening, and fast tool wear, which directly affect the machining efficiency,dimension accuracy, and shape accuracy.
The micro cutting characteristic of abrasive machining ensures that the better shape accuracy and surface roughness can be obtained,so it is widely used in the precision machining of holes. Commonly abrasive machining methods include internal grinding, honing, abrasive flow and manual grinding,etc.Internal grinding is one of the earliest methods used in precision machining of holes. However, the grinding wheel used in micro-hole grinding is usually small in diameter, poor in tool rigidity and low in grinding speed, which limits the grinding efficiency,and the dimension consistency and surface quality.Compared with internal grinding, honing can obtain better dimension, shape accuracy and surface quality.Therefore,honing is widely used as the final process.However,the internal expanding structure of honing tool limits the reduction of its diameter. The diameter of traditional oilstone expanding honing tool is generally not less than 4 mm.Abrasive flow machining is a kind of free abrasive machining method, which has been widely applied to the precision machining of automobile engine fuel nozzle. In abrasive flow machining, the material removal rate at each position of the machined hole inner wall varies and cannot be accurately controlled,so the shape accuracy of the hole beyond control can hardly guarantee the accurate control of the spray cone angle and the fuel distribution in the whole combustion chamber. Thus this poses a challenge to manufacture high quality fuel nozzles with bore diameter under 1 mm for the aeroengine.As for the micro hole like this, traditional drilling and reaming can guarantee higher machining accuracy and surface roughness simultaneously, compared with the nontraditional machining of micro-hole such as electric discharge machining (EDM), electrochemical machining (ECM) and laser machining,and till now are primarily adopted in the original hole machining of fuel nozzles.But due to the poor stiffness of the tools in micro-hole drilling and reaming, the tools are likely to deform during the process, and the dimension and shape accuracy can scarcely be achieved. Therefore,manual lapping is needed to improve the dimension and shape accuracy of nozzles.The bore diameter of nozzles is small,so the manual lapping is difficult, which finally leads to lower machining efficiency.Furthermore,it is only suitable for small batch processing, which can hardly meet the increasing demand of nozzle production and production efficiency.
A novel super-abrasive tool of fixed dimension has been employed in single-pass honing.When the tool rotates,the tool passes through the hole to remove some material at the same time.Combining the advantages of reaming and honing,single-pass honing is a kind of abrasive process, which can achieve higher dimension consistency and shape accuracy and been widely used in the finish processing of holes in the hydraulic field.The processing capacity of single-pass honing is perfectly matched with the requirements of fuel nozzles,which has great application potential in high efficiency and high consistency machining of nozzles.However,there are still many problems in the application of the single-pass honing to finish machining of the micro-hole such as fuel nozzles. The issue in the design and preparation of micro-hole single-pass honing tool with the diameter less than 1 mm is more pressing.Due to poor stiffness, it is extremely difficult to manufacture and dress a tool with small diameter,and the geometric parameters of traditional single-pass honing tools cannot be directly employed for the tool design.
Dressing is very important to ensure the precision of singlepass honing tools. But due to undesirable stiffness, the deformation caused by the unilateral force of the tool cannot guarantee the dressing precision during dressing with a diamond roller.In single-pass honing, however, the circumferential force of the tool is uniform and the tool is not likely to deform, it is therefore a feasible dressing method for the single-pass honing tool with holes.To make clear the evolution law of the 3D contour during tool dressing, the tool needs to be accurately measured and characterized. On the characterization of the monolayer super-abrasive tool morphology,researchers have carried out a lot of researches,which provide significant insight for the present investigation. Based on the accurate 3D contour characterization,modeling and simulation of cutting force and tool contour evolution can be carried out to predict the contour during tool wear, which provides theoretical support for tool life prediction.
In this article, the single-pass honing technology is applied to finish machining of fuel nozzles to solve the problems of low machining efficiency and poor consistency. Firstly, a singlepass honing tool with poor stiffness for fuel nozzles is designed and manufactured.Then,the relationship between the 3D contour of the single-pass honing tool and the 2D contour is established. Based on the measurement results of the 2D contour, the 3D contour distribution of the tool is determined,and the static bearing ratio distribution of the single-pass honing tool is calculated. The wear tests of the single-pass honing tool are carried out,and the evolution laws of tool contour and bore diameter during tool wear are made clear. Finally, the contour evolution model of the tool is established, and the model is used to predict the contour evolution and tool life during tool wear.
2. Single-pass honing tool
Single-pass honing tool is a monolayer super-abrasive tool,including three parts: tool substrate, binder and grains. The ideal structure of the single-pass honing tool widely used in the hydraulic field is shown in Fig. 1. The guide part is to ensure that the tool can enter holes smoothly during honing.The cutting part removes the most of material, which is the part bearing the largest cutting load and wearing severely.To ensure the smooth process of single-pass honing, the cutting part of the tool is generally designed as a micro-taper structure. The finishing part removes the elastic deformation of the workpiece surface,improves the surface quality,and stabilizes the bore diameter.
The simplified diagram of the fuel nozzle is shown in Fig.2,where dimension consistency is 2 μm. The initial diameter of the nozzle hole is between 0.74 and 0.75 mm after drilling.According to the initial hole, the diameter of the guide part is designed as 0.73 mm.The diameter of the tool obtained from the preliminary preparation should be slightly larger than the diameter, to leave a certain allowance for dressing. Besides,CBN grains are selected to prepare the tool. On this basis,the abrasive layer of the tool is prepared by pulse electroplating process.Finally,a single-pass honing tool with single layer CBN grains is formed, as shown in Fig. 3.

Fig. 1 Ideal structure of single-pass honing tool.
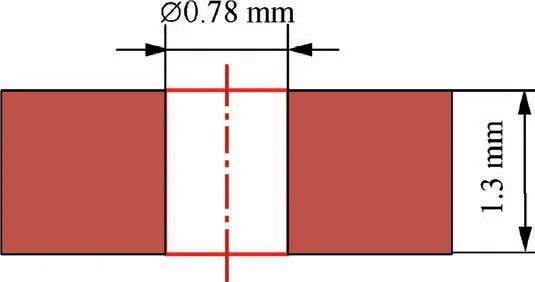
Fig. 2 Simplified diagram of fuel nozzle.
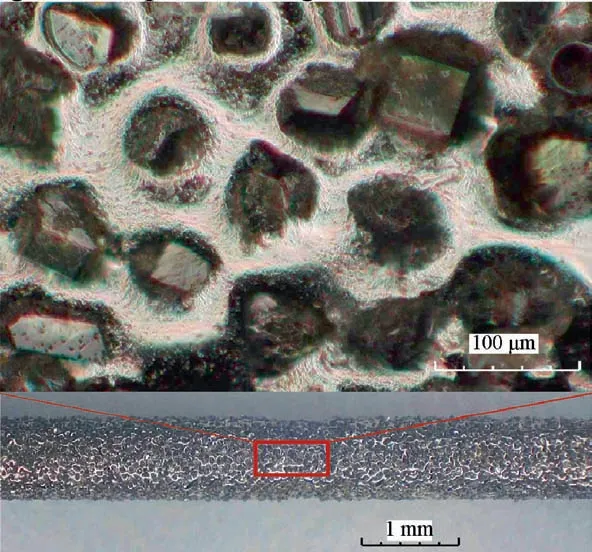
Fig. 3 Surface morphology of single-pass honing tool.
3. Measurement and characterization of single-pass honing tool
3.1. Measurement method of 2D tool contour
Poor tool stiffness causes the tool deformation by the contact measurement method, and thus leads to the measurement error. Additionally, the contact probe cannot accurately measure the microstructure of the tool surface. A non-contact measurement method is adopted to measure the geometric contour of the tool. The measuring principle of the multisensor coordinate measuring machine (VideoCheck-IP250/400) produced by Werth is parallel light projection, as shown in Fig. 4. Parallel light shined upward from the lower light source, and the light was partially blocked by the tool,and the local projection contour of the tool was obtained.After several consecutive scans along the edges of the tool,the 2D projection contour under the current pose of the tool was obtained after splicing, as shown in Fig. 5. Due to the large length-diameter ratio of the tool, the tool will inevitably produce deformation, which is reflected in the 2D contour.Considering the symmetry of the single-pass honing tool contour, the geometric centerline of the tool is evaluated, before the 2D contour of the tool is characterized.
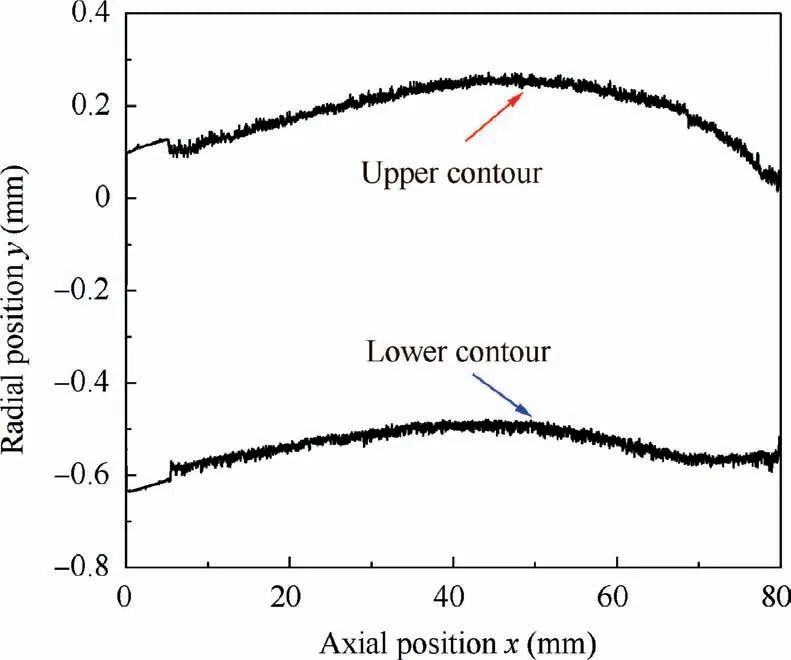
Fig. 5 Original projection contour measured.
3.2. 2D geometric centerline of single-pass honing tool
The straightness of the tool geometric centerline is used to evaluate the tool deformation. The measured 2D contour of the tool is a series of discrete points, and the calculation method of geometric centerline is as follows:
1) Divide the original projection contour points into upper and lower contour with the discretization interval of 0.1 mm,
2) Calculate the average value of radial position y of the upper and lower contour in each discretization interval,yand y
3) Calculate the radial position of the centerline within each discrete interval y=(y+y)/2,
4) To remove the noise signal generated by the random distribution of the grain height, a 6-order polynomial is used to fit the calculated geometric centerline,and finally the geometric centerline y(x) of the tool is obtained.
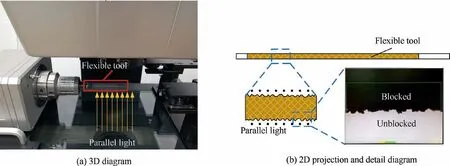
Fig 4 Multi-sensor coordinate measuring machine (VideoCheck-IP250/400).
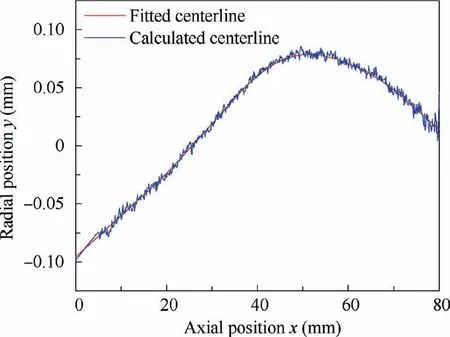
Fig. 6 2D geometric centerline of tool.
The above algorithm is adopted to calculate the fitting centerline, whose results are shown in Fig. 6. The determination coefficient is R=0.991, thus the 6 order polynomial can fit the centerline of the tool well, with no obvious underfitting or overfitting observed.
The tool is guided by the hole during honing, and the contact between the tool and the workpiece is shown in Fig.7.The tool rotation diameter is larger than the actual diameter due to the non-zero curvature of the tool geometric centerline.Assuming that the curvature C of the tool section is the same and the hole length is L,the curvature C at the axial position x and the increment dof tool rotation diameter caused by tool straightness error can be expressed respectively as

According to Eq. (2) and Fig. 6, the curvature of the geometric centerline along x can be calculated. When L is 1.3 mm, the derivative of Eq. (1) with respect to C is always greater than zero, which means that de increases monotonically. According to Eq. (1), the maximum increment of tool rotation diameter caused by tool straightness error is about 0.44 μm. It can be seen that tool straightness error has little influence on bore diameter, which can be ignored. Also, the flexibility of the tool will further reduce the influence of tool straightness error. The 2D equivalent contour of the tool is obtained by removing the geometric centerline deviation, as shown in Fig. 8.
3.3. Characterization of 2D tool contour
The above measurement method only obtains the projection contour under a certain position of the tool,which cannot represent the 3D contour of the tool and be directly used in the analysis of tool wear. Therefore, it is necessary to reconstruct the 3D contour of the tool after modeling the grain distribution on the surface of the tool.
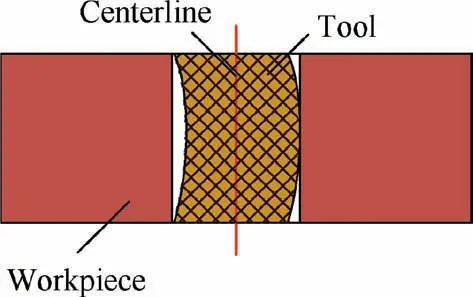
Fig. 7 Diagram of tool-workpiece contact.
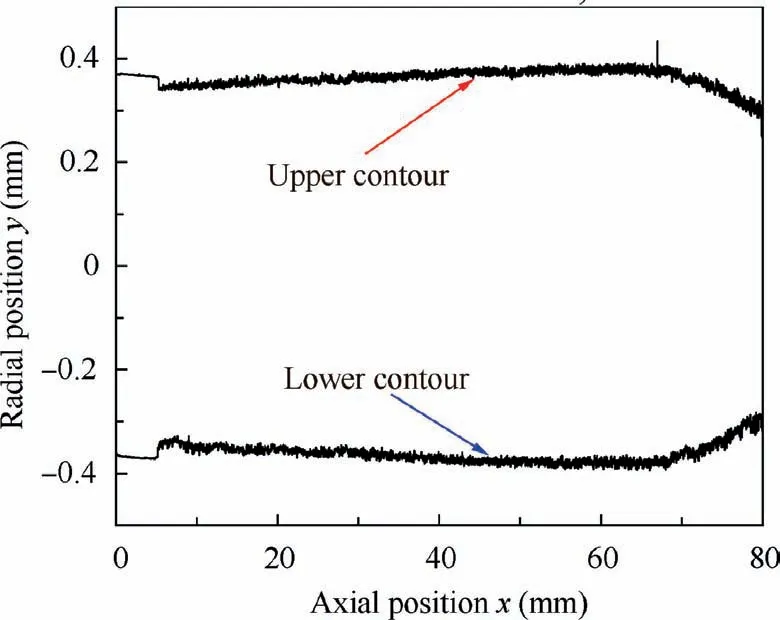
Fig. 8 2D equivalent contour of tool.
3.3.1. Bearing ratio measurement of 2D tool contour
As can be seen from Fig.9,due to the randomness of the size,shape and distribution of grains on the tool,the 2D projection contour is extremely complex. Therefore, the bearing ratio characteristic is extracted to characterize the 2D contour of the tool. In order to reduce the influence of tool shape error on the bearing ratio, the 2D contour is evenly divided along the axis with an equal interval of 0.5 mm. The tool contour within a single interval is shown in Fig. 9. The bearing ratio of the contour at a certain radial height is defined as the percentage of the projected length of the grains (the sum of the red lines) in the total axial length of the contour, so the following algorithm is adopted to calculate the radial distribution of 2D contour bearing ratio:
1) Interpolate points at equal intervals along the axial direction. The total number of points is N, and record the radial height value y of each point,
2) For a certain height y, calculate the number of points in y >y,
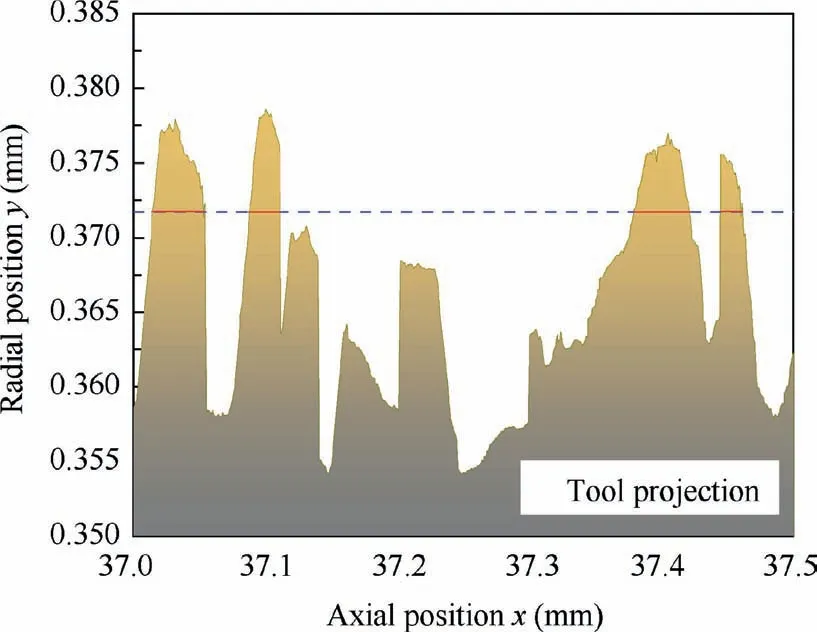
Fig. 9 Local 2D contour of tool.
3) N/N is the bearing ratio at y,The bearing ratio distribution calculated by the above algorithm is shown in Fig.10.As the height decreases,the bearing ratio gradually increases and finally stabilizes at 1, which means that all abrasive particles are in full contact with the workpiece,and the abrasive particles are completely embedded in the workpiece.
3.3.2. Distribution model of grain exposing height
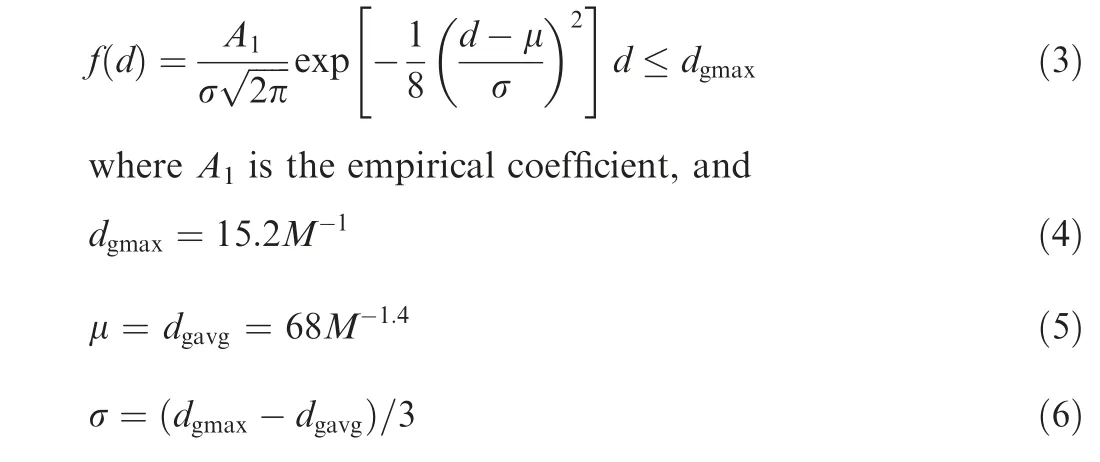
The tool surface is composed of a large number of random,disordered and irregular grains, which are simplified into spherical particles.When the grain mesh M is determined,the distribution of grain diameter d is shown in Fig. 11, and its probability density function meetsGrains with different shapes and diameters are randomly distributed on the tool surface, and the exposing height of grains also presents the corresponding randomness. Relevant studies have shown that the distribution of grain exposing height is approximately the same as the distribution of grain diameter.Therefore,when the maximum height of the tool surface is y,the distribution of y of the grain exposing height is shown in Fig. 12, and its probability density function is as follows:

3.3.3. Theoretical bearing ratio of 2D tool contour
For the axial length l of the tool, the projection of randomly distributed grains on the surface under parallel light is shown in Fig. 13. The bearing ratio of the contour at y=yis the proportion of the projected length of the grains to the total length l.
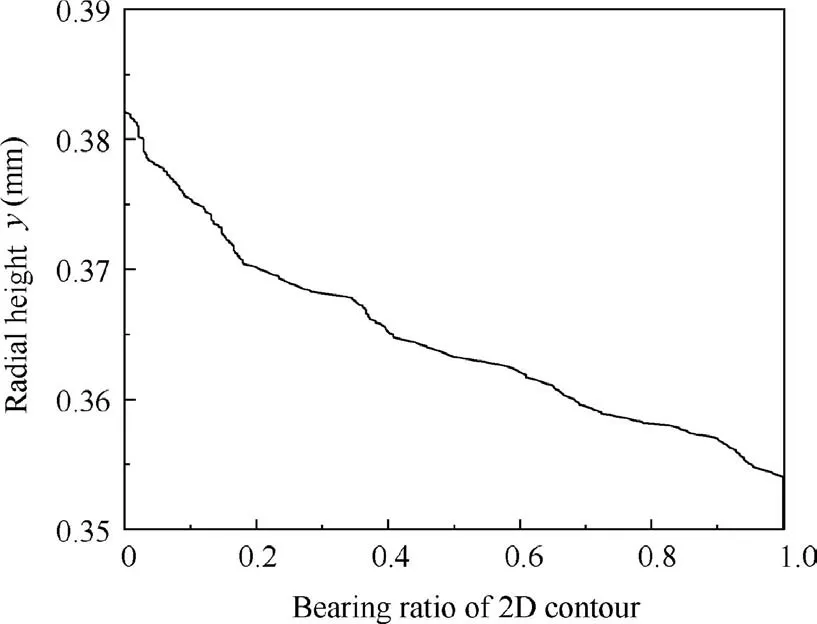
Fig 10 Bearing ratio distribution of local 2D contour.
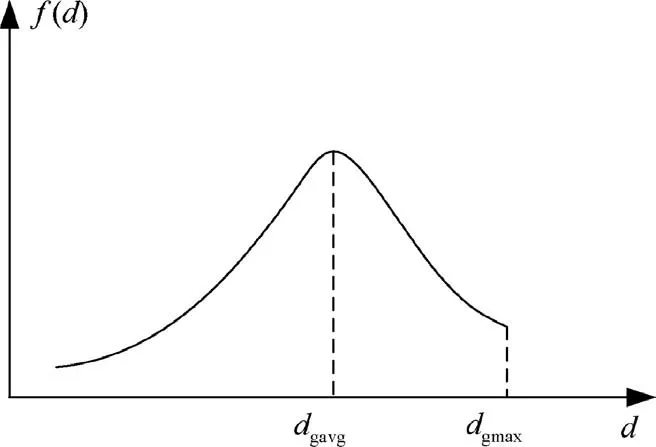
Fig. 11 Distribution of grain diameter.
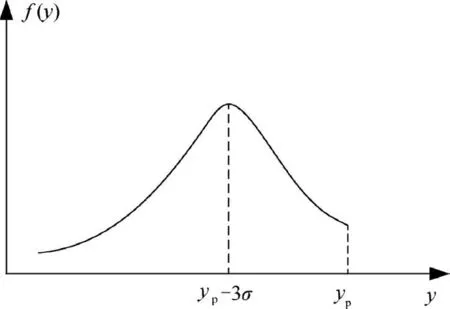
Fig. 12 Distribution of exposing height when maximum height is yp.
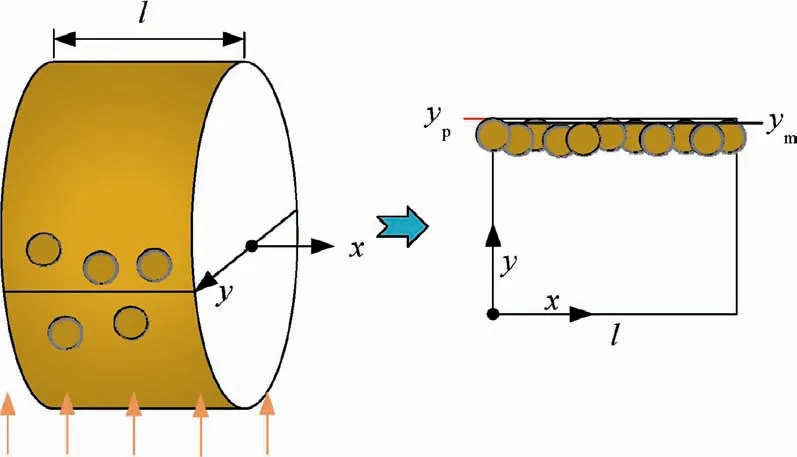
Fig. 13 Schematic diagram of grain projection.
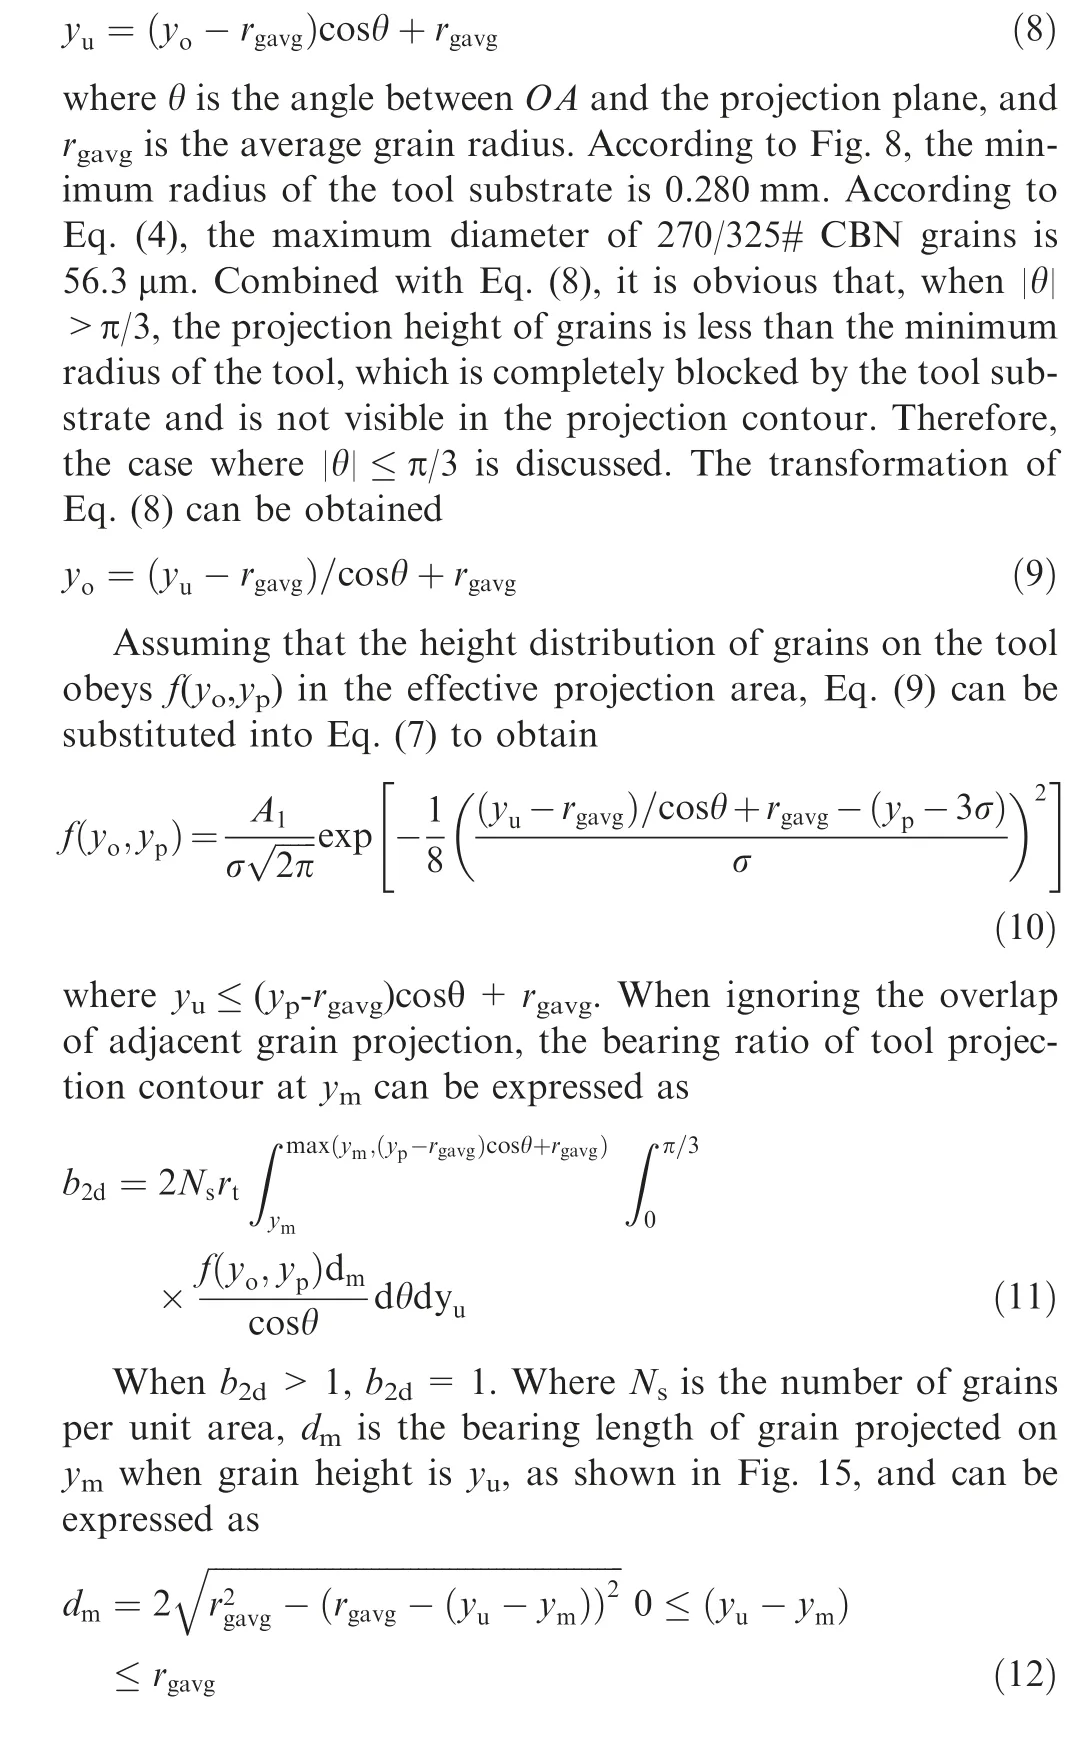
In the 3D contour of the tool,the exposing height yof the grains is defined as the distance between the highest point of the grains and the centerline of the 3D contour.The radial projected height of the highest point of grain A, whose exposing height is y, on the 2D projected plane is denoted as y, as shown in Fig. 14. Therefore, the two meet the following relationship
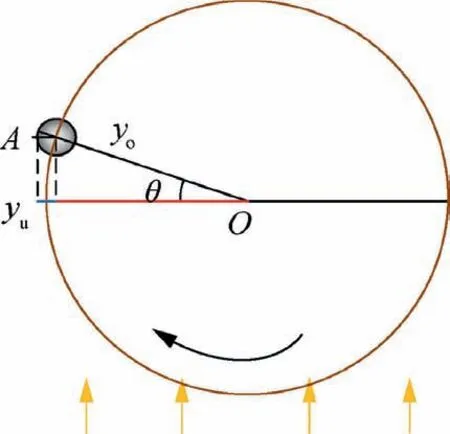
Fig. 14 Schematic diagram of grain projection transformation.
3.3.4. Validation of grain distribution model
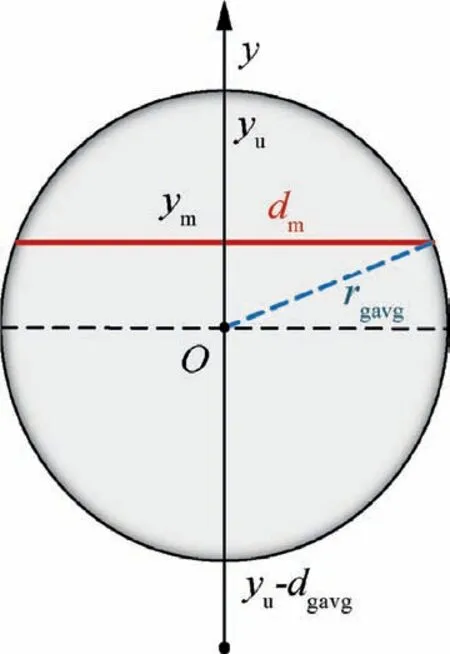
Fig. 15 Projection diagram of single grain.
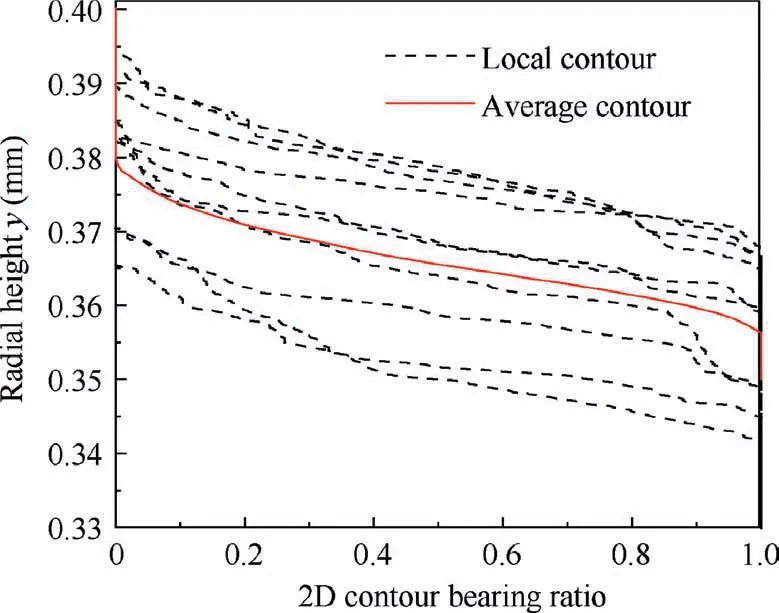
Fig. 16 Average bearing ratio of tool.
The parameter N=ANis defined. When Nand yare given, the bearing ratio of 2D projection contour at different ycan be calculated according to Eq.(11), and then the bearing ratio curve of the theoretical 2D projection contour can be obtained. Ncan be fitted by the 2D bearing ratio curve measured by tests. The bearing ratio distribution curves of local tool contour are shown in Fig. 16. Although the maximum height yof the grains varies in different positions, the overall trend of the bearing ratio is consistent.However,the randomness of the grain distribution will probably lead to a large random error. To reduce the influence of the above errors on the fitting accuracy, it is assumed that the grains are evenly distributed,and the Nat each position is the same.The calculation method of the average bearing ratio curve is as follows:
1) Calculate the contour bearing ratio curves in all axial equipartition intervals of the tool.
2) The bearing ratio curves are discretized within the interval [0,1], with a discretization interval of 0.001 mm, to obtain the vector of the discretized bearing ratio curves.
3) The discretized bearing ratio vectors are used to interpolate the bearing ratio curves in 1) to obtain the radial heights of each bearing ratio curves.
4) By averaging the radial heights at each bearing ratio,the corresponding relationship between the radial height and the bearing ratio is obtained, which is called the average bearing ratio curve.
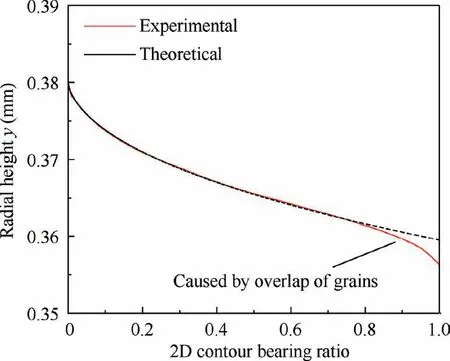
Fig. 17 Average bearing ratio of tool (experimental vs. theoretical value).
As can be seen from Fig.16,the average bearing ratio curve of the tool is smooth, which can reflect the variation law of each local bearing ratio curve. When Nis 540 mm, the 2D bearing ratio curve of the tool calculated is shown in Fig. 17. It can be seen that the experimental values are more consistent with the theoretical values when the radial height is larger. However, when the radial height gradually reduces,there is a larger error between the measured and calculated curve, which is because the projection overlap isn’t taken into account. When the bearing ratio is small, as can be seen from Fig. 11, the number of effective grains lessens, and the probability of the projection overlap of grains is low, which can be ignored. However, when the bearing ratio increases, the number of effective grains increases,and the projection of adjacent grains will overlap with a greater probability, resulting in the measured value of the bearing ratio less than the theoretically calculated value. Therefore, only data below 0.5 are used for Nfitting.
As can be seen from Fig. 17, when the bearing ratio is less than 0.5 mm, the bearing ratio curve measured coincides with the theoretical calculation curve. Therefore, the accuracy of the grain distribution model of the single-pass honing tool is also verified.Combined with the fitted N,the grain height distribution can be obtained by the maximum height y. As shown in Fig.18,it can represent the radial height distribution of the grains along the tool,thus the representation of the tool contour is simplified by extracting the feature of the 2D tool projection contour.
3.4. 3D contour characterization of single-pass honing tool
3.4.1. 3D contour distribution model of single-pass honing tool
The 3D contour distribution of the tool can be characterized from three dimensions: axial distribution, radial distribution and peripheral distribution. In Section 3.3, the measurement and evaluation methods of the axial and radial distribution are established.At any section in the axial direction of the tool,the maximum radial height yat each angle is different. To characterize the distribution of the tool along the circumference, it is necessary to rotate the tool along the axis, measure the projection contour, and then obtain the maximum radial height yat different angles.
Due to the randomness distribution of grains, the maximum contour height on the projection surface is not equal to the local maximum height in the 3D contour of the tool, as shown in Fig. 14. Therefore, the measurement error is introduced with the maximum error modeled as

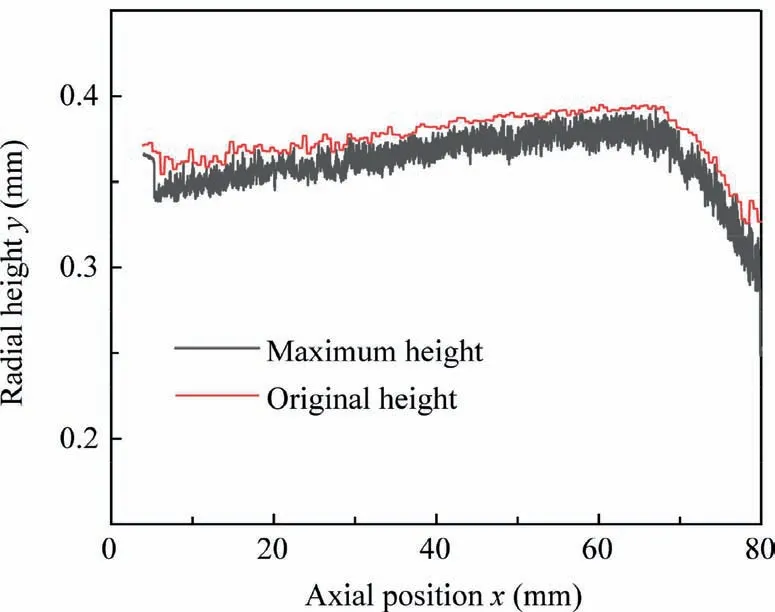
Fig. 18 Distribution of 2D contour maximum height.
where ris the tool radius. Taking the measurement accuracy and efficiency into consideration, projection planes are measured for each 10°. When r=0.4 mm and θ=5°, the maximum error is about 1.5 μm. For the measured results, the distribution of the radial height yis shown in Fig. 19.
The distribution frequency of the maximum contour height yin the circumferential direction at the position x is shown in Fig. 20. The maximum radial height yat different axial positions is simplified into the uniform distribution in the interval[y,y],as shown in Fig.21.Then the probability density of yin the distribution interval [y, y] can be expressed as

where yand yare the minimum and maximum value of yat the current position respectively.
3.4.2. 3D static bearing ratio of single-pass honing tool
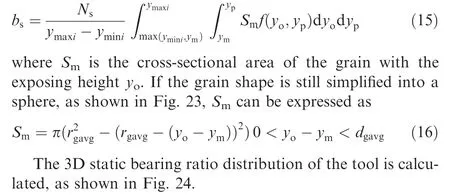
The 3D static bearing ratio of the tool is defined as the percentage of the grain area at a certain radial height to the total surface area to represent the 3D tool contour,as shown in Fig.22.In order to mitigate the influence of tool shape error on the bearing ratio, the tool is equally divided along the axial direction with equal interval l=0.5 mm. The bearing ratio bat a certain axial position can be expressed as
4. Single-pass honing tests
4.1. Experimental setup
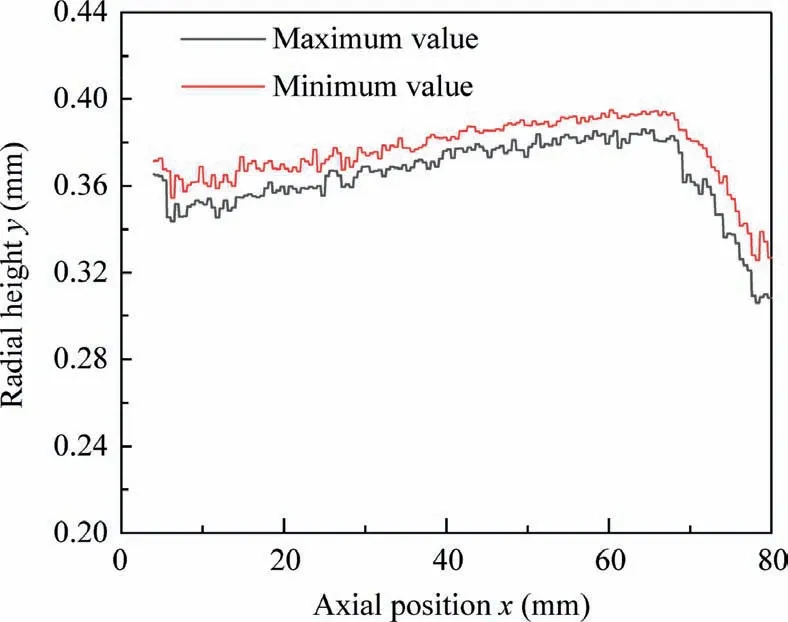
Fig. 19 Radial height distribution of the maximum and minimum tool contour.
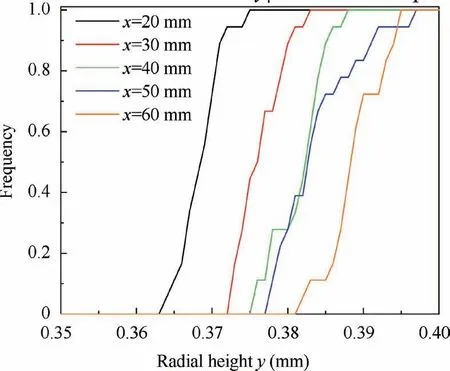
Fig. 20 Distribution frequency of yp along circumference.
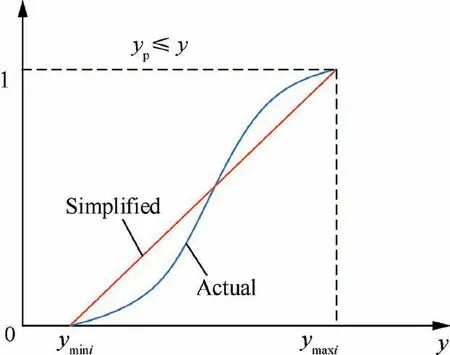
Fig. 21 Distribution model of yp along circumference.
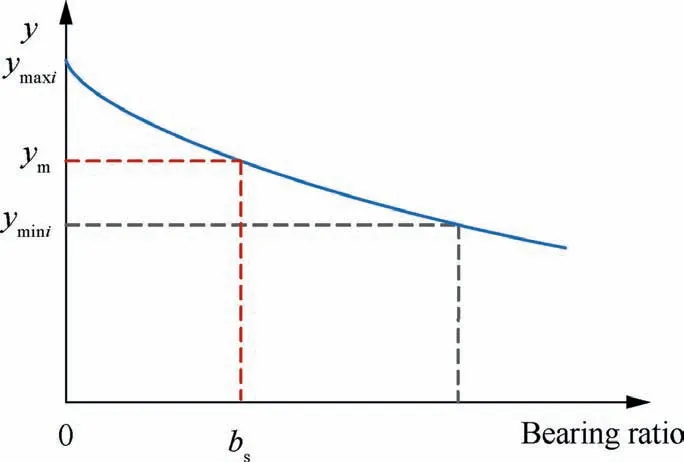
Fig. 22 Diagram of static bearing ratio distribution.
The tests were carried out at DMG MORI Ultrasonic 20 Linear. The test platform was shown in Fig. 25. Using 4Cr13 as the workpiece material,the wear test of the single-pass honing tool was conducted. The original holes of the workpiece were obtained by drilling, with bore diameter from 0.744 to 0.750 mm and hole length of 1.3 mm.The coolant was 5%castrol 9554 water-based emulsion with an external cooling pressure of 4 bar.
The spindle speed of wear test was 3000 rpm, the feedrate was 30 mm/min, and retracting speed was 150 mm/min. The multisensor coordinate measuring machine (CMM) produced by Werth was used to measure the bore diameter and the 2D projection contour of the tool under different wear conditions.
4.2. Evolution of bore diameter and tool contour during wear
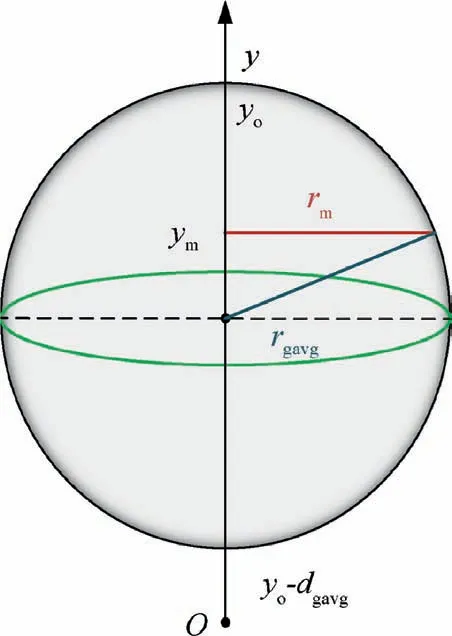
Fig. 23 Bearing area of a single grain.
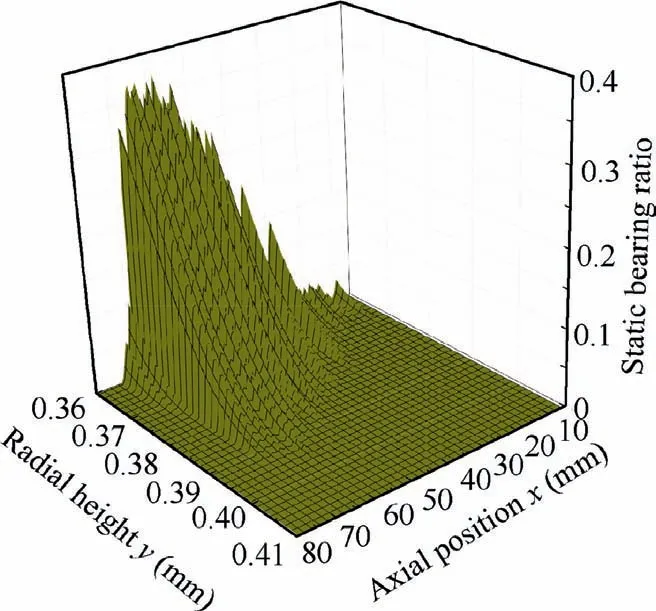
Fig. 24 Distribution of 3D static bearing ratio.
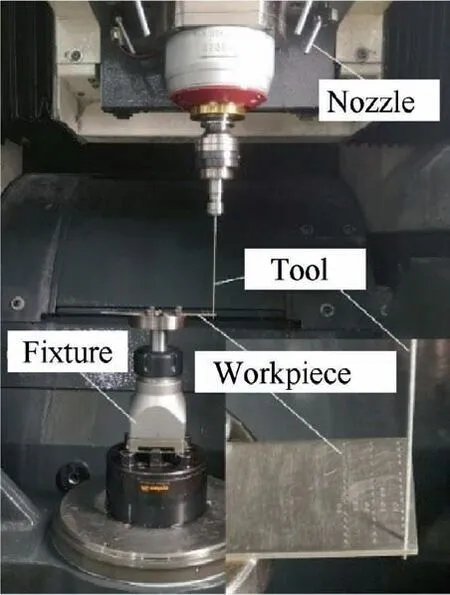
Fig. 25 Test platform of tool wear.
Fig.26 shows the bore diameter obtained under different accumulative material removal volumes (MRV) during single-pass honing of 4Cr13.At the initial stage of wear,the bore diameter decreases rapidly, and the tool wears rapidly. When the accumulative MRV reaches 4.046 mm, the reduction rate of bore diameter tends to be flat and the tool becomes stable wear phase. Fig. 27 shows the distribution of static bearing ratio in the initial state of the single-pass honing tool. When the radial height is greater than 0.39 mm, the tool surface has fewer effective grains and a very small bearing ratio,so the tool will wear faster.With the tool wear, the static bearing ratio of the tool increases gradually,and the wear resistance of the tool also increases correspondingly.
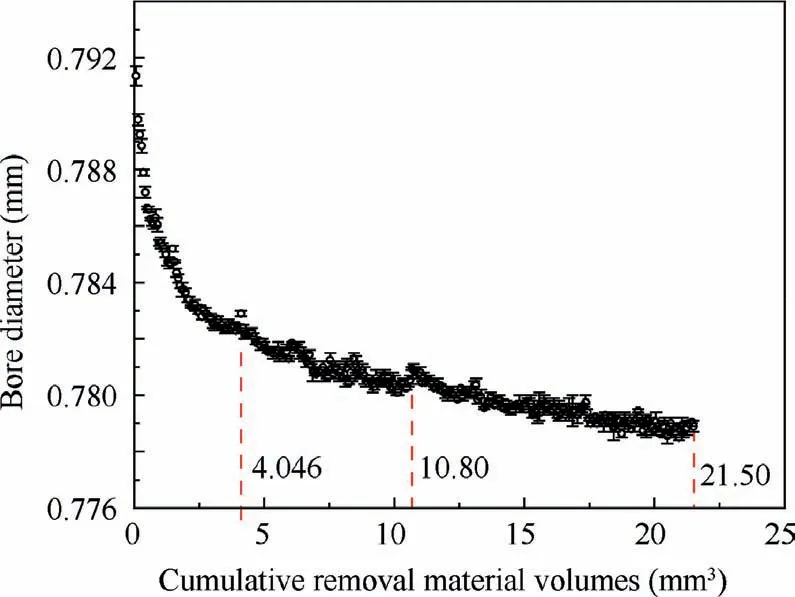
Fig. 26 Bore diameter under different accumulative MRV.
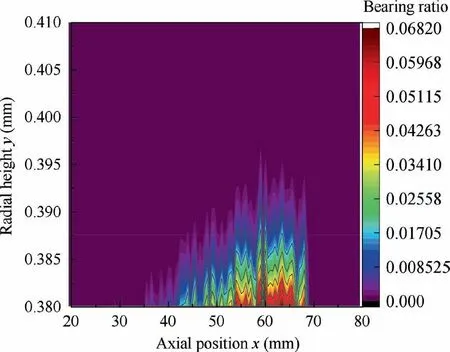
Fig. 27 Contour map of static bearing ratio.
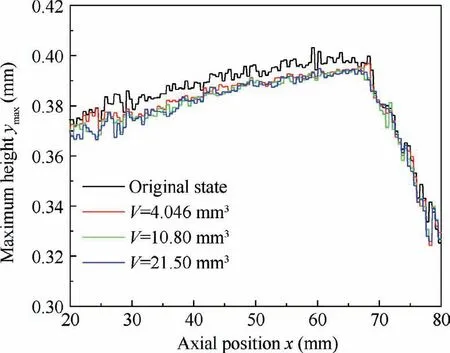
Fig. 28 Wear evolution of tool maximum contour.
During single-pass honing, the cutting depth of grain is small, and only the grains with higher exposing height participate in cutting and occur wear. Therefore, the distribution of the maximum circumferential height along the axial direction of the tool,namely the change law of y,can reflect the wear law of the tool.Fig.28 shows the maximum contour after tool wear under different accumulative MRV. During the initial stage of tool dressing, the maximum contour of the tool reduces rapidly, which is also consistent with the change law of bore diameter. Subsequently, the accumulative MRV continues to increase, and the tool maximum contour only has a bit amount of reduction. The overall contour doesn’t change significantly,and the tool wear tends to be stable.In addition,by comparing the measured contour between V=10.80 mmand V=21.50 mm, it can be seen that the radial wear of the tool is very small.The maximum error of the measurement method used is about 1.5 μm,and the measurement results can no longer well distinguish the micro wear of the tool. Therefore, the measurement by CMM can not meet the accurate characterization of tool contour during further dressing, so the simulation should be adopted to predict the tool contour.
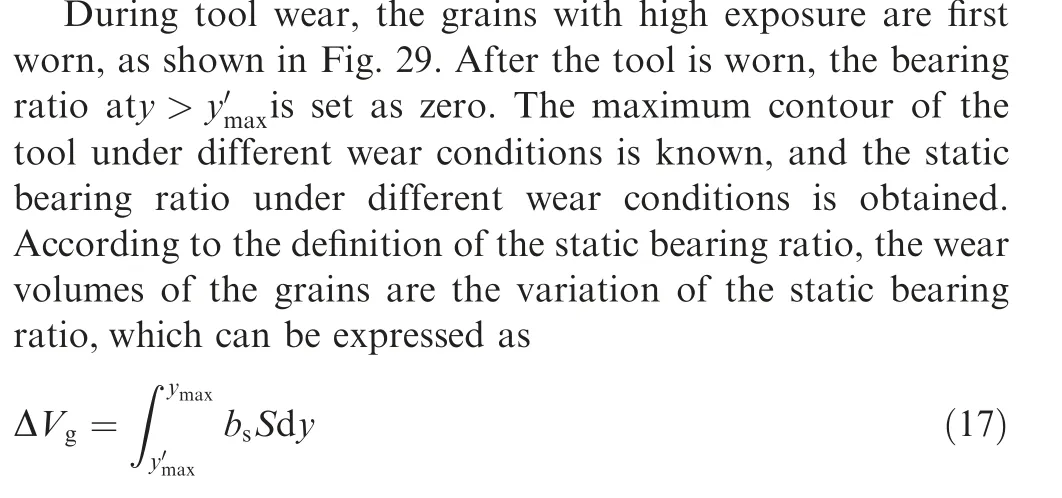
where bis the static bearing ratio and S is the surface area in the axial interval of the tool.
Generally, the grinding ratio is defined as the ratio of the accumulative MRV to the wear volumes of grains. When the accumulative MRV is up to 10.08 mm,the bigger the bearing ratio of the maximum tool contour is, the smaller the actual radial wear becomes.The measurement error of the tool radial height has a great influence on the wear volumes of the tool,resulting in the error of the grinding ratio. Therefore, only the maximum tool contour before the accumulative MRV reaching 10.08 mmis used to calculate the grinding ratio.According to Eq. (17), when the accumulative MRV reaches 10.80 mm, the tool wear volume is 0.0004800 mm, and the grinding ratio is 22,500.
5. Contour evolution prediction of single-pass honing tool
5.1. Contact process between tool and workpiece
During single-pass honing, the tool is fed along the axis x as rotating, as shown in Fig. 30. The effective grains on the tool surface from point B to point E contact the cutting layer of the workpiece in turn to remove the material.Due to the periodicity of the tool rotation,the cutting trajectories of the grains on the workpiece surface can be seen as spiral lines, and f is the feed per revolution of the tool. Ideally, the cutting states of adjacent workpiece surfaces of length f are identical, and only the contact between the tool and the workpiece with length f is considered.
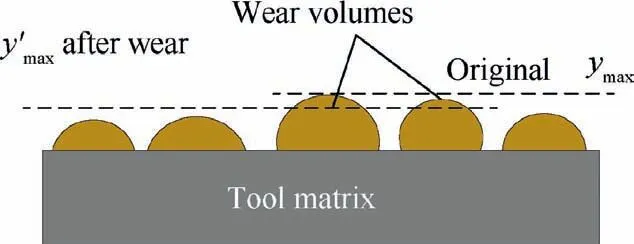
Fig. 29 Schematic diagram of CBN grain wear in single-pass honing.

Fig. 30 Contact diagram between single-pass honing tool and workpiece.
Expand the tool surface length dx and bore surface length f along the bus, as shown in Fig. 31. The angle α can be expressed as

To describe the volumes of interference with the workpiece surface during the contact between the tool and the workpiece,the dynamic bearing ratio of the tool bis defined,as shown in Fig. 32.
The tool is still discretized along the axial direction, with the interval l=0.5 mm,and the dynamic bearing ratio of each section is calculated respectively. The track overlap of grains will affect the value of dynamic bearing ratio, thus l is further equably divided into n segments,with the interval dx.When dx is small enough, it can be approximately considered that the grains in dx will not have trajectory interference in honing process. After calculating the dynamic bearing ratio of each dx,the dynamic bearing ratio of the tool is obtained on the length l.

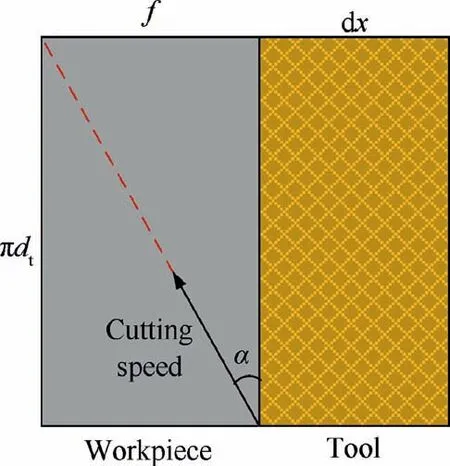
Fig. 31 Local expansion diagram of tool and workpiece.
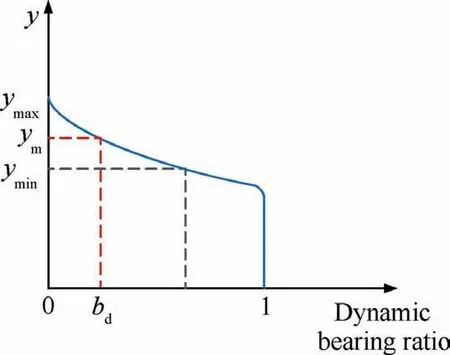
Fig. 32 Distribution diagram of dynamic bearing ratio.
where b(m-1) is the dynamic bearing ratio obtained after the accumulation of adjacent (m-1)b, and for any m ∈[2,n], if b(m)>1, b(m)=1. Therefore, the dynamic bearing ratio of tool surface with length l at ycan be expressed as

When the feed per revolution f is 0.1 mm/rev,the discretization interval l is 0.5 mm,and the equally interval dx is 0.05 mm,the dynamic bearing ratio of the tool in the initial state calculated based on Eq.(22)is shown in Fig.33.Near the highest point of tool contour, the number of effective grains and the dynamic bearing ratio are both small. As the radial height of the contour decreases, the dynamic bearing ratio gradually increases and finally stabilizes at 1.
5.2. Distribution of material removal volume
Affected by cylindricity error and surface roughness, the hole is not an ideal cylinder.As shown in Fig.34,yand yrespectively represent the lowest and highest points of the workpiece.The bearing ratio is still used to characterize the workpiece surface, as shown in Fig. 35. Compared with the unilateral removal allowance of the workpiece, the difference between the highest and lowest points of the initial workpiece contour is small. In order to make the calculation easier, the bearing ratio of the workpiece is always simplified in single-pass honing process. The simplified bearing ratio curve equation is denoted as W(y).
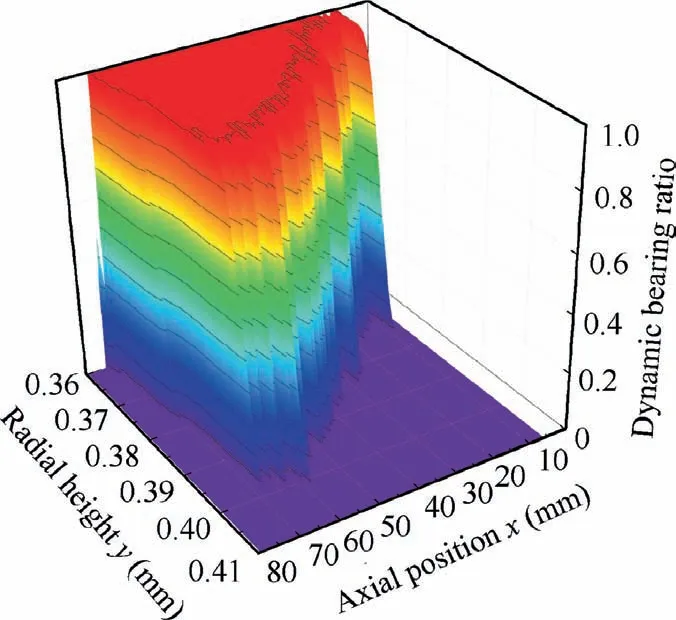
Fig. 33 Dynamic bearing ratio of tool under initial state.
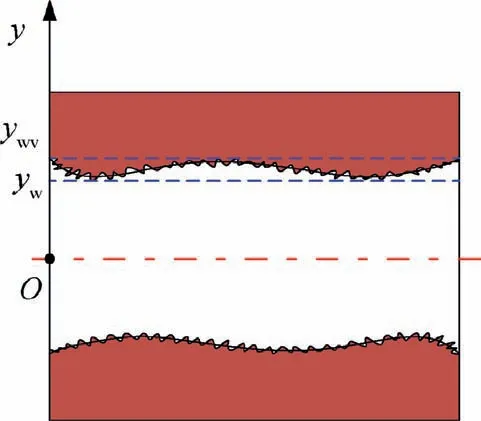
Fig. 34 Diagram of hole surface.
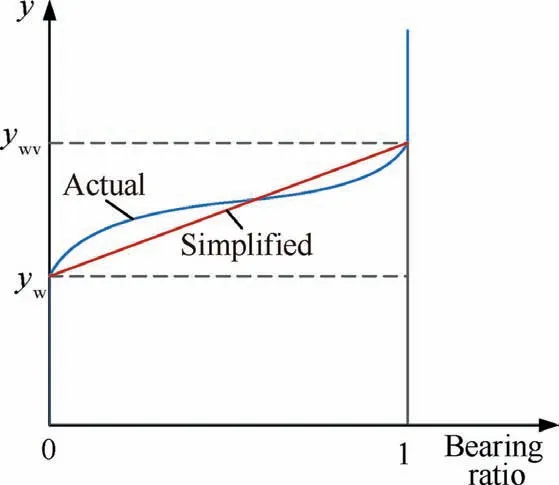
Fig. 35 Distribution diagram of workpiece bearing ratio.
During single-pass honing, grains at the front of the tool participate in cutting to remove material, which creates a new contour on the workpiece surface. The subsequent grains cut the newly generated workpiece surface in turn until all grains on the tool surface participate in cutting.After the axial discretion of the tool, each section of the tool along the axis cuts the workpiece surface in turn. The tool maximum height of the axial section[x,x+l]is denoted as y,and dynamic bearing ratio curve is denoted as T(y). After cutting by the section of[x-l,x],the highest and lowest points of the workpiece surface are yand yrespectively, and the bearing ratio curve of the workpiece surface is denoted as W(y).When y≤y, as shown in Fig. 36, the tool does not interfere with the workpiece, and the workpiece material is not removed.
When y<y≤y, contact diagram of workpiece and tool is shown in Fig.37.The expected value of the material removal volume by this section of tool in honing process is

where kis the chip formation coefficient,which represents the proportion of removal material in the cutting deformation area.
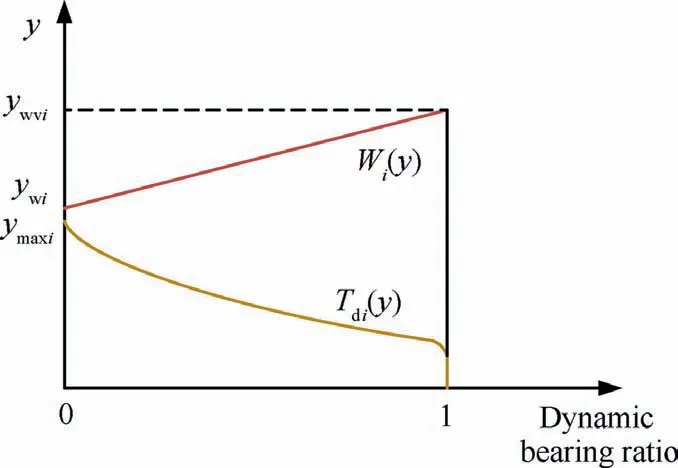
Fig. 36 Contact diagram of workpiece and tool (ymaxi ≤ywi).
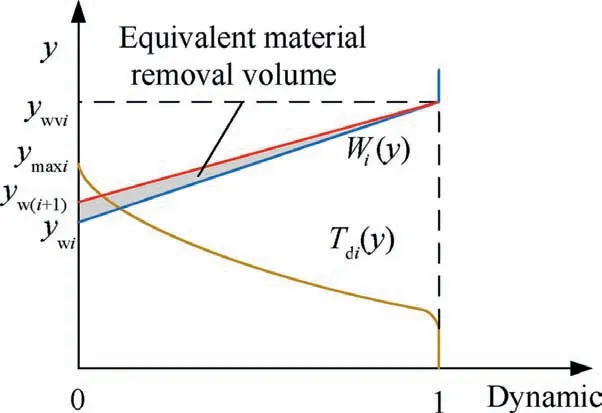
Fig. 37 Contact diagram of workpiece and tool(ywi <ymaxi <ywvi).
The bearing ratio of workpiece after honing is still approximately a straight line,and the process results in the lowest point of workpiece surface increasing from yto y.
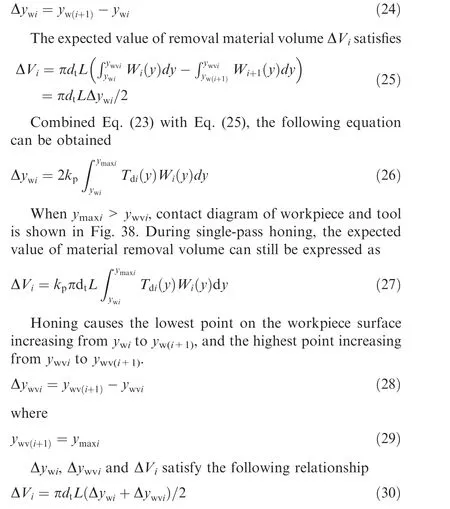
Combined Eq. (27) with Eq. (30), the following equation can be obtained
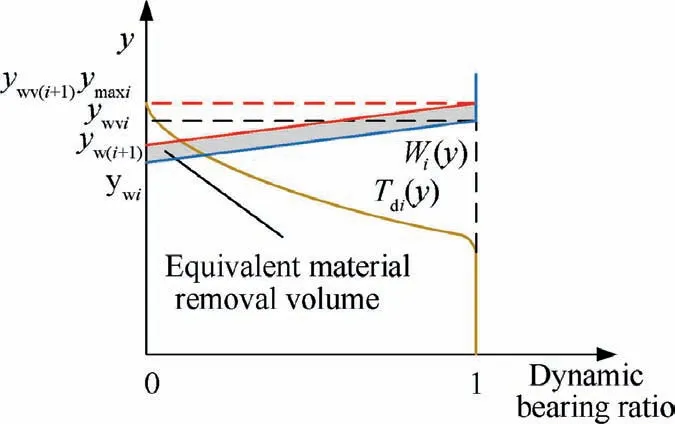
Fig. 38 Contact diagram of workpiece and tool (ymaxi >ywvi).

When y<y≤y, Δy=0. Given the dynamic bearing ratio of the tool in section i and the current bearing ratio of the workpiece, the volumes of the workpiece material removed by the tool in section i can be obtained according to Eq. (23). In addition, Δycan be calculated by Eq. (32). It is concluded that the bearing ratio of the workpiece after cutting is denoted as W(y),which can be set as the initial condition until the MRV distribution at each section of the tool is obtained.
5.3. Distribution of grain wear volume
According to Section 4.2, the grinding ratio G is calculated.Assuming that the grinding ratio at each axial position is the same, the wear volume of CBN grains can be calculated according to the MRV in each section of the tool, which can be expressed as
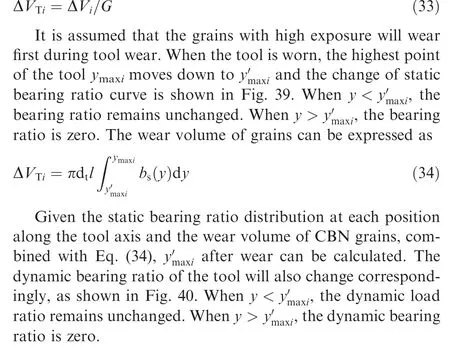
5.4. Evolution of tool contour

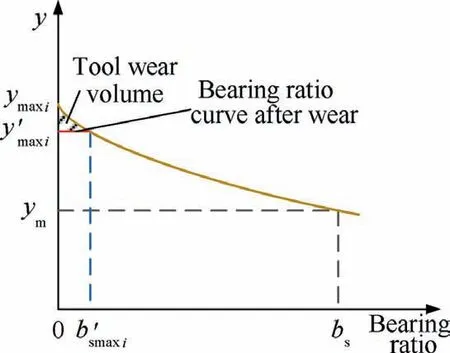
Fig. 39 Influence of tool wear on static bearing ratio.
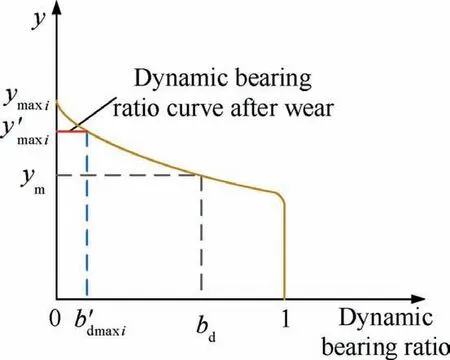
Fig. 40 Influence of tool wear on dynamic bearing ratio.
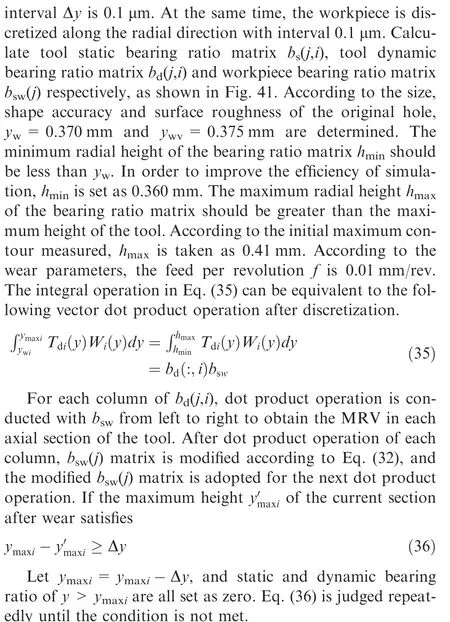
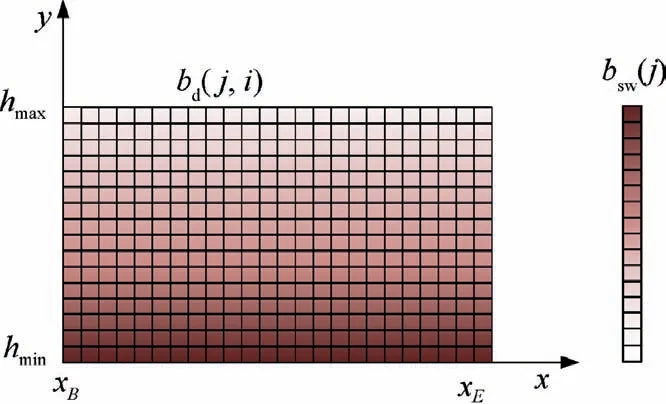
Fig. 41 Bearing ratio matrix of tool and workpiece.
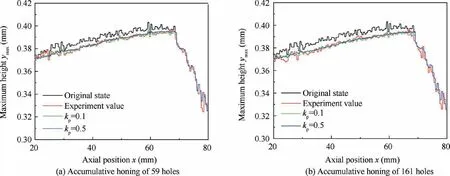
Fig. 42 Experimental and predicted values of tool contour under different wear conditions.
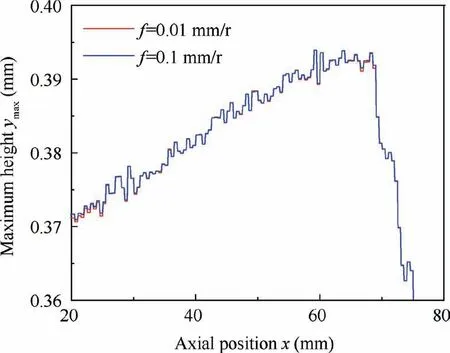
Fig. 43 Influence of feed per revolution on tool wear.
When ktakes different values,the comparison between the tool maximum contour of simulation and measurement obtained after honing different number of holes is shown in Fig.42.It can be seen that there is a good consistency between the predicted and measured contour, the tool wear prediction model can better predict the tool wear during single-pass honing. By comparing the tool contour obtained by simulation under different k, it can be seen that khas little influence on tool wear. After increasing k, the maximum profile after tool wear is smoother.
As shown in Fig. 43, tool contour is compared with different f after honing 161 holes.It can be seen that the impact of f on tool wear is small. The tool wear decreases slightly with increasing f. According to Eq. (20), the dynamic bearing ratio of the tool decreases with increasing f, resulting in decreasing in the actual MRV.The dynamic bearing ratio values are similar under different f.
When k=0.1and f=0.01 mm/r, the predicted results of tool contour are shown in Fig.44.It can be seen that the maximum contour of the honing tool gradually decreases with wear.With growth in the number of effective grains,the bearing ratio of the tool also increases.While the wear resistance of the tool gradually improves, and finally the radial wear rate gradually decreases.
6. Life prediction of single-pass honing tool
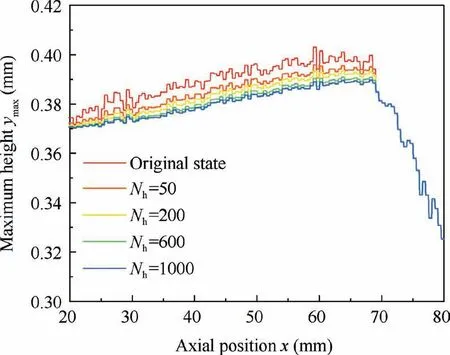
Fig. 44 Tool contour revolution along with wear.
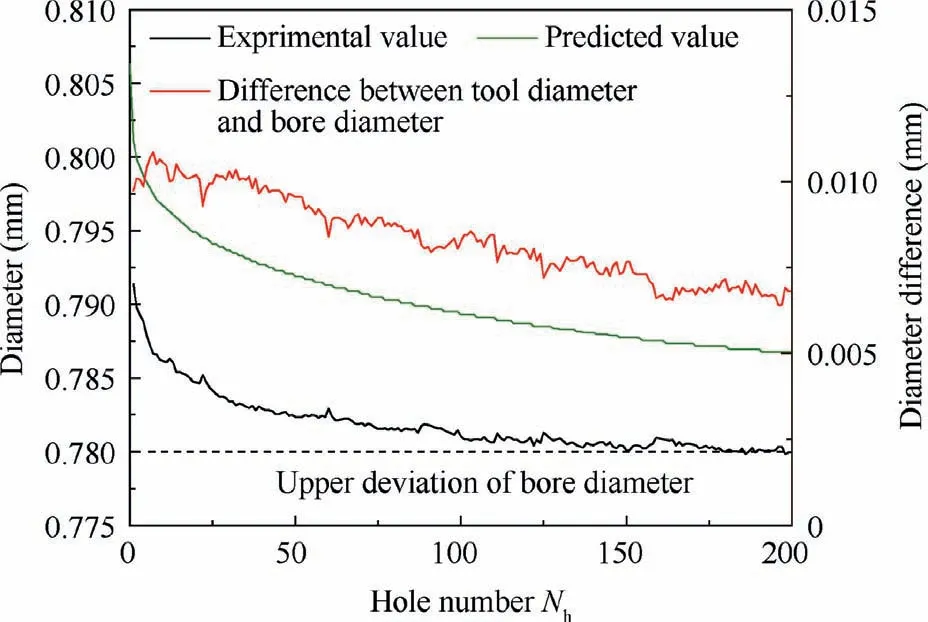
Fig. 45 Change law of bore diameter during wear.
It can be seen from the above analysis that the radial wear amount of the tool augments with the increase of hole number honed,and the obtained bore diameter will also decrease under the same processing parameters. When the bore diameter is less than the upper deviation of the design value, it is determined that the tool has reached the required size and the dressing is stopped. When the bore diameter after honing is less than the lower deviation of the design value,the tool is judged to be failed. Therefore, in order to realize the accurate prediction of tool life,it is necessary to make clear the change law of the tool diameter in the wear process. Fig. 45 shows the variation of the predicted maximum diameter of the tool and the test value of the machining bore diameter with the increase of hole number when k=0.1 and f=0.01 mm/r. As the hole number increases,the maximum diameter of the tool decreases rapidly,and then the decreasing speed gradually flattens.Also,by comparing the maximum diameter of the tool with the measured diameter,it can be found that the maximum diameter of the tool is slightly larger than the processed bore diameter.Due to cutting force, the surface of the workpiece will be slightly elastic deformation, resulting in the maximum groove depth yless than the maximum tool diameter y,as shown in Fig. 46. In addition, due to the residual material on the workpiece surface,the reference yfor the bore diameter measurement is also less than the maximum cutting groove depth of the workpiece surface y. The difference between the biggest diameter of the tool and bore diameter honed is denoted as Δd. It can be seen from Fig. 45 that the difference gradually tends to be stable with the increase of hole number machined.
The reasons for the formation of bore diameter are complicated, which are not only influenced by the tool contour, but also related to the honing parameters. Given the tool maximum contour prediction value, the difference between maximum diameter of the tool and bore diameter Δdis calculated with the tool wear,thus the change of bore diameter with tool wear can be obtained.As shown in Fig.45,Δdfluctuation is small when honing parameters are the same. Therefore, Δdis only related to the tool contour and can be expressed as the function of N. The tool diameter forecast curve and the bore diameter test value curve are similar to the exponential function. In order to reduce Δdfitting error,the following function model is used.

where a,a,b,band care constants,and Nis the number of processing holes.According to the data in Fig.45,the above parameters are fitted by least square method, where a=0.005619, b=-0.006317, a=0.1122, b=-13.98 and c=0.005196. According to the predicted value of tool diameter, the variation law of the diameter obtained by single-pass honing with the hole number is shown in Fig. 47 under the conditions of spindle speed 3000 rpm, feed rate 30 mm/min, retracting rate 150 mm/min and original bore diameter from 0.744 to 0.750 mm.With the increase of the hole number, the obtained bore diameter gradually decreases, and the variation trend of bore diameter is consistent with tool diameter. As shown in Fig. 47, the accuracy of the bore diameter prediction model is verified by the good consistency between the experimental and predicted value.
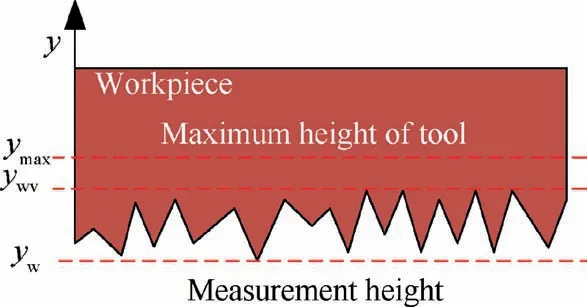
Fig. 46 Schematic diagram of workpiece surface morphology after honing.
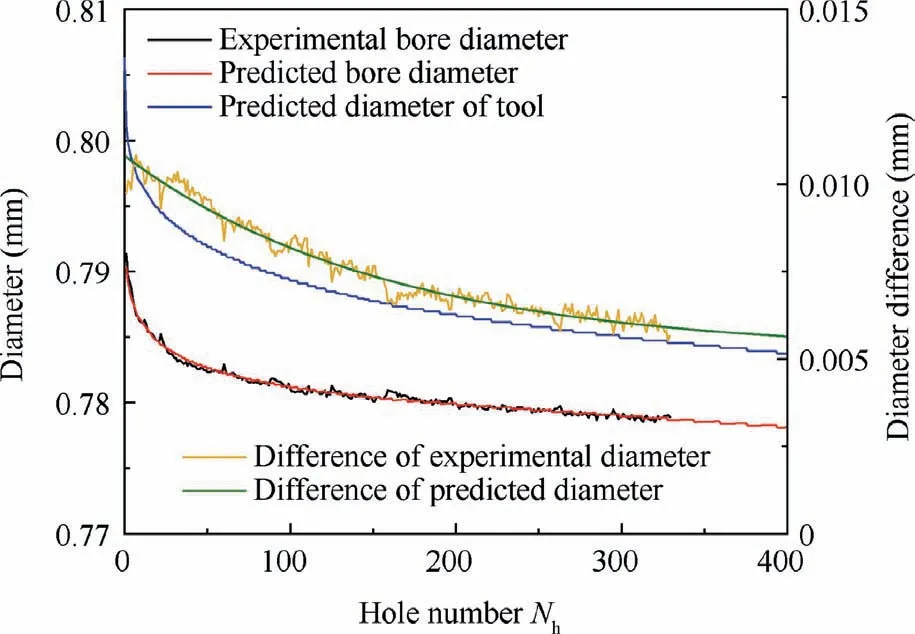
Fig. 47 Predicted and experimental values of bore diameter during wear.
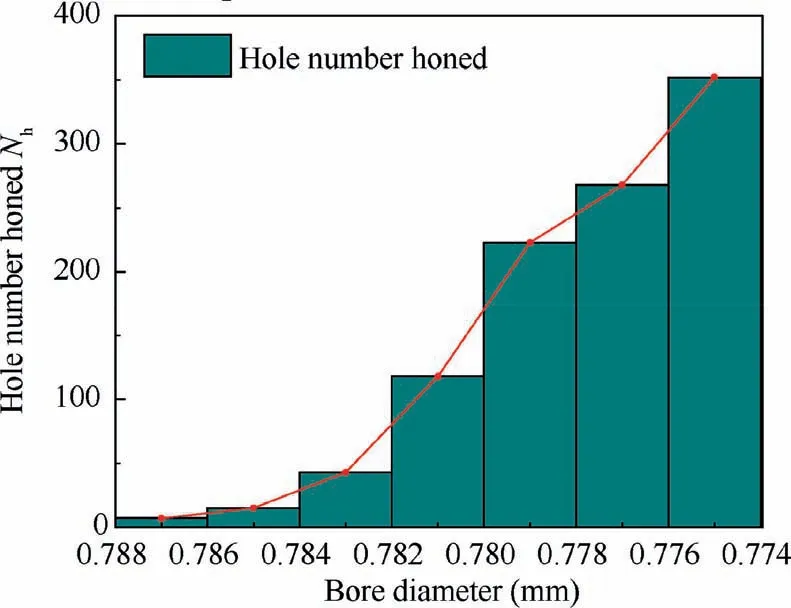
Fig. 48 Tool life of different bore diameter range.
According to the above bore diameter prediction model,the bore diameter during tool wear is counted to obtain the hole number with different bore diameter range,which is called tool life,as shown in Fig.48.In the initial stage of tool wear,due to the rapid wear of the tool,the bore diameter after honing also rapidly decreases, and the tool life in the corresponding bore diameter range is also short. The dimension tolerance of the fuel injection nozzle is 0.002 mm, and the number of holes between 0.786 mm and 0.788 mm is only 7.The wear resistance of the tool climbs gradually with tool wear, and the reduction rate of bore diameter descends. In the same tolerance range,the number of holes that can be processed by the tool increases, and the tool life in the corresponding bore diameter range also increases. When the radial wear reaches 13 μm, the bore diameter range of honing is from 0.774 mm to 0.776 mm,and the tool life is 352 holes. Therefore, the tool life can be extended significantly by increasing the dressing amount, but the dressing time of single-pass honing tool will increase. In the process of tool design and preparation, the tool life and dressing cost should be considered comprehensively to reserve appropriate dressing allowance.
7. Conclusions
In this article,a measurement and characterization method has been established for the design of a single-pass honing tool.Based on the method, the tool wear test was carried out, and the tool contour evolution model was established to predict the tool contour evolution and tool life.The main conclusions are listed as follows:
(1) The 2D projection contour of the single-pass honing tool was measured accurately by parallel light projection. By extracting the characteristic parameters of the tool 2D projection contour, the relationship between the 2D projection contour and the distribution parameters of grains on the tool surface was established, so as to fit the distribution parameter of grains N=540/mm.
(2) The distribution of the maximum radial height along the circumferential direction and the axial direction of the tool was obtained by analyzing the 2D projection contour at different rotation angles. When measuring one projection plane per 10°, the measurement error of the maximum radial height could be controlled within 1.5 μm. According to the distribution parameter of grains and the distribution of the maximum radial height, the 3D contour characterization model of the single-pass honing tool was established, and the static bearing ratio distribution law along the radial and axial direction of the tool was calculated.
(3) The wear test of the single-pass honing tool was carried out.The results show that with the increase of the accumulative MRV, the maximum contour and the bore diameter decreased rapidly, and then the reduction rate tended to be flat.According to the change of accumulative MRV and the static bearing ratio of the tool, the grinding ratio of honing 4Cr13 by the CBN tool was 22,500.
(4) By analyzing the microscopic contact process of toolworkpiece in the honing process,the relationship among dynamic bearing ratio of the tool, tool parameters and machining parameters was established. The radial wear amount was obtained by combining the grinding ratio and static bearing ratio distribution of the tool.The prediction of contour wear evolution was realized by simulation, and the deviation between the predicted and measured contour was less than 2 μm. According to the test results,the empirical formula of the relationship between the tool and bore diameter is fitted and verified,which realized the exact control of bore diameter and tool wear. Increasing the tool dressing allowance can prolong the tool life, but increases the dressing cost.Therefore, the tool life and dressing cost should be considered comprehensively to reserve appropriate dressing allowance.
Declaration of Competing Interest
The authors declare that they have no known competing financial interests or personal relationships that could have appeared to influence the work reported in this paper.
Acknowledgement
This study was supported by the National Science and Technology Major Project of China (2017-VII-0015-0111).
 CHINESE JOURNAL OF AERONAUTICS2021年4期
- CHINESE JOURNAL OF AERONAUTICS的其它文章
- Time delay compensation in lateral-directional flight control systems at high angles of attack
- Dual stability enhancement mechanisms of axial-slot casing treatment in a high-speed mixed-flow compressor with various tip clearances
- Development cost prediction of general aviation aircraft using combined estimation technique
- Improvement on shaped-hole film cooling effectiveness by integrating upstream sand-dune-shaped ramps
- Modeling and parameter identification of linear time-varying systems based on adaptive chirplet transform under random excitation
- An experimental method to obtain the hard alpha anomaly distribution for titanium alloy aeroengine disks
