Effect of no-load rate on recast layer cutting by ultra fine wire-EDM
Ming ZHANG, Zhidong LIU, Hongwei PAN, Cong DENG, Mingbo QIU
College of Mechanical and Electrical Engineering, Nanjing University of Aeronautics and Astronautics, Nanjing 210016,China
KEYWORDS Electrolytic dissolution coefficient;No-load rate;Recast layer;Ultra fine wire;WEDCM
Abstract Via material erosion in wire electrical discharge machining(WEDM),recast layers form on the surfaces of workpiece.In addition,ultra fine Wire-EDM can be usually cut once.To reduce the thickness of the recast layer as much as possible, the wire electrical discharge-electrochemical machining (WEDCM) method was proposed, which is based on the micro conductivity of the dielectric and microelectrolytic characteristics by adjusting the no-load rate of the pulse in the machining process. Furthermore, a state discrimination and servo control system based on discharge current was designed. The experiment results of different no-load rates show that the electrolytic effects increase as the no-load rate increases, and the main machining process is spark discharge erosion with a no-load rate in the range of 10%to 80%.At 90%no-load rate,the amount of recast layer formation in the forward direction of the wire electrode is almost the same as that of electrolytic dissolution, and it can be practically processed without a recast layer. Compared with 10% no-load rate, the kerf width only increases by 7.5%.
1. Introduction
In WEDM,the workpiece material is melted or gasified by the instantaneous high temperature of spark discharge, and the corrosion products not removed by the dielectric are resolidified on the surface of the workpiece to form a recast layer due to rapid cooling.Yadav et al.,Lee and Taimentioned the recast layer has high hardness and good wear resistance,but its poor combination with the matrix will reduce the service life of the workpiece under alternating load.Multiple cutting processes are usually used to reduce the thickness of the recast layer to improve the surface quality of the workpiece.Chenanalyzed the formation mechanism of the recast layer by establishing the heat transfer model of the bearing steel in the finishing process and reduced the abnormal discharge state and thickness of the recast layer by the magnetic assistant method. Han et al.studied the influence of different pulse periods on the surface morphology of the finish by thermal analysis. However, ultra fine Wire-EDM usually adopts smaller electrical specification to achieve smaller kerf, so it is not suitable to adopt multiple cutting methods to reduce the recast layer.The deionized wateror composite dielectriccommonly used in WEDM have a certain conductivity decided by dielectric concentration. Electrochemical machining relies on the dissolution of the anode metal to achieve material removal, and there are no surface defects, such as the recast layer and micro-cracking after machining.Many scholars have studied the electrical discharge machining (EDM) and electrochemical machining (ECM) combined machining to remove the recast layer. Nguyen et al.found that there was a transition from micro-EDM to hybrid micro-EDM/ECM in low speed feed machining in deionized water,so the method of simultaneous micro EDM and micro ECM (SEDCM) was proposed to reduce the surface roughness.Zhang et al.studied the material removal mechanism of tube electrode highspeed electrochemical discharge drilling (TSECDD) using a low-conductivity salt solution with various conductivities.Kurita and Hattorihave developed a new complex machining technology involving EDM and ECM-lapping.Wu et al.removed the recast layer on the surface of the workpiece after WEDM in deionized water by reverse machining with wire electrochemical machining (WECM), and predicted the influence of the feed speed of the wire electrode on electrolysis through a model. However, the WECM method must move the workpiece out to avoid spark discharge, which leads to processing limitations of complex shape parts.
In this paper, the WEDCM method is adopted, and the electrolytic effect of wire electrodes is changed by controlling the no-load rate defined as the ratio of the number of noload pulses to the number of total pulses in the machining.No-load pulse refers to the pulse that cannot break down the dielectric to discharge and remove the material, and only the leakage current exists during the period. It is hoped that beneficial exploration can be made in reducing the thickness of the recast layer without obviously increasing the kerf width.
2. Experimental device and conditions
This experiment was carried out with DK7720, a universal high speed wire-cut electrical discharge machining(HSWEDM) tool. A self-developed closed-loop constant tension control system was used to control the electrode wire tension to improve the machining stable according to the researches of Han et al.and Shi et al.Fig.1(b)is the installation photo, and Fig. 1(c) is the structure and winding diagram. The waveform of real-time tension in processing is shown in Fig. 1(a) with a preset 5 N tension value. Except for the fluctuation of about 0.5 N during reversing,the tension value is uniform and constant, which can meet the machining tension demands. The experimental conditions are shown in Table 1.
3. Machining principle
3.1. Material removal model
Due to its weak conductivity, the dielectric can be dissociated into positive and negative ions. In addition, due to a certain number of no-load pulses and normal breakdown delay, the dissociated positive and negative ions will move to the cathode and anode, respectively, under the action of electric field, and the oxidation and reduction reactions will occur on the electrode surface, resulting in electrolysis in the WEDM. The waveform of voltage and current during processing is shown in Fig. 2, and the leakage current of no-load pulse is 3 A.
The model of interelectrode double layer during no-load pulse or normal discharge breakdown delay is shown in Fig. 3. Rand Care equivalent resistance and capacitance of double layer, respectively, and Rand Rare equivalent resistances of dielectrics between electrodes. HSWEDM primarily carries out the introduction of dielectrics and product removal through high-speed running of wire electrode. The dielectric resistance in zone I is greater than that in zone II,that is, R>R. Therefore, it can be seen that the charging time of double layers in zone I is much longer than that in zone II. The wire electrode in the forward direction is in the spark discharge area with high temperature and frequent dielectric flow. Therefore, reducing the resistivity of zone II will also reduce the anode voltage drop, and increase the dissolution rate of materials in the forward direction, which is conducive to improving the localized machining of the ECM.
The current iof the electrochemical reaction obtained from the Bulter-Volmer equationis as follows:

where iis the exchange current density,β is the transfer coefficient, n is the number of electron in the electrode reaction, F is the Faraday constant,Ris the gas constant,Tis the absolute temperature, and φ is the double layer voltage.
Note that φis no-load rate in processing. Since the test pulse width is 4 μs and the breakdown delay is random, it is assumed that the influence on electrolytic dissolution is ignored.Faraday’s law points out that the total amount of dissolved or precipitated matter is directly proportional to the electric quantity passing through when the electrochemical reaction takes place on the electrode.Combined with the characteristics of pulse power during wire electrode electrolysis,the volume of electrolytic dissolution Vcan be obtained as follows:

where Tis the pulse period, tis the pulse width, d is the diameter of electrode wire, l is the thickness of workpiece,and ω is the volume electrochemical equivalent.
Fig. 4 shows the material erosion model in the time of Δt.Suppose that the wire electrode is fed from point A to point B at the feed speed of f (φ) in the time of Δt; that is, the discharge gap is fed from point C to point D at the same feed speed.In the figure,dis discharge gap,dis thickness of recast layer, dis depth of discharge pit, and dis kerf width.
The total volume of the recast layer Vat the time of t+Δt shown in the figure is:

Since the electrical parameters and processing environment(such as dielectric, electrode material, wire speed, etc.) are unchanged, the thickness, d, of the recast layer produced by the discharge in the feed direction is similar,and the total number of recast layers produced by the discharge in Δt time is N:
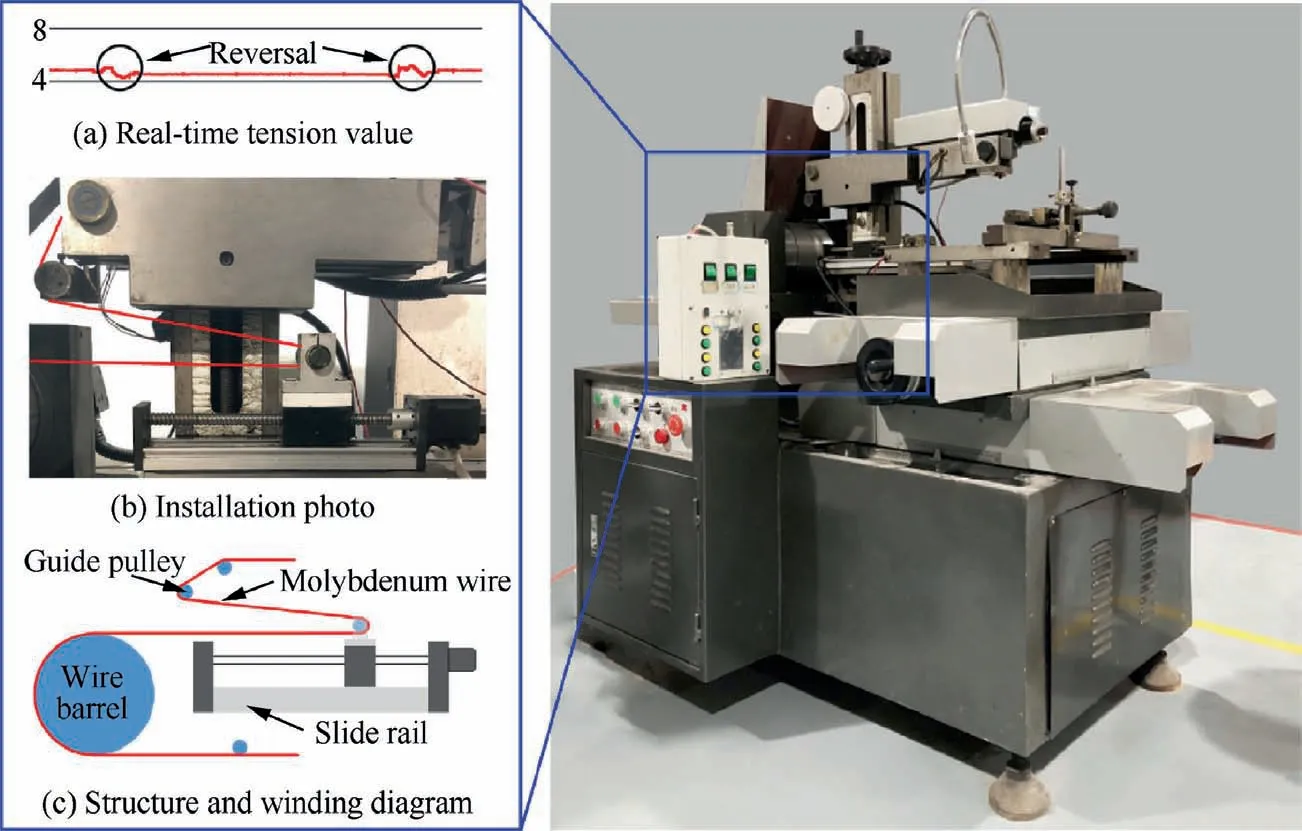
Fig. 1 Photograph of experimental device.
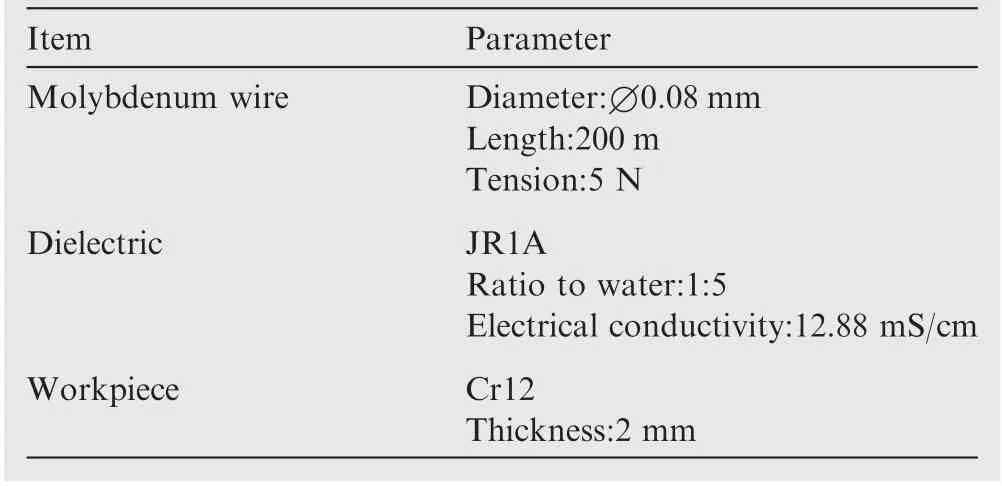
Table 1 Experimental conditions.
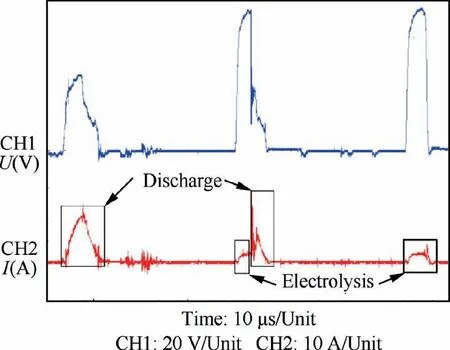
Fig. 2 Voltage and current waveform during processing.

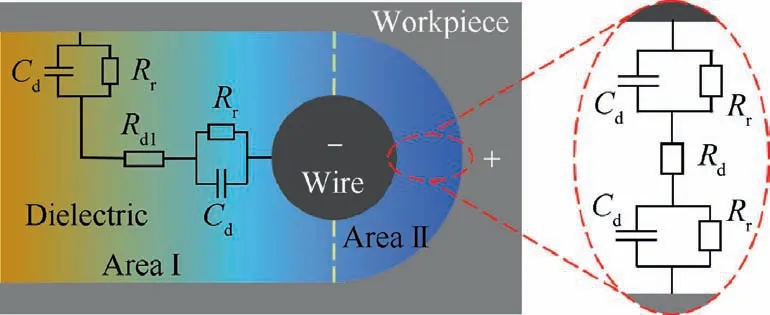
Fig. 3 Double layer model.
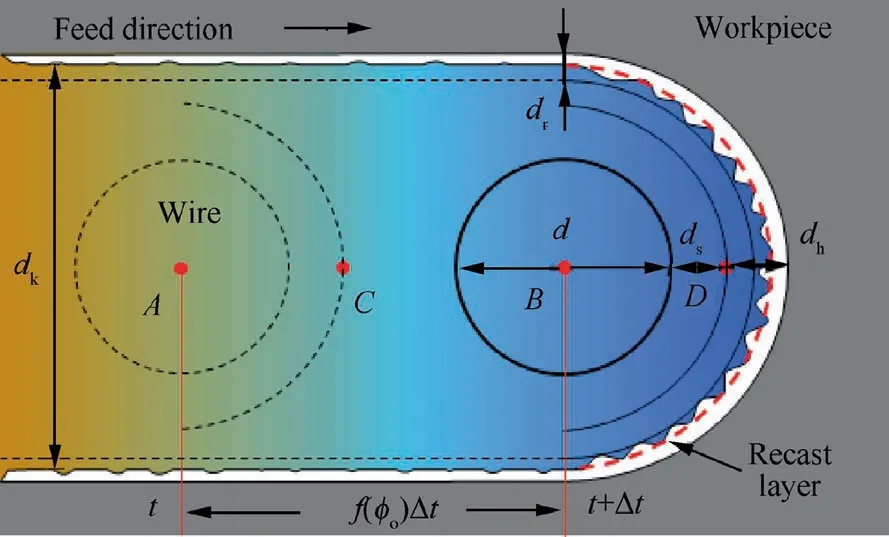
Fig. 4 Material removal mode by EDM in Δt.
Assuming η is the electrolytic dissolution coefficient and its value range is(0,1],when combined with Eq.(2),the following can be obtained:
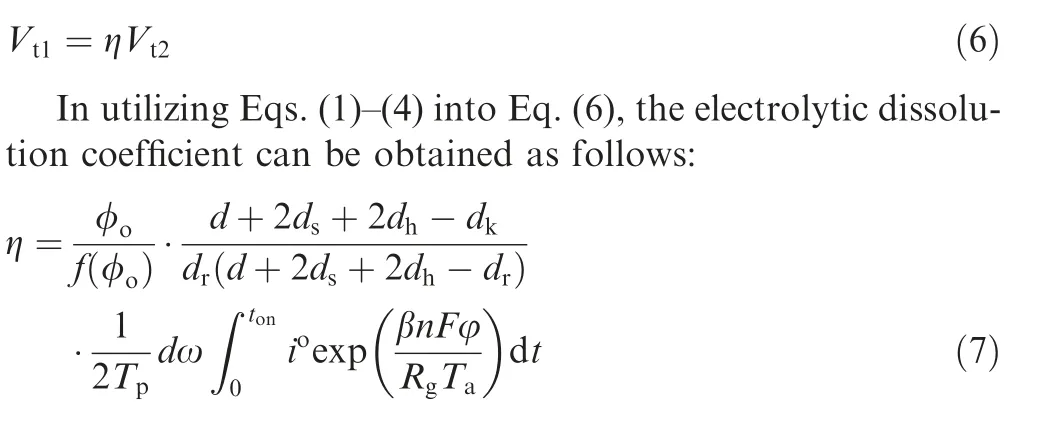
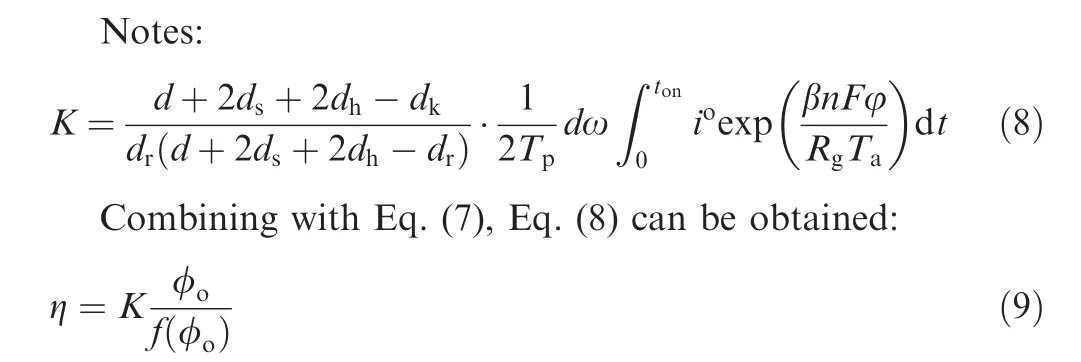
Therefore, the no-load rate φcan be increased and the electrolytic dissolution coefficient can also be increased with a certain servo control strategy to reduce the recast layer thickness.
3.2. Construction of the control system
To realize the continuous and stable machining of the preprogrammed track program, HSWEDM typically uses the voltage or current between the electrodes to indirectly reflect the size of the discharge gap, and then adjusts the feed speed of the worktable to meet the required machining requirements.Fig. 5 shows the sampling circuit based on gap voltage widely used by HSWEDM. After the gap discharge voltage is filtered and divided, it is inputted to the signal processing circuit to distinguish the discharge state. The feed pulse output controls the running speed of the stepping motor.As the signal processing circuit uses a fixed threshold, this method can only reflect the discharge state trend with low accuracy, poor real-time performance, and difficult threshold adjustment to achieve the requirements of different no-load rates.
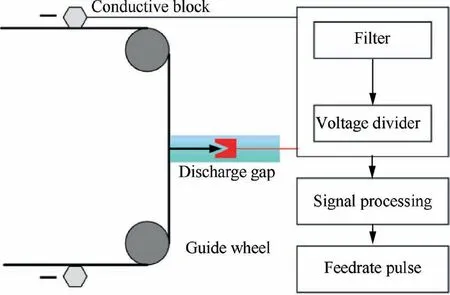
Fig. 5 Schematic diagram of traditional sampling circuit.
To realize the online adjustment of no-load rate φin the process of machining, a discrimination system based on discharge current is designed in this paper, as shown in Fig. 6.The system consists of three parts: high frequency discharge and current signal processing, FPGA logic operation, Lab-VIEW function setting and display. The workflow is as follows:
(1) The pulse power supply is connected with the workpiece and wire electrode respectively, and the worktable is processed along the programmed track with the feed speed of f (φ).
(2) The Hall current sensor linearly converts the discharge current signal into the analog voltage signal. The model is WCS1800, and the linearity is 60 mV/A. The selected AD9226 adopts multi-level differential pipeline architecture, and the maximum sampling rate is 65 MSPS. As the acquisition voltage range is ±5 V, the analog voltage signal must be processed by subtraction, amplification, and follow-up circuit, and the sampling frequency of the system is set to 50 MHz. FPGA reads the converted 12 bits AD value at the rising edge of each sampling clock and transmits it to the application logic module of FPGA for storage and logic operation.
(3) The instruction of logic operation result, no-load rate setting, comparison threshold setting, and processing speed limit interact with FPGA through the user interface of LabVIEW. In the upper computer, the no-load rate and feed speed in the process of machining are described in real-time with the refresh mode of the strip chart.
Due to the complexity, randomness, and time-varying of the WEDM discharge process, PID control has advantages of simple principle, convenient use, strong adaptability, and robustness. The system takes φas the input of the PID control and compares it with the preset φ, the difference is processed by PID controller in LabVIEW, and the actual feed pulse frequency is output, where the workbench is fed by f(φ).
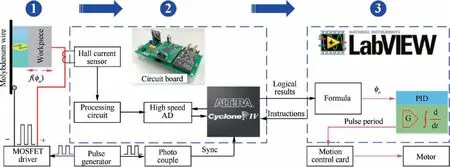
Fig. 6 Block diagram of control system.

Fig. 7 Real-time curve of different preset no-load rates.
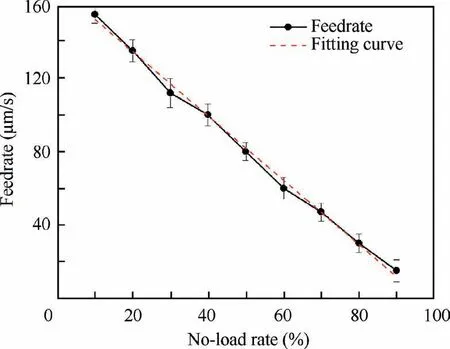
Fig. 8 Feed speed of different no-load rates.
3.3. Real-time curves of different preset no-load rates
Fig. 7 shows the real-time curves of different preset no-load rates under the system.The ultra fine wire electrode with diameter of 0.08 mm is less rigid,and its spatial shape and position are more easily affected by discharge explosion force, electrostatic force,electromagnetic force,fluid damping,and machine vibration. Therefore, the complexity, randomness, and timevarying of the machining process will usually lead to fluctuations of each no-load rate in Fig. 7, but the preset value is taken as the fluctuation balance point as a whole,and the state between electrodes is relatively stable. Therefore, this system can be used to quantitatively study the impact of no-load rate on WEDCM.
Fig. 8 shows the relationship between the preset value of no-load rate measured by the system and the stable value of feed speed. It can be seen from the figure that the feed speed decreases linearly with increases in no-load rate,and the servo feed speed regulation is relatively stable. The fitting curve of feed speed of no-load rate in the range of 10-90%is as follows:

4. Results and discussion
In this experiment, different no-load rates are obtained by the designed servo control system.The influence of the recast layer thickness and the kerf width was studied,and the surface morphology was analyzed. Each experiment was repeated 3 times,the average value was used as the final result.
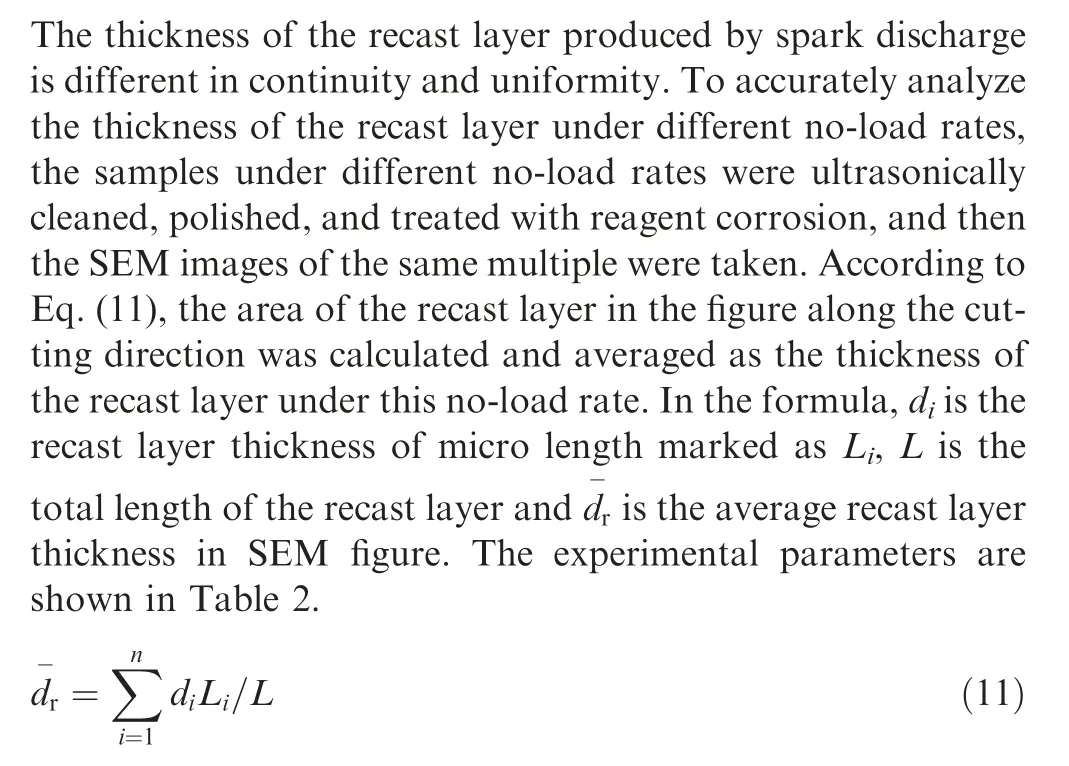
4.1. Thickness of recast layer
The average recast layer thickness after this data processing method is shown in Fig. 9(a), and Fig. 9(b) is the maximum and minimum values of the recast layers measured in SEM images. The overall trend of average recast layer thickness in Fig. 9(a) decreases with increases in no-load rate, but the difference between the average recast layer thickness of 10% -40% is insignificant, which shows that spark discharge is the main processing method, and the recast layer thickness fluctuates by 8 μm. The distribution of recast layer in cutting direction is shown in Fig.9(a).With the increase in no-load rate and the decrease in feed speed, the gap between electrodes increases, the amount of material removal per unit time decreases,and the electrolytic effect is strengthened.The recast layer re-solidified on the surface of the workpiece is removed by electrolytic dissolution,so the average recast layer thickness is reduced from 3.27 μm to 1.92 μm in the range of 40% to 80%.Meanwhile,the reduction in thickness fluctuation amplitude shows that the uniformity difference of the recast layer thickness is improved.At 90%no-load rate,the average thickness of the recast layer is 0.17 μm, but the wire electrode running at high-speed will produce a certain degree of vibration under the disturbance of the interelectrode force and vibrationof the machine tool.Therefore,along the cutting direction,the recast layer exhibits a local residual of 2 μm and a length ratio of 8.5%. As shown in Fig. 10(b), the process can be realized without a recast layer.

Table 2 Experimental parameters.
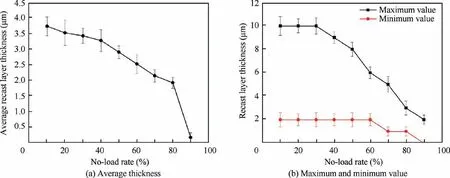
Fig. 9 Thickness of recast layer with different no-load rates.
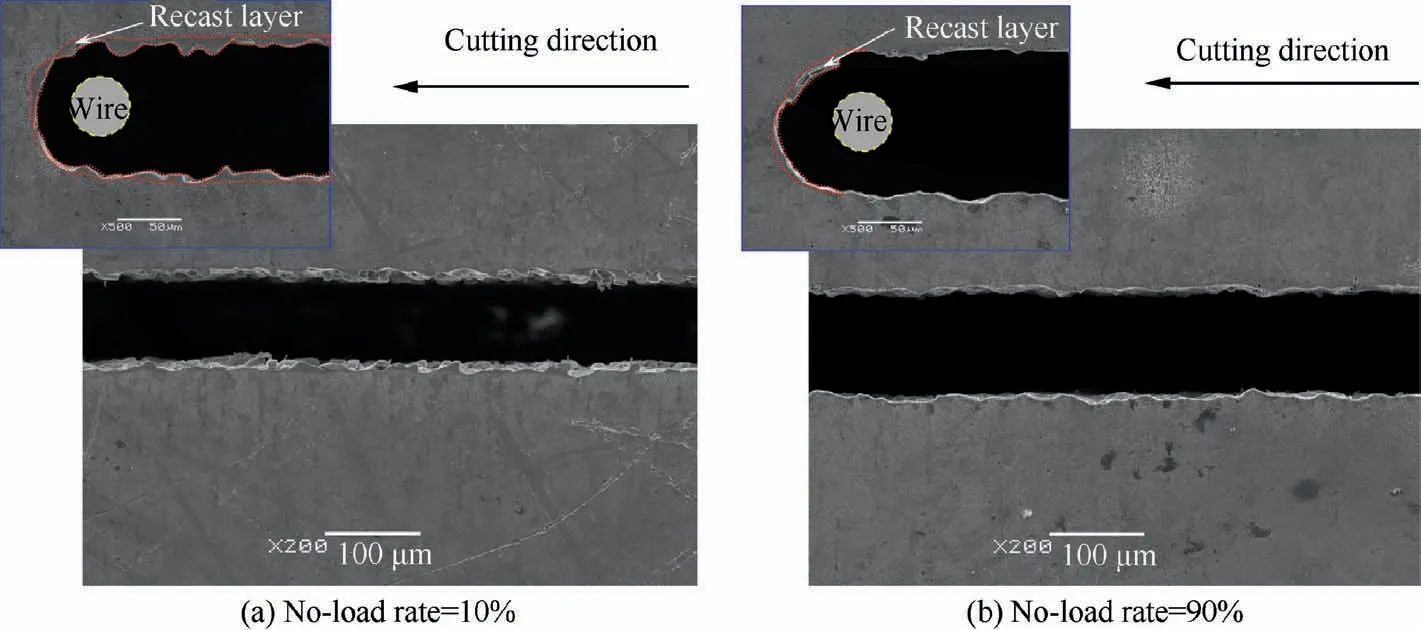
Fig. 10 Recast layer on both sides of kerf under two no-load rates.
At 10%no-load rate,the main processing areas at the front and back of the wire electrode have uneven recast layers. At 90%no-load rate,there is no recast layer in the processed area at the back, but there is a recast layer in the main processing area at the front end of the wire electrode.This may be because the end of the pre-programmed trace is just in the stage of effective discharge pulse discharge to remove the material,and the no-load pulse does not have time for electrolytic dissolution.Combined with the kerf,it can be concluded that under this no-load rate, the amount of recast layer in the forward direction is equal to the amount of electrolytic solution.
Since there is little recast layer during 90% no-load rate processing, and combining Eq. (9) and Eq. (10), it is found that:

The function graph of Eq.(12)is shown in Fig.11.It can be seen from the figure that when the no-load rate increases from 10% to 80%, the change in electrolytic removal coefficient increases slowly. With the increase of no-load rate, the spark discharge rate decreases. The less the recast layer produced by spark discharge is removed by subsequent spark, the more volume of recast layer dissolved by electrolysis is. Therefore,the electrolytic dissolution coefficient increases sharply. The trend of this function is consistent with the experimental results in Fig. 9.
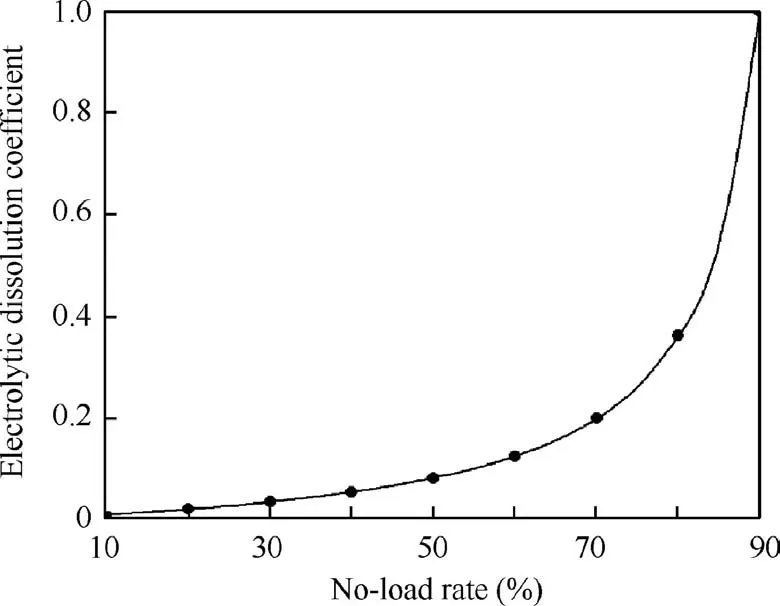
Fig. 11 Relationship between no-load rate and electrolytic dissolution coefficient.
4.2. Surface morphology
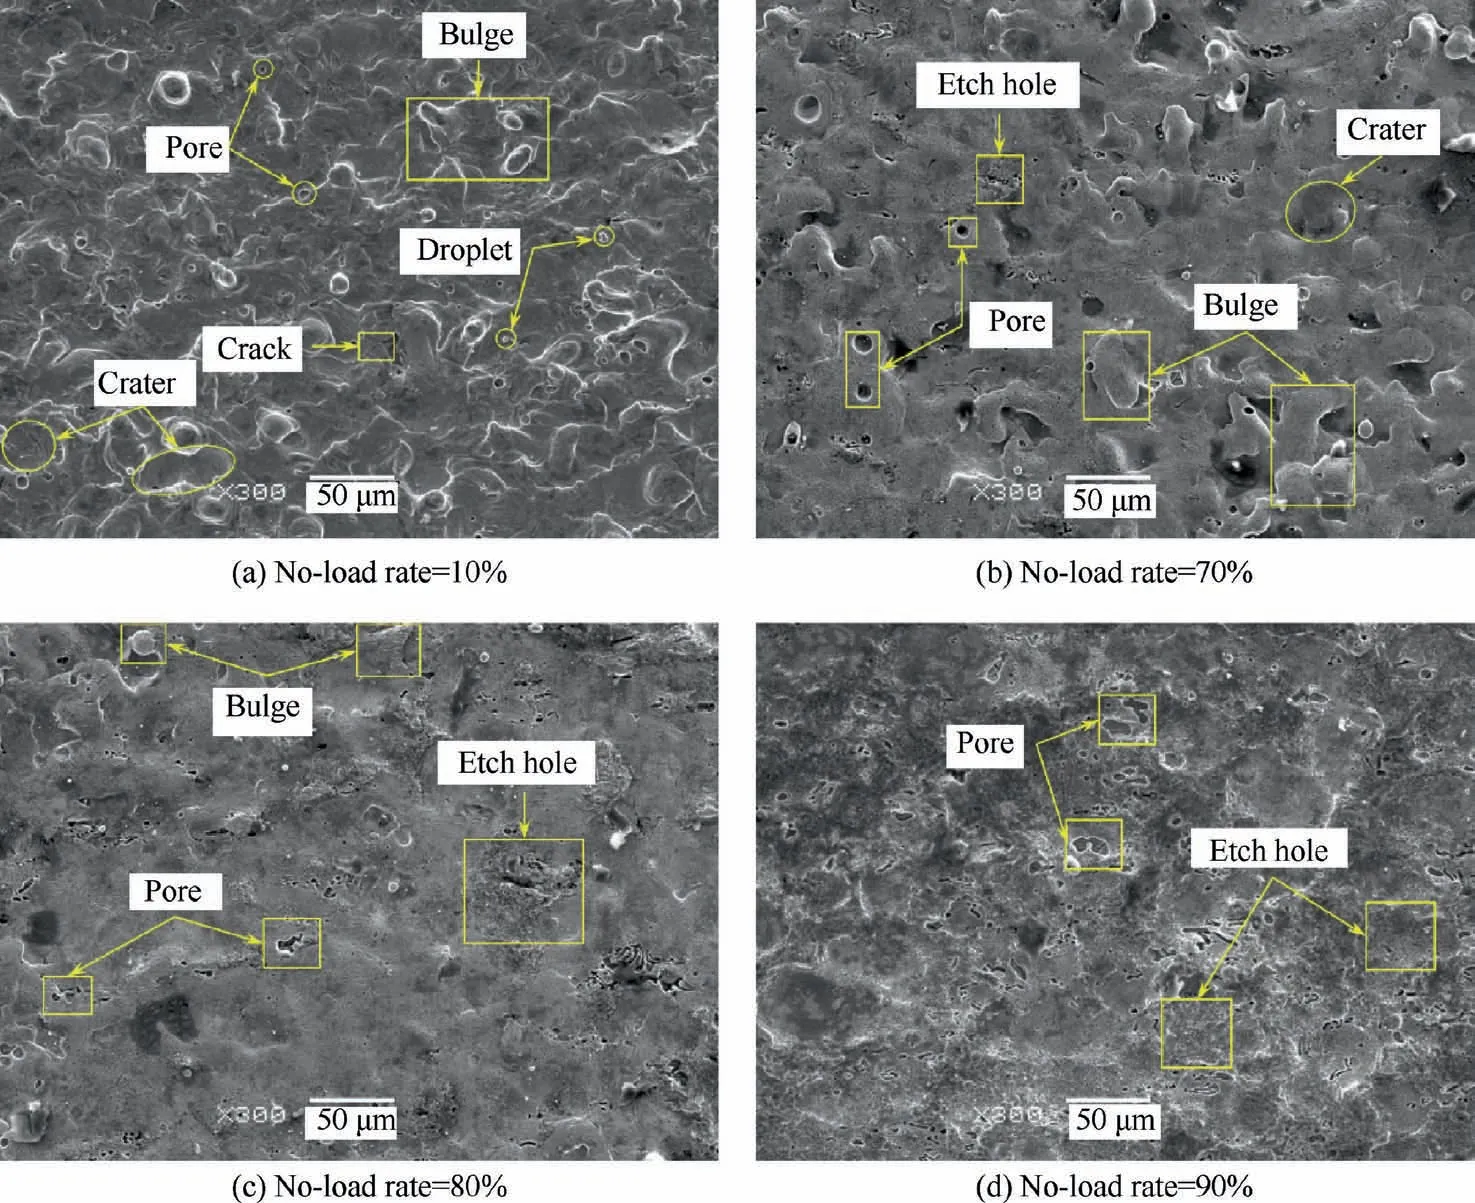
Fig. 12 Surface morphology under four no-load rates.
According to Fig. 9, the workpiece surfaces processed with four no-load rates of 10%,70%,80%,and 90%were selected for analysis, as shown in Fig. 12. When the electric field strength between the electrodes exceeds the dielectric strength of the dielectric,it develops into a discharge channel and forms an instantaneous high temperature heat source on the electrode surface. This high temperature heat source will melt and gasify the local metal near the discharge point.The molten metal that has not been removed and the gasified part of metal will be re-solidified on the workpiece surface under the cooling effect of the gap dielectric,accompanied by air holes and micro cracks,as shown in Fig.12(a). With the no-load rate increase,the decrease of electric spark erosion, and the enhancement of electrolysis, the coral-like bulge and globular droplet on the surface of the workpiece are greatly reduced, but the surface still shows a recast layer and stacked discharge pit, and the pores hidden in the recast layer are gradually exposed, as shown in Fig. 12(b). When the no-load rate increases to 80%,there is no obvious discharge pit on the surface,but there is still some undissolved discharge pit bulge on the part.However, when the no-load rate increases to 90%, the feed speed further decreases, and the thickness of the recast layer is further reduced due to the increase of electrolysis time caused by no-load pulse between electrodes. The surface is relatively dense and uniform and does not have the typical WEDM surface shown in Fig. 12(a), as shown in Fig. 12(d).
4.3. Kerf width

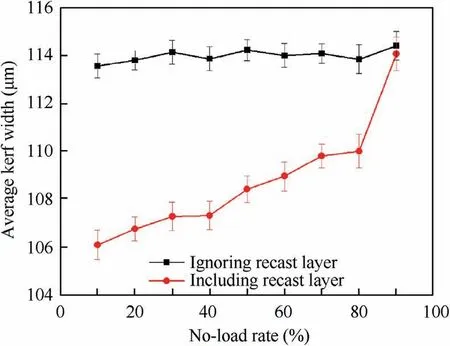
Fig. 13 Kerf width with different no-load rate.

5. Conclusions
In this paper,based on the analysis of the relationship between the spark discharge erosion and the amount of electrolytic dissolution in the WEDCM, an identification and servo controlled system were designed. Through the experiment, the system can realize the quantitative control and stable processing of different no-load rates. The conclusions are as follows:
(1) Due to the use of dielectric(JR1A)with certain conductivities, there is an electrolytic effect in the process of ultra fine Wire-EDM, and the electrolytic dissolution is proportional to the ratio of no-load rate and feed speed.
(2) The electrochemical dissolution coefficient function trend is consistent with the experimental results. The no-load rate increases from 10% to 80%, the spark discharge is still the main material removal mode. In the meanwhile, the electrolytic effect can reduce the thickness of the recast layer and the surface morphology to a certain extent.
(3) When the no-load rate is 90%, the amount of recast layer at the front end of the wire electrode processing direction is almost the same as the amount of electrolytic dissolution, which can basically achieve no recast layer processing. Compared with 10% no-load rate, the kerf width only increased by 7.5%.
Declaration of Competing Interest
The authors declare that they have no known competing financial interests or personal relationships that could have appeared to influence the work reported in this paper.
Acknowledgement
This work was co-supported by the National Natural Science Foundation of China (Nos. 51575271 and 51975290).
 CHINESE JOURNAL OF AERONAUTICS2021年4期
- CHINESE JOURNAL OF AERONAUTICS的其它文章
- Time delay compensation in lateral-directional flight control systems at high angles of attack
- Dual stability enhancement mechanisms of axial-slot casing treatment in a high-speed mixed-flow compressor with various tip clearances
- Development cost prediction of general aviation aircraft using combined estimation technique
- Improvement on shaped-hole film cooling effectiveness by integrating upstream sand-dune-shaped ramps
- Modeling and parameter identification of linear time-varying systems based on adaptive chirplet transform under random excitation
- An experimental method to obtain the hard alpha anomaly distribution for titanium alloy aeroengine disks
