
A Nomogram to Predict Patients with Obstructive Coronary Artery Disease:Development and Validation
2021-05-12 06:14ZesenHanLihongLaiZhaokunPuandLanYang
Zesen Han ,Lihong Lai,Zhaokun Pu and Lan Yang
1 The People’ s Hospital of Hua County,Anyang,456400 Henan,China
2 The First Aff iliated Hospital and College of Clinical Medicine of Henan University of Science and Technology,Luoyang,471003 Henan,China
Abstract Objective:To develop and validate clinical prediction models for the development of a nomogram to estimate the probability of patients having coronary artery disease (CAD).Methods and Results:A total of 1,025 patients referred for coronary angiography were included in a retrospective,single-center study.Randomly,720 patients (70%) were selected as the development group and the other patients were selected as the validation group.Multivariate logistic regression analysis showed that the seven risk factors age,sex,systolic blood pressure,lipoprotein-associated phospholipase A 2,type of angina,hypertension,and diabetes were signif cant for diagnosis of CAD,from which we established model A.We established model B with the risk factors age,sex,height,systolic blood pressure,low-density lipoprotein cholesterol,lipoprotein-associated phospholipase A 2,type of angina,hypertension,and diabetes via the Akaike information criterion.The risk factors from the original Framingham Risk Score were used for model C.From comparison of the areas under the receiver operating characteristic curve,net reclassif cation improvement,and integrated discrimination improvement of models A,B,and C,we chose model B to develop the nomogram because of its f tness in discrimination,calibration,and clinical eff ciency.The nomogram for diagnosis of CAD could be used easily and conveniently.Conclusion:An individualized clinical prediction model for patients with CAD allowed an accurate estimation in Chinese populations.The Akaike information criterion is a better method in screening risk factors.The net reclassif -cation improvement and integrated discrimination improvement are better than the area under the receiver operating characteristic curve in discrimination.Decision curve analysis can be used to evaluate the eff ciency of clinical prediction models.
Keywords: Coronary artery disease;risk factors;clinical decision rules;nomogram
lntroduction
For 44 years,the Framingham Heart Study has shown that the incidence of coronary artery disease (CAD) is 49% in men and 32% in women.With increasing economic development,the number of individuals with CAD is increasing,of which more than one million die each year [1].For diagnosis of CAD,coronary artery angiography (CAG) is now the f rst choice.The numbers of CAG examinations increased by 17 times in the past decade according to a report on the PEACE study [2].However,CAG is not widely accepted by everybody due to traumatic effects and affordability.Noninvasive artery computed tomography can provide limited information in diagnosis,and composite plaque burden scores seem to increase the sensitivity for CAD.But there are still some risks one has to consider,such as radiation-induced cancer,nephropathy,and contrast medium extravasation [3].
With the high morbidity and mortality associated with CAD,clinical prediction models (CPMs) have attracted increasing attention in the current era of personalized medicine.The application of CPMs in left main coronary artery disease was demonstrated by Lee et al.[4].Wilson et al.[5] developed a simple coronary disease prediction algorithm using categorical variables:blood pressure,total cholesterol(TC) level,and low-density lipoprotein cholesterol(LDL-C) level.The development and validation of CPMs in CAD depend on a complex combination of clinical factors,which also have the certain report templates according to the TRIPOD [6].
However,few studies of CPMs have been reported in Asian countries.The original Framingham Risk Score (FRS) overestimated the risk of CAD in the Chinese population.Although recalibration improved the estimates and demonstrated that the Framingham model is useful in the Chinese population,the same elements were selected rather than other factors [7].We aimed to rescreen clinical factors to develop a simple diagnostic CPM,in comparison with the FRS,in the Chinese population and validate it.
Methods
Patient Selection
We analyzed retrospectively the clinical data of 1,025 patients who underwent CAG examination between November 2018 and August 2019 at the First Aff liated Hospital of Henan University of Science and Technology.Some patients were excluded:those with a history of CAG or percutaneous intervention with CAD,and those with a history of coronary artery bypass sugrery with non-ST-segment elevation myocardial infarction or ST segment elevation myocardial infarction.Seven hundred twenty patients (70%) were enrolled in the development cohort randomly with the use of statistical software (R package);the other patients(30%) formed the validation cohort.All patients gave their written informed consent before CAG examination.
Data Collection
The blood pressures of the patients were obtained on their admission to the hospital.All blood samples were drawn before breakfast the next morning and subjected to laboratory inspection with standardization at the hospital ’ s laboratory.The variables studied were age,sex,height,weight,systolic blood pressure (SBP),diastolic blood pressure,hemoglobin A1c(HbA1c) level,hemoglobin level,white blood cell (WBC) count,platelet count,serum creatinine level,serum uric acid (UA) level,TC level,triglyceride level,high-density lipoprotein cholesterol (HDL-C) level,low-density LDL-C level,lipoprotein-associated phospholipase A2(Lp-PLA2) level,left ventricular ejection fraction (LVEF),clinical symptoms (type of angina),history or no history of hypertension,history or no history of smoking,and history or no history of diabetes.
The type of angina was def ned according to European Society of Cardiology guidelines [8],as was hypertension [9].Diabetes mellitus was def ned as fasting glucose levels greater than 7.0 mmol/L or postprandial blood glucose levels greater than 1 1.1 mmol/L after 2 hours of treatment with insulin or oral hypoglycemic medications.CAD was def ned as the presence of at least one major artery or coronary artery branch with 50% or greater narrowing.In the case of unavailable data,the missing information was imputed by the mice package in R.
Statistical Analysis
Continuous variables were expressed as the mean ±standard deviation and compared by the independentttest.Categorical variables were expressed as a percentage and compared by Pearson chi-square tests among patients with CAD and patients without CAD.The statistical analyses,including logistic regression analysis,were performed with IBM SPSS Statistics (version 25.0) and R packages.
Model Development and Validation
In all patients,statistical analysis was performed to determine whether risk factors were signif cant;P <0.1 was considered statistically signif cant.We used logistic regression analysis in the development cohort to choose the risk predictors that were signif cant (P <0.05) in univariate analysis.The forward elimination approach was used in multivariate analysis until all of the factors were signif cant(P <0.05).To indicate the eff ciency of the model better,we adjusted some variables appropriately.In this way,the f nal CPM (model A) consisted of seven factors:age,sex,SBP,Lp-PLA2,type of angina,hypertension,and diabetes.Model B consisted of the factors age,sex,height,SBP,LDL-C,Lp-PLA2,type of angina,hypertension,and diabetes with the Akaike information criterion (AIC),which can decrease the maximum risk possibility of inf nite sample sizes [10].Model C consisted of factors that come from the FRS [5],which included age,sex,TC,HDL-C,SBP,history of smoking,and history of diabetes.
The discrimination of the CPM is most often done by c-statistics–calculating the area under the curve (AUC) of the receiver operating characteristic (ROC) curve.Net reclassif cation improvement(NRI) and integrated discrimination improvement(IDI) are new evaluation indicators for discrimination [11].The CPMs were assessed by calibration plots.The clinical application has been showed with the decision curve analysis (DCA).We wished to determine which model is best by means of the AUC,NRI,IDI,and DCA in the population studied.The same assessment was done in the validation cohort.
Results
Baseline Characteristics
The cohort was divided into two groups according to coronary stenosis of 50% or greater or less than 50% as a categorical variable.A total of 1,025 eligible patients were analyzed:745 had CAD and 280 did not have CAD.We considered the following as signif cant risk factors:age,sex,height,weight,SBP,HbA1c,WBC count,hemoglobin,serum creatinine,serum UA,HDL-C,LDL-C,Lp-PLA2,LVEF,clinical symptoms,history of hypertension,history of smoking,and history of diabetes.Baseline characteristics are summarized in Tables 1 and 2.
Nomogram Development and Validation
With the f rst step of data analysis,forward multivariate logistic regression analysis was used to calculate model A’ s risk elements.They are shown in Table3,and were considered to be signif cant statistically when associated with CAD.Some risk factors’ cross-sectional points were computed with optimal scaling regression (CA TREG) in SPSS Statistics.In the development cohort,we obtained model B with the AIC and model C with the risk factors of the FRS.The variablesxiand the coeff cientsiare shown in the Appendix.SBP,HbA1clevel,serum creatinine level,clinical symptoms,hypertension,diabetes,and smoking were categorical variables,and the other factors were continuous variables.
We drew the ROC curves of predicted CAD probability (Figure1) and calculated the AUC,NRI,and IDI in the development and validation groups.The AUC of the three models is shown in Table4,with the Delong test used for comparing AUCs.The AUC in model B was 0.739 in the development group and 0.747 in the validation group,the model B was the best one of the models.The difference between the values was statistically signif cant (P <0.05).The NRI and IDI are compared between model A and model B,between model A and model C,and between model B and model C in Table5 by means of the Hosmer-Lemeshow test.The cutoff points of the comparison between two models for the NRI and IDI were obtained from the tangent points of the ROC curves.We chose the best one from both ROC curves for overall consideration with the R packages in the computer.The order of comparison could not be changed.For example,A ~ C means model A was the newly developed model and model C was the old model,which should be updated and calibrated with the change in the dietary habits of people even in a new population.If the order were reversed,the results for the evaluation index would be opposite for NRI and IDI.All of the results indicated that model B is the best of the three.The same was found in validation group.
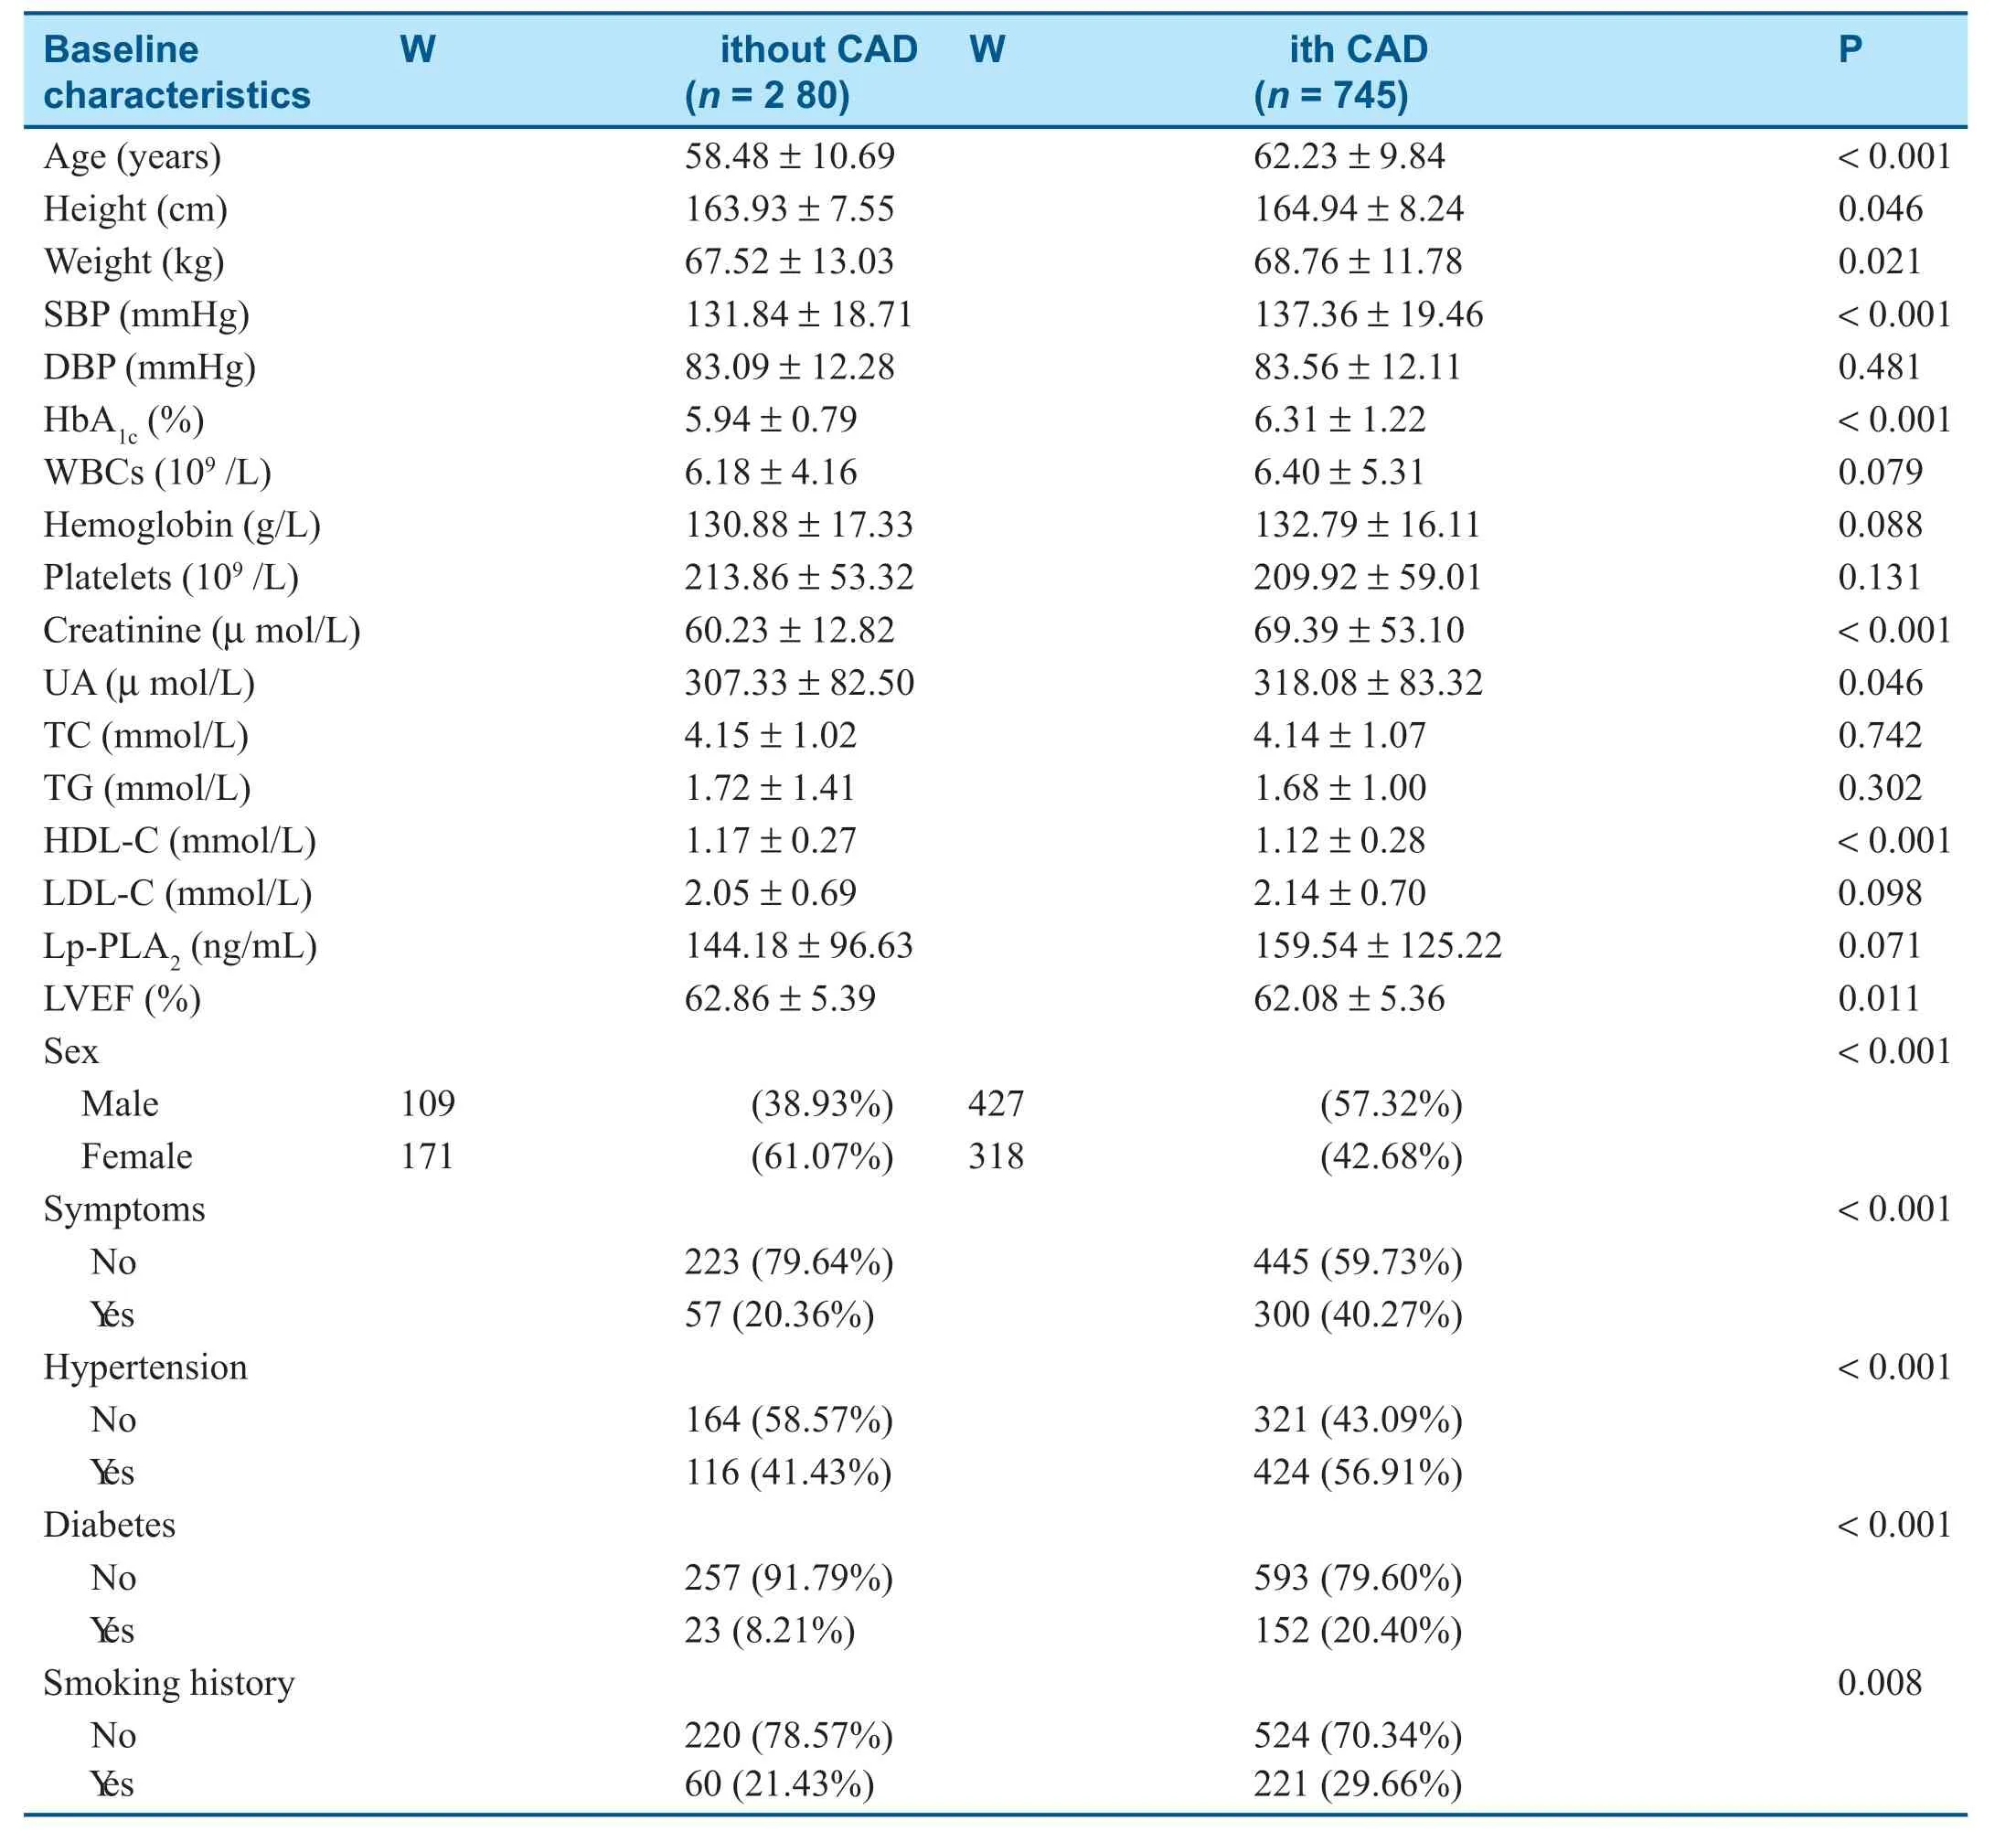
Table1 Baseline Characteristics of All Patients with and without Coronary Artery Disease (CAD).
The calibration of the models was expressed as another aspect about ROC curves,which is shown in Figure2.The P values from the calibration plots of the three models were 0.987,0.196,and 0.098,respectively,with the Hosmer -Lemeshow test.Hence,the predicted probability of the models revealed model B has strong concordance performance consistent with the actual probability in the development group.In the validation group,the P values were 0.119,0.008,and 0.533 respectively.
Discrimination and calibration play important roles in the appraisal of CPMs,but they cannot reveal which prediction model is clinically useful [11].If one wishes to use a prediction model to guide clinical diagnosis and treatment,decision curve analysis (DCA) should be used.The DCA has the advantage of evaluating alternative diagnosticand prognostic strategies [12].Vickers et al.[13]describe the details.The DCA of models A,B,and C (Figure3) showed the greatest net benef t of model B for physicians and patients.

Table2 Baseline Characteristics of Patients with and without Coronary Artery Disease (CAD) in the Development Group and the Validation Group.
From the analysis above,we established an individualized nomogram prediction model based on model B (shown in Figure4) because model B was the best in aggregate.
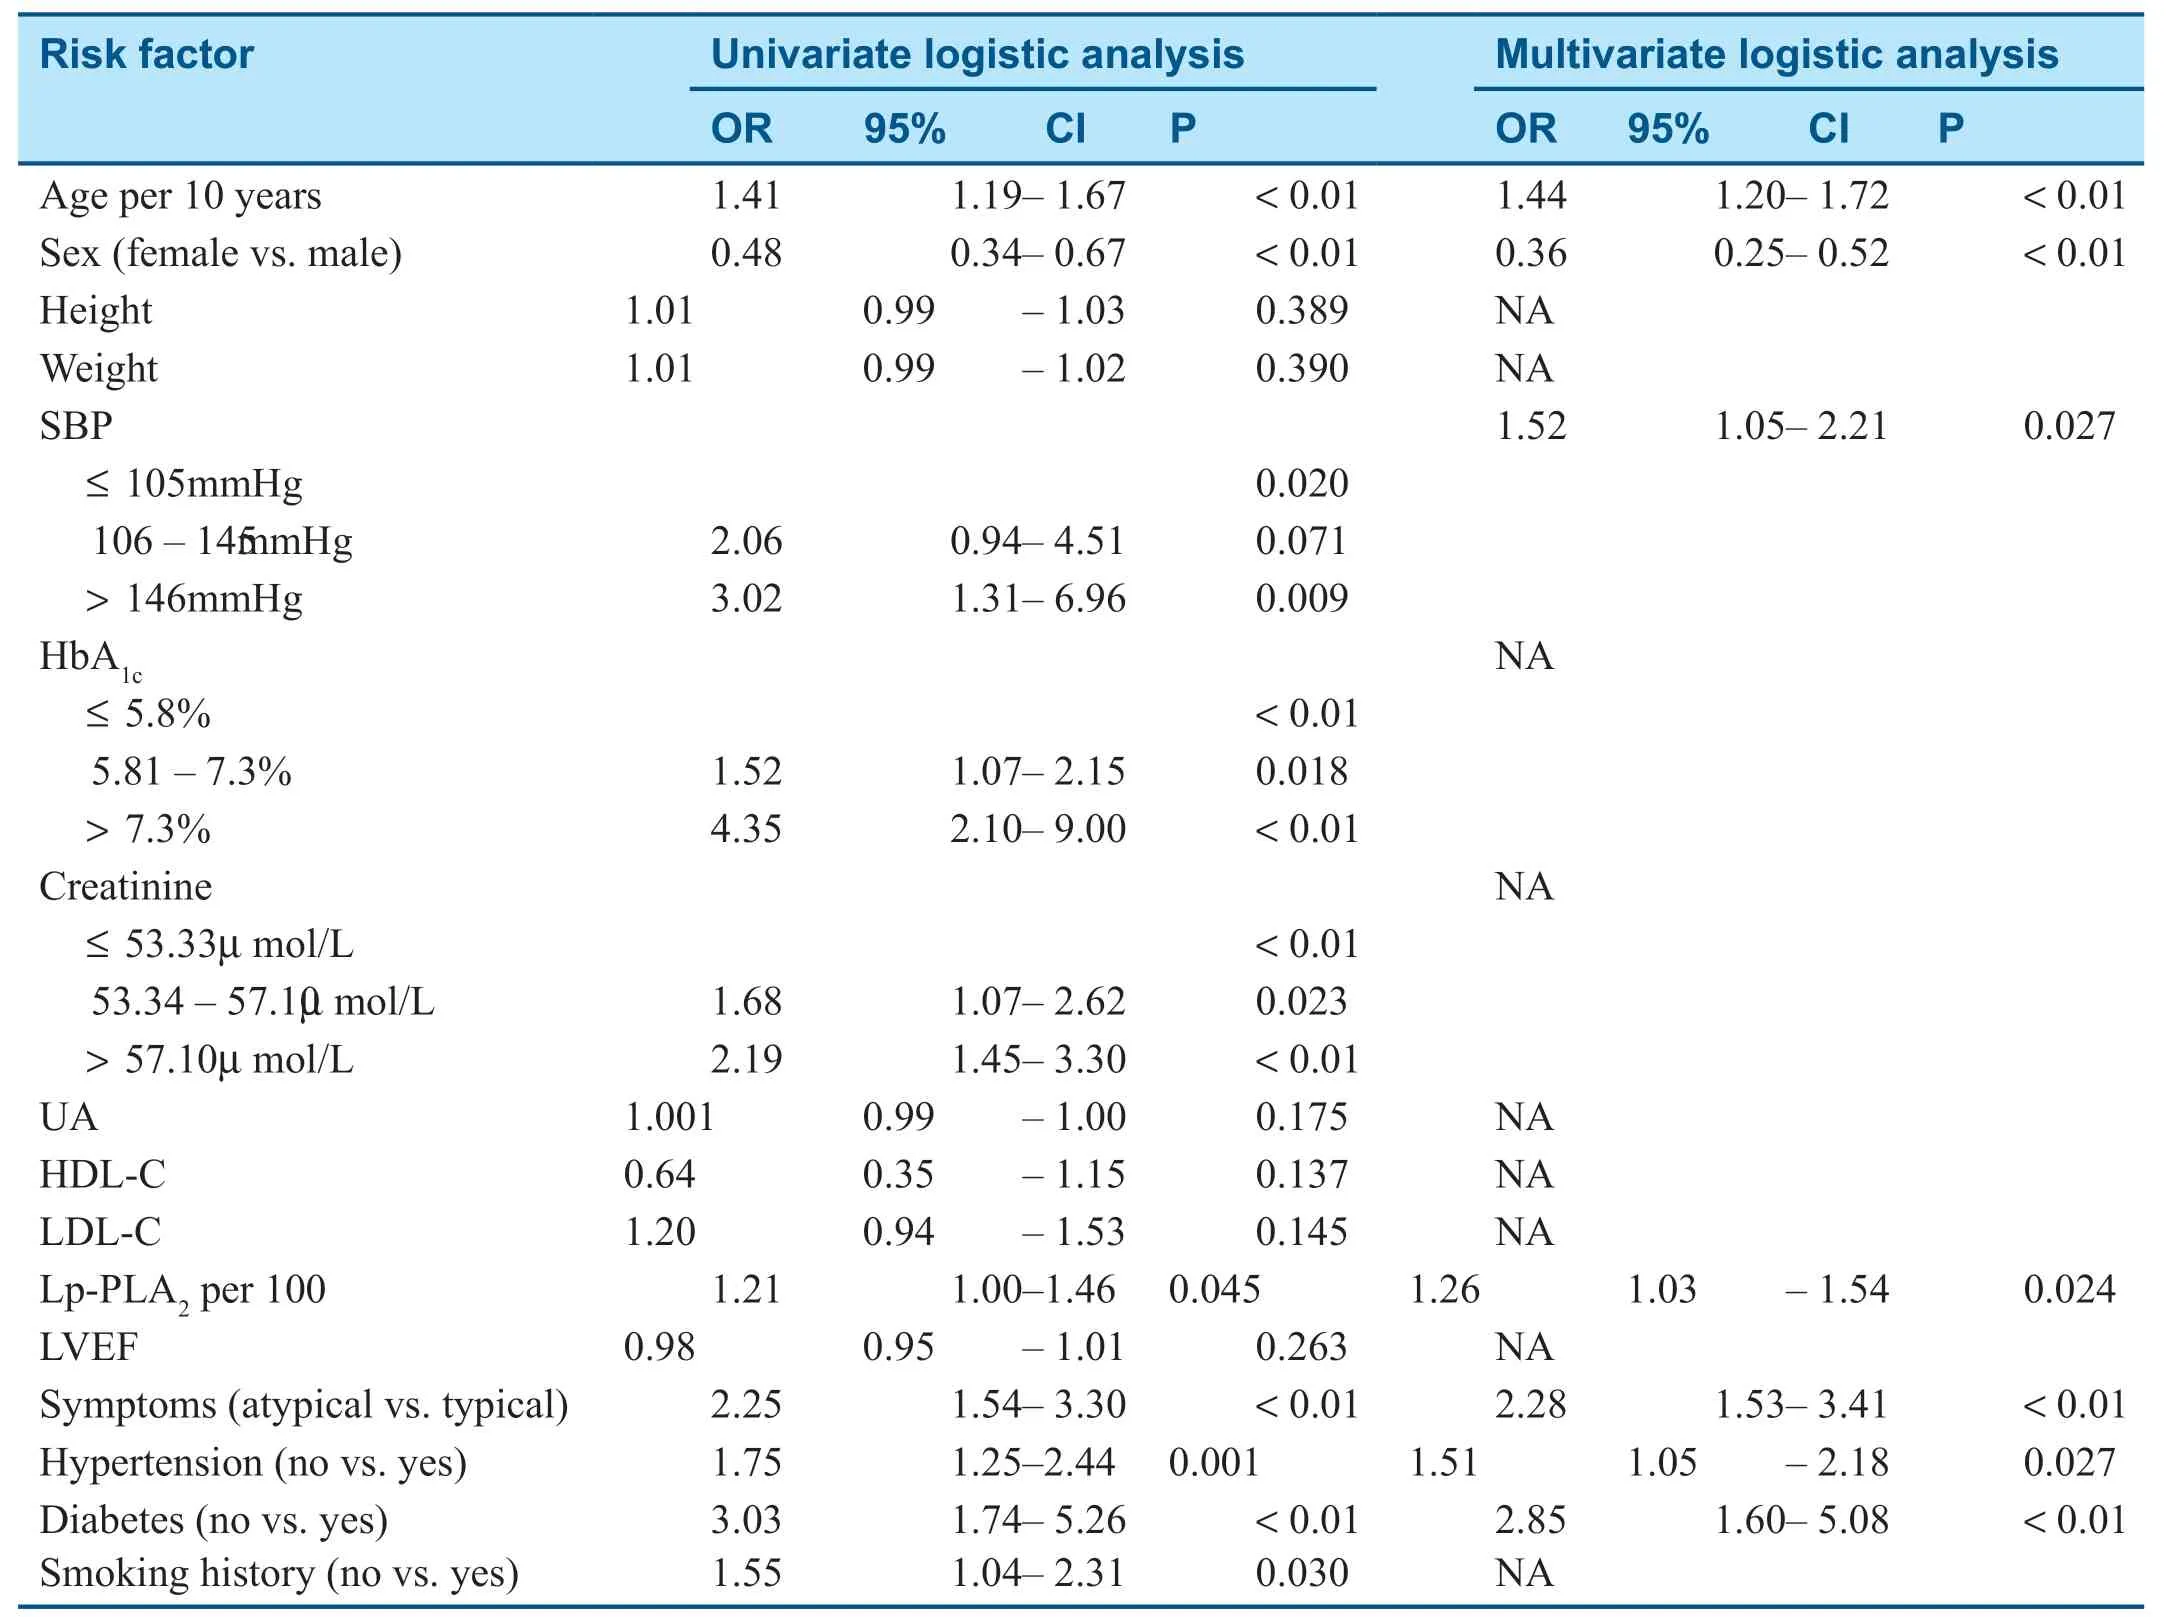
Table3 Univariate and Multivariate Logistic Regression Analysis in the Development Group.
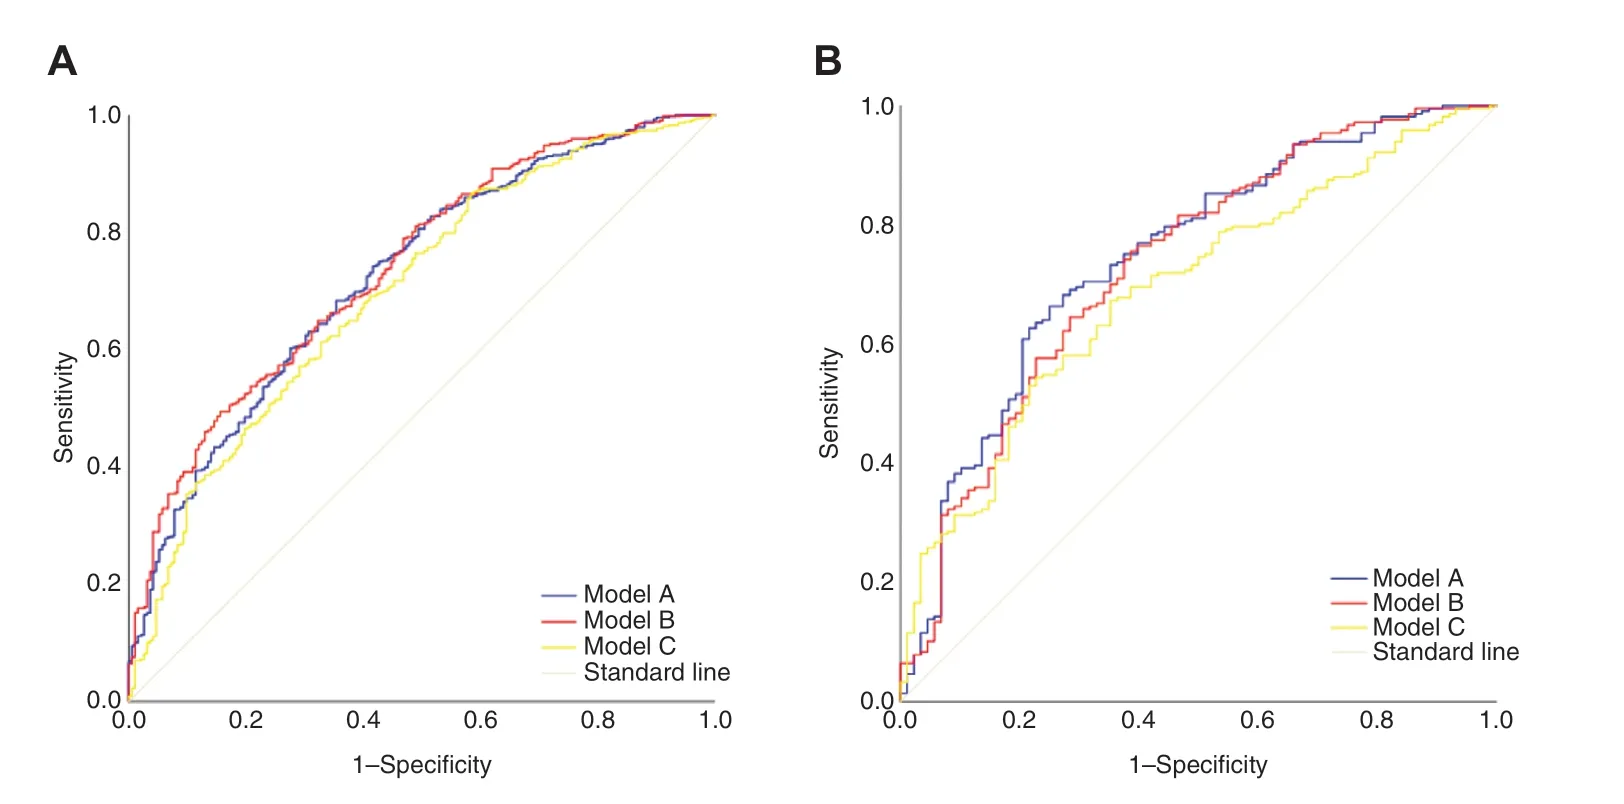
Figure1:The ROC curves in development group (A) and in validation group (B).
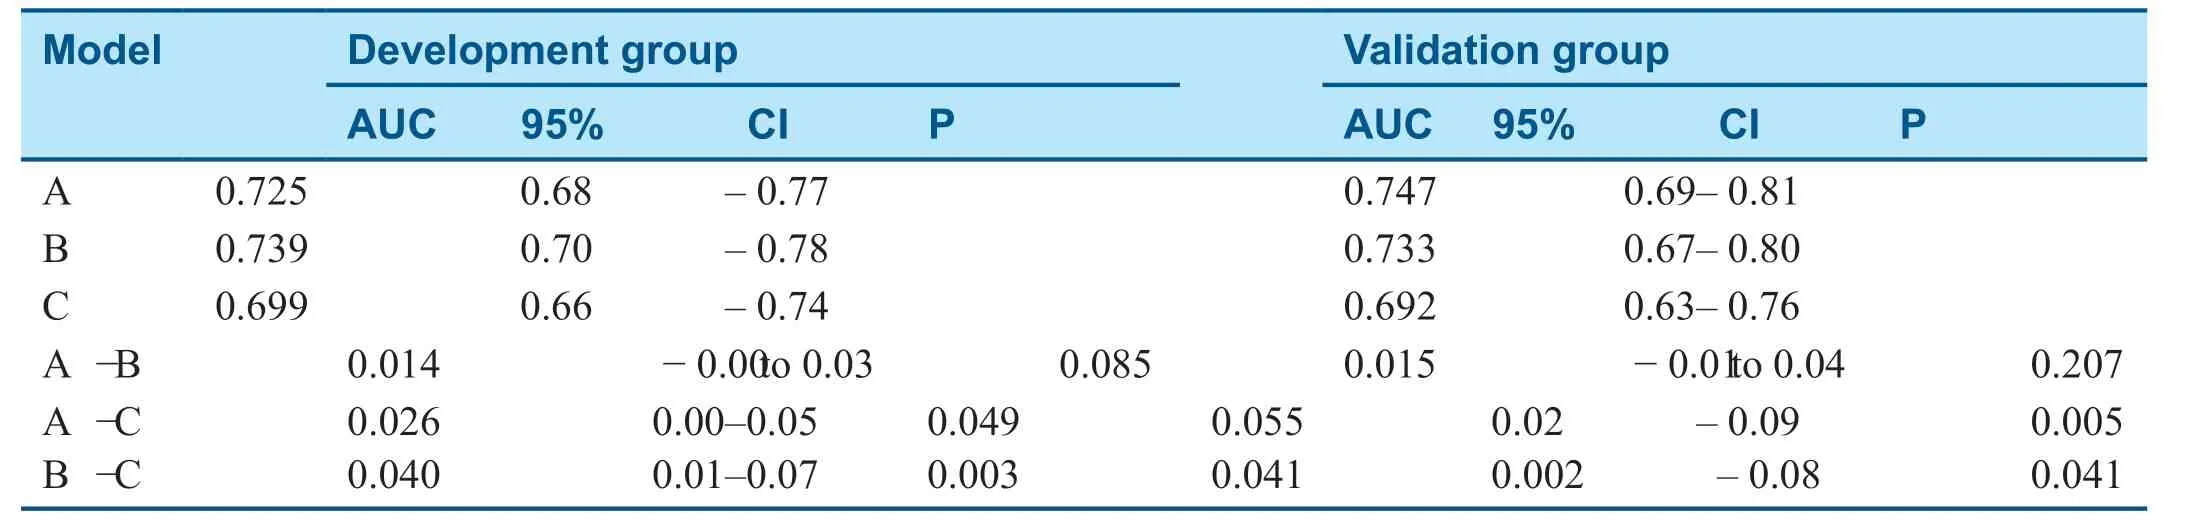
Table4 The Areas Under the Curve (AUC) in the Development Group and the Validation Group.
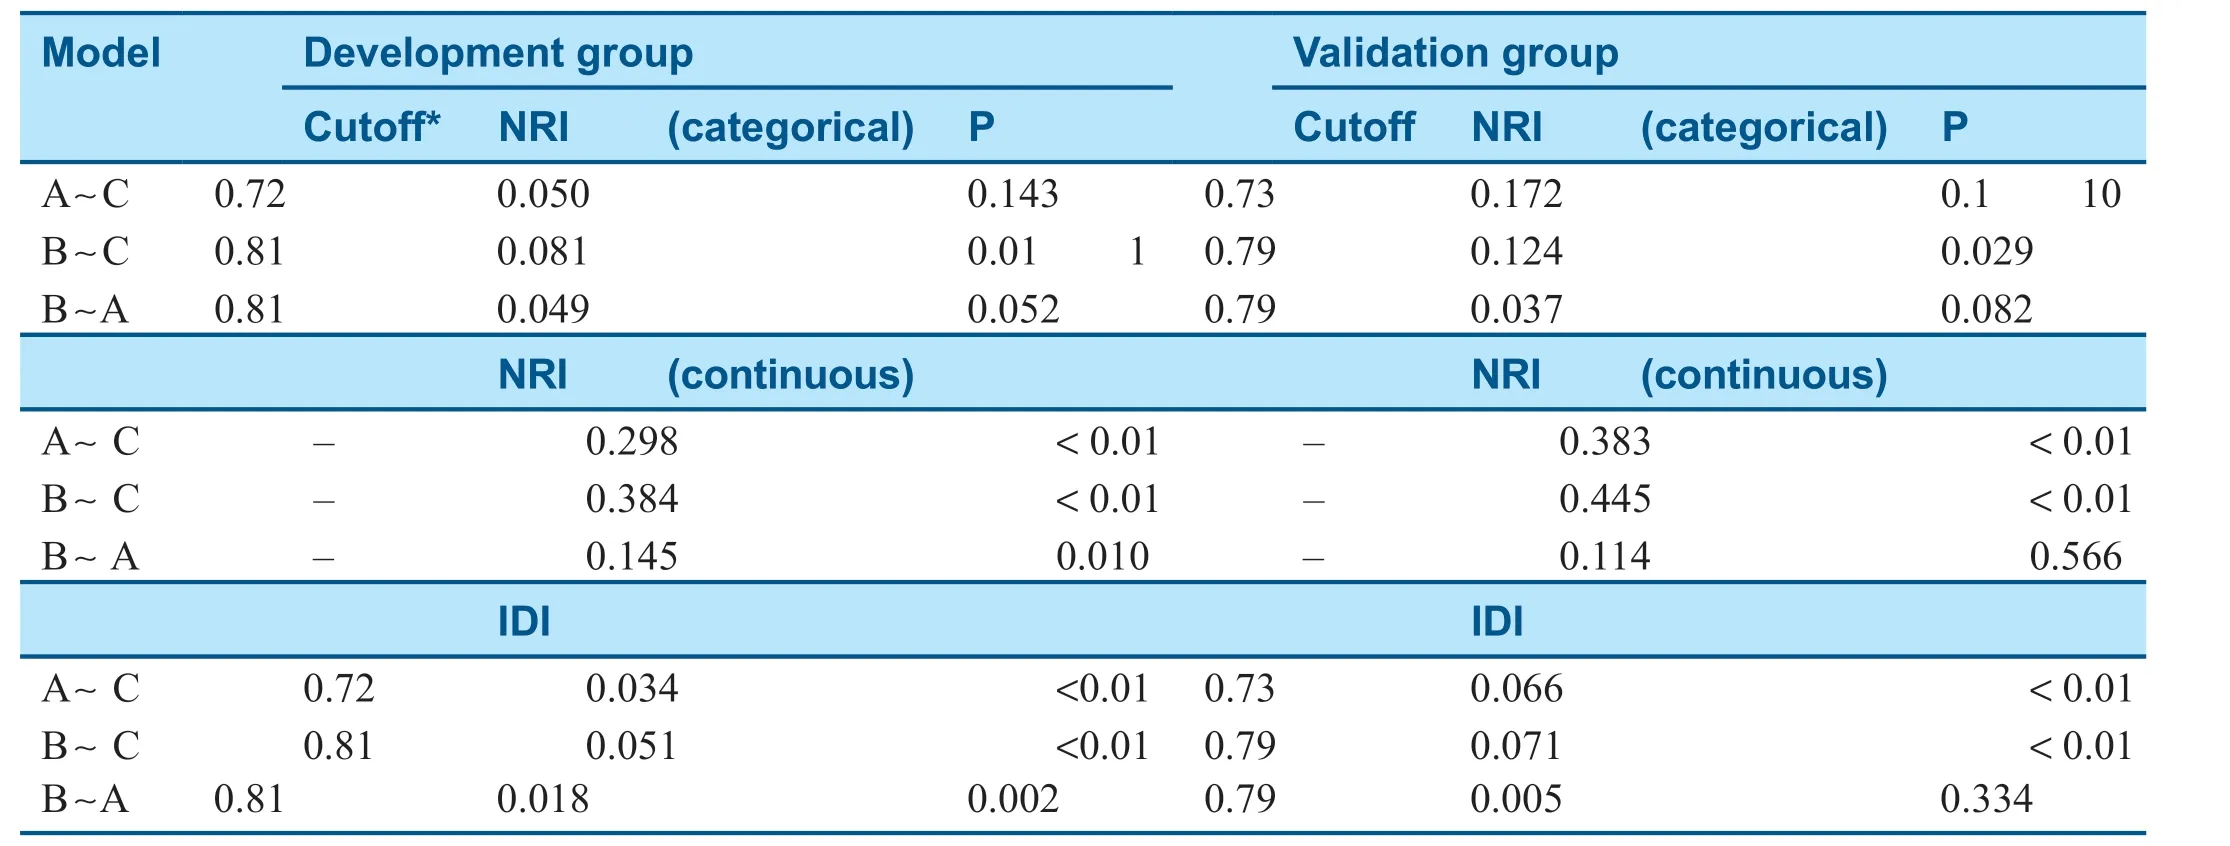
Table5 The Net Reclassif cation Improvement (NRI) and Integrated Discrimination Improvement (IDI) in the Development Group and the Validation Group.
Discussion
As far as we know,there have been no studies of CPMs with CAD reporting the models from so many aspects.Previous studies just developed a new model rather than contrasted it with the traditional model or performed recalibration except for new risk factors or only validated predicted models.No study showed that the FRS could predict the presence of CAD compared with CAG.Also,the CMCS prediction model from China and the European Risk Score both evaluate the risk of CAD at 10 years or more.In contrast,we hoped to obtain an immediate CPM with hospitalized patients with suspected diagnosis of CAD.In our study,we developed two new prediction models and compared them with the traditional FRS,resulting in a simple nomogram with nine risk factors:sex,age,SBP,height,LDL-C,Lp-PLA2,clinical symptoms,hypertension,and diabetes.The discrimination for risk prediction of model B was similar for c-statistics in the development group and the validation group (P=0.739 and P=0.733),which provided adequate goodness(P=0.88).

Figure2:The calibration plots in different models.(A was the plot of model A in development group;B was the plot of model B in development group;C was the plot of model C in development group;so as in validation group,they were A’,B’and C’ respectively).
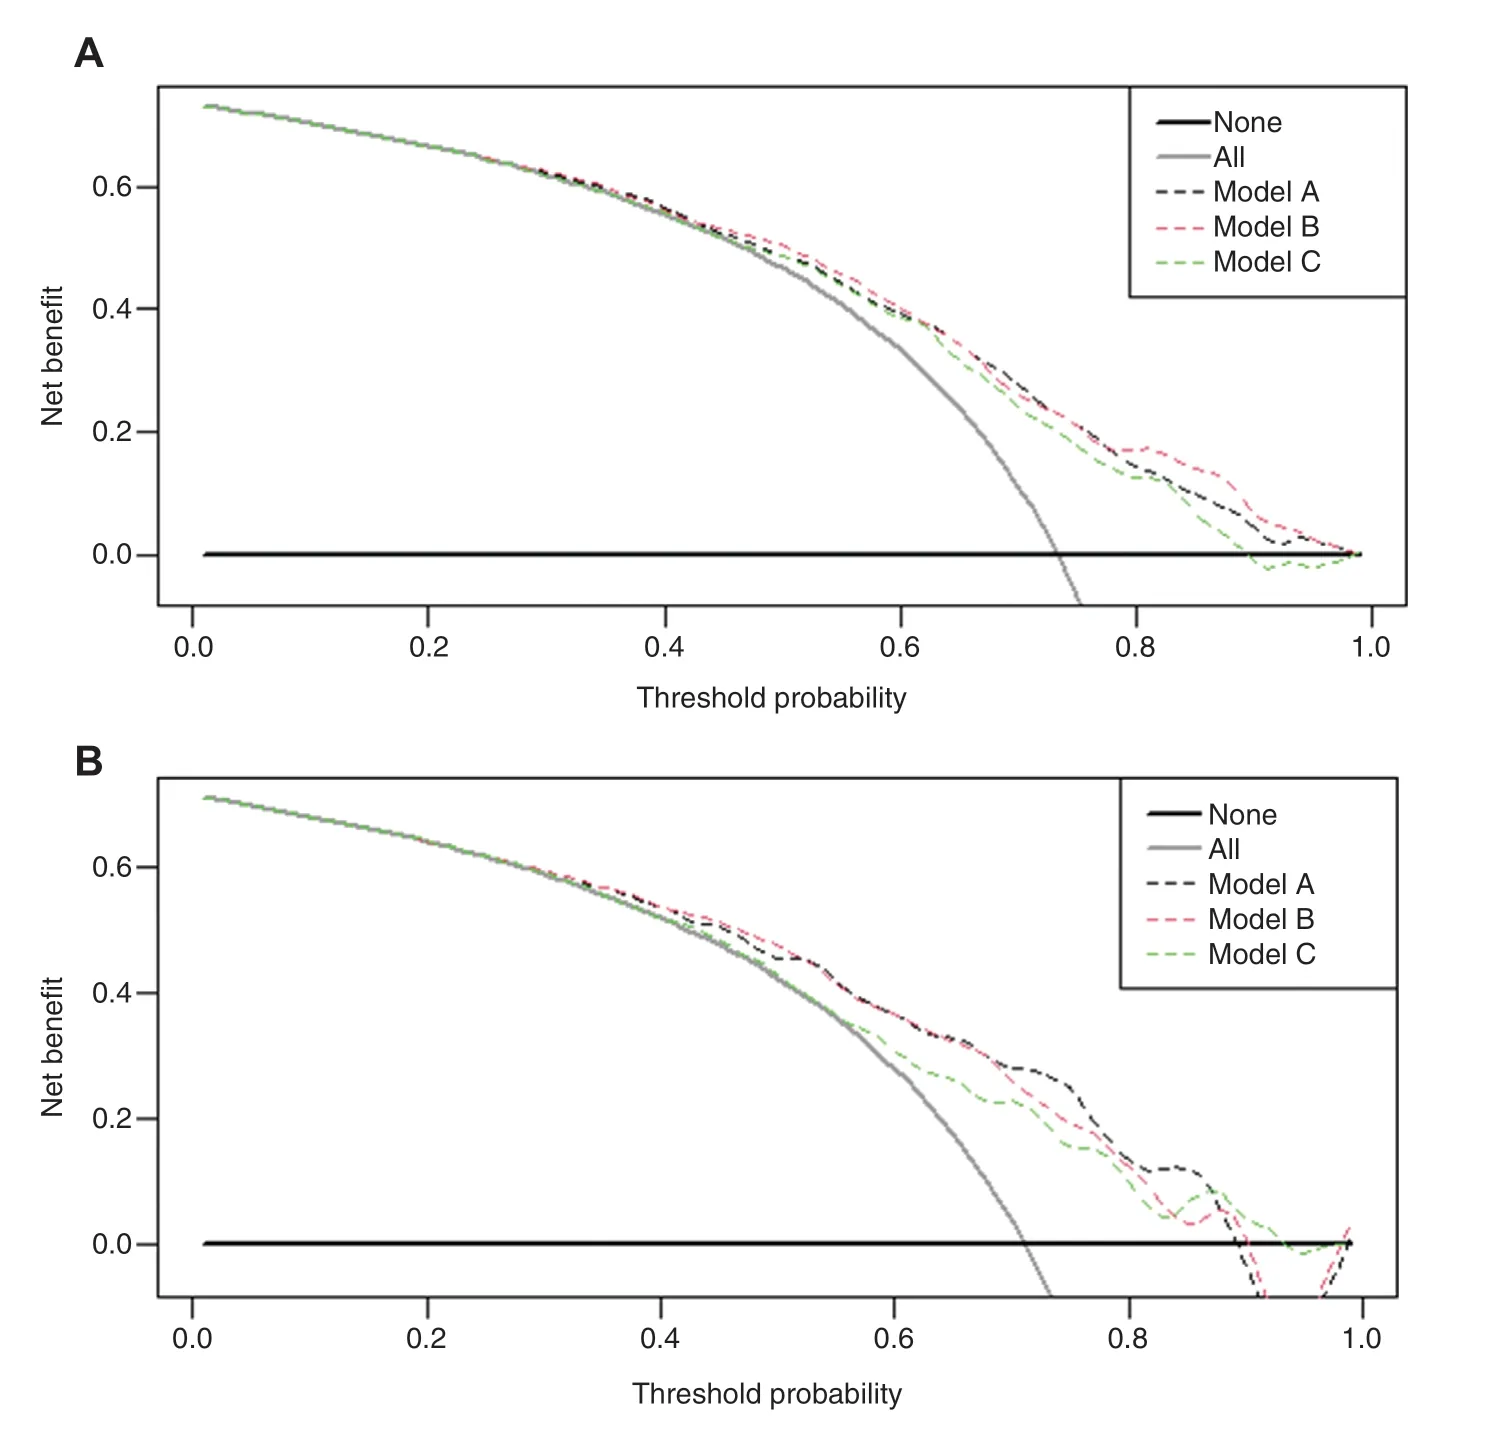
Figure3:The DCA in development group (A) and in validation group (B).
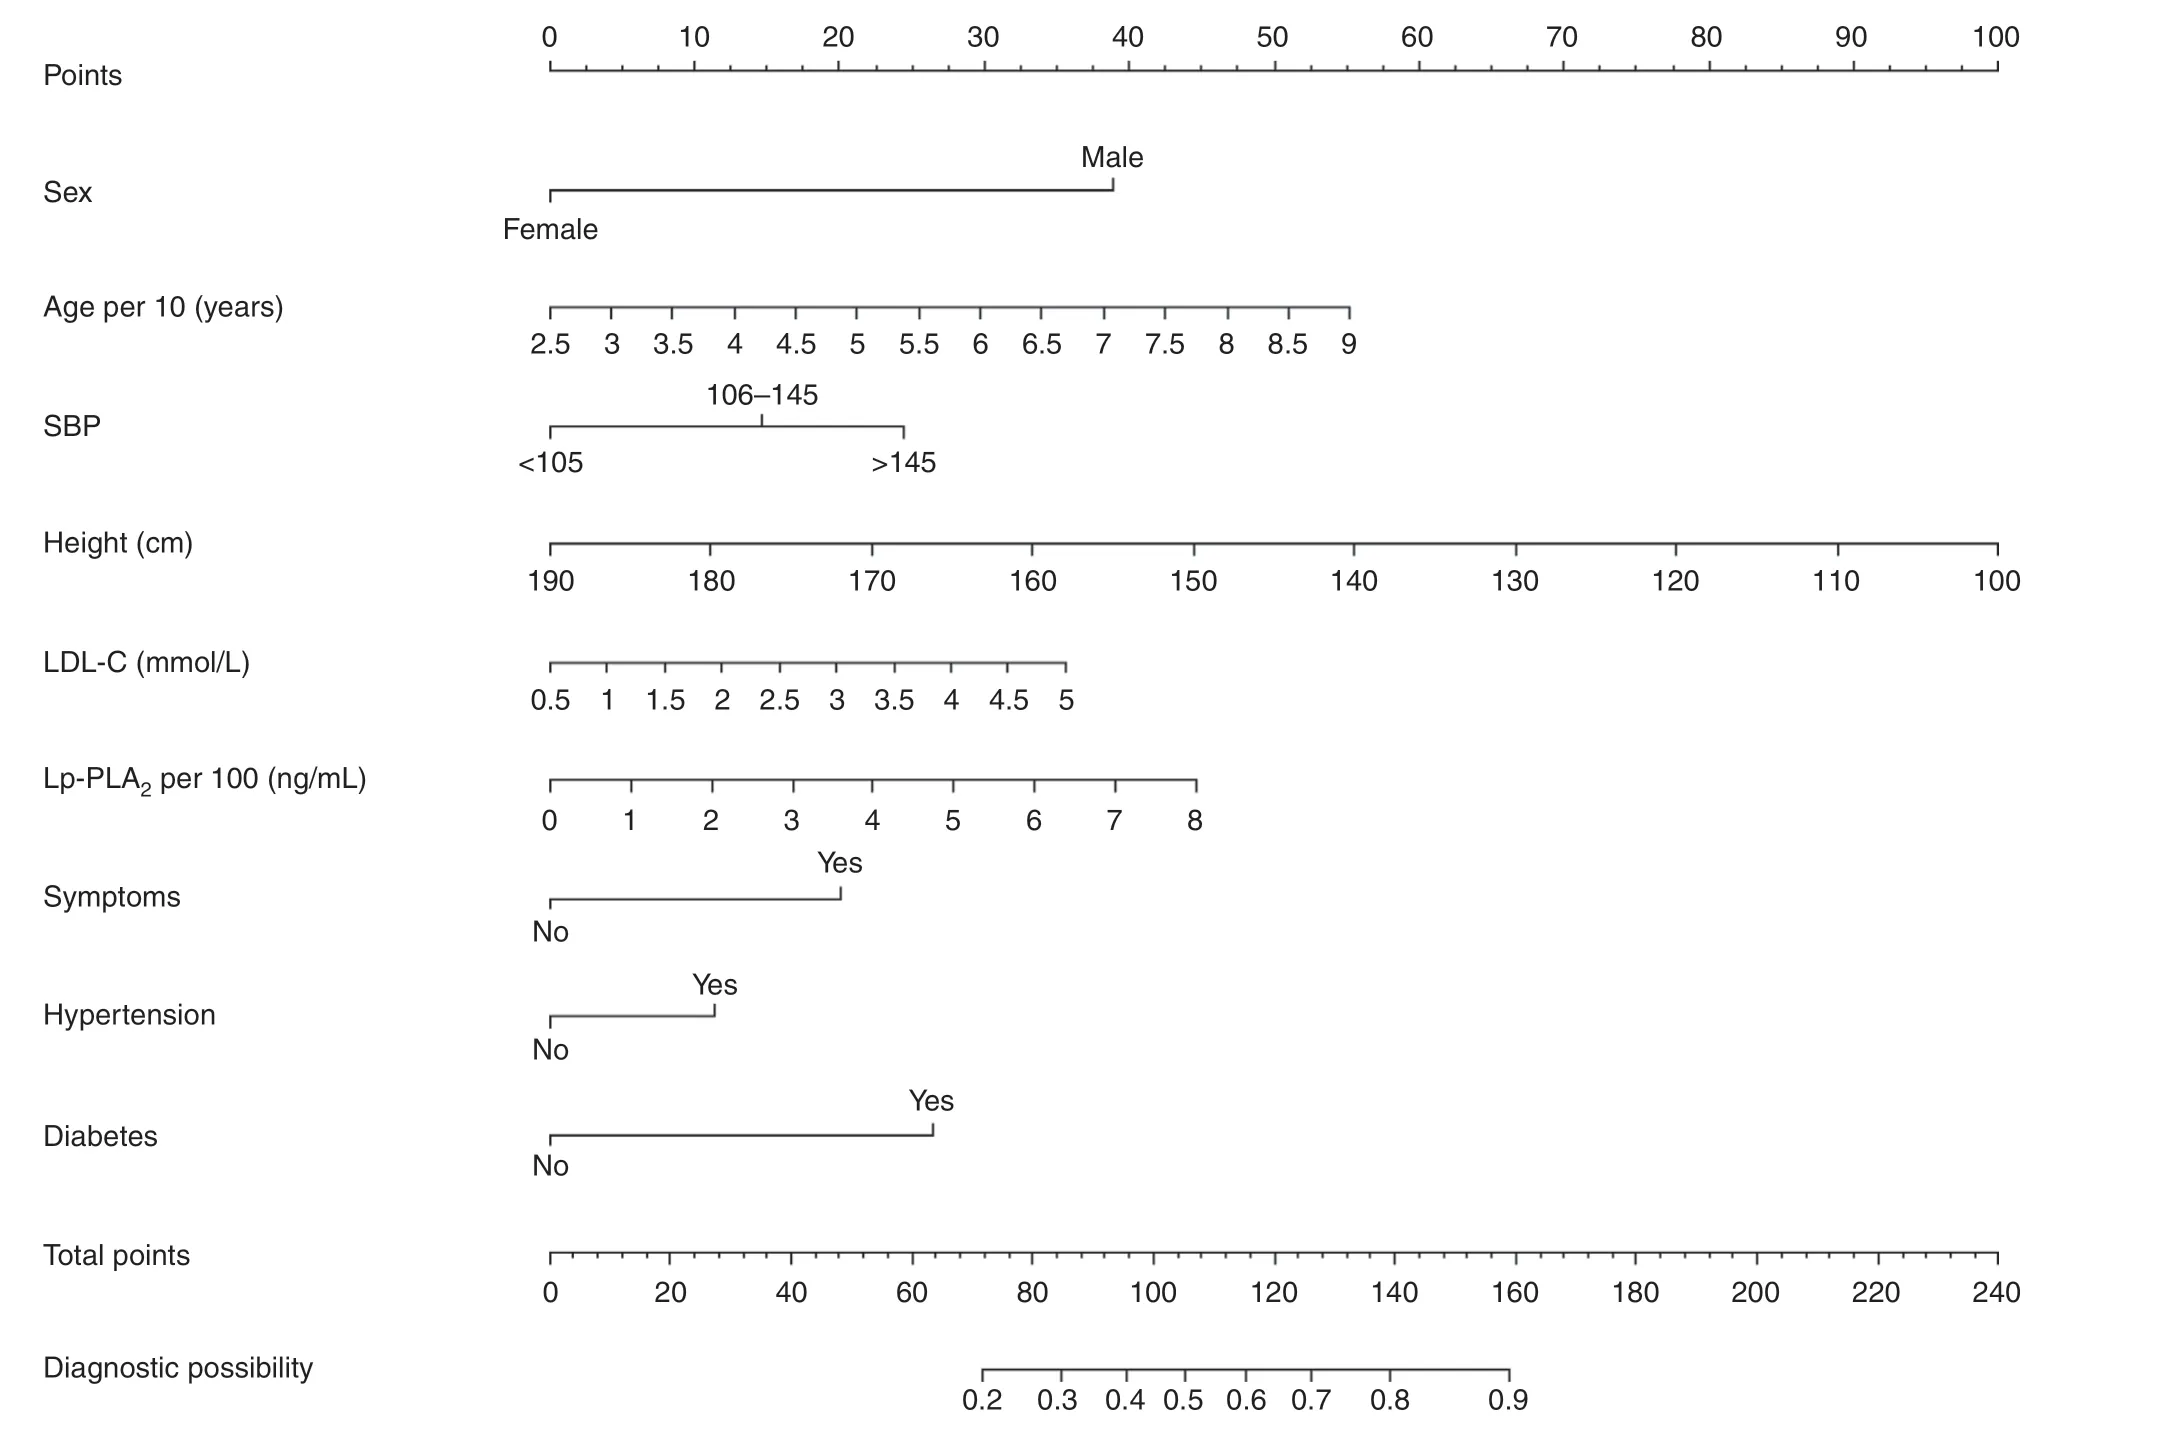
Figure4:Nomogram to predict the probability of CAD.
In the development group,the AUC of model B was greater than that of model A,but the opposite was found in the validation group,but both AUC values were greater than the AUC values in model C.To evaluate the differences in diagnostic accuracy between model A and model B,NRI and IDI can be used [14].In the development group,the category-based and continuity-based NRIs of model A versus model C,model B versus model C,and model B versus model A were all positive,showing that model A is better than model C,model B is better than model C,and model B is better than model A.All of the P values for IDI have statistical signif cance (P <0.05) and indicate that model B is the best.Pencina et al.[15] stated that NRI and IDI could be viewed as a universal measure of ef fect size with an example based on the Framingham Heart Study risk assessment model.With the less sample of validation population got a distinction.So the studies of CPMs should be involved in more numbers of patients as many as possible.
DCA is a novel algorithm for a predictive mode’l s utility for clinical decision making [16],and can assess the performance in clinical scenarios at a range of threshold probabilities.DCA has been considered as an alternative to the AUC [17].Among our models,model B will be of more benef t for patients,because its point of intersection with theXcoordinate is the lar gest of the three models.The weighted area under DCA will be given the improvement of the model comparison in various clinical scenarios in the future [18].
Recently,Lp-PLA2level has been used in diagnosis of cardiovascular events as a new biomarker of vascular disorders [19].Our study showed the odds ratio for Lp-PLA2was 1.26,which suggests it is an important risk criterion.Mayala et al.[20] pointed out that there is a role for LDL-C levels in predicting the development of coronary microvascular dysfunction and CAD.That was one of the reasons why we chose model B rather than model A.
The Framingham Heart Study has paved the way for further epidemiological research in preventive cardiology.The Diamond-Forrester model and the FRS do not consider the type of angina [21],which is less of a risk factor than diabetes,but a greater risk factor that the other risk factors in our study.A prediction model developed with age,sex,chest pain,diabetes mellitus,smoking,and lipid levels based on the Chinese population showed that the strict identif cation of typical angina is benef cial to further optimize this model [22].
A nomogram was used to predict the probability of CAD via the values of every variable on each axis added together to give the total number of points.A total of 2,431 patients with suspected CAD and who underwent coronary angiography were used to develop an intuitive and practical nomogram with the total number of plaques and the area of maximum soft,hard,and mixed plaques [23].In comparison with predicted risk scores,nomograms are easier and more convenient to apply for disease diagnosis and treatment.They are widely used,for example,for cancer prognosis [24].
Conclusion
We developed an individualized nomogram prediction model for diagnosis of CAD by comparison of three models.The AIC was better in screening risk factors.The proposed CPM of CAD should be evaluated and adjusted with new biomarkers or a larger population in future studies.
Study Limitations
All of the patients came from one medical center.The validation group in our study showed the repeatability of the risk prediction model but multicenter hospital data are need to determine the universality.Next,the study was a retrospective,case-control study,and the participants who underwent CAG with suspected CAD may cause a selection bias in diagnosis,which is impossible to avoid.The differing clinical experience of physicians could be another bias.
Conf lict of lnterest
The authors declare that they have no conf ict of interest.
Contributions
Zesen Han was responsible mainly for collection and arrangement of the data and wrote the report.Zhaokun Pu and Lan Yang were participated in data collection and discussed the study with Zesen Han.All of the work was accomplished under the guidance of Lihong Lai.
Funding Statement
There was no funding.
Ethics Approval
This study was granted exemption from requiring ethics approval by the Ethics Committee of The First Aff liated Hospital of Clinical Medicine of Henan University of Science and Technology because this study was a retrospective observational study.
Data Availability
The deidentif ed participant data will be shared on a request basis.
Appendix
Age per 10,Lp-PLA2per 100,height,TC,HDLC,and LDL-C are continuous numbers,male sex is coded as 0 and female sex is coded as 1,SBP under 105 mmHg is coded as 0,SBP from 106 to 145 mmHg is coded as 1,and SBP greater than 145 mmHg is as coded 2,atypical angina is coded as 0 and typical angina is coded as 1,a history of hypertension is coded as 1 and no history of hypertension is coded as 0,a history of diabetes is coded as 1 and no history of diabetes is coded as 0,and a history of smoking is coded as 1 and no history of smoking is coded as 0.
Model A:f(x)=− 2.107 + 0.362 × Age per 10 +(− 1.019) × Sex + 0.421 × SBP + 0.233 × Lp-PLA2per 100 + 0.826 × Symptoms + 0.414 × Hypertension+ 1.047 × Diabetes
Model B:f(x)=5.035 + 0.348 × Age per 10 +(− 1.602) × Sex + 0.445 × SBP + (− 0.05) × Height+ 0.324 × LDL-C + 0.231 × Lp-PLA2per 100+ 0.825 × Symptoms + 0.460 × Hypertension +1.088 × Diabetes
Model C:f(x)=− 1.969 + 0.398 × Age per 10+ (− 1.061) × Sex + 0.485 × SBP + 0.142 × TC+ (− 0.070) × HDL-C + 1.144 × Diabetes +(− 0.131) × Smoking
 Cardiovascular Innovations and Applications2021年2期
- Cardiovascular Innovations and Applications的其它文章
- Progress in the Study of the Left Atrial Function lndex in Cardiovascular Disease:A Literature Review
- Better Than You Think—Appropriate Use of Implantable Cardioverter-Def ibrillators at a Single Academic Center:A Retrospective Review
- Calcium-Sensing Receptor of lmmune Cells and Diseases
- The Relationship between Abnormal Circadian Blood Pressure Rhythm and Risk of Readmission in Patients with Heart Failure with Preserved Ejection Fraction
- Comparison of Diagnostic Effects of T2-Weighted lmaging,DWl,SWl,and DTl in Acute Cerebral lnfarction
- A Case of Pediatric Heart Failure Caused by Anomalous Origin of the Left Coronary Artery from the Pulmonary Artery:Case Report and Literature Review