Variation in hydraulic conductivity of fractured rocks at a dam foundation during operation
Yi-Feng Chen, Jun Zeng, Hongtao Shi, Yifan Wang, Ran Hu, Zhibing Yang,Chuang-Bing Zhou*
a State Key Laboratory of Water Resources and Hydropower Engineering Science, Wuhan University, Wuhan, 430072, China
b Key Laboratory of Rock Mechanics in Hydraulic Structural Engineering of the Ministry of Education, Wuhan University, Wuhan, 430072, China
c China Three Gorges Projects Development Co., Ltd., Chengdu, 610000, China
Keywords:Permeability variation Fractured rock Fracture clogging Seepage control Dam engineering
ABSTRACT Characterizing the permeability variation in fractured rocks is important in various subsurface applications, but how the permeability evolves in the foundation rocks of high dams during operation remains poorly understood.This permeability change is commonly evidenced by a continuous decrease in the amount of discharge (especially for dams on sediment-laden rivers), and can be attributed to fracture clogging and/or hydromechanical coupling.In this study,the permeability evolution of fractured rocks at a high arch dam foundation during operation was evaluated by inverse modeling based on the field timeseries data of both pore pressure and discharge.A procedure combining orthogonal design, transient flow modeling, artificial neural network, and genetic algorithm was adopted to efficiently estimate the hydraulic conductivity values in each annual cycle after initial reservoir filling.The inverse results show that the permeability of the dam foundation rocks follows an exponential decay annually during operation (i.e.K/K0 = 0.97e-0.59t + 0.03), with good agreement between field observations and numerical simulations.The significance of the obtained permeability decay function was manifested by an assessment of the long-term seepage control performance and groundwater flow behaviors at the dam site.The proposed formula is also of merit for characterizing the permeability change in riverbed rocks induced by sediment transport and deposition.
1.Introduction
Characterizing the permeability of fractured rock formations is crucial to various subsurface applications, such as groundwater modeling (Chen et al., 2016a), oil and gas production (Mohamadi-Baghmolaei et al., 2016), thermal energy extraction (Sun et al.,2017), contaminant transport simulation (Carrera, 1993), hyporheic exchange characterization (Rozemeijer et al., 2010; Barlow and Coupe, 2012; Kiel and Cardenas, 2014), and optimization design of impervious barriers in dam engineering (Li et al., 2014,2017; Chen et al., 2015).It has been well understood that the permeability of rocks is determined by the geometries (e.g.size,roughness and interconnectivity) of the void space consisting of pores and fractures through which the fluid transmits.The permeability could hence be highly anisotropic, heterogeneous,and scale-dependent(Snow,1969),and varies with time as the flow geometries change.This could be induced by various processes such as rock deformation (Chen et al., 2007), damage (Chen et al.,2014), erosion (Sadhukhan et al., 2007), and particle clogging(Nowinski et al., 2011).
The variation in permeability of rocks induced by mechanical loading and excavation has been thoroughly investigated under both laboratory and field conditions (Chen et al., 2015).The permeability may decrease due to closure of fractures and cracks,but is more often manifested as a drastic increase(even over 2-3 orders of magnitude)due to damage growth and fracture dilation(Kelsall et al., 1984; Pusch, 1989; Souley et al., 2001).Therefore,the permeability change is typically formulated as a function of deviatoric stress (Han et al., 2016), damage variable (Chen et al.,2014; Gao et al., 2017), irreversible strain (Chen et al., 2007;Pardoen et al., 2016), and fracture dilation (Zhou et al., 2019).An alternative pattern of permeability change in rocks is related to the migration and deposition of sediments in the fracture system,causing physical,chemical or biological clogging of flow channels(Song et al., 2007; Nowinski et al., 2011).This scenario has been frequently encountered in the vicinity of water injection boreholes (Li et al., 2019) or in the hyporheic zone of natural rivers(Datry et al., 2015; Ulrich et al., 2015).In the latter cases, finegrained sediments (including suspension and colloid) are transported and deposited in the fractures of bedrocks (Brunke and Gonser, 1997; Brunke, 1999; Fries and Trowbridge, 2003;Packman and MacKay, 2003; Chen et al., 2008a, 2009a, b).Furthermore, it was observed that fine-grained fracture infillings could be flushed from a more permeable portion and deposited in a less permeable area (Nowinski et al., 2011).This causes significant spatial and temporal variations in rock permeability (Rehg et al., 2005; Nowinski et al., 2011; Grischek and Bartak, 2016;Mooneyham and Strom, 2018).

Fig.1.Location of the Xiluodu Hydropower Project.
In hydropower engineering, dam construction and reservoir impoundment lead to sediment deposition and particle migration in the fractures of foundation rocks, especially on sedimentladen rivers.This is evidenced by the annually decreasing amount of discharge out of the drainage system at quite a number of large-scale dam sites during the operation period (e.g.Jiang and Liang, 2006; Wieland and Kirchen, 2012; Santillán et al., 2013; Shi et al., 2018).Compared to the excavationinduced permeability variation (Chen et al., 2015; Hong et al.,2017), however, how the permeability of dam foundation rocks evolves under this condition is often overlooked and rarely reported.The objective of this study is to characterize the permeability variation pattern in the foundation rocks at the Xiluodu dam site, located on the lower Jinsha River, Southwest China.Inverse modeling is performed to seek the representative hydraulic conductivity values of the foundation rocks in each annual cycle based on the groundwater observations in recent six years.Curve fitting to the inversed hydraulic conductivity values shows that the permeability of the fractured rocks at the dam foundation follows a negative exponential function as a result of sediment deposition, fracture clogging and/or hydromechanical coupling.This relationship is of great significance for understanding the behaviors of groundwater flow and assessing the performance of seepage control in the fractured rocks at dam foundations on sediment-laden rivers.
2.Site characterization
2.1.Project description
Located on the border between Leibo County(Yunnan Province,China) and Yongshan County (Sichuan Province, China), the Xiluodu (XLD) Hydropower Project is the third-level of cascade of dams on the lower Jinsha River (Fig.1), for the purposes of power generation, sediment trapping and flood control.The project mainly consists of a concrete double-curvature arch dam, spillway tunnels and two underground powerhouse cavern systems(Fig.2).The arch dam has a maximum height of 285.5 m,dominated as the third highest dam of the same type in the world.The underground powerhouse cavern systems are located almost symmetrically in both sides of the river banks, each consisting of a machine hall, a transformer room,a tailrace surge chamber and hydraulic tunnels.The construction of the dam was completed in March 2014 after the river was blocked in November 2007.
2.2.Geological settings
The dam site is situated in a typical deep-incised U-shaped valley (Fan et al., 2015; Shi et al., 2018), where the Jinsha River turns 90°from southwest to southeast (Fig.2).The bedrocks outcropping at the dam site are basaltic formations originating from multiple magmatic and volcanic eruption episodes (Fig.3).The formations belong to the Emei Mountain group of the upper Permian system (P2β), which can be categorized into 14 basalt flow layers(P2β1-P2β14)according to the eruption sequences.The rock layers mainly contain porphyritic basalt,amygdaloidal basalt,dense basalt and breccia lava, with a tuff layer of 1-5 m thick onthe top of P2β11, P2β13, and P2β14, respectively.The basalt has a total thickness of 490-520 m and an orientation of N15°-50°E/SE∠3°-24°(or N20°-40°W/NE∠4°-7°in some local places).

Fig.2.Layout of the Xiluodu Hydropower Project.
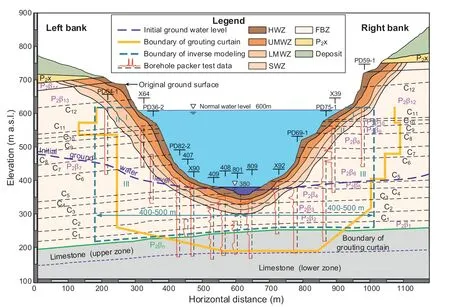
Fig.3.Geological cross-section along the dam axis (in m).
The basalt is underlain by the Maokou formation (P1m) deposited in the early Permian period, which outcrops in the riverbeds about 2 km upstream the dam site and mainly consists of bioclastic limestone, with a thickness of 260-280 m.A thin clay shale layer(P2βn)of 2-3 m thick is deposited between P2β and P1m, which is rich in illite and of lower permeability compared to the basalt and limestone.Therefore,the groundwater in the limestone formations is confined,and the observations from outcroppings and boreholes evidenced that the upper part of the limestone has experienced significant karstification.The basalt layer P2β14is overlain by the Xuanwei formation (P2x) of about 97 m thick, which mainly consists of argillaceous siltstone, bauxitic claystone and carbonaceous shale.This formation is a regional aquitard, resulting in low groundwater levels in the basalt(P2β),as shown in Fig.3.However,influenced by the difference in landform features,the groundwater level was higher in the left bank,with a gradient of about 15%-20%discharging to the Jinsha River.
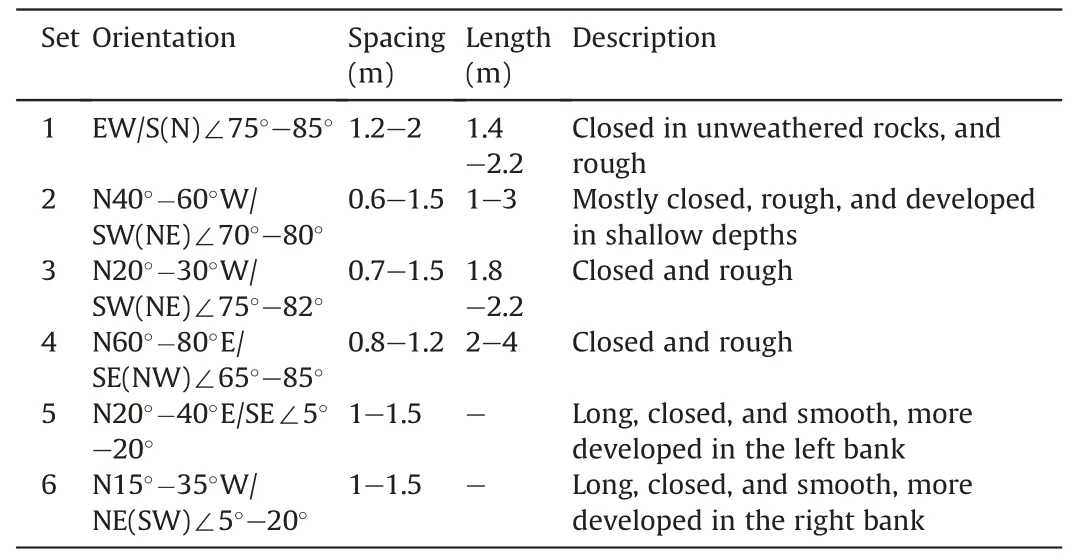
Table 1Characteristics of critically-oriented joints at the dam site.
The main structures at the dam site consist of 12 gently-sloping shear zones (C1-C12) developed between the basalt layers as a result of tectonic shearing(Fig.3).The shear zones are typically 1-2 m thick, and mainly contain basalt breccia and fragments with sizes of 0.5-3 cm.The degree of dislocation of the shear zones increases with elevation,varying from low in C1-C6to medium in C7-C8and to high in C9-C12.Besides the shear zones of regional continuity, local shear zones and fractures are also widely developed within each basalt layer.The localshear zones are subhorizontal (with dip angles between 10°and 25°), formed by shearing along the bedding joints and bedding planes.The local shear zones contain basalt breccia and fragments that are denselycompacted,and mostly have a length of 20-50 m and a thickness of 5-20 cm (in shallow depths) or 2-5 cm (in deeper depths).
Fracture statistics from the outcrops and the surfaces of the exploratory adits show that there are 6 sets of critically-oriented joints developed in the basalt, as listed in Table 1.These joint sets can be categorized into two major groups.One group is subhorizontal (sets 5 and 6), with dip angles below 30°and developed parallel to the bedding planes.The other group is sub-vertical with dip angles over 60°(sets 1-4).This group of joints is mostly short as bounded by the shear zones and interfaces between the basalt layers; at a particular location, only one or two sets of subvertical joints are developed.Aperture data of the joints were also collected during site characterization, showing that the aperture of joints is mostly smaller than 0.1 mm,and roughly decreases exponentially with depth.
2.3.Permeability of rocks
A total of 1644 borehole packer tests were performed during site characterization to investigate the permeability of foundation rocks, including 1327 tests in the basalt (P2β) and 317 tests in the limestone (P1m).Statistical analysis of the test data (Chen et al.,2018) showed that the hydraulic conductivity K of the basalt (P2β)follows a power decay with depth d,i.e.K = K0d-α,where K0is the hydraulic conductivity value near the ground, as shown in Fig.4a.This implies that the hydraulic conductivity is closely related to the degree of weathering (and hence fracturing) experienced by the rocks.Down from the ground surface, the basalt can be classified into five zones in decreasing weathering degree, i.e.heavilyweathered zone (HWZ, with a horizontal depth of about 10-30 m), upper moderately-weathered zone (UMWZ, 25-60 m),lower moderately-weathered zone (LMWZ, 60-100 m), slightlyweathered zone (SWZ, 90-120 m), and fresh bedrock zone (FBZ).The geometric mean of the test data is used to represent the hydraulic conductivity of each permeability zone,as shown in Fig.4a.
It should be noted that the packer tests could not be used to interpret the anisotropy of the permeability.It can be inferred,however,from the geological settings that the hydraulic conductivity K of the basalt is anisotropic.The component of K parallel to the bedding planes (K//) is controlled by the sub-horizontal group of joints,local shear zones,and bedding planes, while the component perpendicular to the bedding plane (K⊥)is contributed by the subvertical group of joints.Field characterizations and tests showed that the anisotropy ratio ν,defined as ν = K⊥/K//,varies in the range of 0.025-0.3 for the basalt and shear zones.The hydraulic conductivity values representative of the site conditions are listed in Table 2.
As shown in Fig.4b, the permeability of the limestone (P1m)does not exhibit a clear trend with depth.According to the test data,however, the limestone could roughly be divided into an upper zone and a lower zone (Figs.3 and 4b).The upper zone is located within about 80 m depth from the clay shale layer(P2βn),where the permeability has a larger mean and variability as a result of karstification.Given the limited number of hydraulic tests in the limestone and the uncertainty associated with the development of karstified fractures and cavities, the upper-bound test value is selected to represent the permeability of the upper zone,as listed in Table 2.Furthermore, site investigations indicated that the permeability anisotropy ratio is smaller in the limestone formations than that in the overlying basaltic rocks (Table 2).

Fig.4.Variation of hydraulic conductivity interpreted from packer tests:(a)in basaltic rocks,where the hydraulic conductivity data geometrically averaged at every 20 m-interval of depth can be well fitted with a power function, with R2 =0.93; and (b) in limestone.N is the number of test data, and R2 is the coefficient of determination.

Table 2Hydraulic properties of rocks at the dam site.
2.4.Seepage control and monitoring systems
To properly control the groundwater flow in the dam and underground powerhouse areas,a large-scale seepage control system consisting of grout curtains, drainage tunnels and drainage hole arrays was constructed, as shown in Figs.2 and 3.
The grout curtains, covering an area of about 8.7 105m2and constructed from six layers of grouting tunnels,extend downwards to the elevation of about 180 m in the dam foundation to cut off the potential leakage paths through the basaltic formations and the upper zone of the limestone.Downstream the grout curtains,a total of about 8000 drainage holes(140 mm in diameter and 10-74.5 m in length) were drilled from five layers of drainage tunnels to reduce the pore pressure in the dam foundation rocks and the surrounding rocks of the powerhouse caverns.
To assess the performance of the seepage control system, a groundwater monitoring system consisting of 123 piezometers and 52 weirs was installed at the dam site.Among them, 50 piezometers(numbered from P2-1 to P29-2)are located about 1.5 m below the concrete-rock interfaces in the dam foundation,together with 10 weirs (numbered as WE6-T, WE8-T, WE9-T,WE11-T and WE13-T in the left bank, and WE1-T, WE3-T, WE10-T,WE12-T and WE14-T in the right bank) installed in drainage tunnels near the abutment for collecting the discharges out of the drainage system (Fig.5).Besides, there are 36 piezometers(numbered from PZ1-PL to PZ36-PL) and 18 weirs installed in the left cavern system (Fig.6), and 37 piezometers (numbered from PZ1-PR to PZ37-PR) and 24 weirs in the right cavern system(Fig.7), respectively.
2.5.Groundwater observations during operation
The impoundment of the reservoir started in September 2012,and the normal pool level was first attained in September 2014.The pool water level curve(Figs.8 and 9)can thus be separated into an initial impounding stage before May 30, 2014 and a normal operation period afterwards that up to now contains six annual cycles(I-VI).During operation,the pore pressures in the foundation and surrounding rocks and the discharges from the drainage system were continuously recorded by the monitoring system.A representative subset of the measurements shows that except the fluctuations with the pool water level, the pore pressure measurements are rather stable during operation (Fig.8).The discharge, however, decreases annually, which occurs even at the weirs in the upper drainage tunnels (e.g.weir PGL4 located at elevation of 485 m,about 160 m above the riverbed,see Fig.9).This phenomenon frequently occurs in high dam foundations(e.g.Jiang and Liang,2006;Wieland and Kirchen,2012;Santillán et al.,2013;Shi et al.,2018),and is attributed to reduction in the permeability of near-field rocks.The permeability reduction could be induced by hydromechanical coupling, sediment deposition and/or fracture clogging.Recall that the Jinsha River is a sediment-laden river with an annual suspended sediment concentrationof 1.79 kg/m3and an average annual sediment load of 2.55 1011kg(Cao et al.,2011).In 2014, the sediment deposited in the XLD reservoir was about 6.19 1010kg, with a high trapping ratio of about 90.7% (Li et al.,2018).Therefore, fracture clogging by fine-grained sediments may dominate, as evidenced by the discharge decrease at high elevations.The purpose of this study is exactly to clarify how the permeability of the near-field rocks evolves based on the field measurements during operation.
3.Methods
3.1.Transient flow model
Given the scale and complexity of the problem and the fracture system in the study area,we assumed that the continuum approach applies for groundwater flow modeling.This assumption is acceptable for groundwater flow in dam areas, due to fully deterministic upstream and downstream boundary conditions that largely determine the hydraulic gradient in the foundation rocks,and the construction of grout curtains that weaken the role of individual fractures in groundwater flow(e.g.Zhou et al.,2015;Chen et al., 2016b).In the framework of continuum approach, the mass balance equation for transient flow in fractured rocks in any domain Ω (including its dry subdomain) can be written as (Chen et al., 2011):

where φ is the total water head; Ssis the specific storage; H is a Heaviside function defined as H = 0 if φ z and H = 1 if φ < z, in which z is the vertical coordinate;t is the time; and v is the Darcy velocity defined as

Fig.5.Layout of piezometers and weirs deployed in the dam foundation (section G-G): (a) top view, and (b) upstream view.The numbers in red denote the monitoring points selected for inverse modeling.

Fig.6.Layout of piezometers and weirs deployed around the left bank caverns: (a) view along section E-E, and (b) view at elevation 425 m.The numbers in red denote the monitoring points selected for inverse modeling.

Fig.7.Layout of piezometers and weirs deployed around the right bank caverns: (a) view along section F-F, and (b) view at elevation 425 m.The numbers in red denote the monitoring points selected for inverse modeling.

Fig.8.Hydraulic head measurements recorded by some representative piezometers during operation.

where K is the hydraulic conductivity tensor.
The continuity equation (Eq.(1)) is subjected to the following initial condition(Eq.(3))and boundary conditions(Eqs.(4a)-(4d)):

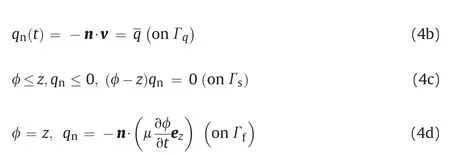
where φ0is the initial distribution of water head,φ is the prescribed water head on the water head boundary Γφ,is the prescribed fluxon the flux boundary Γq, Γsis the potential seepage surface, Γfis the free surface (an interface between the wet and dry subdomains), n is the outward unit vector to the boundary, ezis the upwards vertical unit vector, and μ is the specific yield.
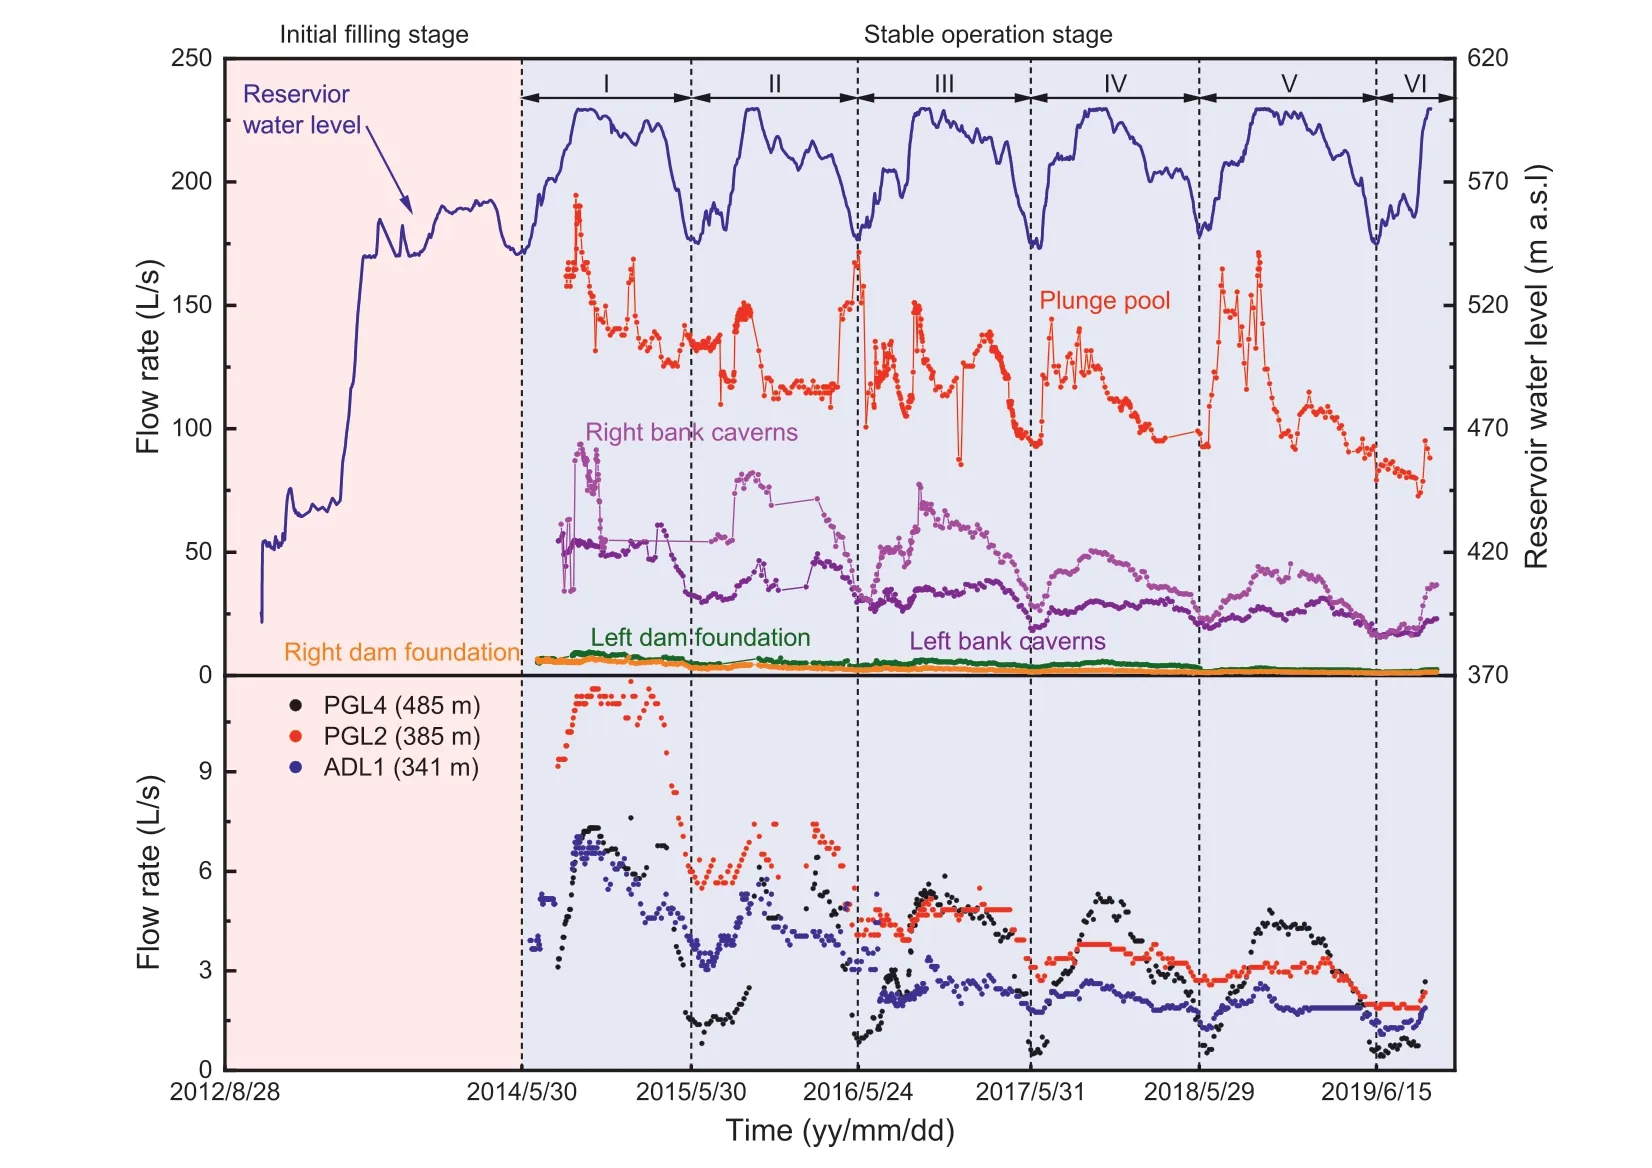
Fig.9.Discharge measurements recorded at some representative weirs during operation.The upper plot shows the total discharges in different areas at the dam site.
The above model of transient flow with free and seepage surfaces can be effectively addressed with the discretized parabolic variational inequality formulation(Chen et al.,2011).The computer code,THYME3D,which has been developed and validated for over10 years(Chen et al.,2009c,2011),is adopted for flow simulations in this study.

Fig.10.Finite element model for transient flow and inverse modeling:(a)range of the domain,(b)3D finite element mesh,and(c)seepage control system represented in the finite element model, which contains grout curtains covering an area of 866,672 m2 and 7980 drainage holes, together with a series of grouting and drainage tunnels.
3.2.Finite element model and boundary conditions
A large-scale three-dimensional (3D) finite element mesh was created for flow simulations and inverse modeling at the dam site,which contains 10.8 million brick elements (with some of them degenerated to tetrahedral elements) and 3.6 million nodes, as shown in Fig.10.The size of the model domain(Fig.10a)is 4000 m along the river flow direction, 3550 m along the dam axis, and about 1000 m in height.The hydraulic structures(e.g.the arch dam,subsidiary dam, hydraulic tunnels, and underground powerhouse caverns) and the topographic and geological settings (e.g.the strata,permeability zones,and shear zones)were well represented(Fig.10b).The complex seepage control system consisting of drainage and grouting tunnels, grout curtains, and drainage holes(7980 in total) was also well modeled (Fig.10c), particularly by using a substructure technique for the drainage holes to reduce the difficulties in mesh generation(Chen et al., 2008b).
The boundary conditions were specified as follows:
(1) The time-variant pool water level was prescribed on the upstream surface of the dam and the ground surface submerged in the reservoir,and the downstream water level was controlled by the elevation of the subsidiary dam (385 m)and the river channel (about 380 m).
(2) The surfaces of the drainage tunnels and holes were prescribed as the potential seepage boundary, except the drainage holes drilled downwards in the lowest level of drainage tunnels which might become a water head boundary determined by the floor elevation of the connected drainage tunnels.
(3) The base of the model and the lateral boundary on the rightbank mountain side were assumed to be impermeable according to the site conditions.
(4) Influenced by the Doushaxi stream (Fig.10b), the groundwater level on the left-bank mountain side was relatively high (Fig.3), and its distribution was assumed to follow a modified trigonometric function from upstream to downstream (Chen et al., 2016b).
3.3.Inverse modeling approach
3.3.1.Parameters to be estimated
The hydraulic parameters in the transient flow model include the hydraulic conductivity tensor K (or its principal values K//and K⊥), the specific storage Ss, and the specific yield μ.The specific storage and specific yield can be estimated from the compressibility and porosity of fractured rocks(note that the latter takes the sum of the porosity of intact rocks determined in laboratory and the volume fraction of fractures estimated in the field),respectively(Chen et al.,2020),as listed in Table 2.The hydraulic conductivity values of the rock formations (or zones) less influenced by excavation and hyporheic transport were determined by the packer tests(Table 2).The near-field rocks where fracture clogging most likely occurs are in the LMWZ,SWZ and FBZ(hereafter marked as zones I,II and III,respectively)below the normal pool level(i.e.600 m)and upstream the grout curtains(Fig.3).It is noted that the HWZ and UMWZ were mostly excavated during construction, and the range of zone III is empirically estimated to be within a horizontal distance of 400-500 m from the river(Fig.3,basically consistent with the range of grout curtains), given that such a zone may vary from tens of meters to even several kilometers (Harvey et al.,1996; Mertes,1997).Consequently,the hydraulic conductivities of these three zones are chosen for inverse modeling,constituting a vector P = {KI,νI,KII,νII,KIII, νIII} of six unknowns, where Kiand νi(i = I, II, III) denote the component parallel to bedding planes and the anisotropy ratio of hydraulic conductivity in rock zone i, respectively.
3.3.2.Objective function
An objective function is constructed to ensure a best fit between the field measurements and numerical results, which uses the time-series of both discharge and pore pressure data to improve the reliability of the inversed results (Zhou et al., 2015; Chen et al.,2016b):

where P is the vector of parameters to be estimated; M and N are the numbers of piezometers and weirs, respectively; φiand ~φiarethe time-series of calculated and measured water heads (or pore pressures) at piezometer i, respectively; Qjand ~Qjare the timeseries of calculated and measured discharges at weir j, respectively; w is a weight coefficient introduced to ensure a balance between the relative errors of pore pressure and discharge measurements; and ‖·‖2denotes the Euclidean norm of a vector.

Table 3Locations of monitoring points selected for inverse modeling.
The measurement data in Eq.(5)need to be properly selected by taking into account the layout of the monitoring system,so that the groundwater flow behaviors could be well represented.In this study,a total of 16 piezometers and 8 weirs are selected for inverse modeling (Table 3), which accounts for 13%-15% of the total number of piezometers and weirs at the site.The weight coefficient takes w =0.07 in this study.
3.3.3.Inverse modeling procedure
The inverse modeling started on May 30, 2014, due to lack of measurements before that time; it was performed annually based on the measurements collected in each annual cycle(see Figs.8 and 9).To address this large-scale inverse problem, the procedure combining orthogonal design(OD),finite element analysis,artificial neural network (ANN) and genetic algorithm (GA) (Zhou et al.,2015; Chen et al., 2016b, 2020; Hong et al., 2017) was adopted in this study.The OD yields a representative set of 36 parameter combinations by constructing an orthogonal table L36(66), with 6 parameters to be estimated (i.e.|P| =6) and 6 levels specified for each parameter from the ranges empirically given in Table 2.Forward modeling of transient flow is then invoked by using each of the parameter combinations as input parameters,hence drastically reducing the computational cost of the finite element simulations.The numerically obtained time-series data at the monitoring points(as output), together with the parameter combinations and the prescribed water head boundary conditions (as input), are used to construct and train a back propagation neural network (BPNN)model, having a structure of 6-27-23-20 neurons from input to output layers.A GA,with a size of 100 for the initial population and probabilities of 0.9 and 0.1 for crossover and mutation operations,respectively,is finally used to obtain a globally optimal estimate of P by minimizing Eq.(5) with the numerical data output by the BPNN model.Details of the algorithm can be found in Chen et al.(2020).
4.Results
4.1.Variation of hydraulic conductivity
The inversed values of hydraulic conductivity in each annual cycle for the near-field rock zones influenced by sediment transport(possibly with other factors)are shown in Fig.11.It is interesting to observe that the inversed K values (hereafter referred to as the component parallel to bedding planes)in the first annual cycle(i.e.K0) are rather close to the site characterization values estimated from packer tests, as plotted in Fig.4a.This indicates that the permeability increase induced by excavation during construction has been compensated by the permeability decrease induced by fracture clogging during the initial impoundment and operation before May 2015.From then on, the permeability of the near-field rocks decays annually, which could be best-fitted with the following negative exponential function (Fig.11a):
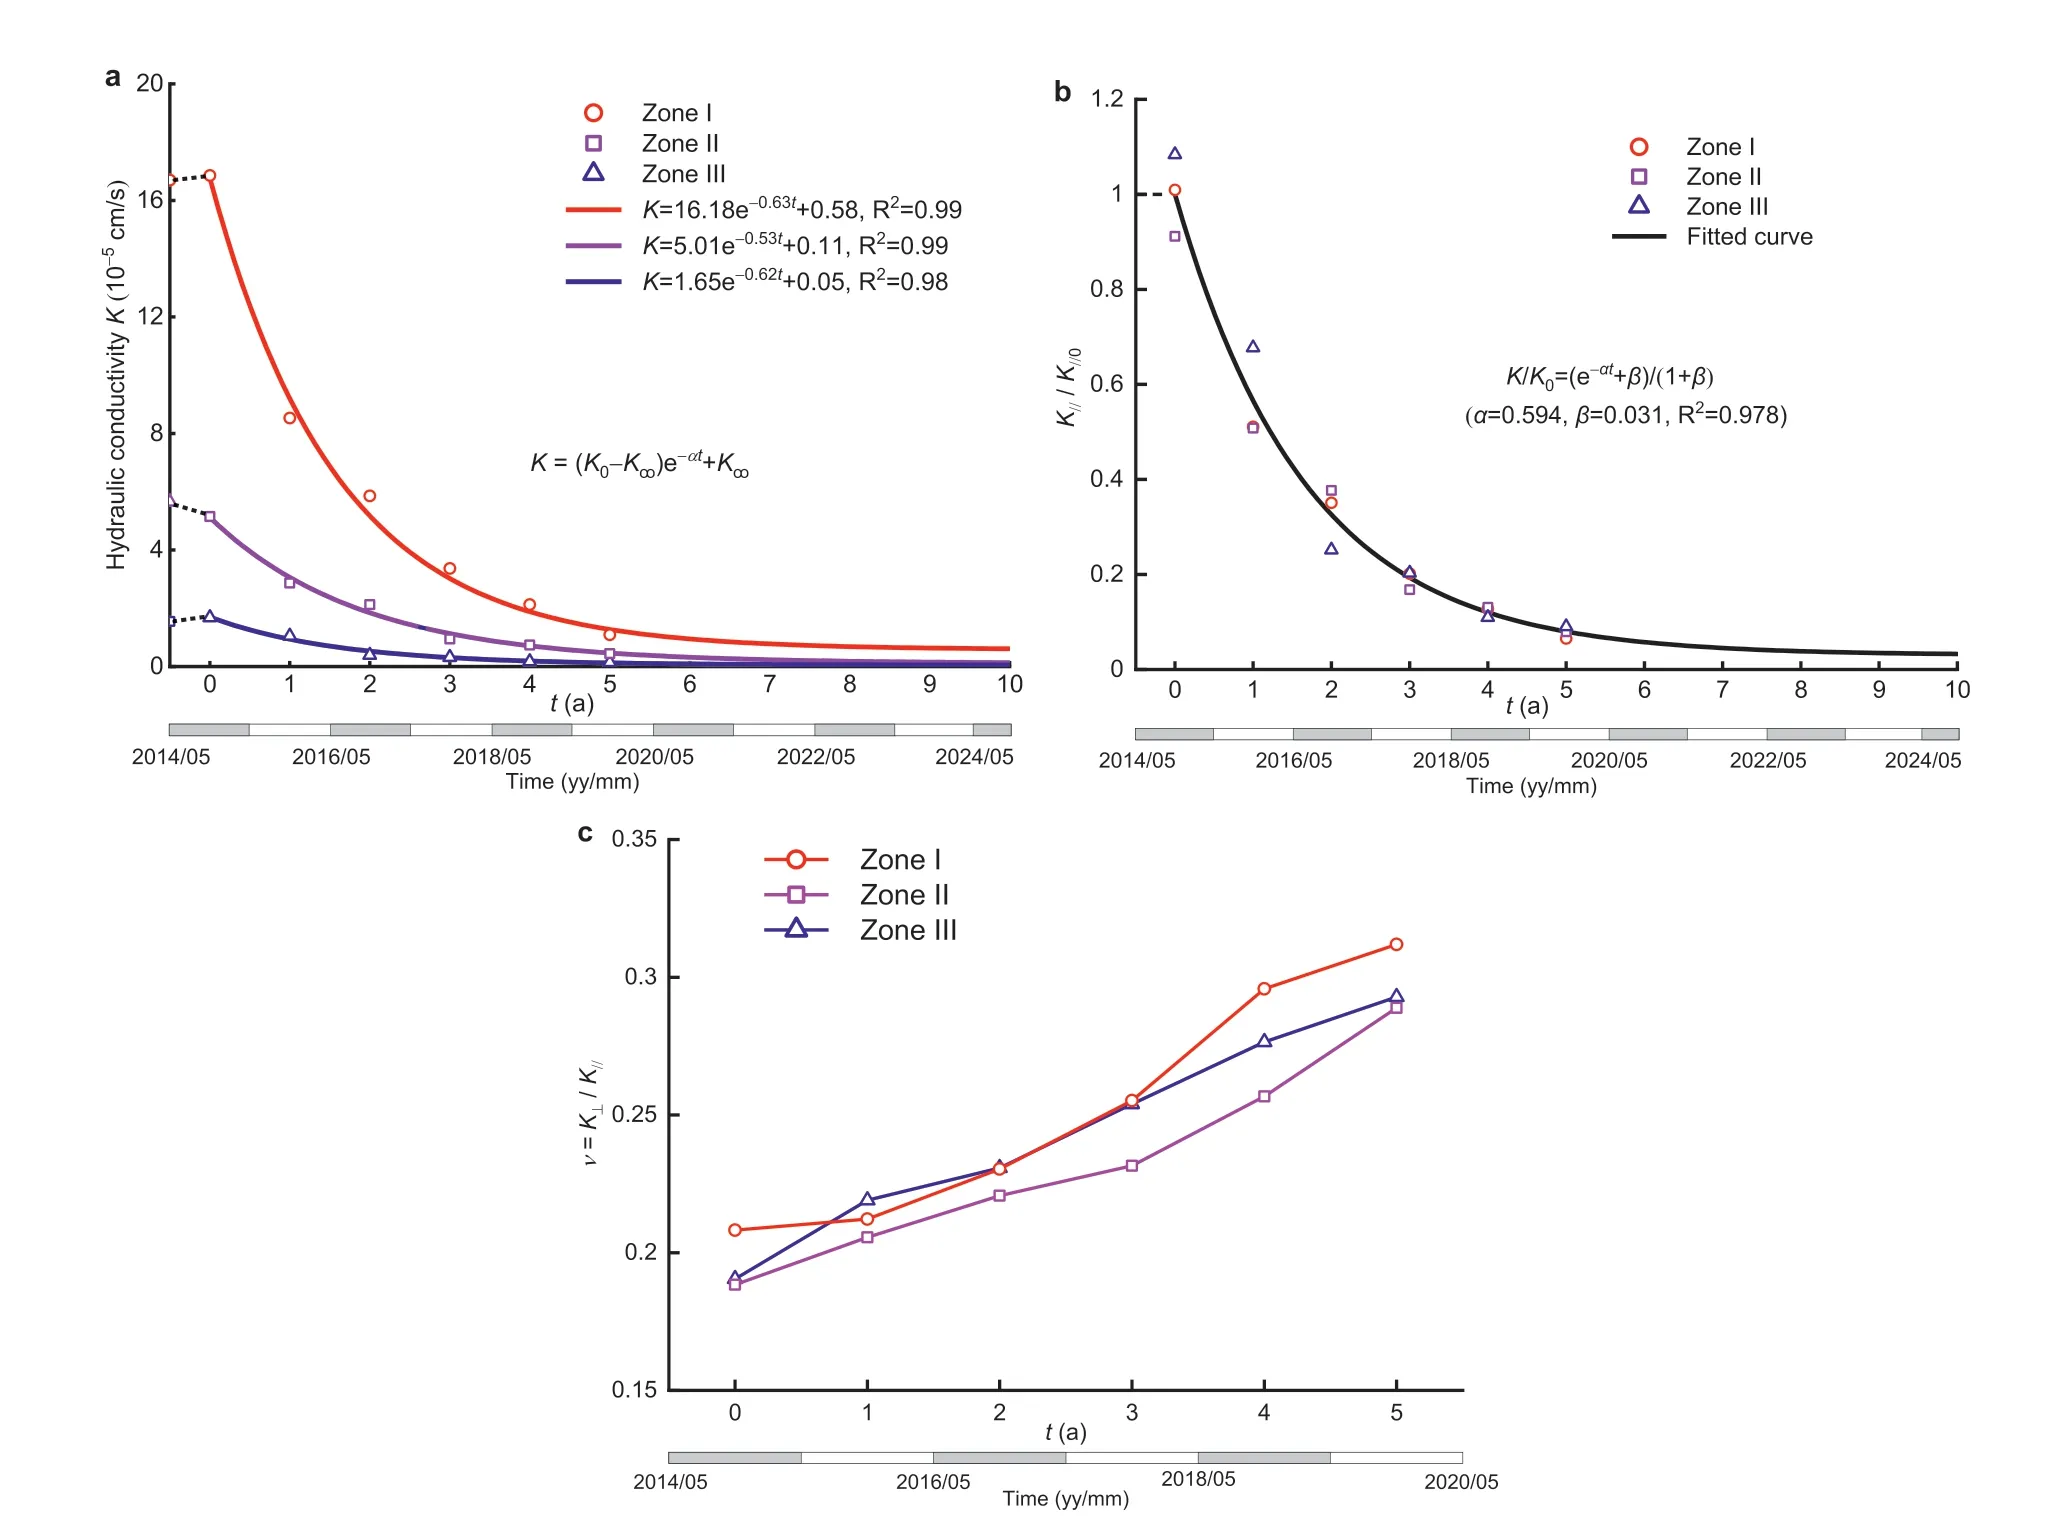
Fig.11.The annually inversed hydraulic conductivity values in the near-field rocks: (a) The component of K parallel to bedding planes, K//, where the data points plotted on the vertical axis denote the representative values of hydraulic conductivity determined from site investigation data;(b)The K//component normalized by its initial value K//0 estimated in the first year of operation, K///K//0; and (c) The anisotropy ratio, K⊥/K//.

where t is the time in year, K0is the inversed K value in the first annual cycle(marked by t = 0),K∞is the asymptotic K value after a sufficient long time,and α is a coefficient denoting the decay rate of permeability.
Fig.11b shows that the normalized permeability, defined as K/K0, follows a unified exponential decay for all the three near-field rock zones:

where β is a coefficient in the form of β = K∞/(K0- K∞).The curvefitting yields α = 0.594 and β = 0.031 in this study,with R20.98.This high coefficient of determination results from the clear trend of decrease in discharges at the site,and from the proper choice of monitoring points in the inverse modeling as well.Sensitivity analysis shows that the permeability of rock zones II and III is most sensitive to the discharges in tunnels PGL4 and PGR4(485 m)and to the discharges in tunnels PGL2 and PGR2 (385 m), respectively.These different sensitivities make the permeability in different zones relatively easier to be tuned in back calculations.
Eq.(7)implies that after six years of operation(t =5 a,recalling that the first annual cycle is marked by t =0), the permeability of the near-field rocks in the dam area is reduced by one order of magnitude, and presently, the permeability variation tends to a quasi-stable state.This equation further predicts that the stable state (in terms of the permeability change, and hence the groundwater flow behavior) could be attained at t =9 a (i.e.in 2024).This prediction may be of practical significance in answering when the groundwater flow-induced valley deformation (Cheng et al., 2017) tends to converge.
Fig.11c shows the inversed anisotropy ratio values of hydraulic conductivity, ranging between 0.18 and 0.32 for the near-field rocks.It should be noted that with increase of horizontal depth(i.e.in zone III), the anisotropy ratio (in the potential range characteristic of site conditions, e.g.0.1-0.5) becomes less sensitive to the seepage field, and hence the inversed values of νIIIare less reliable.Consequently, it is hard to discern a clear trend of permeability anisotropy with increasing horizontal depth(i.e.from zone I to III),but the plot indicates a slightly decreasing trend in the degree of flow anisotropy as the clogging effect accumulates from year to year.
4.2.Comparison with field measurements
Transient flow simulation had been performed in the study area for about six years since May 30, 2014, using the inversed parameters (Fig.11) for the near-field rocks.The hydraulic parameters of other rock zones are taken from Table 2 and keep unchangedduring simulation;and the boundary conditions are specified in the same way as described in Section 3.2.The error between the obtained time-series of numerical results (R) and the measurements(Z) at any monitoring point is evaluated by the following three widely-applied statistical criteria (e.g.Tseng et al., 2001; Jain and Kumar, 2007):

Fig.12.Comparison between the measured and calculated time-series of hydraulic head in the dam foundation rocks.

where MAE is the mean absolute error; RMSE is the root mean square error;MAPE is the mean absolute percent error;Riand Ziare the numerically obtained and measured data at time point i,respectively.
Figs.12 and 13 show the evolution of calculated and measured hydraulic heads(converted from pore pressures)at 29 piezometers,including 15 piezometers in the dam foundation rocks(Fig.5),and 7 piezometers in the surrounding rocks of each cavern system(Figs.6 and 7), respectively.A comparison between the curves shows that the numerical simulation well reproduces the pore pressure variations, except for some local fluctuations (e.g.at piezometer PZ33-PL).The MAE, RMSE and MAPE errors are 0.48-8.14 m, 0.23-9.92 m and 0.12%-7.36%, with the means of 2.11 m,2.92 m and 0.73%, respectively, as listed in Table 4.The largest errors occur at piezometer PZ33-PL, where seasonal fluctuations of pore pressure are not well captured,but these errors are still within the engineering accuracy.The piezometers P15-1 and P16-1 are located upstream the grout curtains, and hence have the largest readings and fluctuations of pore pressure; other piezometers are on the downstream side, and have smaller readings and narrower range of fluctuations, as remarkably influenced by the drainage system.All these features are well simulated by the numerical model.
Unlike the pore pressure in the fractured rocks, the discharge from the drainage system seems to vary in a more complex form,fluctuating significantly with pool water level and exhibiting a decreasing trend annually, as plotted in Fig.14.A comparison between the numerical results and measurements in 16 representative drainage tunnels and in the plunge pool area shows that the numerical simulation reasonably predicts both the trend and magnitude of the discharge data.The MAE, RMSE and MAPE errors are 0.16-4.03 L/s, 0.08-20.74 L/s and 6.02%-81.57%, with the means of 1.35 L/s, 2.63 L/s and 24.77%,respectively(Table 5).Note that for small discharge, MAPE could be high even the absolute error is negligible.For example,in tunnel PGR3,MAPE is as high as81.57%, but the MAE and RMSE errors are acceptable (1.57 L/s and 2.22 L/s).The discharge observations in the plunge pool area fluctuate drastically, due to regular maintenance and repairs during which pumping and water injection are performed successively.Although this scenario is not considered in our simulation, the numerical results reasonably reproduce the magnitude and the evolving trend of discharge in this area (with a high RMSE error of 20.74 L/s but a moderate MAPE value of 12.55%).

Fig.13.Comparison between the measured and calculated times-series of hydraulic head in the surrounding rocks of the left-bank cavern system(a,b)and the right-bank cavern system (c, d).

Table 4Errors between the measured and calculated time-series of hydraulic head at 29 typical piezometers.
Fig.15 plots a comparison between the measured and simulated total discharges from the drainage system at the normal pool level(600 m)in early October annually,showing again that the discharge at the dam site is well modeled, with a relative error smaller than 14.3%.The range and mean errors of numerical results listed in Tables 3 and 4 indicate that when the hydraulic conductivity variation is disregarded (i.e.using the values obtained during site characterization),the predictions of discharge deviate significantly from the measurements.This justifeis the need for evaluating the variation in hydraulic conductivity during operation.
4.3.Seepage flow behaviors at the site
Fig.16 shows the hydraulic head contours and phreatic surface variations during operation in the underground powerhouse areas along cross-sections A-A and B-B (with their traces shown in Fig.2), and Fig.17 shows a comparison of the hydraulic head contours along the central cross-section C-C of the dam foundation in 2014 and 2019.The reservoir water level for these plots is 600 m(normal pool level)occurring in early October annually.These plots indicate that although the seepage field at the site varies from year to year, the changes in groundwater level (and hence the pore pressure)are within an acceptable small range.This evidences that the grout curtains and drainage system were well designed and constructed, and function well during operation in cutting off the flow paths or reducing the pore pressure downstream the impervious barriers.
Furthermore, the clogging effect in near-field rocks leads to slight increase in groundwater level on the upstream side of the grout curtains and moderate decrease of the maximum hydraulic gradient in the grout curtains from 30.4 in 2014 to 20.2 in 2019.Owing to different lateral recharge conditions from the left-bank and right-bank mountain sides and influenced by the orientation of the bedding planes,the seepage fields in the left-bank and rightbank cavern areas downstream the grout curtains behave slightly different and exhibit slow trends in discharge (Fig.16a) and recharge (Fig.16b), respectively.But the seepage fields have approached a quasi-stable state.
The other aspect of the seepage fields worthy of attention is the discharges in different local areas.For instance,the discharge from tunnels DL1-DL3 in the left-bank cavern area is relatively large in magnitude (Fig.14a); this is mostly caused by shear zones C3-C5which intersect the tunnels and provide flow paths from reservoir and the mountain side (Fig.16a) and by the excavation-induced permeability increase in the surrounding rocks (Chen et al.,2015).The moderate discharge from tunnels DR1-DR3 in the right-bank cavern area (Fig.14d) is induced for the same reason (but by shear zones C2-C4,Fig.16b).Interestingly,as shown in Fig.14c,the discharge from tunnel PGR4 is much larger than those from the tunnels at lower elevation(e.g.PGR3).This results from the gentlysloping shear zones C7and C8that cut through the tunnel and the particular topographic feature in the right bank where the Jinsha River makes a 90°turn, favoring the leakage from the reservoir to the tunnel (Figs.10a and 16b).
Another particular concern is the discharge in the plunge pool area, which accounts for over a half (45.9%-74.8%) of the total discharge at the dam site(Figs.14e and 15).The underlying reason is that during site investigation, a total of 28 boreholes (76 mm in diameter) were drilled in this area (with their locations shown in Fig.2), penetrating into the upper zone of the Maokou limestone,but were not properly plugged afterwards.These abandoned boreholes therefore form the channels to transmit the confined water in the limestone formation upwards to the drainage system in the plunge pool area,which has been confirmed by the observed abnormal temperature rise of the seeped water.The flow behavior of these abandoned boreholes is described by Hagen-Poiseuille’s law in this study, and an equivalent diameter of 22 mm can best approximate the conductivity of these boreholes after years of clogging by riverbed sediments and blasting fragments during site investigation and construction (Zeng et al., 2019).
Therefore,all the particular phenomena of discharge at the dam site can be well interpreted with the site conditions and the inversed results.Given the extremely large scale of the project,the amount of the total discharge at the site has been satisfactorily controlled to a sufficiently small magnitude,which even decreases significantly each year due to the clogging and/or hydromechanical coupling effects in the foundation rocks (Fig.15).
5.Conclusions
This study phenomenologically investigated the permeability variation of the fractured rocks at a high arch dam foundation induced by sediment deposition and fracture clogging (possibly together with hydromechanical coupling).This was achieved by performing inverse modeling in each annual cycle based on the time-series data of both pore pressure and discharge collected after initial reservoir filling.The inverse modeling showed that at the end of the first operation year, the permeability values of the foundation rocks are basically the same as the site characterization values before construction of the dam, implying that the excavation-induced permeability change has been compensated by fracture clogging during this initial impounding and operation stage.The permeability of the foundation rocks then decays annually, following a negative exponential function in the form of K/K0= 0.97e-0.59t+ 0.03 (here t is the time in year).Numericalsimulations with this permeability function well reproduce the groundwater flow behaviors at the site, and demonstrate the effectiveness of the complex seepage control system containing 7980 drainage holes and grout curtains covering an area of 8.7 105m2.The proposed permeability function is of great significance for long-term performance assessment of high dams over sediment-laden rivers because the permeability decay in foundation rocks reduces the pressure gradient in seepage-proof barriers,and this function could also be applicable for hyporheic exchange modeling, where the effect of fracture clogging on rock’s permeability variation dominates.

Fig.14.Comparison between the measured and calculated time-series of discharge in the areas of the left bank (a, b), right bank (c, d), and plunge pool (e).
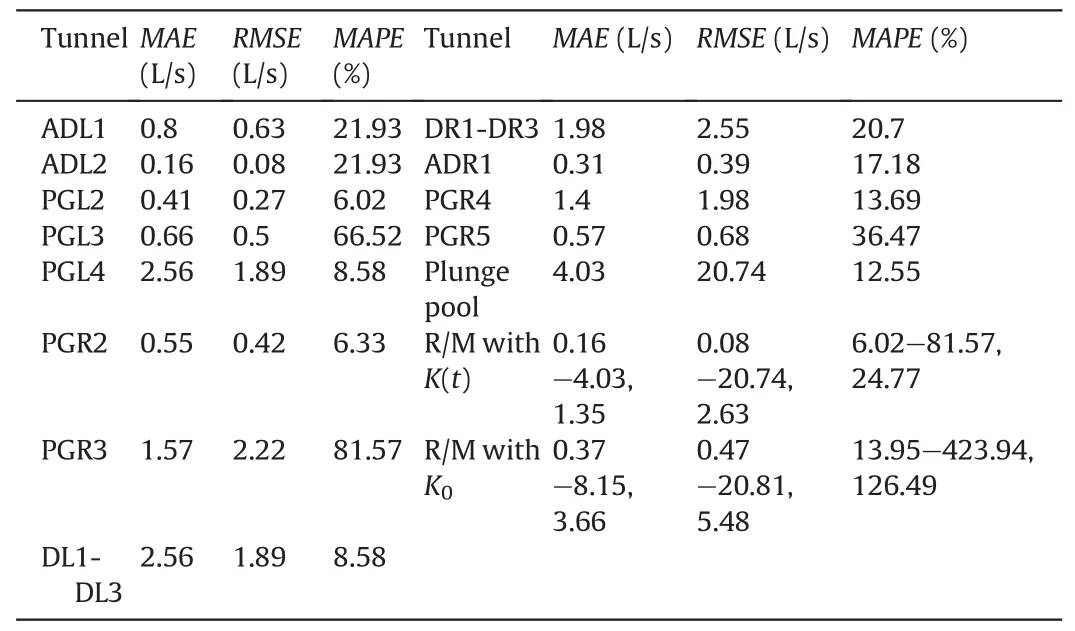
Table 5Errors between the measured and calculated time-series of total discharges in 16 typical tunnels and in the plunge pool area.
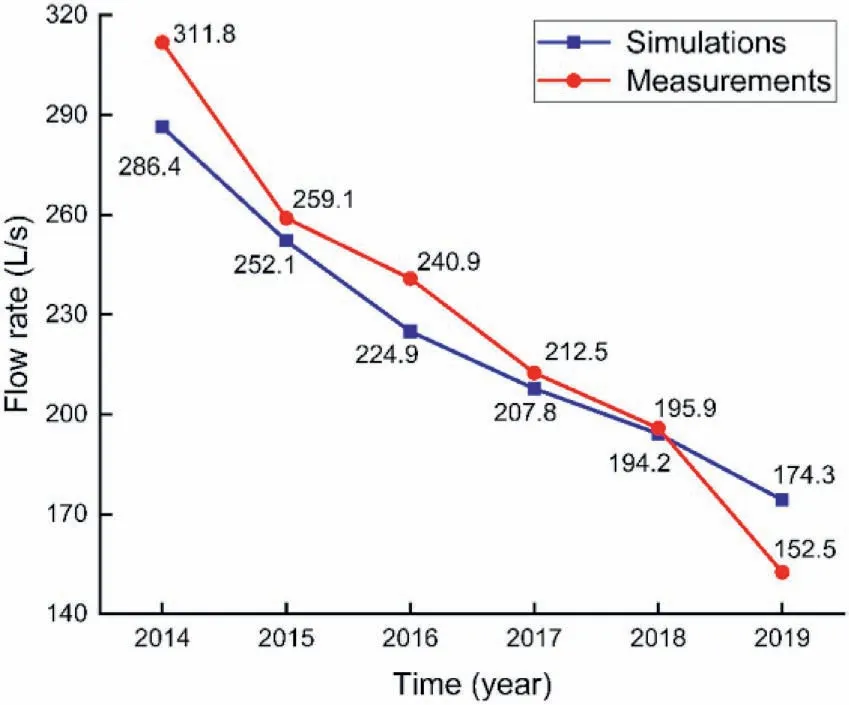
Fig.15.Comparison between the measured and calculated total discharges at normal pool level (600 m) in early October annually.

Fig.16.Hydraulic head contours(unit:m)and phreatic surface variations in the underground powerhouse areas:(a)along cross-section A-A in the left bank,and(b)along crosssection B-B in the right bank.The traces of the cross-sections are shown in Fig.2.

Fig.17.Hydraulic head contours (unit: m) along the central cross-section C-C of the dam in early October of 2014 and 2019.
Declaration of competing interest
The authors wish to confirm that there are no known conflicts of interest associated with this publication, and there has been no significant financial support for this work that could have influenced its outcome.
Acknowledgments
The financial supports from the National Key R&D Program of China (Grant No.2018YFC0407001), the National Natural Science Foundation of China (Grant No.51925906), and the Research Program of China Three Gorges Corporation (Grant No.XLD/2119) are gratefully acknowledged.
Nomenclature
d Depth from ground surface
ezUpwards vertical unit vector
H Heaviside function
K, K Hydraulic conductivity tensor and its isotropic counterpart
K//, K⊥Horizontal and vertical components of hydraulic conductivity
K0, K∞Initial hydraulic conductivity and its asymptotic value after a sufficient long time;K0is also abused for hydraulic conductivity near the ground surface
M, N Number of piezometers and weirs; N is also abused for the dimension of a time-series
n Outward unit vector to a boundary
Qj, Time-series of calculated and measured discharges at weir j
R, Z Time-series of numerically obtained data and measurements at a monitoring point
SsSpecific storage
t Time
v Darcy velocity
w Weight coefficient
z Vertical coordinate
Γf,ΓsFree surface and potential seepage boundary
Γq,ΓφFlux boundary and water head boundary
α,β Fitting coefficients
φ Total water head
μ Specific yield
ν Anisotropy ratio,ν = K⊥/K//
 Journal of Rock Mechanics and Geotechnical Engineering2021年2期
- Journal of Rock Mechanics and Geotechnical Engineering的其它文章
- Case study of a driven pile foundation in diatomaceous soil.I: Site characterization and engineering properties
- Particle breakage of sand subjected to friction and collision in drum tests
- Permeability and setting time of bio-mediated soil under various medium concentrations
- Novel experimental techniques to assess the time-dependent deformations of geosynthetics under soil confinement
- Physics-informed deep learning for one-dimensional consolidation
- Numerical modeling for rockbursts: A state-of-the-art review
