Permeability and setting time of bio-mediated soil under various medium concentrations
Treesukon Treebupchtskul, Viroon Kmchoom
a Department of Biomedical Engineering, Faculty of Engineering, King Mongkut’s Institute of Technology Ladkrabang, Ladkrabang, Bangkok,10520, Thailand
b Excellent Centre for Green and Sustainable Infrastructure, Department of Civil Engineering, Faculty of Engineering, King Mongkut’s Institute of Technology Ladkrabang, Ladkrabang, Bangkok,10520, Thailand
Keywords:Bio-clogging Bio-mediated soil Medium concentration Leuconostoc mesenteroides Permeability Setting time
ABSTRACT The bio-clogging using bacteria can be an eco-friendly and sustainable alternative to conventional grouting methods for seepage control.However,it remains unclear to date how the dilute concentration of bacterium and medium during field installation can affect the setting time of bacterium and its correlation with permeability reduction.In this study, the setting time of bacterium and its effectiveness in permeability reduction were addressed through experimental and theoretical investigations.A series of sand column was cultivated using different concentrations of Leuconostoc mesenteroides and culture medium.The distribution and composition of the bacterial product (i.e.dextran) were observed by refractometer,scanning electron microscope(SEM),and energy dispersive X-ray spectroscopy(EDS).Soil permeability was recorded using a constant head test.The results revealed that bacterium was effective to produce dextran at the setting time of about 5 d after installation.This dextran can reduce the permeability of bio-mediated soil by two orders of magnitude, even without culture medium supply.In general, the dextran production decreased proportionally with increase of bacterium and medium concentration.However,at 50%bacterium and medium concentration by weight,it still has a significant influence on permeability reduction with similar setting time, compared to 100% concentration.
1.Introduction
Permeability reduction is crucial for many geotechnical constructions,especially those built upon permeable sand layers.It can be beneficial to prevent the contaminant transport and seepage under reservoir and during underground excavation.During the last decade, there has been an increasing interest about environmentally-friendly and sustainable ground improvement using bio-materials, such as vegetation (Umar et al., 2016; Bella et al., 2017; Leung et al., 2017; Kamchoom and Leung, 2018) and microorganisms (Al Qabany et al., 2012; Ayeldeen et al., 2017; Lim et al., 2020).More well-known soil modification is the bacteriuminduced calcite precipitation (MICP) (Whiffin et al., 2007;Jongvivatsakul et al., 2019).The MICP is the ground improvement technique by the injection of ureolytic bacterium, together with urea- and calcium-rich solutions.The in situ calcite precipitation leads to aggregate bonding, significant increase of soil shear strength, and reduction of permeability (Kantzas et al., 1992).However,cracks in calcite can be expected in case of substantial soil movement which would minimise its beneficial effects for permeability reduction.
In this study, an attempt is made to explore an alternative and more sustainable approach for soil permeability reduction.Literature review shows some bacteria can create a colonisation of biofilm structure.The biofilm refers to as bacterium cells and its aggregation, i.e.extracellular polymeric substance (EPS).These EPSs can promote the adherence of bacterium to the surface (i.e.hereby soil grains).The division of bacterium cells also progressively secretes its extracellular matrix, resulting in further biofilm accumulation.The biofilm associated with EPS can clog the pore medium, and thus reduce water permeability (Taylor et al.,1990;Rockhold et al., 2002).The EPS is highly viscous and slime-like substance (Harutoshi, 2013) that might tolerate strains under ductility without cracking.The use of these bacteria can be alternative to conventional ground improvement techniques, e.g.pretreatment of sand before excavation, chemical grouting, andslurry trench.However, the extent and duration of bacterial colonisation highly depend on the environment, i.e.temperature and nutrient concentration(Mataragas et al.,2003).Thus,upscaling this method for large-scale applications is a great challenge, as the bacteria culture and medium solution can be diluted by groundwater.It is necessary to understand the duration and extent of bacterial colonisation in soil medium in order to estimate the setting time of the bacterium and the amount of permeability reduction in bio-mediated soil.This research investigated the bioclogging process by admixing different bacterium and medium concentrations in coarse-grained soil.A predictive model considering the change of soil porosity due to the bio-clogging process was also presented for further interpretation of the experiments.
2.Bacteria and growth conditions
This study adopted Leuconostoc mesenteroides TISTR 473 that is commercially available in Thailand.This genus is widespread in the environment, and has been isolated from plant matter, human clinical sources and food.The bacterium produces environmentallyfriendly exopolysaccharides,i.e.dextran,as bio-clogging agent under excessive carbohydrates (Wingender et al., 1999).Therefore, such food-processing wastes(e.g.molasses)can also be used for dextran production.The bacteria can survive under a wide range of temperatures((10-37)°C),depending on their species(Hamasaki et al.,2003;Mataragas et al.,2003).Therefore,it can be used as a potential soil modification alternative in tropical countries.Although this study focused on the use of the bacterial dextran in Ottawa sand,the bacterium was also found in different coarse-grained soil,including Covelo, Delta and Teichert sands (Greer, 2018), and crop soil (Chen et al., 2005).Some clay minerals and metal oxides can affect its biofilm generation(Ma et al.,2017),but it is beyond the scope of this study.The sucrose-rich medium was selected to support the growth of the bacterium(Soetaert et al.,1995;Surasani et al.,2013).To assist the growth of this bacterium,tryptone and yeast extracts were used as amino acid and vitamin sources, respectively.To prepare the bacteria solution, L.mesenteroides was transferred from solid medium (see Fig.1a) and aerobically cultivated in liquid medium containing 10%of sucrose,1%of tryptone,and 0.5%of yeast extract.The liquid medium was stored in an Erlenmeyer flask and shaken well at 30°C and 150 revolutions per minute(RPM)using an incubator(see Fig.1b).

Fig.2.Variation of rate of light absorbance(ABS)between strains MCRI1 and TISTR473 during cultivation (Hamasaki et al., 2003).
The growth curve of this bacterium was obtained using turbidimetric determination (Dalgaard et al., 1994).The bacteria were sampled at different time intervals (see Fig.1c).This method adopted a spectrophotometer to transmit the light and observe the rate of light absorbance(ABS)over time.More amounts of bacteria can increase ABS as the bacterium cells prevent transmission of light through the sample.Fig.2 provides a comparison of different bacteria growth curves of ABS over cultivation time between L.mesenteroides MCRI1 in Hamasaki et al.(2003) and TISTR473 in this study.It should be noted that the growth of TISTR473 was expected to be lower than that of MCRI1.To amplify the growth curve,the optical density(OD)for determining bacterial culture in this study was set at a wavelength of 600 nm.The result showed a consistent trend of growth curves.During the first 4 h, a lag of growth rate was observed in both MCRI1 and TISTR473.This phase confirmed that newly cultured bacteria needed time to adjust themselves to the medium(Rolfe et al.,2012).Later,the growth has entered an exponential phase when the cells begin to grow and differentiate.The duration of this phase depends on its metabolic process that is influenced by the temperature and properties of the medium (Mataragas et al., 2003).Therefore, the MCRI1 bacterium cultivated at the optimal temperature (i.e.30°C) (Hamasaki et al.,2003) provides a higher growth rate than that at a higher temperature (i.e.37°C).Similarly, TISTR473 was cultivated at 30°C to provide a maximum growth rate as possible.A stationary phase was reached after 24 h of cultivation as growth rate was slowly increased but with a decreasing trend for both MCRI1 and TISTR473.This suggested a standard growth curve within a cultivation time of 24 h.The bacteria were then transferred and installed to each soil sample after 24 h of cultivation in liquid medium.
3.Experimental setup
3.1.Test plan
A series of laboratory tests was carried out to investigate the influences of bacterium and culture medium on setting time andsoil permeability reduction.Table 1 summarises all the test series carried out in this study.The aim of the first test series(denoted as Test BC100) is to investigate the soil permeability reduction after injection of 10 mL of bacteria solution.This amount is approximately 0.7%of total soil weight and it is much less than 5%-10%of cement and bentonite applied in conventional methods, such as grouting and slurry trench(Kenney et al.,1992;ACI Committee 230,2009).To consider natural variations, six samples were prepared including one benchmark and five replicates.The second and third test series (denoted as Test BC10 and BC50, respectively) were tested under different culture medium concentrations.This is to simulate field-scale condition where the bacterium and culture medium can be diluted by groundwater.The concentration of culture medium was diluted by deionised water to 10%(i.e.Test BC10)and 50% (i.e.Test BC50) of that used in Test BC100.Each of them also had one benchmark and two replicates to consider natural variations.

Fig.1.Process for (a) transferring bacteria, (b) bacteria cultivation, and (c) bacteria sampling.
To observe bacterial colonisation, Tests BC100, BC50 and BC10 were duplicated as that of Tests BC100c, BC50c and BC10c.All of them consist of identical setup and test conditions, but they were only used to observe dextran concentration and bacterial colonisation.As culture medium contains component of water-soluble sucrose, it would make the fluid more viscous and probably contribute to some temporary reduction of soil permeability.Therefore,the last test series(denoted as Test C100)was separately prepared with only culture medium (i.e.no bacteria) to differentiate the effect of culture medium on the soil permeability reduction.
3.2.Test preparation
Fig.3a shows the schematic of a typical test setup and bacteria installation.All sample containers were made of polyvinyl chloride(PVC) with 15 cm of height and 10 cm of diameter.The bottom of each container was sealed by a PVC cap while a hole with 1 cm of diameter was drilled for drainage purpose.Before compaction, a 2 cm of filter layer(see Fig.3a)composed of graded pea gravels was installed to minimise loss of small particles in the sample.Three additional outlets were made at different heights of each soil container for Tests BC100c, BC50c and BC10c.These allowed sampling of soil and investigation of bacterial colonisation for the entire duration of test.The soil material used in this study was Ottawa sand and classified as uniform and standard clean sand (SP, according to ASTM D2487-17,2017).The basic properties of this sand are summarised in Table 2.The sand was oven-dried at 80°C for at least 24 h to minimise other living microorganisms.Then,the sand at the gravimetric water content of 14% was compacted to a dry density of(1560±10)kg/m3in five layers using undercompaction method (Ladd,1978).This is equal to 88% ± 1% degree of compaction(DOC).After compaction,each sample was fully saturated with deionised water and tested by constant head permeability test.According to the growth rate observed in Fig.2,the cultivation was found to be influenced by the temperature during the exponential phase.All samples were stored in the water bath to minimise extreme fluctuation of ambient temperature.The water bath temperature for the entire test duration was (29 ± 3)°C (see Fig.3b).This range of temperature covers the soil temperature fluctuation(i.e.(27-33)°C)(Tuntiwaranuruk et al.,2018)in tropical countries,such as Thailand.
3.3.Observation of bacterial colonisation
Fig.4 shows the flowchart to observe dextran concentration and calculate saturated permeability of all samples.Soil (mass of 5 g)was sampled through the top, middle, and bottom outlets of each container (see Fig.3a).The soil was oven-dried so that the initial water volume can be measured.After that,the dextran produced by bacterial colonisation was separated by water solution and centrifuge techniques.The amount of dextran was determined by a refractometer (PAL-12S; ATAGO Co., Ltd., Japan) that has a measurement rage of 0-15 g with an accuracy of ±0.2 g.The dextran concentration is the ratio of dextran mass to water volume.In addition to dextran concentration measurement, the existence of bacteria in soil was also confirmed using a scanning electron microscope(SEM)and an energy dispersive X-ray spectroscopy(EDS).The SEM enabled qualitative observations of soil microstructure and morphology of bacteria colonies distributed in the container.The EDS also provided chemical composition analysis of biomediated soil compared to that of bare soil.
3.4.Test procedure
At the beginning of the test, the bacteria solution previously cultivated in liquid medium was diluted to the target concentration for each test.Bacteria solution(volume of 10 mL)was then injected from the soil surface into the middle of each saturated sample using a syringe.The total injection time was about 5 min to avoid any excess pore pressure in the sample.For Test BC100,a two-stage test was conducted.During the first stage,the medium was supplied on the 3rd and 7th day each week for 17 d.Then all samples were left without culture medium for another 14 d at the second stage.These two stages allowed the investigation of bio-clogging during early cultivation and temporal shortage of culture medium.To supply culture medium, liquid medium (volume of 320 mL) was precipitated to the surface and flushed throughout the sample by gravity.However,for Tests BC10,BC50 and C100,only the cultivation period(i.e.the first 17 d) was monitored.To investigate soil permeability changes after elimination of bacteria,Test BC100 was oven-dried at 80°C for 24 h and re-compacted to the container once again after the two-stage test.The permeability of bio-mediated soil wasevaluated using the constant head permeability test before culture medium was supplied.The measurement of dextran concentration was performed on Tests BC100c, BC50c and BC10c for every two days.Small fractions of each sample were also scanned using SEM to qualitatively observe bacterial colonisation at the end of culture medium supply.

Table 1A summary of experiments.
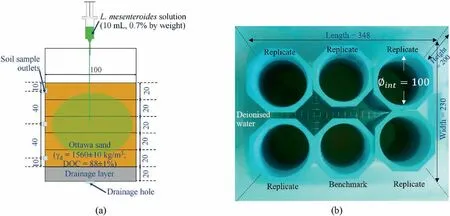
Fig.3.Overview of (a) a typical container and (b) water bath storage for Test BC100 (all dimensions are in mm).

Table 2Summary of Ottawa sand properties.
4.Predictive methods for bio-clogging in coarse-grained soil
The Kozeny-Carman equation is one of the existing well-known models that can be used to estimate the permeability.The equation is based on the relationship between permeability and porosity of porous media that consist of uniform pore size.Despite its assumptions of shape and tortuosity of channels in the soils, the Kozeny-Carman equation can provide a reasonable prediction for permeability of coarse-grained soils (Carrier, 2003; Chapuis and Aubertin, 2003).In the present study, the reliability of the Kozeny-Carman equation for determination of the saturated permeability of bio-mediated soil was evaluated by the amount of bacterial dextran.The soil porosity of bio-mediated soil is presented as

where εbrepresents the soil porosity of bio-mediated soil,εsis the initial soil porosity,Mdis the total dextran mass(i.e.percentage of dextran mass from refractometer multiplied by total soil mass)(g),Ddis the concentration of dextran solution(g/mL),A represents the cross-sectional area of the sample (m2), and h is the sample depth(m).The decrease of soil permeability due to bio-clogging can thus be presented by the Kozeny-Carman equation as

where kbrepresents the saturated permeability of bio-mediated soil (m/s), g is the gravitational acceleration (9.81 m/s2), v is the fluid viscosity (m2/s),d50is the mean grain diameter(0.2 mm,see Table 2), and α is the shape coefficient (10 for Ottawa sand with d50=0.2 mm)(Kovacs,1981;Blazejewski and Murat-Blazejewska,1997).Any changes of the fluid viscosity in Eq.(2) due to dextran solution were also adjusted according to Mach and Lacko(1968).
5.Setting time and dextran production
Fig.5a shows the comparisons of average dextran percentage by mass observed at the top, middle, and bottom outlets from Test BC100c.It can be seen from Fig.5 that there was a lag of dextran production, indicating the setting time of bacteria during the first 5 d.This suggested that the bacteria cultured in the soil was not immediately effective and required several days to adapt to the soil environment.After 5 d, the measured dextran concentration increased to 15%-20%.This incremental phase lasted for almost 10 d before approaching the plateau value.As this phase depends on the metabolic process of bacterium, the production rate may vary under different environments (e.g.temperature, pH, and soil density).Without culture medium supply, the dextran seemed to be fluctuated,but still remained higher than 15%for another couple of weeks.Based on the result, the dextran was found to slightly decrease by 10% after recompaction.It is noticed that the results after recompaction were presented as average dextran from the top, middle, and bottom outlets of each container.
Fig.5b shows the variation of dextran produced by diluted bacterium and medium concentration at the middle outlet of each container.Noted that Tests BC50c and BC10c were carried out only during culture medium supply and thus no measurement was conducted after 16 d.During the first 5 d,the dextran concentration from diluted samples fluctuated within the measurement accuracy(i.e.±1%).However, after 5 d of cultivation, the measured dextran concentration entered the incremental phase and increased in a similar manner.This suggested that the setting time of the bacteria remained almost the same even with diluted concentration.At the 16th day, the dextran measured from Test BC100c was about 17%.With diluted samples,the dextran was dropped to about 9%and 3%for Tests BC50c and BC10c, respectively.This suggested that bacterium and medium concentrations play an important role in the amount of dextran production.
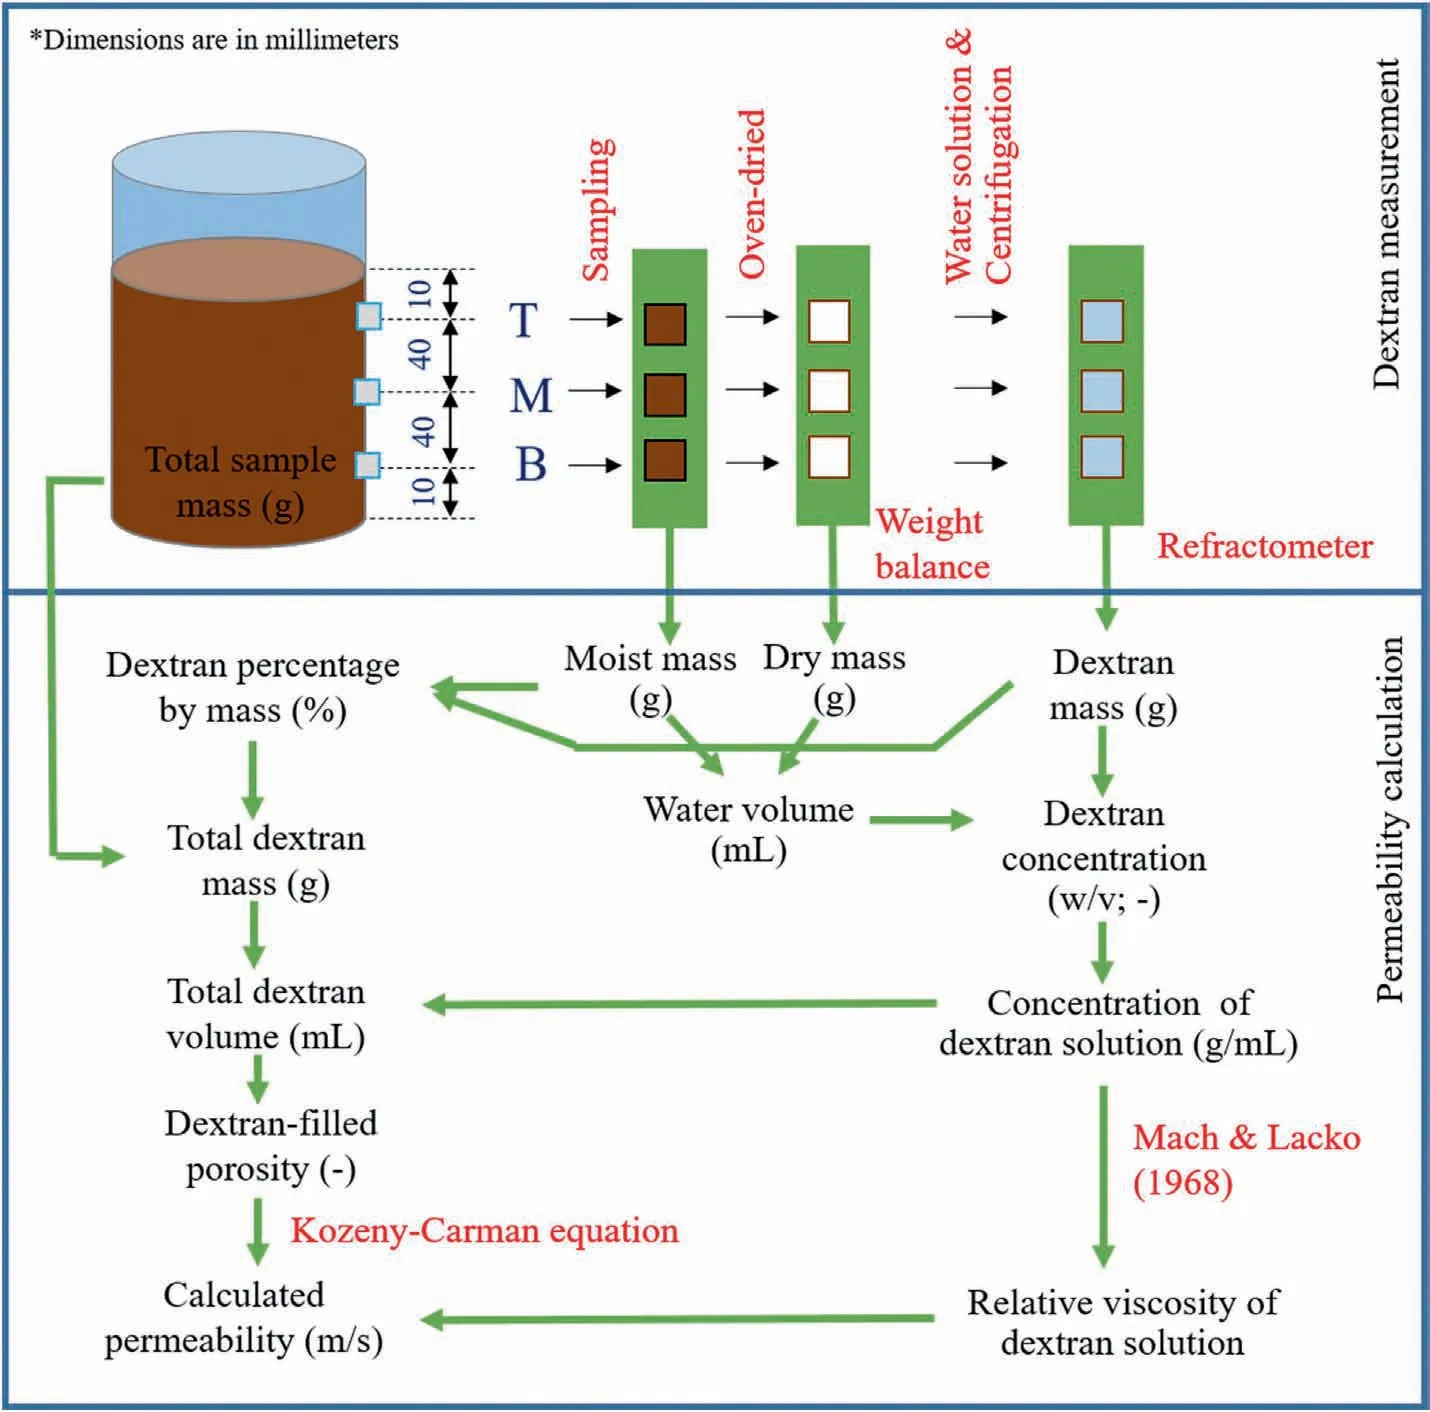
Fig.4.Flowchart for dextran measurement and permeability calculation (Mach and Lacko,1968).
The dextran production near the surface (see Fig.5a) was slightly less than that in the middle and bottom of soil samples.This may be due to the reduction of dextran production in the top.To confirm this, Fig.6a and b illustrates SEM micrographs of Test BC100c from the top and middle of the container,respectively.The images confirmed a visible structure of bacterial colonisation (i.e.dextran)for both locations.The dextran was observed as a film that covered certain areas of soil pore spaces and soil grains.With an enhanced resolution,the morphology of L.mesenteroides was found to be cocci lenticular shape (see Fig.6c).Most of bacteria were grown in single and isolated cells underneath the dextran film.This is similar to the observation of McCleskey et al.(1947) and Dimic(2006).Interestingly, Fig.6a also shows random white spots which are foreign colonies distributed on the film and throughout the soil grains.The magnification of this microorganism in Fig.6d was found to be quite similar with that of a fungal spore,Aspergillus niger (Priyamvada et al., 2017).These foreign microorganisms required oxygen during cultivation and thus were observed to be much less in the middle of the sample container(i.e.Fig.6b).As the foreign microorganism can compete for nutrients and other resources,the dextran production became less effective at shallower depth compared with that at a deeper depth.
Fig.7 compares the microstructures of bare soil and biomediated soils with diluted bacterium and medium concentrations from the middle of each container.From Fig.7a, the dextran films were observed in the 50% diluted sample (i.e.Test BC50c)between the soil grains, similar to the case of Test BC100c.The dextran was able to cover the macropores (i.e.>75 μm).For 10%diluted sample, the dextran films were randomly distributed between the soil grains, but limited to micropores (i.e.<30 μm).No dextran was observed for bare soil as depicted in Fig.7c.To provide a comparison between bio-mediated and bare soils, chemical component analysis using EDS was conducted.There is an increase in carbon component for bio-mediated soil compared to that for bare soil.For bare soil,the chemical components mainly are 19.21%of carbon,48.81%of oxygen,30.9%of silica,and 1.08%of others.On the other hand,45.68%of carbon,37.78%of oxygen,15.36%of silica,and 1.18%of others were found in the sample with 100%bacterium and medium concentration.With the results from refractometer and EDS, it can be deduced that the additional carbon component(i.e.around 25%from EDS)might mainly contribute to the increase in dextran (i.e.about 20% in Fig.5a).
6.Performance of bacteria on permeability reduction
Fig.8 shows the variations in measured and calculated permeability of bio-mediated soils from Tests BC100 and BC100c,respectively.For the bare soil prior to bacteria installation, the measured permeability of compacted sand was found to be about 10-4m/s.After 10 d of bacteria installation, the measured permeability dropped to about 5 × 10⁻⁶m/s in Test BC100.The result suggested a large variation (i.e.about an order of magnitude) in permeability for each sample.The drop of permeability was similar to that reported in the literature.The permeability reduced by 2-4 orders of magnitude after bacteria installation in coarse-grained soils (Dashko and Shidlovskaya, 2016; Greer, 2018).Compared to the measurement of dextran in Fig.5a, the amount of dextran inTest BC100c also entered the exponential phase from the 5th day to 15th day after cultivation.With further supply of culture medium,the permeability dropped to about 5×10⁻⁷m/s and became stable after 14 d of bacteria cultivation.This again shows an agreement with the change of dextran illustrated in Fig.5a.There is also a slight increase in permeability from the 14th day to 17th day.In fact,an increase in permeability might also be related to dextran production.In Fig.5a,dextran at the bottom of Test BC100 also reduced during the same period.However, this fluctuation was minimal compared to that of permeability reduction during the first 10 d.The results confirmed that the permeability reduction was influenced by dextran from bacteria cultivation.In addition, the calculated values of saturated permeability using the Kozeny-Carman equation are consistent with the measured data in Fig.5a.Therefore,the bio-clogging process due to bacterial dextran could be well predicted by the adopted model.It should be noted that the permeability variation from calculation is less than that from measurement.This may be due to the assumptions of the Kozeny-Carman equation,whereas the real clogging mechanism in the soil is more complicated with variations of pore size, shape, and tortuosity of flow channels.

Fig.5.Variation of dextran percentage with time at (a) different outlets of container, and (b) different concentrations.
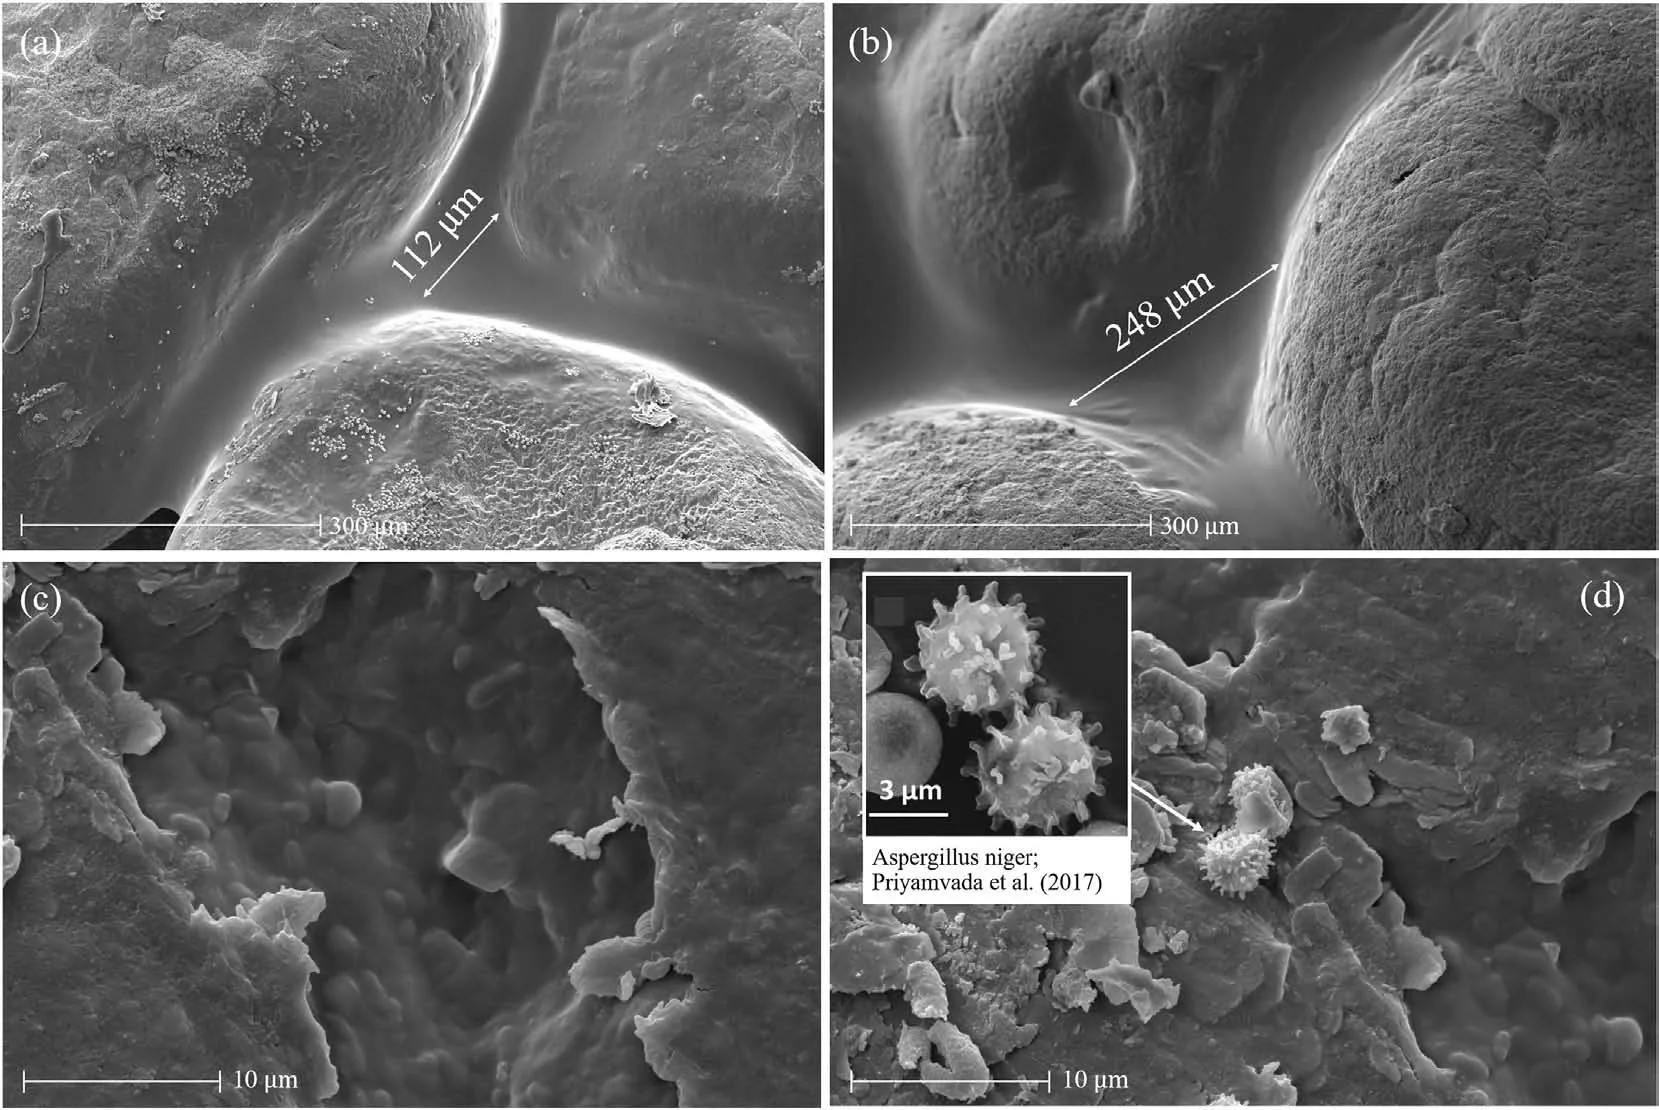
Fig.6.SEM micrographs of Test BC100c at magnification of ×500 from (a) the top and (b) middle of the container, and at magnification of ×10,000 at (c) dextran films and (d)foreign colonies (Priyamvada et al., 2017).
Fig.8 also shows that without culture medium supply, the measured permeability still remains at 10-7-10-6m/s.The variation in measured permeability among each sample became relatively less compared to that during the period of culture medium supply.It can be seen that an increase in dextran during culture medium supply (see Fig.5a) can cause a reduction in saturated permeability with relatively large variation among each sample.However, without further increase of dextran in the absence of culture medium (see Fig.5a), the reduction of measured permeability became more stable, with less variation.The calculated results also showed less fluctuation in permeability during this phase.Next, the soil was oven-dried and recompacted into the same container.After elimination of the bacteria, the measured permeability of the recompacted sample was close to 10-6m/s.The reduction of permeability to this magnitude is comparable to thatof cement or bentonite grouting (ACI Committee 230, 2009; Fan et al., 2018).However, using those artificial materials (i.e.cement or bentonite)can cause toxicity and a high level of alkaline(i.e.pH value =13 for cement material)to groundwater and underground environment.Thus, these bacteria are potential to be used as an eco-friendly and sustainable method for permeability reduction.
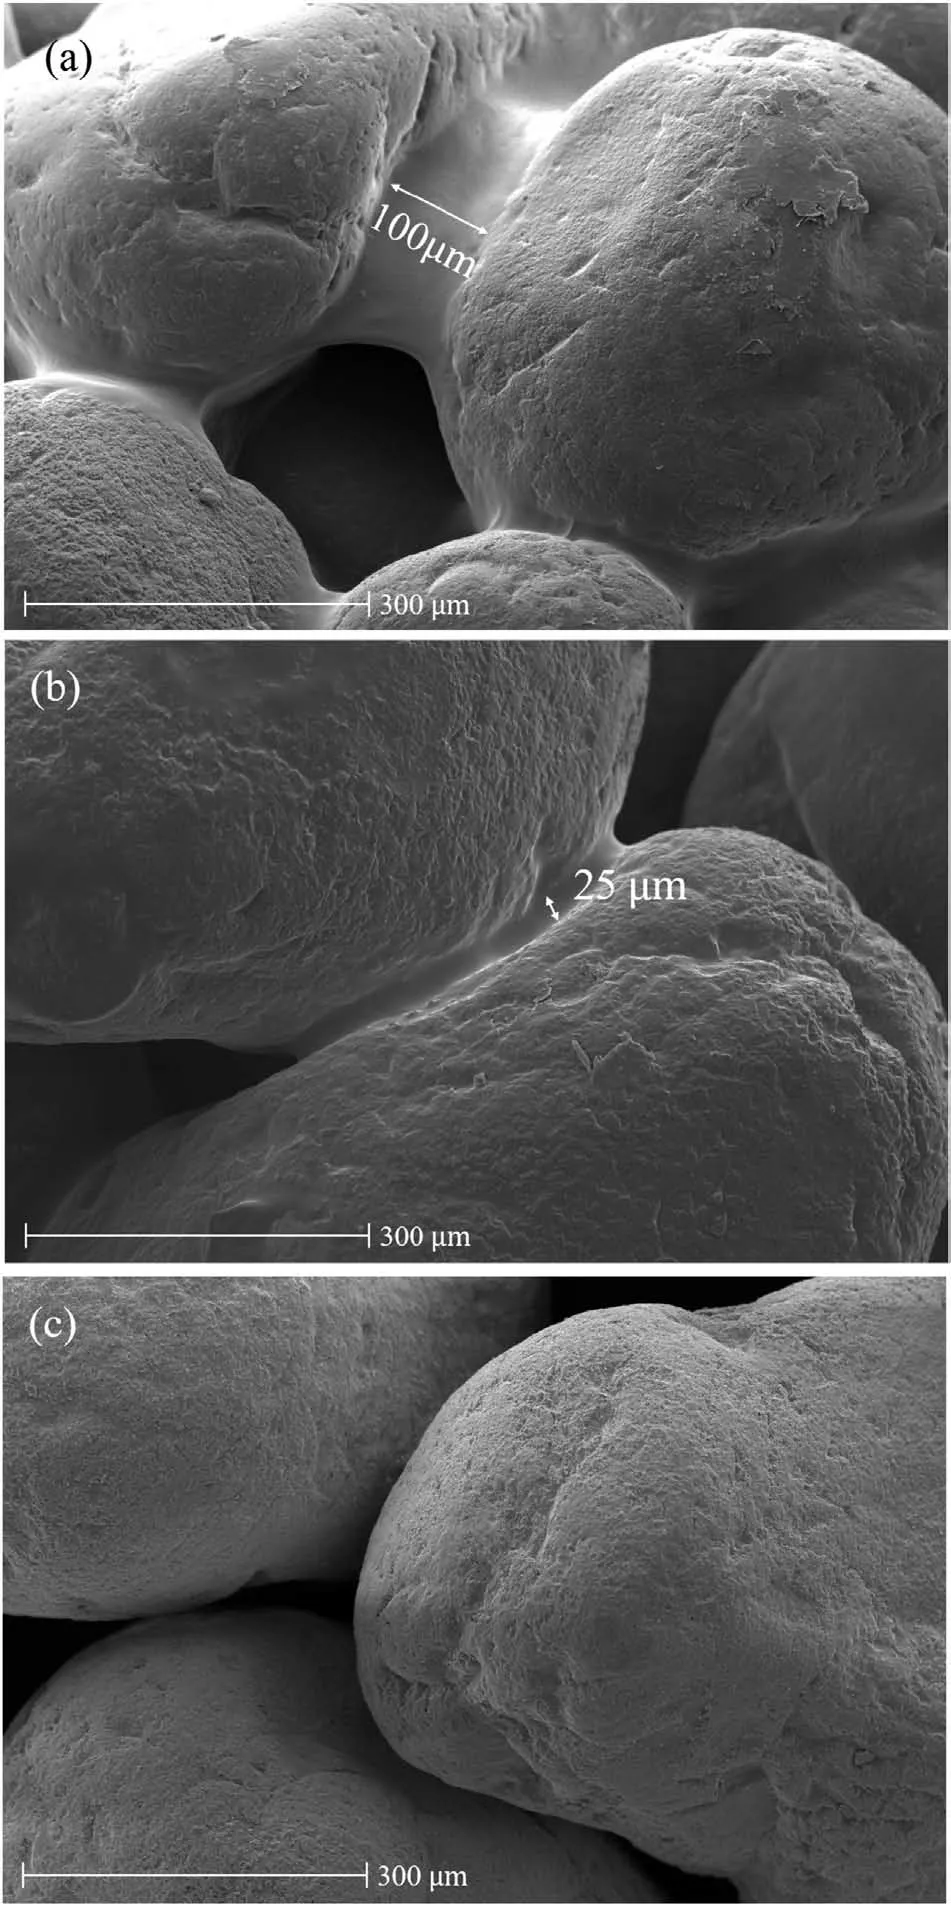
Fig.7.SEM micrographs at magnification of×500 from bio-mediated soil with(a)50%and (b) 10% bacterium and medium concentration, and (c) bare soil.
7.Effects of bacterium and medium concentration on soil permeability
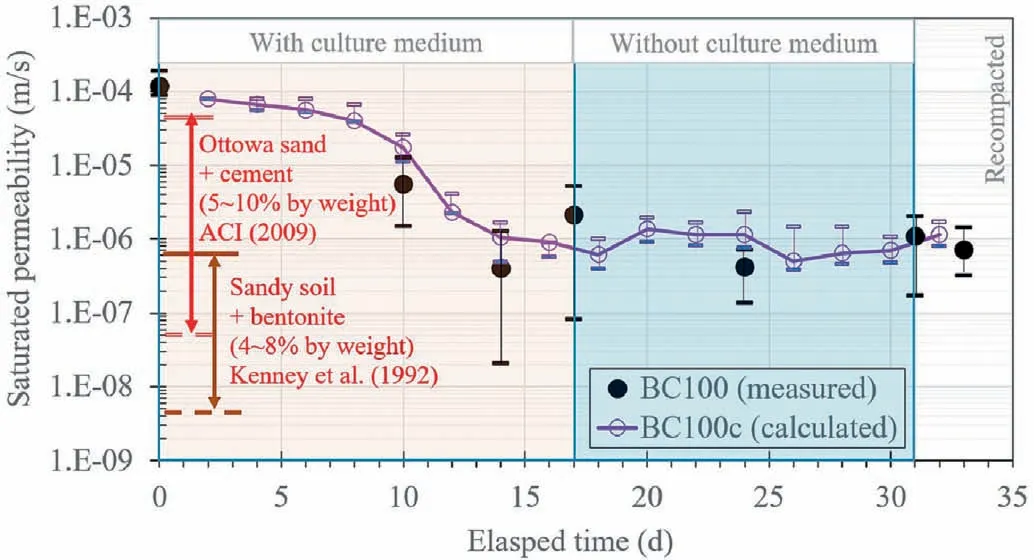
Fig.8.Variations of measured and calculated permeability of bio-mediated soil with time (ACI Committee 230, 2009; Kenney et al.,1992).
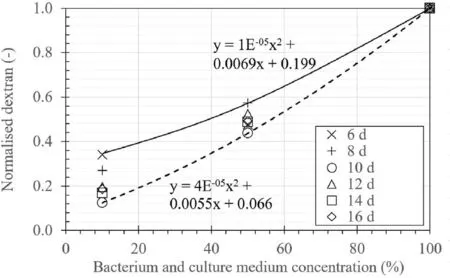
Fig.9.The relationship between normalised dextran and medium concentration.
Fig.9 presents the normalised dextran amount by weight from 10% to 50% diluted samples (i.e.Tests BC10c and BC50c, respectively).The results of the first 5 d of cultivation were not shown in the graph since the dextran production was minimal and beyond the measurement accuracy (i.e.±1%).The result suggested the dextran production decreased with the reduction of bacterium and culture medium concentration.For example, the dextran production in Test BC50c was 44%-56% compared to 100% of dextran production in Test BC100c.The amount of dextran production would then affect the performance of permeability reduction.Therefore,it is essential to consider the concentration of bacterium and culture medium diluted by groundwater in field application.Fig.9 also shows that the proportion between dextran and bacterium and culture medium concentration was bounded within a limited range and thus dextran production can be roughly estimated when diluted concentration is known.
Fig.10a shows the variations of measured permeability at different bacterium and culture medium concentrations.Although the change in fluid viscosity due to culture medium can affect permeability, the effect is limited.The permeability only slightly reduced with pure culture medium (i.e.Test C100).The permeability in Test C100 reduced to 6 × 10⁻⁵m/s, while it dropped to about 10-6m/s in Test BC100.Furthermore, when the concentration was diluted to 50% in Test BC50, the measured permeability seems to be similar with that from Test BC100 with 100% concentration.Although the amount of dextran in Test BC50 is reduced by half, the dextran can still accumulate in both macro- and micrometric pore scales (see Fig.7a).These dextran-accumulated pores then become less permeable.The resistance for water flow become higher and there are less permeable zones in this bio-mediated soil than that in the bare soil.The concentration seems to have little influence on the setting time as the decreases in permeability at concentration of 100% and 50% are similar.At a very low concentration of bacterium and culture medium,the dextran accumulated at micro-pore was ineffective to reduce permeability.The measured permeability was about 10-4m/s without noticeable reduction.The calculated permeability in Fig.10b provided a well prediction forTests BC100 and BC10.However,when concentration was reduced to 50%, heterogeneity of dextran accumulation was observed (see Fig.7a).The calculation should also integrate the case of pore heterogeneity in order to give a better prediction of the permeability reduction.

Fig.10.Variations of (a) measured and (b) calculated permeability at different bacterium and culture medium concentrations.
8.Conclusions
This study explored the effects of bacterium and culture medium concentration on soil permeability and setting time using laboratory experiments.The bacterium, namely L.mesenteroides TISTR473, was used in this study.The observed growth rate suggested that the bacterium can be cultivated in a medium at temperature of 30°C for 24 h before installation to the soil.A series of laboratory tests was then carried out to verify its effect on soil permeability reduction.Ottawa sand was compacted and saturated in sample containers.Bacteria solution with different concentrations was then injected into each sample using a syringe.The presence of dextran produced by bacteria was measured by a refractometer and observed through SEM and EDS.Reductions in permeability of bare and bio-mediated soils were observed by the constant head permeability test.The empirical prediction of permeability was conducted using the Kozeny-Carman equation.
The results showed that dextran produced by the bacteria can influence the reduction of saturated permeability.The dextran concentration increased to 20%,while the permeability reduced to approximately 5 × 10⁻⁷m/s after 5 d of bacteria installation.Without culture medium supply, the dextran concentration remained slightly above 15% for a couple of weeks, whereas the measured permeability fluctuated at 10-6-10-7m/s.A good agreement was also reported between the measurements and calculations from the Kozeny-Carman equation.Although the measured dextran decreased with the reduction in bacterium and culture medium concentration, the dextran can accumulate at macro- and micro-pores and remains effective to reduce soil permeability even with 50% of bacterium and medium concentration.
Declaration of competing interest
The authors declare that they have no known competing financial interests or personal relationships that could have appeared to influence the work reported in this paper.
Acknowledgments
This work is supported by King Mongkut’s Institute of Technology Ladkrabang (Grant No.2563-02-01-014).Authors would like to thank Ms.Kotchakorn Wattanameekaew,Wunnisa Tapunya,Sudarat Suriya and Mr.Chanakan Sookkrajang for their assistance in the experiment.
 Journal of Rock Mechanics and Geotechnical Engineering2021年2期
- Journal of Rock Mechanics and Geotechnical Engineering的其它文章
- Case study of a driven pile foundation in diatomaceous soil.I: Site characterization and engineering properties
- On the measurements of individual particle properties via compression and crushing
- Particle breakage of sand subjected to friction and collision in drum tests
- Novel experimental techniques to assess the time-dependent deformations of geosynthetics under soil confinement
- Physics-informed deep learning for one-dimensional consolidation
- Numerical modeling for rockbursts: A state-of-the-art review
