Particle breakage of sand subjected to friction and collision in drum tests
Fnwei Yu,Chonlei Zhn,Qijun Xie,Lijun Su,c,e,*,To Zho,f,M.Qsim Jn
a Key Laboratory of Mountain Hazards and Earth Surface Process of CAS,Institute of Mountain Hazards and Environment,Chinese Academy of Sciences,Chengdu,610041, China
b Center for Excellence in Tibetan Plateau Earth Sciences, Chinese Academy of Sciences, Beijing,100101, China
c China-Pakistan Joint Research Center on Earth Sciences, CAS-HEC, Islamabad, 45320, Pakistan
d Department of Civil Engineering, The University of Tokyo, Tokyo,113-8656, Japan
e University of Chinese Academy of Sciences, Beijing,100049, China
f Department of Civil and Environmental Engineering, Brunel University London, London, UB8 3PH, UK
g National Centre of Excellence in Geology, University of Peshawar, Peshawar, 25130, Pakistan
Keywords:Grain size distribution Drum tests Granular flow Particle breakage
ABSTRACT This paper presents a laboratory experimental study on particle breakage of sand subjected to friction and collision, by a number of drum tests on granular materials (silica sand No.3 and ceramic balls) to investigate the characteristics of particle breakage and its effect on the characteristics of grain size distribution of sand.Particle breakage increased in up convexity with increasing duration of drum tests,but increased linearly with increasing number of balls.Particle breakage showed an increase,followed by a decrease while increasing the amount of sand.There may be existence of a characteristic amount of sand causing a maximum particle breakage.Friction tests caused much less particle breakage than collision tests did.Friction and collision resulted in different mechanisms of particle breakage,mainly by abrasion for friction and by splitting for collision.The fines content increased with increasing relative breakage.Particle breakage in the friction tests (abrasion) resulted in a sharper increase but with a smaller total amount of fines content in comparison with that in the collision tests (splitting).For the collision tests, the fines content showed a decrease followed by an increase as the amount of sand increased,whereas it increased in up convexity with increasing number of balls.The characteristic grain sizes D10 and D30 decreased in down convexity with increasing relative breakage, which could be described by a natural exponential function.However, the characteristic grain sizes D50 and D60 decreased linearly while increasing the relative breakage.In addition, the coefficients of uniformity and curvature of sand showed an increase followed by a decrease while increasing the relative breakage.
1.Introduction
Granular flow is widely distributed as a common phenomenon in nature, e.g.landsides, debris flow, rock avalanche, and sand movement.The friction and collision of granular materials would be of co-existence in granular flow to exert their own contribution on the flow behavior of granular materials (e.g.Strom, 2004;Boultbee et al.,2006;Crosta et al.,2009;Zhou and Ng,2010;Zhou and Sun, 2013; Gray, 2018).The characteristics and mechanism of granular flow have been investigated comprehensively, e.g.using physical model tests (e.g.Choi et al., 2017; Gray, 2018; Ng et al.,2018), numerical tests (e.g.Crosta et al., 2009; Zhou and Ng,2010; Zhou and Sun, 2013; Gray, 2018; Jiang et al., 2018), fundamental theories(e.g.Davies,1982;Thornton,1997;Campbell,2006;Gray, 2018), and case studies (e.g.Strom, 2004; Boultbee et al.,2006).
In granular flow down a slope, the gravity-induced energy of granular materials would be transformed into the kinetic energy by the typical representation of continuous friction and collision among granular particles and boundary, in the process of which granular particles would be subjected to compression and shearing that cause the deformation and breakage of granular particles(e.g.Langroudi et al., 2010; Federico and Cesali, 2019; Zuo et al., 2019;Buettner et al.,2020).As a consequence,the friction and collision of granular materials during granular flow result in common breakageof particles (e.g.Wang et al., 2002; Okada et al., 2004; Igwe et al.,2007; Sadrekarimi and Olson, 2010; Zuo et al., 2019).The resultant changes in the grain size and microstructure of granular material induced by particle breakage would exert a great effect on the mechanical behavior of granular material (e.g.Hardin,1985; Lade et al., 1996; Kikumoto et al., 2010; Sadrekarimi and Olson, 2010;Carrera et al., 2011; Xiao et al., 2016, 2017; Yu, 2017a, b, 2018a, b,2019), affecting the mobility and mechanism of granular flow significantly.
Particle breakage in granular soils has been extensively investigated, e.g.using Brazilian tests (e.g.Mao and Towhata, 2015;Wang and Coop, 2016), one-dimensional tests (e.g.Takei et al.,2001; Zhang and Baudet, 2013), ring shear tests (e.g.Igwe et al.,2007; Sadrekarimi and Olson, 2010), and triaxial tests (e.g.Donohue et al., 2009; Bandini and Coop, 2011; Sadrekarimi and Olson, 2011; Ghafghazi et al., 2014; Yu, 2017a, b, 2018a, b, 2019).In fact, drum tests are widely employed for processing granular materials in a rotary cylindrical drum in simulating the process of granular flow for interpreting the behavior and mechanism of granular flow (e.g.Schneider et al., 2011; Delele et al., 2016;Brandao et al., 2020; Buettner et al., 2020; Rong et al., 2020).However,a question arises as to how much of particle breakage of granular materials is caused by the friction and collision in granular flow,which is rarely reported yet.As a result,it would be worthy of clarifying the characteristics of particle breakage of granular materials in granular flow as a significant and valuable complement for the past studies.
The main purpose of this study is to investigate the particle breakage of sand subjected to friction and collision,by a number of drum tests on granular materials (silica sand No.3 and ceramic balls) to interpret the characteristics of particle breakage and its effect on the characteristics of grain size distribution of sand, i.e.fines content, characteristic grain sizes, and the coefficients of uniformity and curvature.
2.Material and methods
In this study, silica sand No.3 was tested in a number of drum tests with more crushability in characteristics of larger size, more irregularity and more angularity in comparison with silica sand No.5 used in the past studies(e.g.Yu,2017a,b,2018a).Fig.1 shows the grain size distribution of silica sand No.3, with its physical properties listed in Table 1.
Drum tests were performed by a constant-speed-rotated ceramic drum with granular materials inside to simulate the consecutive granular flow process with a free surface, as shown in Fig.2.Table 2 gives the physical parameters of the ceramic drum.For the granular materials,silica sand No.3 and ceramic balls were employed in the drum tests for investigating particle breakage of silica sand No.3 subjected to friction and collision.In this study,the ceramic balls, with their physical parameters given in Table 3, are regarded as being uncrushable.Drum tests were conducted on the granular materials, i.e.silica sand No.3 (amount of sand: 275 g,550 g and 825 g)and ceramic balls(number of balls:0,2,6 and 10)at the designated duration of tests, i.e.0 s, 600 s, 1200 s, 1800 s,3600 s and 5400 s,for obtaining the grain size distributions of sand by sieve analyses.Table 4 shows the summary of the drum tests on silica sand No.3.In this study, relative breakage Br, as defined in Fig.3,was introduced to quantify particle breakage using the grain size distributions of silica sand No.3 in the drum tests.

Table 1Physical properties of silica sand No.3.

Fig.2.Illustration of granular flow in drum tests.

Table 2Physical parameters of ceramic drum.

Table 3Physical parameters of ceramic balls.

Table 4Summary of the drum tests on silica sand No.3.
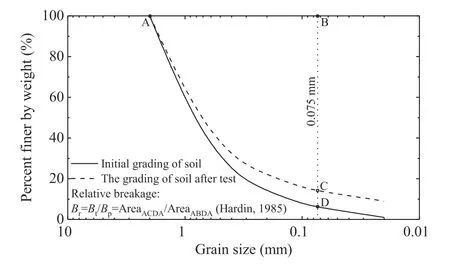
Fig.3.Definition of relative breakage.
3.Test results
Fig.4 shows the evolution of grain size distributions of silica sand No.3 in the drum tests.In Fig.4, particle breakage increases gradually with increase of duration of the tests.In comparison to particle breakage without using any ball(see Fig.4a,c and g),more particle breakage was induced with the use of the balls(see Fig.4b,d-f and h), implying the different mechanism of particle breakage from the friction and collision.Particle breakage was also influenced by the amount of sand and the number of balls.In addition,particle breakage showed a great influence on the characteristics of grain size distributions of sand,e.g.the fines content,characteristic grain sizes, and coefficients of uniformity and curvature.
4.Discussion
4.1.Particle breakage of sand subjected to friction and collision
In granular flow, it is a common phenomenon for the coexistence of the friction and collision of granular materials to cause particle breakage.Although the coexistence of the friction and collision to exert a mixed contribution on causing particle breakage in the drum tests,in line with the comparison of particle breakage of sand in Fig.4, the friction of sand is evidently predominant in generating particle breakage in the drum tests on sand without any uncrushable ball, whereas the presence of the uncrushable balls enhances the predominance of collision,causing particle breakage in the drum tests in comparison with the friction of sand.It implies the presence of different mechanisms of particle breakage in the friction tests and collision tests.As a result, for the convenience of expression, in this study, it would term the friction tests for the drum tests on sand without balls and the collision tests for the drum tests on sand with balls in general designation.In addition,it should be noted that in the collision tests, the total particle breakage was regarded as the particle breakage induced by the collision because of the negligibility and inseparability of the particle breakage due to the friction in the collision tests.Similarly,the total particle breakage in the friction tests was also taken as the particle breakage induced by the friction in consideration of the negligible and inseparable collision in the friction tests.
Fig.5 shows the evolution of relative breakage against the duration of drum tests.Particle breakage is shown to increase in up convexity with increase in the duration of drum tests.The results of the friction tests showed much less particle breakage than that caused in the collision tests, as displayed in Fig.5, revealing the predominance of collision in the drum tests to cause more particle breakage in comparison with the friction of sand.In Fig.5,particle breakage also showed an increase while increasing the number of balls, implying that more collision resulted in more particle breakage.
4.2.Particle breakage of sand subjected to friction
Fig.6 shows the evolution of relative breakage of sand against the duration of friction tests for investigating the effect of friction on particle breakage of sand.In Fig.6,particle breakage is revealed to increase in up convexity while increasing the duration of friction tests.In granular flow, the amount of granular material plays a significant role in the friction among granular material.The amount of sand showed a great effect on particle breakage as well, i.e.particle breakage experienced an increase followed by a decrease while increasing the amount of sand,as revealed in Fig.6.It implies that,in the friction tests,there may be existence of a characteristic amount of sand causing a maximum particle breakage of sand.
Fig.7 shows the evolution of grain size distributions of sand in the drum tests for detailing the change of grain size of the different amounts of sand.In Fig.7,particle breakage showed a small change of grain size distribution of sand but in different extents for the different amounts of sand.

Fig.4.Grain size distributions of sand in the drum tests:(a)275 g sand and 0 ball;(b)275 g sand and 10 balls;(c)550 g sand and 0 ball;(d)550 g sand and 2 balls;(e)550 g sand and 6 balls; (f) 550 g sand and 10 balls; (g) 825 g sand and 0 ball; and (h) 825 g sand and 10 balls.
4.3.Particle breakage of sand subjected to collision
In Fig.8,particle breakage due to collision showed an up-convex increase with increase in the duration of drum tests.For a given number of balls representing a certain amount of collision energy,e.g.under 10 balls in the drum tests in Fig.8, particle breakage experienced an increase with increasing amount of sand,and then a decrease with further increasing the amount of sand.This shows that, under a designated number of balls, the contribution of collision on particle breakage of sand is changeable against the amount of sand.As inferred in Fig.8, for a certain amount of collision energy,i.e.under a given number of balls in the drum tests,there may be existence of a characteristic amount of sand causing a maximum particle breakage of sand subjected to collision.However,the characteristic amount of sand causing the maximum particle breakage may also be different and changeable for the friction tests and collision tests in different configurations of friction and collision energies,because of the different mechanisms of particle breakage in the friction tests and collision tests,as revealed in Figs.6 and 8.

Fig.5.Relative breakage of sand against duration of the drum tests:(a)275 g sand;(b)550 g sand; and (c) 825 g sand.
Fig.9 shows the evolution of grain size distributions of sand in the collision tests with 10 balls to demonstrate the change of grain size against the different amounts of sand subjected to collision.In Fig.9, particle breakage results in change of grain size of sand towards smaller size,causing a complex change of the percentage of each grain size.Fig.9a shows the grain size distributions of original silica sand No.3.In Fig.9b-d, the grain size in the maximum percentage,mainly larger than the grain size of 1 mm,experiences a decrease and then an increase while increasing the amount of sand.However,in Fig.9e-f,particle breakage results in reduction of the grain size in the maximum percentage to less than the grain size of 1 mm for the collision tests on 275 g sand and 550 g sand.It can be concluded that,for a given number of balls,i.e.under certain collision energy, particle breakage induced by the collision is dependent on the amount of sand due to the complex change of the microstructure and stress chain of the different amounts of sand during collision.
Fig.10 displays the evolution of grain size distributions of sand subjected to the friction and collision in the drum tests on 550 g sand with 0,2,6 and 10 balls.In the drum tests,Fig.10a shows that the friction of sand resulted in very few particle breakage to generate limited change in grain size distribution of sand,in comparison to the particle breakage induced by the collision in the drum tests with the balls as shown in Fig.10b-d.While increasing the number of ceramic balls, particle breakage increased dramatically,causing evident reduction of grain size towards the increase of smaller grain size of sand, as shown in Fig.10b-d.
In Fig.10,the collision of ceramic balls on sand in the drum tests showed a great contribution to particle breakage.In Fig.11,particle breakage showed a monotonic increase against the increase of the number of balls in the drum tests.Interestingly, the increase becomes perfectly linear from short- and long-duration runs.In line with Figs.11 and 12 demonstrates the linear representations of relative breakage and the number of balls in the drum tests on 275 g sand (Fig.12a) and on 825 g sand (Fig.12b).
By a comprehensive view of particle breakage in the friction tests and collision tests as shown in Figs.4-10, it is worth noting that the friction and collision result in different mechanisms of particle breakage of sand, i.e.by inference in terms of the characteristics of particle breakage in the friction tests and collision tests,the friction-induced particle breakage of sand was achieved mainly through abrasion of sand particles, whereas the collision-induced particle breakage of sand was caused mainly by splitting of sand particles.
4.4.Influence of particle breakage on characteristics of grain size distribution
Particle breakage has shown a vital influence on the characteristics of grain size distributions of sand, e.g.fines content, characteristic grain sizes, and coefficients of uniformity and curvature.Particle breakage may result in increase of fines content of sand that significantly affects the behavior of sand, e.g.by changing its liquefaction potential, microstructure and stress chain, compression and dilatancy behaviors,seepage ability,and flow mechanism and characteristics(e.g.Lade and Yamamuro,1997;Thevanayagam,1998; Salgado et al., 2000; Ni et al., 2004; Murthy et al., 2007;Carraro et al., 2009; Yang and Wei, 2012).Fig.13 shows the evolution of the fines content of sand against relative breakage caused in the friction and collision tests.In Fig.13,the fines content of sand showed an increase as the relative breakage increased.The friction and collision on sand have resulted in different mechanisms of particle breakage, mainly by abrasion of sand particles for the friction tests and by splitting of sand particles for the collision tests,causing different evolutions of fines content of sand.Particle breakage in the friction tests (abrasion) resulted in a sharper increase but with a smaller total amount of fines content in comparison with that in the collision tests (splitting).For the collision tests with 10 balls, the fines content induced by particle breakage experienced a decrease and then an increase while the amount of sand increased, as displayed in Fig.13.However, for the collision tests on 550 g sand with the balls,the collision on sand resulted in an up-convex increase of fines content while increasing the number of balls.
In addition, for a certain granular flow, i.e.under a certain energy of friction and collision on a given granular material,there may be existence of a boundary line that is defined as the lowest boundary line of the data of fines content and relative breakage,i.e.all the data of fines content and relative breakage would be shown above the boundary line, as given in Fig.13.
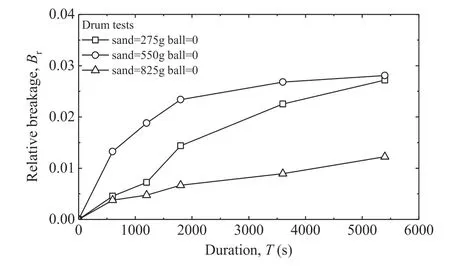
Fig.6.Relative breakage of sand against duration of the drum tests subjected to friction.
Particle breakage resulted in the change of characteristic grain size, e.g.D10, D30, D50and D60that represent the grain sizes corresponding to 10%,30%,50%and 60%finer by weight,respectively,which would be investigated by evolution of the characteristic grain size against relative breakage, for interpreting the effect of particle breakage on the characteristic grain size of sand.The characteristic grain size D10is a significant grain size related to the seepage ability of sand (Lade et al.,1996).In Fig.14, the characteristic grain size D10is shown to decrease in down convexity while increasing the particle breakage.The relation between the characteristic grain size D10and relative breakage can be expressed by a natural exponential function, as shown in Fig.14.
In Fig.15, in consideration of the down-convex decrease of the characteristic grain size D30along the increase of particle breakage,a natural exponential function can also be proposed to describe the relation between the characteristic grain size D30and relative breakage, which is distinguishable from the evolution of the characteristic grain size D10against relative breakage in Fig.13.
The characteristic grain size D50is commonly used as a single parameter to represent sand in investigating or modeling thephysico-mechanical behavior of sand.In Fig.16, the characteristic grain size D50showed a linear decrease while increasing the relative breakage.In Fig.17,a linear expression can be proposed as well for the linear representation of the relation between the characteristic grain size D60and relative breakage, i.e.the characteristic grain size D60decreased linearly as the relative breakage increased.It should be noted that the relation between the characteristic grain size D50and relative breakage is not the same as that between the characteristic grain size D60and relative breakage, as shown in Figs.16 and 17.

Fig.7.Grain size distributions of sand in the drum tests on sand without ball: (a) T = 0 s; (b) T = 600 s; (c) T = 1200 s; (d) T = 1800 s; (e) T = 3600 s; and (f) T = 5400 s.

Fig.8.Relative breakage of sand against duration of the drum tests subjected to collision.
The coefficients of uniformity and curvature of granular soil are usually employed to characterize the physical properties of soil that affect its physico-mechanical behaviors, e.g.the compaction and bearing behavior of soil in ground engineering, the seepage ability of soil in dam engineering,and the mobility and deposition of soil in landslides.In Fig.18, particle breakage showed a great effect on the coefficients of uniformity and curvature of sand.In Fig.18a, the coefficient of uniformity showed a linear increase followed by a linear decrease while increasing the relative breakage,i.e.particle breakage resulted in a linear increase of the coefficient of uniformity against the relative breakage, but the further particle breakage caused a linear decrease of the coefficient of uniformity.In Fig.18b, the coefficient of curvature experienced a linear increase and then a gradual decrease to a constant with increasing relative breakage.

Fig.9.Grain size distributions of sand in the drum tests on sand with 10 balls: (a) T = 0 s; (b) T = 600 s; (c) T = 1200 s; (d) T = 1800 s; (e) T = 3600 s; and (f) T = 5400 s.
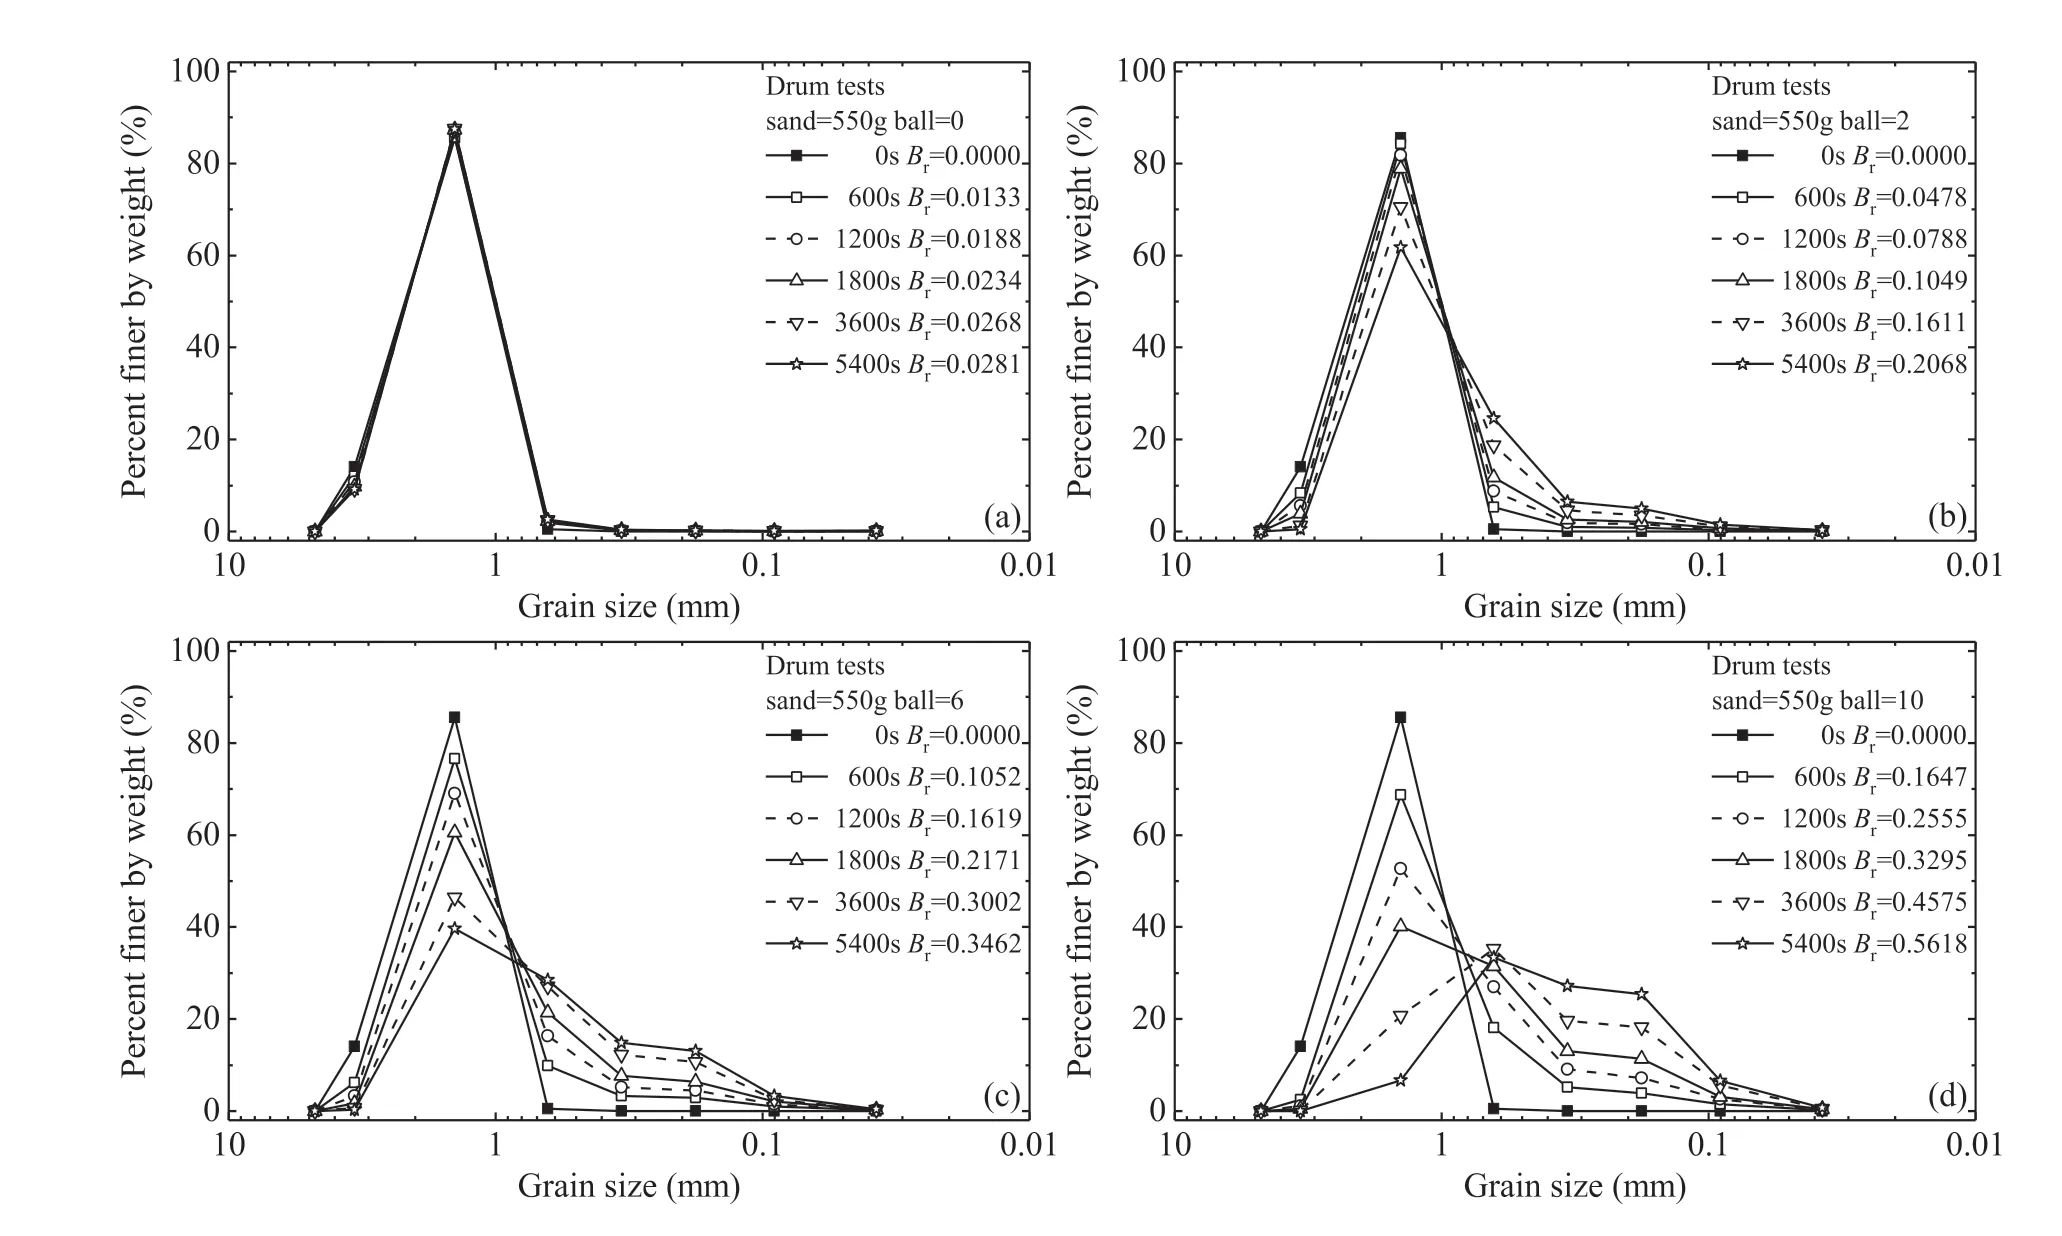
Fig.10.Evolution of grain size distributions of sand subjected to friction and collision:(a)550 g sand and 0 ball;(b)550 g sand and 2 balls;(c)550 g sand and 6 balls;and(d)550 g sand and 10 balls.

Fig.11.Relative breakage of sand against number of balls in the drum tests on 550 g sand.
5.Conclusions
A number of drum tests were conducted by a constant-speedrotated ceramic drum with granular materials (silica sand No.3 and ceramic balls) to simulate the consecutive granular flow process with a free surface.This study was to investigate the particle breakage of sand subjected to friction and collision and the effect of particle breakage on the characteristics of grain size distribution of sand, e.g.the fines content, the characteristic grain sizes D10, D30,D50and D60, and the coefficients of uniformity and curvature.The main conclusions can be drawn as follows:
(1) Particle breakage was caused by a mixed contribution of the friction and collision in granular flow.Particle breakage showed an up-convex increase with increasing duration of drum tests.Particle breakage increased linearly whileincreasing the number of the balls, implying that more collision resulted in more particle breakage.Particle breakage showed an increase followed by a decrease with increasing amount of sand, implying the existence of a characteristic amount of sand causing a maximum particle breakage of sand.However,the characteristic amount of sand causing the maximum particle breakage may be different and changeable in the friction tests and collision tests due to the existence of the different mechanisms of particle breakage of sand.

Fig.12.Relative breakage of sand against number of balls in the drum tests: (a) 275 g sand; and (b) 825 g sand.
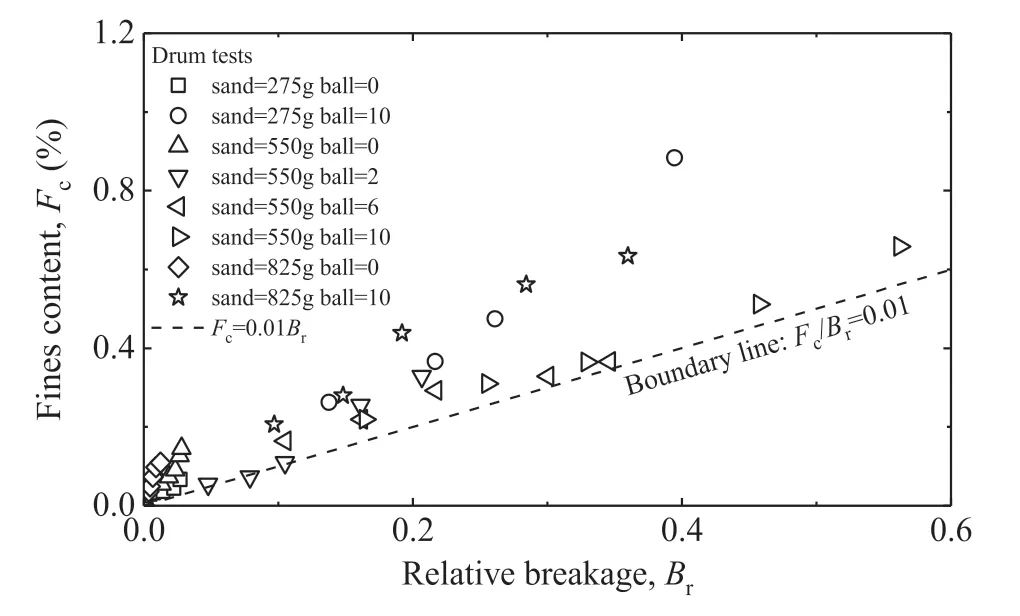
Fig.13.Fines content of sand against relative breakage.
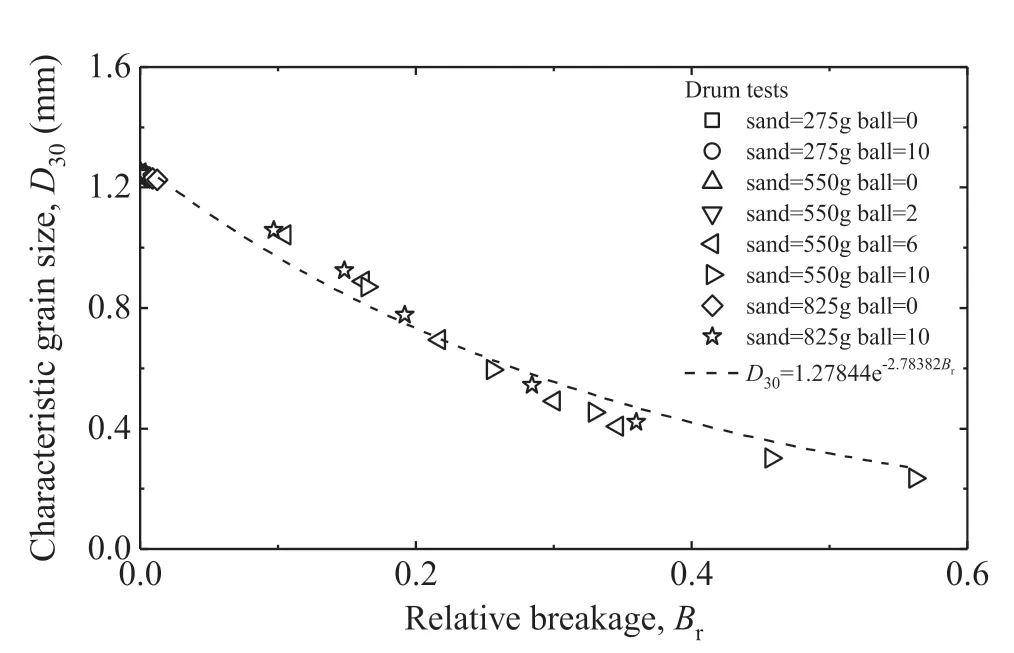
Fig.15.Characteristic grain size D30 of sand against relative breakage.
(2) Friction resulted in much less particle breakage than that caused by collision.The friction and collision resulted in different mechanisms of particle breakage in granular flow,i.e.by inference in terms of the characteristics of particle breakage in the friction tests and collision tests,the frictioninduced particle breakage of sand was achieved mainly through abrasion of sand particles, whereas the collisioninduced particle breakage of sand was caused mainly by splitting of sand particles.
(3) The fines content increased while increasing the relative breakage.Particle breakage in the friction tests (abrasion)resulted in a sharper increase but with a smaller total amount of fines content in comparison with that in the collision tests(splitting).For the collision tests, the fines content showed a decrease followed by an increase as the amount of sand increased.However, the collision on sand resulted in an upconvex increase of fines content while increasing the number of balls.For a certain granular flow,there may be existence of a boundary line as the lowest boundary line of the data of fines content and relative breakage.The characteristic grain sizes D10and D30decreased in down convexity with increasing particle breakage, which could be described by a natural exponential function.However, the characteristic grain sizes D50and D60decreased linearly with increasing relative breakage.In addition, the coefficients of uniformity and curvature of sand experienced an increase and then a decrease with increasing relative breakage.
Declaration of competing interest
The authors declare that they have no known competing financial interests or personal relationships that could have appeared to influence the work reported in this paper.

Fig.18.Coefficients of uniformity (a) and curvature (b) of sand against relative breakage.
Acknowledgments
This work was supported by the National Natural Science Foundation of China(Grant No.41807268),the“Belt&Road”International Cooperation Team for the “Light of West” Program of Chinese Academy of Sciences (Lijun Su), China, the Youth Innovation Promotion Association of Chinese Academy of Sciences,China(Grant No.2018408), and China Postdoctoral Science Foundation (Grant No.2019T120864).A special acknowledgement should be expressed to the Geotechnical Engineering Laboratory of the University of Tokyo,Japan that supported the implementation of the tests in this paper.
 Journal of Rock Mechanics and Geotechnical Engineering2021年2期
- Journal of Rock Mechanics and Geotechnical Engineering的其它文章
- Case study of a driven pile foundation in diatomaceous soil.I: Site characterization and engineering properties
- On the measurements of individual particle properties via compression and crushing
- Permeability and setting time of bio-mediated soil under various medium concentrations
- Novel experimental techniques to assess the time-dependent deformations of geosynthetics under soil confinement
- Physics-informed deep learning for one-dimensional consolidation
- Numerical modeling for rockbursts: A state-of-the-art review
