Ship detection and classification from optical remote sensing images: A survey
Bo LI, Xiaoyang XIE, Xingxing WEI, Wenting TANG
School of Computer Science and Engineering, Beihang University, Beijing 100083, China
KEYWORDS Optical remote sensing;Satellite image;Sea target detection;Ship classification;Ship detection
Abstract Considering the important applications in the military and the civilian domain, ship detection and classification based on optical remote sensing images raise considerable attention in the sea surface remote sensing filed. This article collects the methods of ship detection and classification for practically testing in optical remote sensing images, and provides their corresponding feature extraction strategies and statistical data. Basic feature extraction strategies and algorithms are analyzed associated with their performance and application in ship detection and classification.Furthermore, publicly available datasets that can be applied as the benchmarks to verify the effectiveness and the objectiveness of ship detection and classification methods are summarized in this paper. Based on the analysis, the remaining problems and future development trends are provided for ship detection and classification methods based on optical remote sensing images.
1. Introduction
Ship as the key transportation tool on the vast ocean always raises much attention. The application of ship detection and classification provides essential information for strategic decision-making, thus can effectively shorten the decisionmaking cycle,which is an important basis for real-time battlefield situation awareness in wide range of operational environments.1-3With the development of remote sensing imaging technology, the monitoring of the wide-range sea surface has become possible, which arises extensive research interest in marine target detection and classification technology.4-6
Ship detection and classification techniques have great application value in military and civilian domains. In the civil field,it is the basis for implementing the supervision of marine resources, monitoring illegal fishing, and assisting in the maritime rescue, etc.; in the military field, it can be applied to patrols,interests and rights protection in territorial sea region,and monitor important ports, and targets.4,7For example, the U.S.Navy undetectably sent the John C.Stennis carrier strike group into the South China Sea and kept radio silence in March 2016 by intentionally close radio communication systems to prevent the detection and identification by the ground electronic radar.8If remote sensing monitoring deployed in that circumstance, continue tracking the aircraft carrier battle group is achieved even when the targets are undetectable in other monitoring system.
In recent years, with the rapid development of satellite remote sensing imaging technology, ship targets detection and classification from remote sensing images become an important application direction of remote sensing target recognition.Optical remote sensing images are conducive to human visual interpretation,so they are more useful for observing the earth’s dynamic surface.9Therefore, ship detection and classification based on optical remote sensing images are of main importance in future research and development.
The main contributions of this paper are as follows: (A) a comprehensive review on most popular techniques for both ship detection task and classification task from optical remote sensing images is provided; (B) the publicly available datasets for ship detection and classification on aerial view satellite images are thoroughly collected; (C) experimental results of the state of the art methods for ship detection and classification on publication dataset are compared and discussed; (D)challenges in ship detection and classification from optical remote sensing images and possible futuristic trends are analyzed and discussed.
In this literature, the term ‘optical remote sensing images’includes panchromatic remote sensing images(PAN)and multispectral remote sensing images, which mainly contain Blue(B), Green (G), Red (R), Near-Infrared (NIR) bands, additionally, satellite WorldView-2 also contains four new color sensors,Red Edge(RE), Coastal (C), Yellow (Y), and Second Near-Infrared (NIR2) bands. In addition, some multispectral remote sensing images were also included infrared imaging remote sensing images, that are Short-Wavelength Infrared(SWIR), Mid-Wavelength Infrared (MWIR), and Thermal Infrared Sensors (TIRS). As for the notions, ‘ship’ refers to the man-made objects that sail on the sea surface. As for the term ‘object detection’ in remote sensing images refers to visible man-made objects in the images covering a variety of targets, such as ship, airplane, vehicle, etc. Although the majority of authors use the term ‘ship detection’ in their research, the expression ‘sea target detection’ or ‘object recognition in ocean imagery’ is also used to represent ship detection. All these terms will be deployed throughout this paper without an intended difference in meaning.
The remainder of this paper is organized as follows. In Section 2, chronological statistic on literatures of ship detection and classification methods is presented, and each procedure in the whole workflow is introduced. Typical methods in preprocess stage and detection and classification stage are systematically analyzed in Section 3. Besides, different levels in the classification stage are also narrated in this section. In Section 4, publicly available datasets are collected and introduced. Experimental results of some representative methods on one public dataset are provided and some issues in ship detection and classification are summarized in Section 5.Conclusions are drawn in Section 6.
2. Statistics
The analytical description in this paper is based on the collection of 153 papers (lists in Table A1 in the Appendix A) on ship detection and classification published from 1978 to July 2020,which describes the experimental results of their methods on optical satellite images.Comparative statistics and analysis between traditional feature-designed methods and the deep Convolutional Neural Networks (CNN)10architecture based methods are introduced in this section, which is expected to lay the foundation for subsequent research.
2.1. Statistics on workflow of ship detection and classification
According to the statistics, the ‘‘Coarse-to-fine” two-stage detection scheme11,12is the classic processing framework on ship target detection for remote sensing images as shown in Fig. 1, which mainly includes three basic steps: image preprocessing, candidate target extraction, and target identification or classification. The one-stage detection scheme also applies in some methodologies,which completes the extraction of target candidates and identification or classification process in one step. (E.g. Refs.13-16) When the target is relatively large in the image to be detected,this scheme can obtain comparable efficiency with the two-stage detection scheme in the target detection task. However, in terms of time and computational saving, the two-stage detection scheme shows its superiority in treating wide-spread small target detection as in remote sensing images.11,12,17Therefore, the overview of existing detection algorithms in this section mainly focuses on the‘‘Coarse-to-fine” two-stage detection scheme. The narrative of the one-stage scheme methodologies is placed in the process of target identification or classification in the following section.Some early literatures treat the term‘‘ship classification”as the differentiation between real ship-targets and non-ships among ship candidates (E.g. Refs.6,11,18-20), which may cause misunderstanding of this term. To be clarifying, in this paper, the term ‘‘ship identification” denotes the distinction between ships and non-ships; the term ‘‘ship classification” indicates the distinction among different types of ship-targets.
(1) Image preprocessing
The most common processing in this step is the sea-land segmentation based on Geographic Information System(GIS)technology(E.g.Refs.21-26),because of the prior knowledge that large ships only appear in the marine area.The main advantages lay in this process are:firstly,reducing the computation time of feature extraction by narrowing traversal area of the core detection algorithm; secondly, improving detection precision by elimination of false detected targets caused by land part with complex texture features. Except for the sea-land segmentation process, the cloud filtering process is also applied in some ship detection and classification methods(E.g. Refs.4,25-28), aiming to provide reliable detection results in optical remote sensing images taken under cloudy and foggy weather conditions.
(2) Ship candidate extraction
Because the remote sensing image contains a vast sea area,the ship is relatively small and difficult to spot in the imaging result due to the image spatial resolution and the sparse distribution of targets.29,30If the dense feature extraction and calculation algorithms are directly executed in the entire sea area,the computational and time consumption will increase drastically. Therefore, most ship detection methods apply a ‘‘Coarse-to-fine” two-stage detection scheme. (E.g.Refs.11,12,19,21,31) Ship candidate extraction is the ‘‘coarse”stage, which utilizes a relatively simple computational feature descriptor to exclude most image regions without targets retaining possible target image blocks for further identification in the next step.

Fig. 1 A common ship detection and classification workflow from optical remote sensing image.
(3) Ship identification and classification
The early published literature focuses its research purpose on ship identification because of the low spatial resolution of remote sensing imaging. (E.g. Refs.6,11,13,18-20,23,32) In the recent few decades, sophisticated ship classification methods emerge in response to the improvement in spatial resolution of the optical remote sensing imaging. (E.g. Refs.33-37) Therefore, ship identification and classification methods are introduced together in the following section. In this step, the common use of features such as shape, texture, and structure is to identify ships or the type of ship.
2.2. Statistics on methodologies of ship detection and classification
The CNN technology is applied in ship detection and classification of remote sensing image tasks increasingly since it demonstrates its powerful feature representation abilities in 2015.38For a better understanding, the term ‘‘CNN structure design based method” used in this paper refers to a method that focuses on designing and improving the CNN architecture for ship detection and classification; on the other hand, the term ‘‘feature design based method” refers to a method that focuses on designing feature descriptions for ships or backgrounds.Consequently,it provides statistical data on the number of publications,CNN structure design based methods,and feature design based methods in years respectively according to the literature collection mentioned above, as shown in Fig. 2.The feature design based methods dominant the early ship detection and classification research. However, ship detection and classification based on CNN structure design attract majority research attention in recent years as the development of CNN technology.
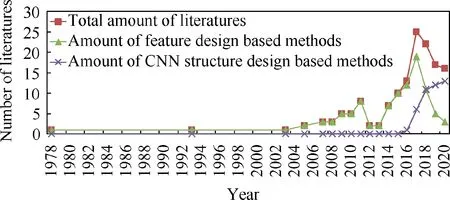
Fig. 2 Literature collection statistics compiled from 1978 to May 2020.
The research boom of ship detection and classification appears in 2017 and then slightly downwards as can be seen in Fig. 2. This is the result of continuous improvement in the spatial resolution of optical remote sensing imaging. That improvement realizes imaging meaningful yet once unidentifiable targets such as airplanes and vehicles, which attract the attention of researchers. Ship target, thereby, is regarded as one of the categories of object detection from remote sensing images.
3. Analysis
In this section,the main application techniques in each step are demonstrated in accordance with the general process sequence for performing ship detection and classification.
3.1. Methodology for image preprocessing
In the procedure of image preprocessing,commonly used operations are sea-land segmentation,and cloud filtering,aiming at reducing the environmental influence during target detection procedure.
3.1.1. Sea-land segmentation
Five basic methods lay in general utilized sea-land segmentation technology in ship detection and classification: (A) coastline matching method with the information stored in Geographic Information System (GIS); (B) regional homogeneity classification in the image; (C) methods based on the statistical model; (D) methods based on deep learning model;(E) methods based on normalized difference water index.Details of each basic method are narrated in the following.
(1) Coastline matching method
These methods mainly match the geographic location of the input image with that in GIS.The precision of its segmentation results only depends on the spatial resolution of the coastline stored in the GIS library and the accuracy of the imaging satellite positioning solution. It does not depend on the imaging quality, weather conditions or sensors. The disadvantage of these methods is that the geographic information of candidate areas is unavailable in some cases; besides, the available geographic coastline information may be outdated. The source of the coastline in GIS comes from the digital elevation model or digital terrain elevation data. The spatial resolution of the Shuttle Radar Topography Mission (SRTM) for global coverage is about 30 m, which achieves the highest possible resolution of global topographic data.39Although this spatial resolution of the coastline is sufficient to perform sea-land segmentation in satellite images of less than thirty meters resolution, it is far from the needs of sea-land segmentation in high spatial resolution satellite images.
(2) Regional homogeneity classification
The initial step of the sea-land segmentation methods based on regional homogeneity classification is seed selection. Then the adjacent regions of the selected seed points are collected based on feature descriptors, and finally, the entire image is segmented.30Therefore,the seed selection is very vital in determining the segmentation results. Improper seed selection may lead to disastrous segmentation results. The segmentation results are also susceptible to weather conditions, sediment content in seawater, and sea surface reflections.
(3) Methods based on statistical model
These methods establish statistical models based on the histogram of sea regions to approximate the intensity distribution of sea pixels and then determine the segmentation threshold of the sea area.40,41Sea-land segmentation based on these methods generally works well in most cases but will misclassify sea regions with abnormal intensity due to environmental factors. In most cases, these methods usually misclassify the land covered by cloud shadows as the sea.
(4) Methods based on deep learning model
With the application of deep learning technology in the field of image segmentation, sea-land segmentation methods based on CNN technology have emerged in recent years.42-44In order to obtain a CNN based sea-land segmentation model,it is necessary to manually label the coastline samples at pixellevel on the image for the model training. The performance of these methods is relatively stable in resisting environmental factors in the image when performing segmentation. Comparing with methods based on statistical models or regional homogeneity classification, it obtains relatively higher precision in segmentation in most cases.However,it is easy to misclassify regions with complex contours and consume much more resources for computation and storage.
(5) Methods based on normalized difference water index
To perform sea-land segmentation, these methods take advantage of the reflectance ratio from two different bands in the multispectral image to enhance the difference between sea and land.32,45However, the threshold applied to the ratio map for segmentation varies among different sensors.It needs to be adjusted when applied in images produced by other sensors. These methods are applicable to multispectral remote sensing images exclusively.
3.1.2. Cloud filtering
Optical remote sensing imaging is inevitably affected by weather conditions such as cloudy and foggy,which introduces interference within ship detection and classification and arouses false alarms.27Therefore, it is crucial to suppress the influence of clouds and fog on optical remote sensing images when performing ship detection and classification tasks.There are three common methods in cloud filtering: (A) cloud mask threshold based on the Gaussian distribution model;4,25(B)threshold segmentation based on band ratio;26(C) cloud filter based on Fourier transform.27,28
There are two fundamental assumptions of the first method:the gray-scale values of the image follow the Gaussian distribution; cloud pixels mostly correspond to the brightest pixels in the images.4For thick cloud imaging in panchromatic images,most of their pixels reflect high intensity,but this is not always the case.
Band ratio between the NIR and B band is applied to perform threshold segmentation to eliminate clouds in multispectral images.The basic assumption behind it is that cloud pixels dominant to the top portion of the histogram.26
Cloud tends to extend spatially in low frequency component of the image, therefore, the center of the Fourier transform of the image containing the cloud raises sharply. Then the cloud filter is established by taking advantage of such feature to set the signal-to-noise ratio threshold.28However, it is easy to remove ships beneath the cloud in the process of cloud filtering.
3.2. Methodology for ship detection and classification
According to the statistics of literature collation in this paper,the following introduces ship detection and classification methods from two aspects: CNN structure design based methods and feature design based methods.
3.2.1. Feature design based methodology
According to the statistics, ship detection and classification methods based on feature design generally adopt to the twostage scheme, which includes ship candidate extraction and ship identification. There are basically two kinds of features in feature design based methodology, i.e., global feature and local feature.As shows in Fig.3,a feature design based detector in two-stage manner usually applies both global feature and local feature combined with a discriminator; while a one-stage feature design based detector applies either global feature or local feature for discriminator. In ship candidate extraction stage, there mainly are six basic techniques: (A)threshold segmentation based on the statistical model; (B)background separation based on saliency; (C) anomaly detector; (D) background separation based on frequency analysis;(E) local feature descriptor on texture and shape, etc.; (F)background separation based on reflection difference. The main purpose at this stage is to quickly obtain the suspicious targets by separating the background and foreground with simple yet effective algorithms. Among them, (A)(B)(D)(F)belong to global feature; (E) belongs to local feature; (C) is a combination of global feature and local feature.
(1) Threshold segmentation based on statistical model

Fig. 3 Composition and workflow of a feature design based detector.
The statistical model derived by this technique generally bases on the difference of the gray-scale value between the ship and its local surroundings or the histogram of the gray-scale value of the whole image. Then, the statistical model distinguishes the background in the image by the threshold rule formulated from the statistical data. (E.g. Refs.3,6,7,18,28,46-49)Methods based on simple numerical statistics achieve ideal results in simple scene background with little environmental changes. However, the environmental variation in optical remote sensing is uncontrollable due to the imaging mechanism. The statistical threshold rules are not always applicable in background segmentation in the images.
(2) Background separation based on saliency
The definition of ‘‘saliency” comes from the interpretation of the pre-attention mechanism in human visual search strategies,50which is applied to highlight salient signals and suppress backgrounds. (E.g. Refs.17,30,51-55) In order to measure the degree of saliency, Fourier transform (E.g. Refs.51-53) or histogram statistics (E.g. Refs.54), etc. is applied to the image to suppress the background, and thus the candidate target and the background are separated.It well performs in images with environmental noise caused by sea waves. The extraction results are unsatisfactory in images with messy sea surface containing small islands and cotton shaped clouds, as a consequence of that the highlighted signal may fall on these objects instead of real ship target.
(3) Anomaly detector
The essential idea of an anomaly detector is similar to the saliency mechanism.The occurrence of the targets in the image disobeys the background distribution rule in the original image, thus becomes an anomaly. (E.g. Refs.12,56-59) The detector is usually based on statistics and analysis of the sea surface without targets to obtain‘‘normal”background distribution laws, and then selects the area with abnormal distribution as the candidate targets. Anomaly detector can maintain comparable performance under large-scale inference scenarios caused by ocean waves,clouds,or fog with that under calm sea background. However, it cannot adapt to complex backgrounds including various small-scale inferences.
(4) Background separation based on frequency analysis
Regarding the image as a two-dimensional discrete signal,the analysis based on its frequency domain believes that the noise and interference of waves and clouds can be effectively removed in this domain. (E.g. Refs.23,32,60-63) The commonly applied image frequency domain transformation is the Fourier transform and wavelet transform. Methods based on frequency analysis perform well when the disturbance has a relatively consistent pattern (such as ocean waves). They may fail to detect such targets when two signals are superimposed, for example, ship occluded by mists.
(5) Local feature descriptor
These methods design detectors based on the observation of ship targets.They generalize the characteristics of ship targets’texture, shape, and structure, etc. to formulate a feature descriptor for screening the ship.(E.g.Refs.64-69)These detectors can detect most of the ships,but the detection fails due to the low contrast between the ship and the surrounding environment. Moreover, numerous false targets are extracted by the detectors in the case of rich texture and edge information.Many feature descriptors used in optical remote sensing image ship candidate extraction mainly build on the histogram of oriented gradients and local binary patterns.(E.g.Refs.11,53,70-72)
(6) Background separation based on reflection difference
The principle of these methods is that the reflection intensity of the targets varies in different bands in remote sensing imaging. The ship candidates are extracted by using values from different bands to distinguish the reflection difference between the target and the background. (E.g. Refs.6,13,45,73,74)They take advantage of the imaging property, objects having different reflection intensity in multiple bands, to overcome the meteorological effects in optical remote sensing images.However, these methods neglect ships under the cloud shadows due to changes in the reflection intensity of these ships.
In the ship candidate extraction stage,many methods combine several of the above basic techniques to form a new model to achieve background separation under various meteorological conditions. (E.g. Refs.3,5,11,15,23,26,28,46,53-55,60,61,71,72,75,76).
In the ship identification and classification stage, feature design based methods mainly apply the strategy of combining classifiers and feature sets for discrimination. The frequently adopted classifier is the Support Vector Machine (SVM).The feature sets include(but not limited to)feature descriptors for ship geometric, shape, texture, and spectral signature.
3.2.2. CNN structure design based methodology
After the CNN technique achieves remarkable results in object recognition and detection of natural scene images, it is gradually applied to the object detection task in remote sensing images. In order to obtain the CNN prediction model for object detection tasks, a large amount of labeled sample data is required for network training. During the training process,the sample data is fed forward into the network.Then the values of the convolution filters in the network are updated by minimizing the loss function, which calculates the difference between the predicted values output by the current model and the ground truth of the labeled values. The update operation is achieved by the back propagating the error from the output layer of the network. This process stops when the loss function no longer shows a downward trend.After the training process, the parameters in each convolutional layer are fixed and saved for prediction. For the l-th convolutional layer,the unit j outputcan be obtained from the unit i in previous layerby77
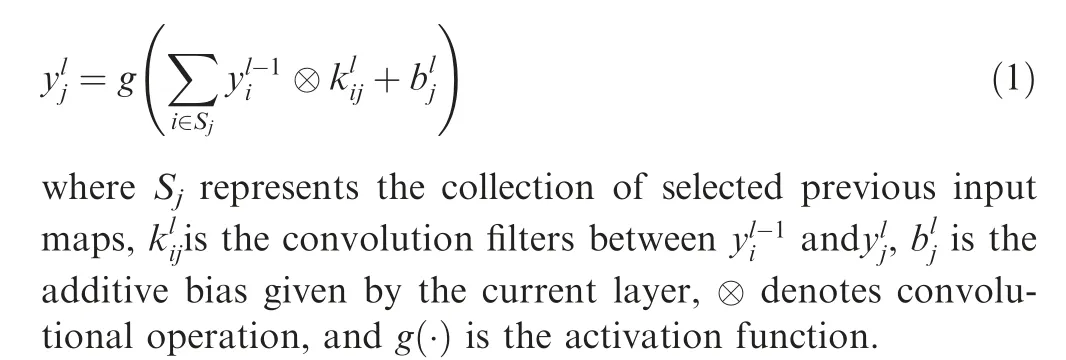
For a better understanding, we follow the illustration in Ref.78to unravel the components in the CNN model.As shows in Fig. 4, a CNN detector generally contains an input part, a backbone part, a head part may include a neck as an additional part. There are mainly two kinds of the CNN architectures, i.e., one-stage detector and two-stage detector. Their difference lies in whether to generate proposal regions as the intermediate result. The most representative one-stage detectors are Single Shot multibox Detector(SSD)79and You Only Look Once (YOLO),80,81which are frequently used in ship detection task from remote sensing images. As for the two stage detector, the most classic model is Faster R-CNN.82Due to the aerial view perspective in remote sensing imaging,the adjustment of architecture is necessary for the CNN model to predict targets with rotation variations. The usual adjustment is to add hidden layers for a specific purpose while maintaining the backbone structure of the networks. The CNN backbones commonly applied in ship detection and classification tasks are as follows (sorted according to the number of applications): ResNet38(E.g. Refs.31,83-97) and Visual Geometry Group (VGG)98(E.g. Refs.99-105). Usually Feature Pyramid Networks (FPN)106(E.g. Refs.85,88,97,102,107) or its modification version is used as the neck part. Faster R-CNN82(E.g. Refs.83,86-90,97,100,103,104,108,109), Mask R-CNN110(E.g. Refs.91,92,107,111), and Fast R-CNN112(E.g. Refs.105,113,114) are three general used sparse prediction detector heads; SSD79(E.g. Refs.99,101), and YOLO80,81(E.g. Refs.115,116) are two frequently applied dense prediction detector heads. In dealing with detection tasks in large-scale remote sensing images, these methods are far from meeting real-time requirements after consuming numerous computational resources and storage space.
The convolutional filters obtained after the training process are believed to contain abstract object feature. However, the mechanism behinds the success of CNN is not revealed.
3.2.3. Ship classification
According to Refs.34,117,118, there are two levels in ship classification. In the first classification level, namely coarse-grained classification,ships are classified by some criteria into different categories. The second classification level refers to the finegrained classification where ships are labeled by type,i.e.,container ship, cargo ship etc.
In the coarse-grained classification, ships are conventionally divided into two categories, i.e., merchant ships or naval ships. (E.g. Refs.28,65) There are other coarse-grained classification criteria, e.g. Ref.119classifies ships into moving ships and static ships; Ref.120divide ships into four subclasses,namely fishing vessel, container vessel, sailing vessel and coast guard vessel; Ref.121classifies ships into multi, coast-ship and detail. Many coarse-grained classification methods conduct their experiment on BCCT200122,123dataset, which includes four classes, i.e., barge, cargo, container and tanker.(E.g. Refs.35-37,69,122-128) Except for Ref.129performs shipfleets classification on satellite images at 10 m spatial resolution, other coarse-grained classification methods are implemented for images with a spatial resolution of more than 4 m. While the fine-grained classification methods are implemented on images with more than 2 m spatial resolution.(E.g. Refs.34,63,97,114,130-132)
The early proposed coarse-grained ship classification methods adopt a strategy of comparing the extracted ship features with a priori-database. (E.g. Refs.28,65) After the BCCT200 dataset is proposed, the most often used feature descriptor is multi-scale completed local binary pattern133combined with Gabor filter134to extract local and global features. (E.g.Refs.35,124,127)Methods for fine-grained ship classification generally apply CNN technique to identify ship types. (E.g.Refs.34,63,97,114,130) There are still few studies on coarsegrained and fine-grained ship classification.The main problem with ship classification may be that there is no uniform standard for data annotations for ship categories.
4.Publicly available datasets for ship detection and classification in remote sensing image
In recent years, many organizations release publicly available Earth observation datasets for object detection in the aerial view. It provides researchers with a comparable platform to testify their algorithms.

Fig. 4 Composition and workflow of ordinary CNN detector (partially source from Ref.78).
There are nine datasets for ship detection and classification:(A) NWPU VHR-10, the earliest released dataset for evaluating the performance of object detection in remote sensing images135; (B) NWPU RESISC45 for scene classification in high-resolution optical satellite image data136;(C)HRSC2016,a dataset dedicated to ship detection and classification in highresolution optical remote sensing images117; (D) Airbus Ship Detection dataset, from the challenge of ship detection on satellite images in Kaggle137; (E) xView, a dataset for object detection from satellite images138; (F) Dataset for Object detection in Aerial images(DOTA)dataset for object detection in aerial images139; (G) High-Resolution Remote Sensing object Detection (HRRSD) dataset for remote sensing image object detection applications140; (H) object Detection In Optical Remote sensing images(DOIR)dataset for object detection in optical remote sensing images141; (I) Fine-Grained Ship Detection (FGSD), the most detail labeled ship detection and classification dataset in remote sensing images so far(available soon).118
The NWPU VHR-10 dataset contains ten object classes:airplane, ship, storage tank, baseball diamond, tennis court,basketball court, ground track field, harbor, bridge, and vehicle.
NWPU RESISC45 dataset is a benchmark for scene classification in remote sensing images including 45 scene classes as follows: ship, airplane, airport, baseball diamond, basketball court, beach, bridge, chaparral, church, circular farmland,cloud, commercial area, dense residential, desert, forest, freeway, golf course, ground track field, harbor, industrial area,intersection,island,lake,meadow,medium residential,mobile home park, mountain, overpass, palace, parking lot, railway,railway station, rectangular farmland, river, roundabout, runway, sea ice, snowberg, sparse residential, stadium, storage tank, tennis court, terrace, thermal power station, and wetland.
The HRSC2016 dataset labels ship in three levels, namely ship class, ship category, and ship type. In the ship category level, it contains four labels: warcraft, aircraft carrier, merchant ship, and submarine. Note that, in this dataset, ships with unknown types are labeled with category level.
Airbus Ship Detection dataset contains the largest number of images in the dataset listed in this article. It reports in Ref.142that the combination of random forest classifier and feature sets containing the color histogram, Haralick textures and Hu moments outperforms the other four classifiers combined with the same feature sets, namely linear discriminant analysis,K-nearest neighbors,naı¨ve bayes,and support vector machine.
The xView dataset contains 60 object categories and released by the Defense Innovation Unit Experimental(DIUx)and the National Geospatial-intelligence Agency (NGA). The 60 fine-grained classes are labeled in a parent class-child class manner.There are seven different parent classes,namely fixedwing aircraft, passenger vehicle, truck, railway vehicle, maritime vessel, engineering vehicle, and building (some child classes have no parent class). In the maritime vessel class, it contains nine child classes:motoboat;sailboat;tugboat;barge;fishing vessel; ferry; yacht; container ship; oil tanker.
There are 15 classes in the DOTA dataset including plane,ship, storage tank, baseball diamond, tennis court, swimming pool, ground track field, harbor, bridge, large vehicle, small vehicle,helicopter,roundabout,soccer ball field and basketball court.
In dataset HRRSD,there are 13 categories containing ship,airplane, baseball diamond, basketball court, bridge, crossroad, ground track field, harbor, parking lot, storage tank, T junction, tennis court, and vehicle.
The ship samples in FGSD are annotated not only the bounding boxes but also the rotated bounding boxes. It says there are 43 categories of ships in the dataset annotated in multi-level labels follow the same annotation manner as in HRSC2016 dataset. The category level contains labels of warship, carrier, submarine, and civil ship.
Table A2 in the Appendix A lists the detailed information of these datasets, including the acquisition source, resolution of images, image amount, and image size.
5. Discussion and future work
In this section,ship detection and coarse-grained classification results of mostly considered methods83,86,95,96,114,117,143,144on dataset HRSC2016 present in Table 1. The ship detection and classification tasks in HRSC2016 include three levels,i.e.,L1, L2,and L3. L1 contains 1 class, namely ship;L2 contains 4 classes, i.e., Aircraft carrier (Air.), War craft (War.),Merchant ship (Mer.) and ship; L3 contains 19 classes, i.e.,ship, Aircraft carrier, War craft, Merchant ship, Nimitz class aircraft carrier (Nim.), Enterprise class aircraft carrier (Ent.),Arleigh Burke class destroyer (Arl.), Whidbey Island class landing craft(Whi.),Perry class frigate(Per.),Sanantonio class amphibious transport dock (San.), Ticonderoga class cruiser(Tic.),Austen class amphibious transport dock(Aus.),Tarawa class amphibious assault ship (Tar.), Container ship (Con.),Command ship (Com.A), Car carrier A (Car.A), Container ship A (Con.A), Medical ship (Med.), Car carrier B (Car.B).Average precision (AP) and mean average precision145are used as the measurement criteria.The baseline method denotes to the BL2 algorithm in Ref.117and the RR-CNN refers to the RC1 algorithm in Ref.114in Table 1. It can be seen from Table 1 that RBox-CNN method achieves the best performance in both L1 and L2 tasks in HRSC2016 dataset.It yields a 91.9% AP value in L1 task and 79.4% mean AP in L2 task.
The L3 task performance of some representative methods on HRSC2016 displays in Table 2. The RC1 and RC2 algorithms both from Ref.114, where RC2 is basically the same as RC1 but adds a multi-task loss to learn non-maximum suppression score (Multi-NMS). The R-DFPN2 is based on RDFPN and uses Proposals Simulation Generator (PSG) data augmentation in training process. Its input size is fixed at 335×58 and is calculated by the k-means algorithm.97The results in Table 2 shows that the PSG data augmentation can improve the performance of the R-DFPN83in L3 task.Besides, the SHDRP97achieves the best preformation on L3 task of HRSC2016 so far and obtains 74.2% AP.
Based on the introduction and analysis of the literature collection on ship detection and classification from optical remote sensing images published in different periods, this chapter summarizes the main problems in these literatures as follows.
First, due to the passive remote sensing imaging characteristics of optical remote sensing images, the impact of environmental factors such as lighting and meteorological conditionsduring the imaging process reflects in the images, which has a great influence on the accuracy of ship detection. However,most of the methods collected in the literature collection cannot adapt to various environments.Among them,the relatively robust one is the detection methods taking advantage of the reflection signature of the target. Lacking the research in the analysis of the spectral reflection relationship between the target and background, none of these algorithms perform well under the influence of the target covered by cloud and shadow.Therefore,it is still a very challenging task that detects ships in remote sensing images under various environmental changes.

Table 1 Comparisons of ship detection and classification methods on HRSC2016 (Source from Refs.86,95).
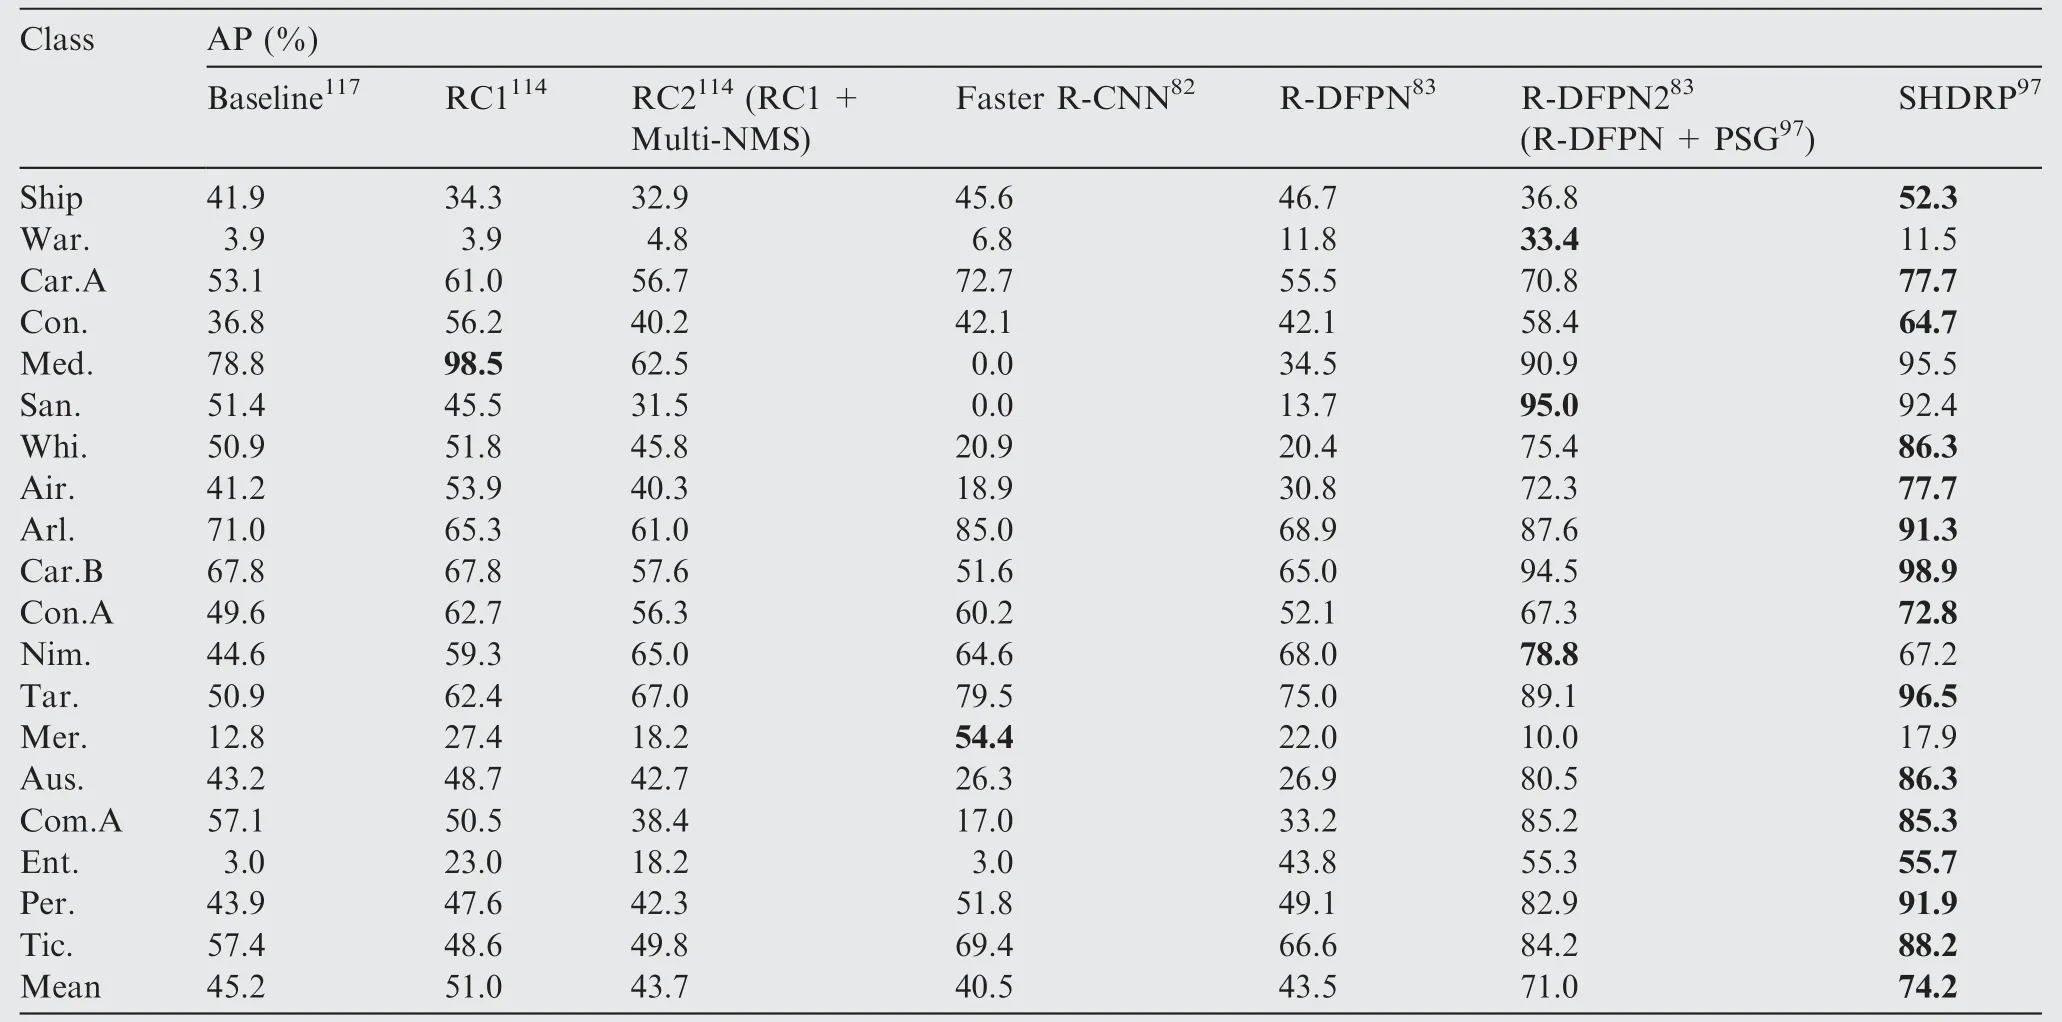
Table 2 Comparisons of AP values on the L3 task of HRSC2016 (Source from Refs.97,114).
Second, as the remote sensing image covers a large area of the earth’s surface, ship targets become relatively small and distribute sparsely on the image.In recent years,ship detection and classification methods based on CNN structure design become the mainstream applications. However, the neglected fact is that these methods require high-performance equipment and still cannot work efficiently. Efficiency has always been a difficult problem in the object detection field, so there is no exception in ship detection from remote sensing images.
Third, the aerial view perspective in remote sensing images causes the target distortion according to the imaging angle of the satellite sensors and the relative position of the target.With the changes in scale and partial occlusion, the difficulty of the detection task enhances due to the variations of the targets’appearance and structure. Therefore, research on comprehensive features description on ship target and the utilization of imaging property in remote sensing to improve the detection accuracy is still ongoing.
Last but not the least, the problem in ship classification is the lack of a unified classification criterion among different datasets.Besides,affected by cloud cover or surrounding environment, the difference inner the ship classes may be greater than the difference between different ship classes. Few studies perform research on ship classification. And those methods have strict requirements on the completeness of ship extraction as they based on the feature descriptor of shape, texture, and size of ships. Therefore, there is an urgent need to study ship classification in remote sensing images with the continuous improvement of spatial resolution.
All in all,there is still a gap between the current ship detection and classification technology and the practical application.
The upsurge of research on CNN technology leads to massive studies on object detection in optical remote sensing images applied such technique.141Although it makes great progress in object detection tasks in natural scene images,there still are a lot of rooms for improvement when performing in remote sensing images. Structure design that saves time and computational cost are very important in ship detection and classification from optical remotes sensing images.
With the number of publicly available dataset increases,the access for fine-grained labeled ship classes becomes convenient for researchers. These datasets provide a foundation for study on ship classification in aerial view images.
Unlike synthetic aperture radar, optical remote sensing images cannot resist weather conditions. It is an effective way to realize target detection to apply fusion information from different types of sensors.146Research on ship detection and classification based on multi-sourced information is promising in practical application.
6. Conclusions
In this paper,we provided statistics of 153 papers on ship detection and classification from 1978 to July 2020 and introduced their commonly used detection scheme and workflow. In the image preprocessing procedure, sea-land segmentation and cloud filtering are introduced and the applied technologies in these two operations are analyzed. We classified the methods in these papers into two categories: the feature design based methods and the CNN structure design based methods. In the feature design based methods, six basic techniques were mainly adopted in the ship candidate extraction stage;the combination of classifiers with feature sets strategy was generally applied in the ship identification stage. In the CNN structure design based methods, designers usually made improvements in hidden layers while maintaining the backbone structure.There were two classic CNN backbone structures commonly applied in ship detection and classification from optical remote sensing images according to our literature collection. Finally,the detail information of nine public available datasets was listed, which can be applied to testify the ship detection and classification algorithms.Based on the analysis of the methods in these papers,we summarized the current problems and provided the possible future works on ship detection and classification methods for optical remote sensing images.
Declaration of Competing Interest
The authors declare that they have no known competing financial interests or personal relationships that could have appeared to influence the work reported in this paper.
Appendix A.

Table A1 Literature collection of ship detection and classification methods published from 1978 to July 2020.(Literature collection from 1978 to 2016 partially source from Ref.147).
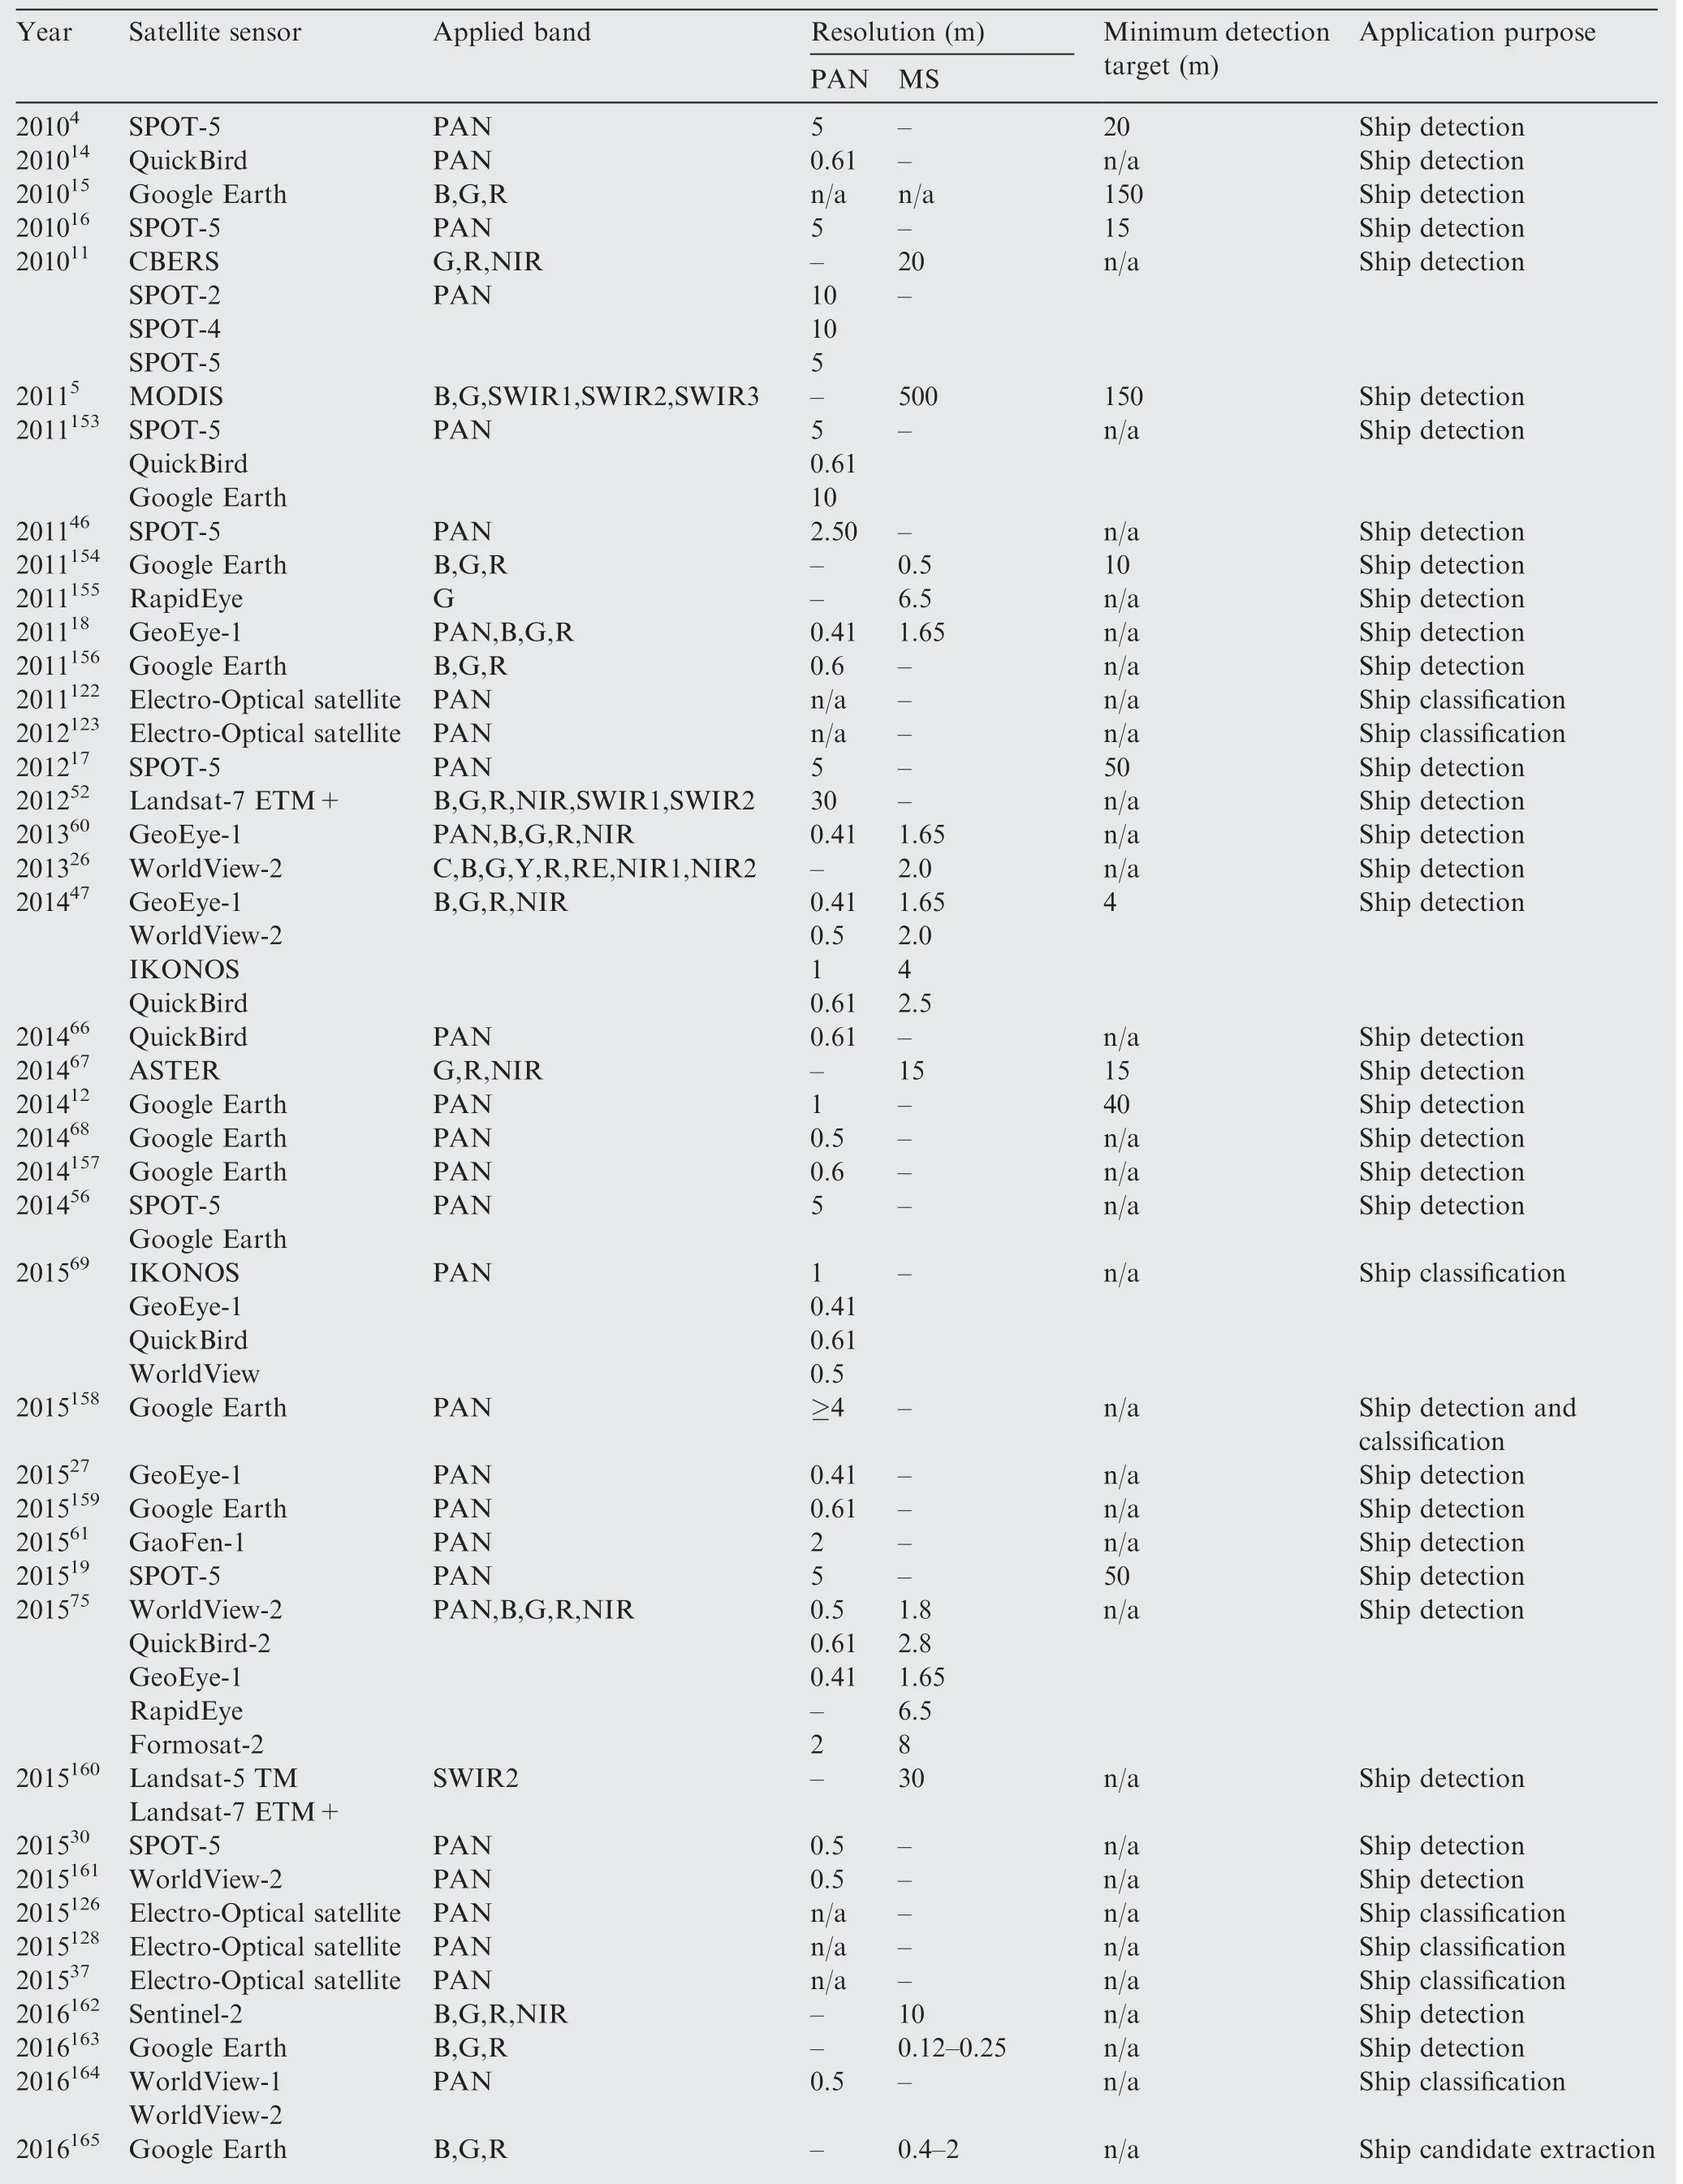
Table A1 (continued)
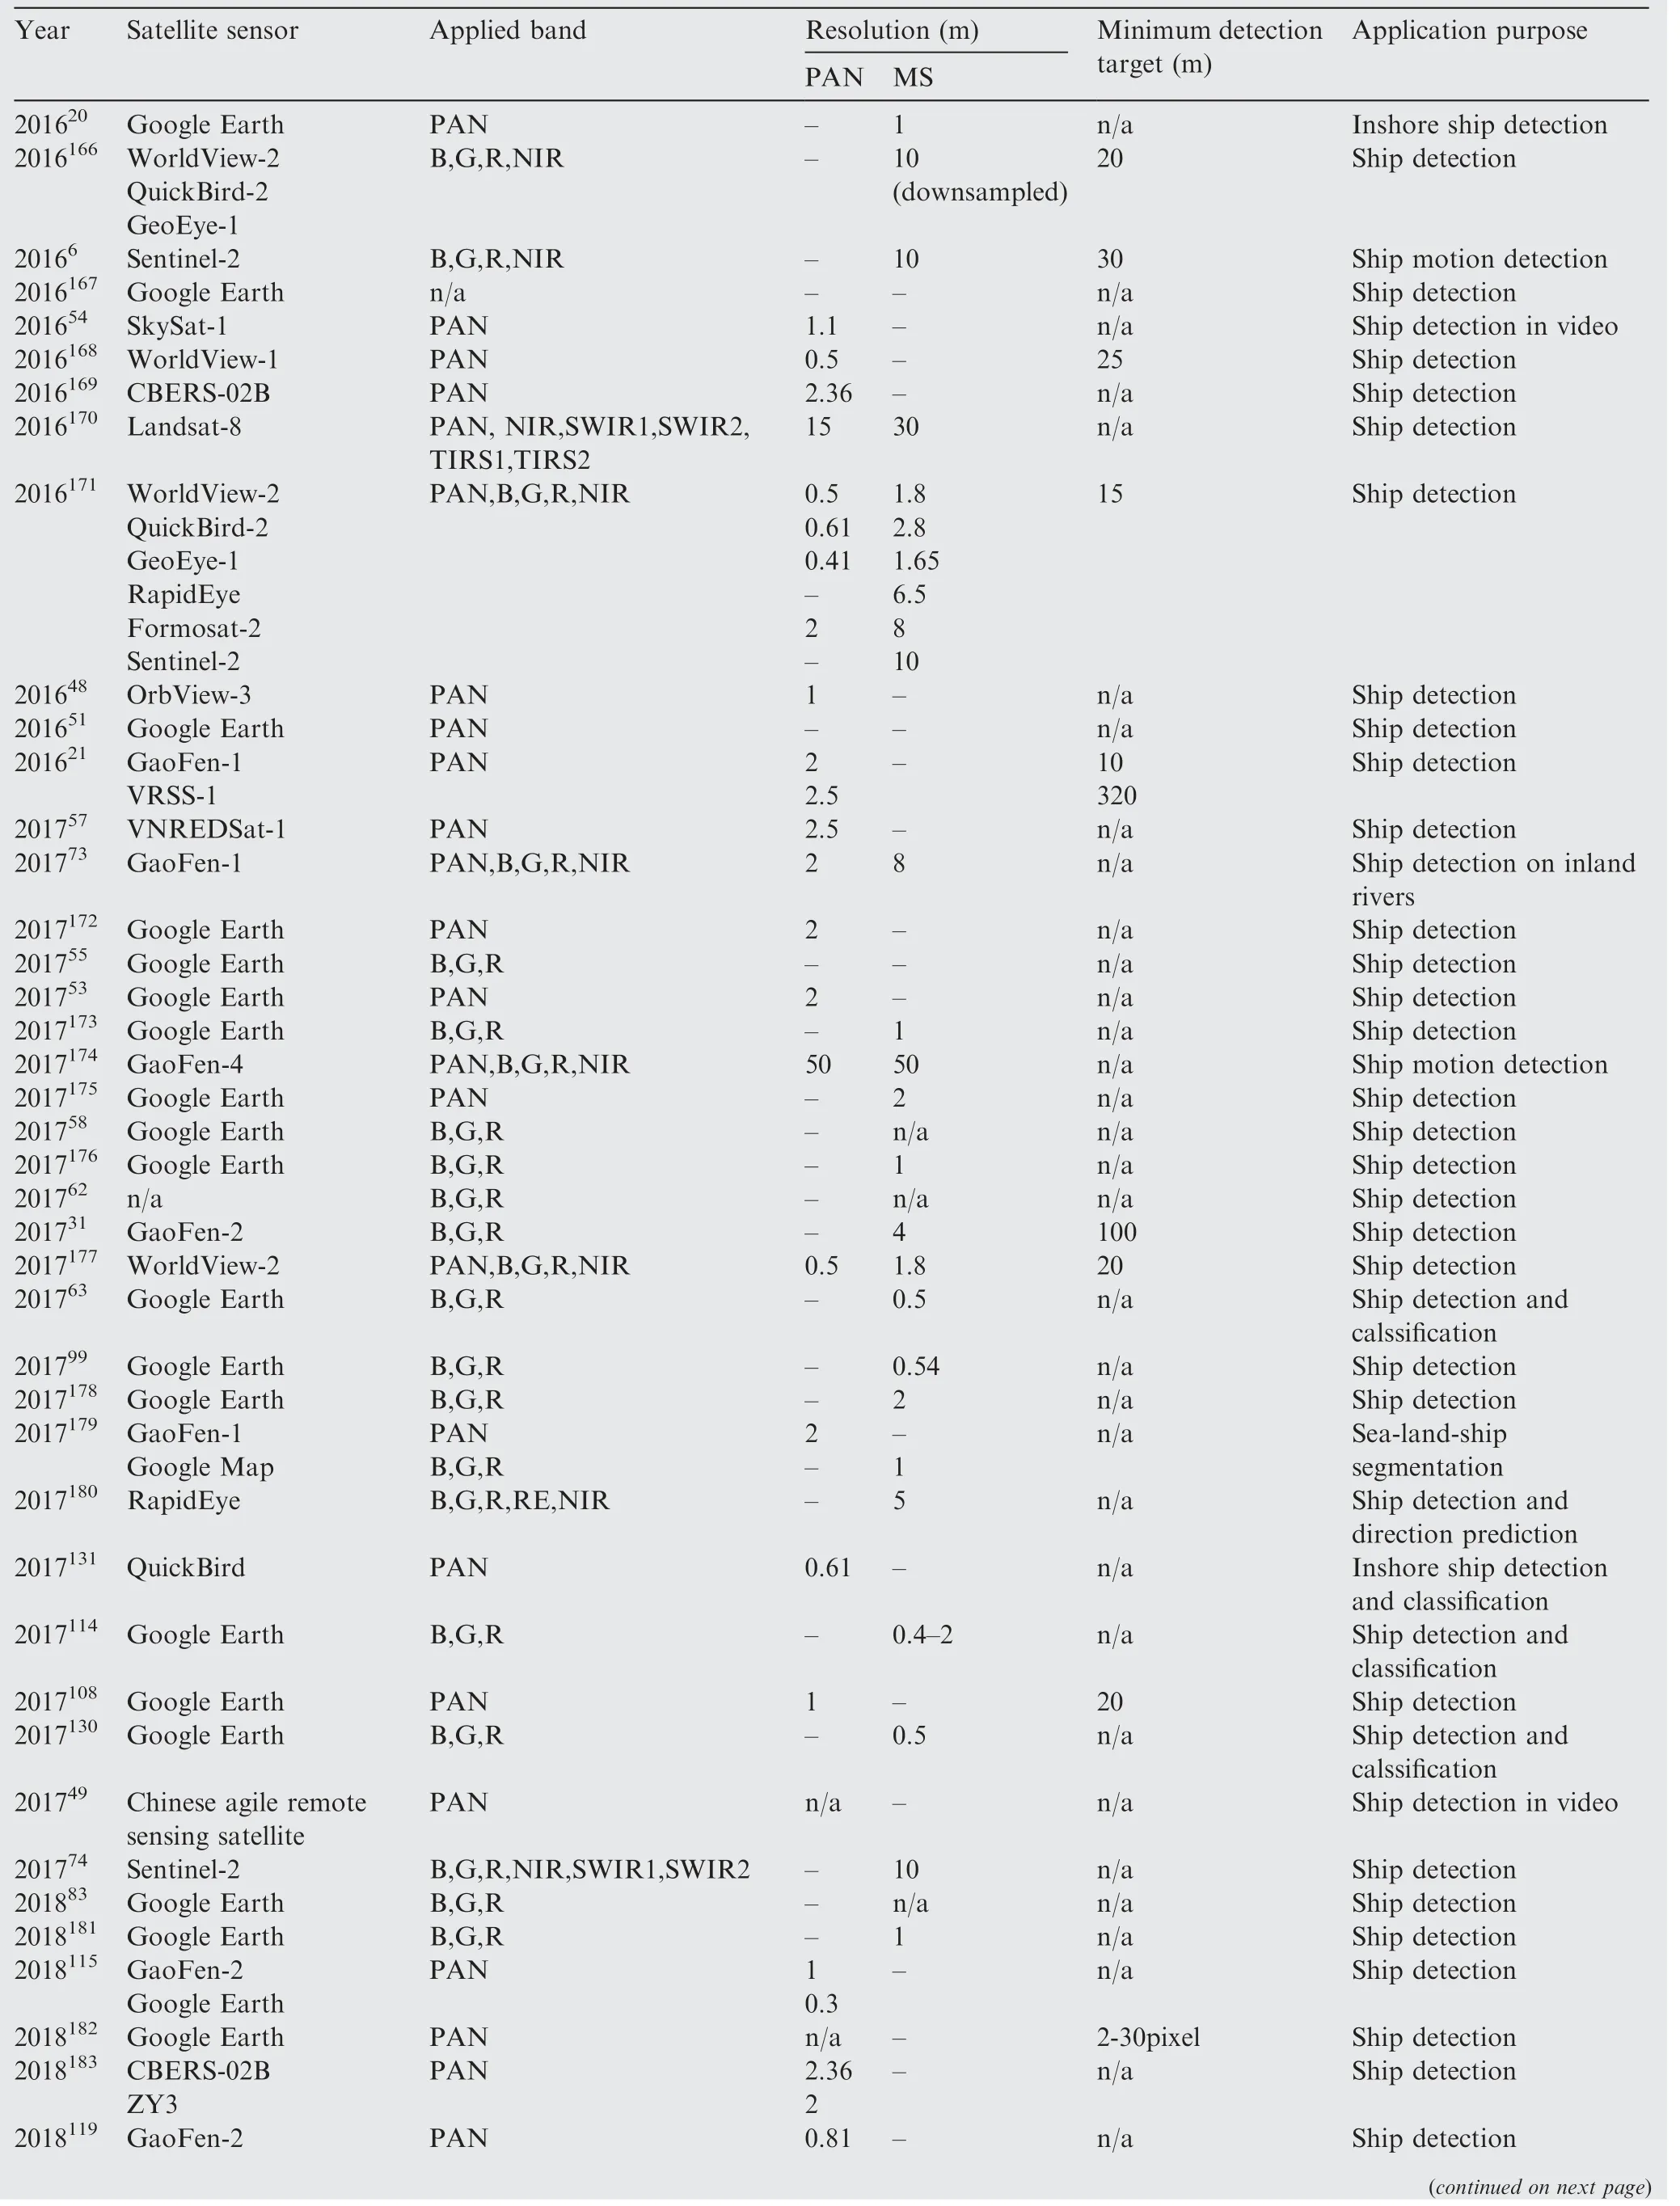
Table A1 (continued)
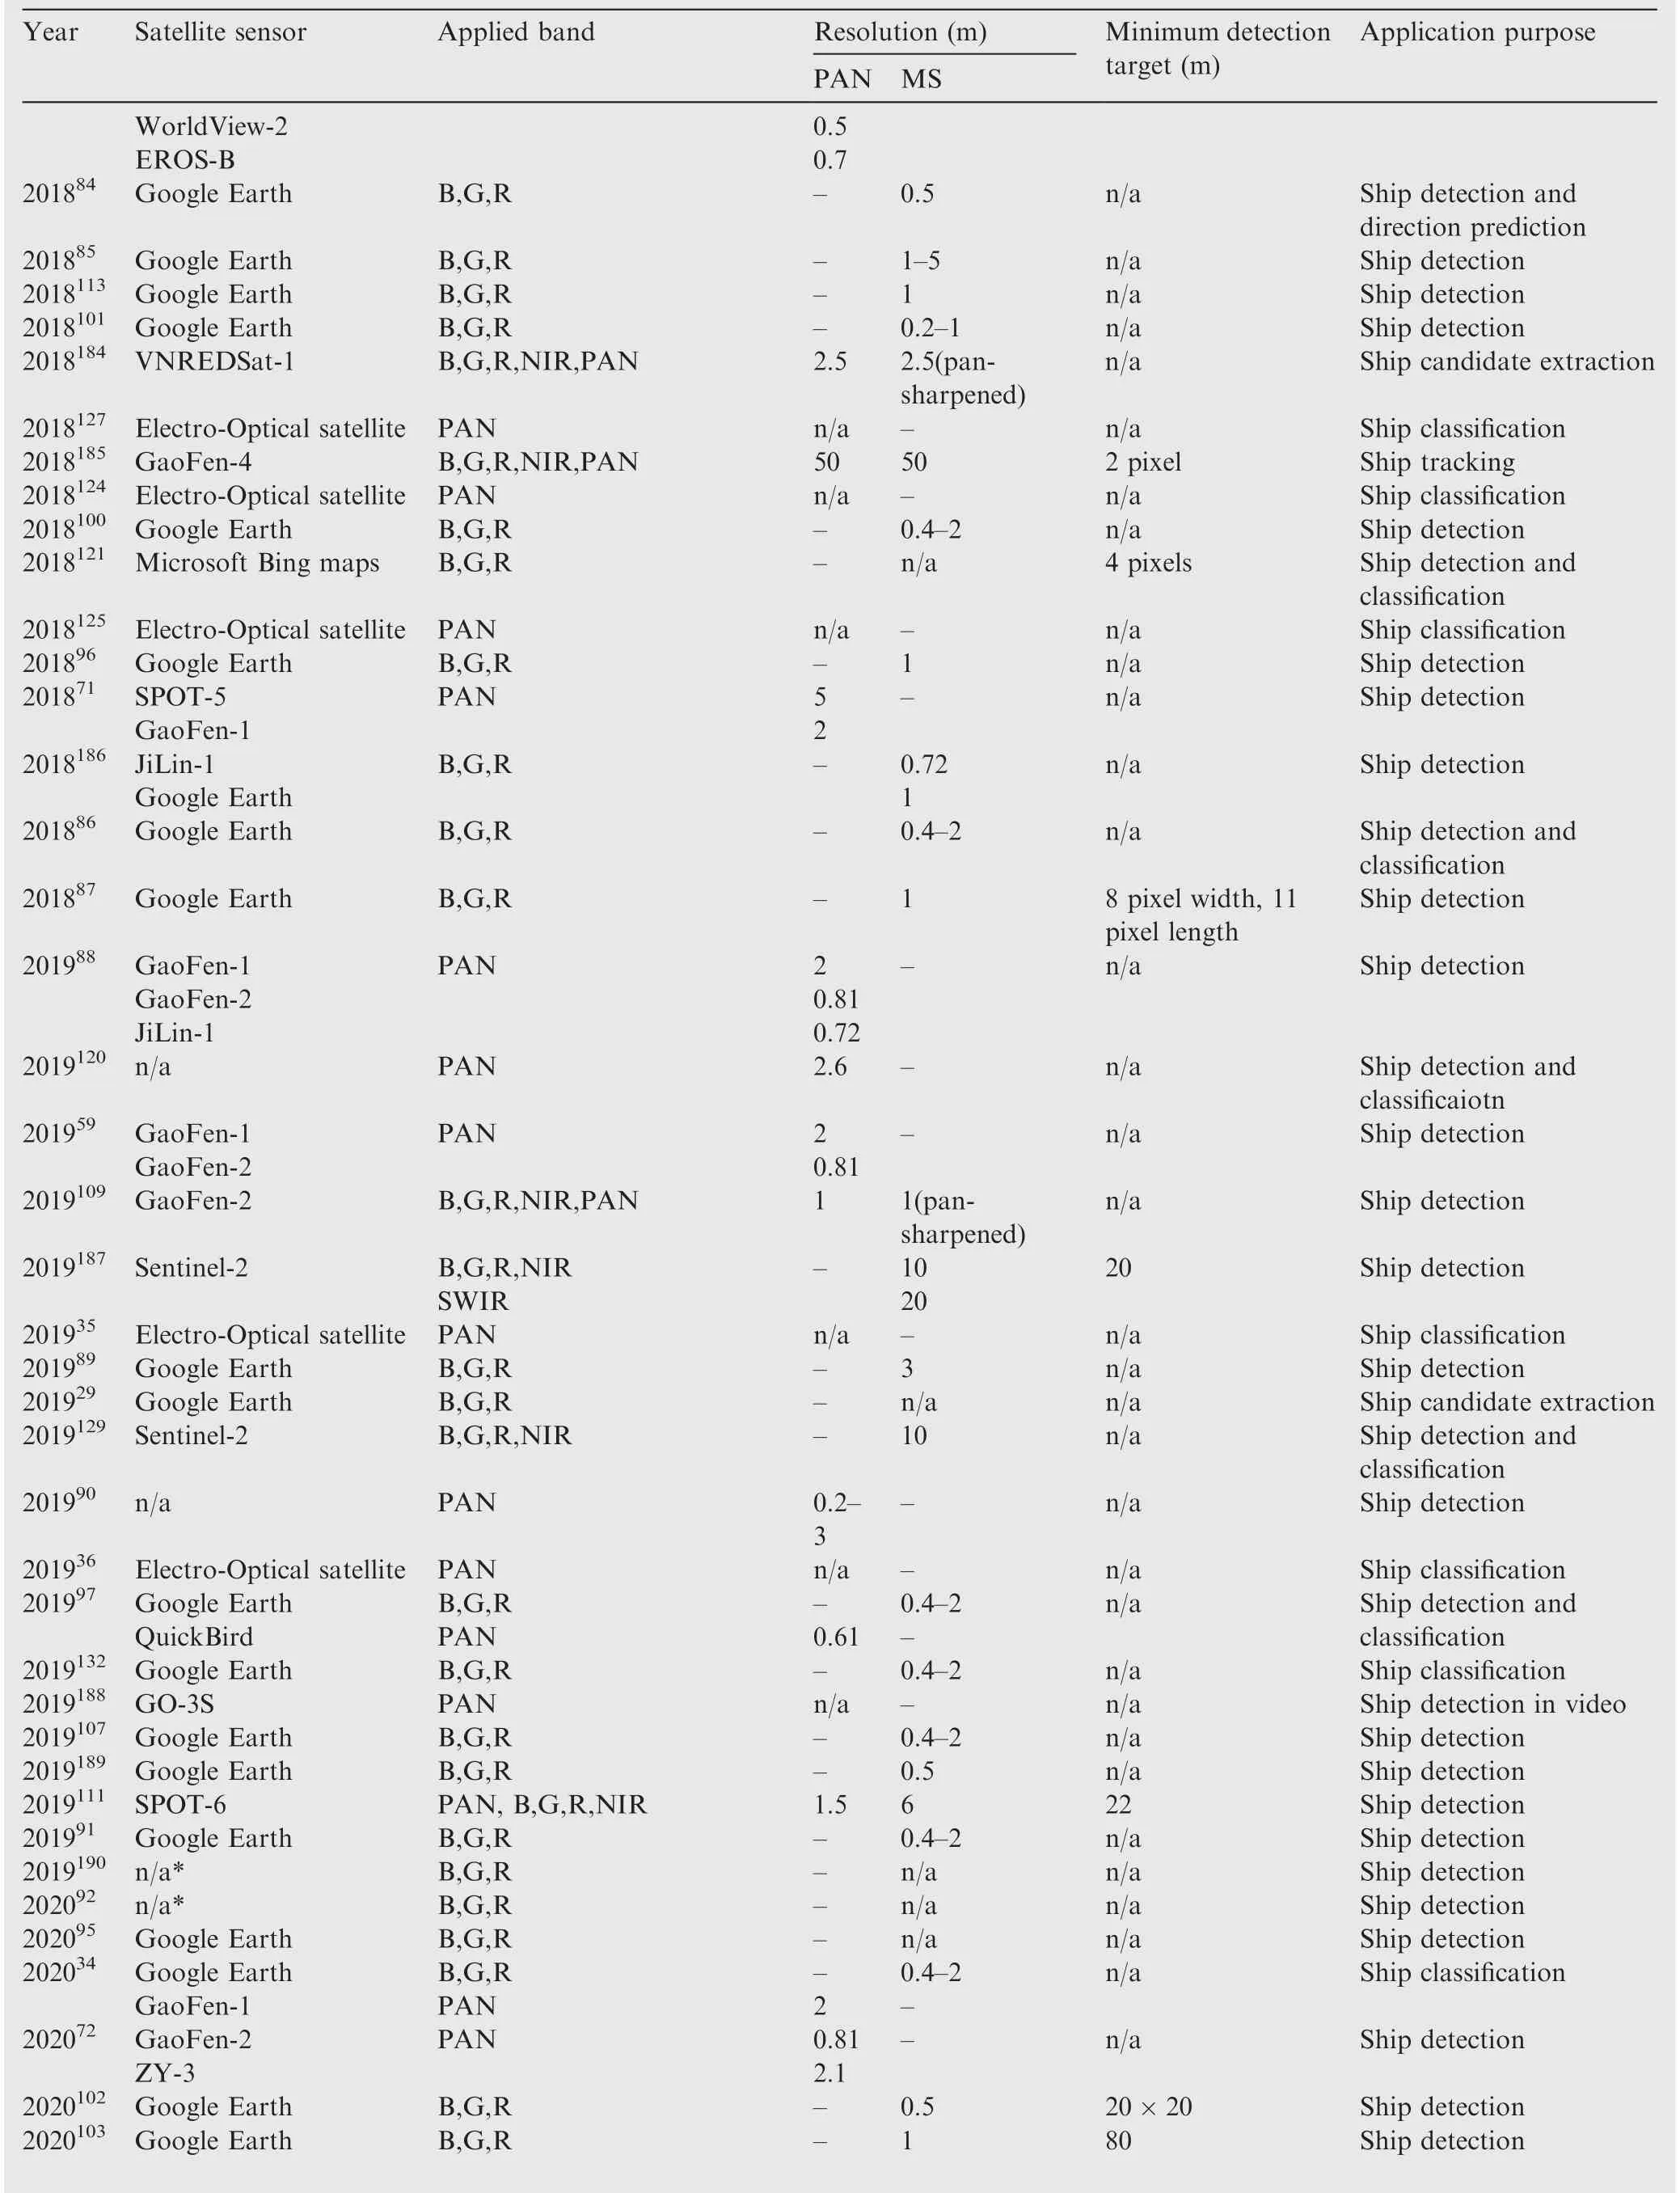
Table A1 (continued)
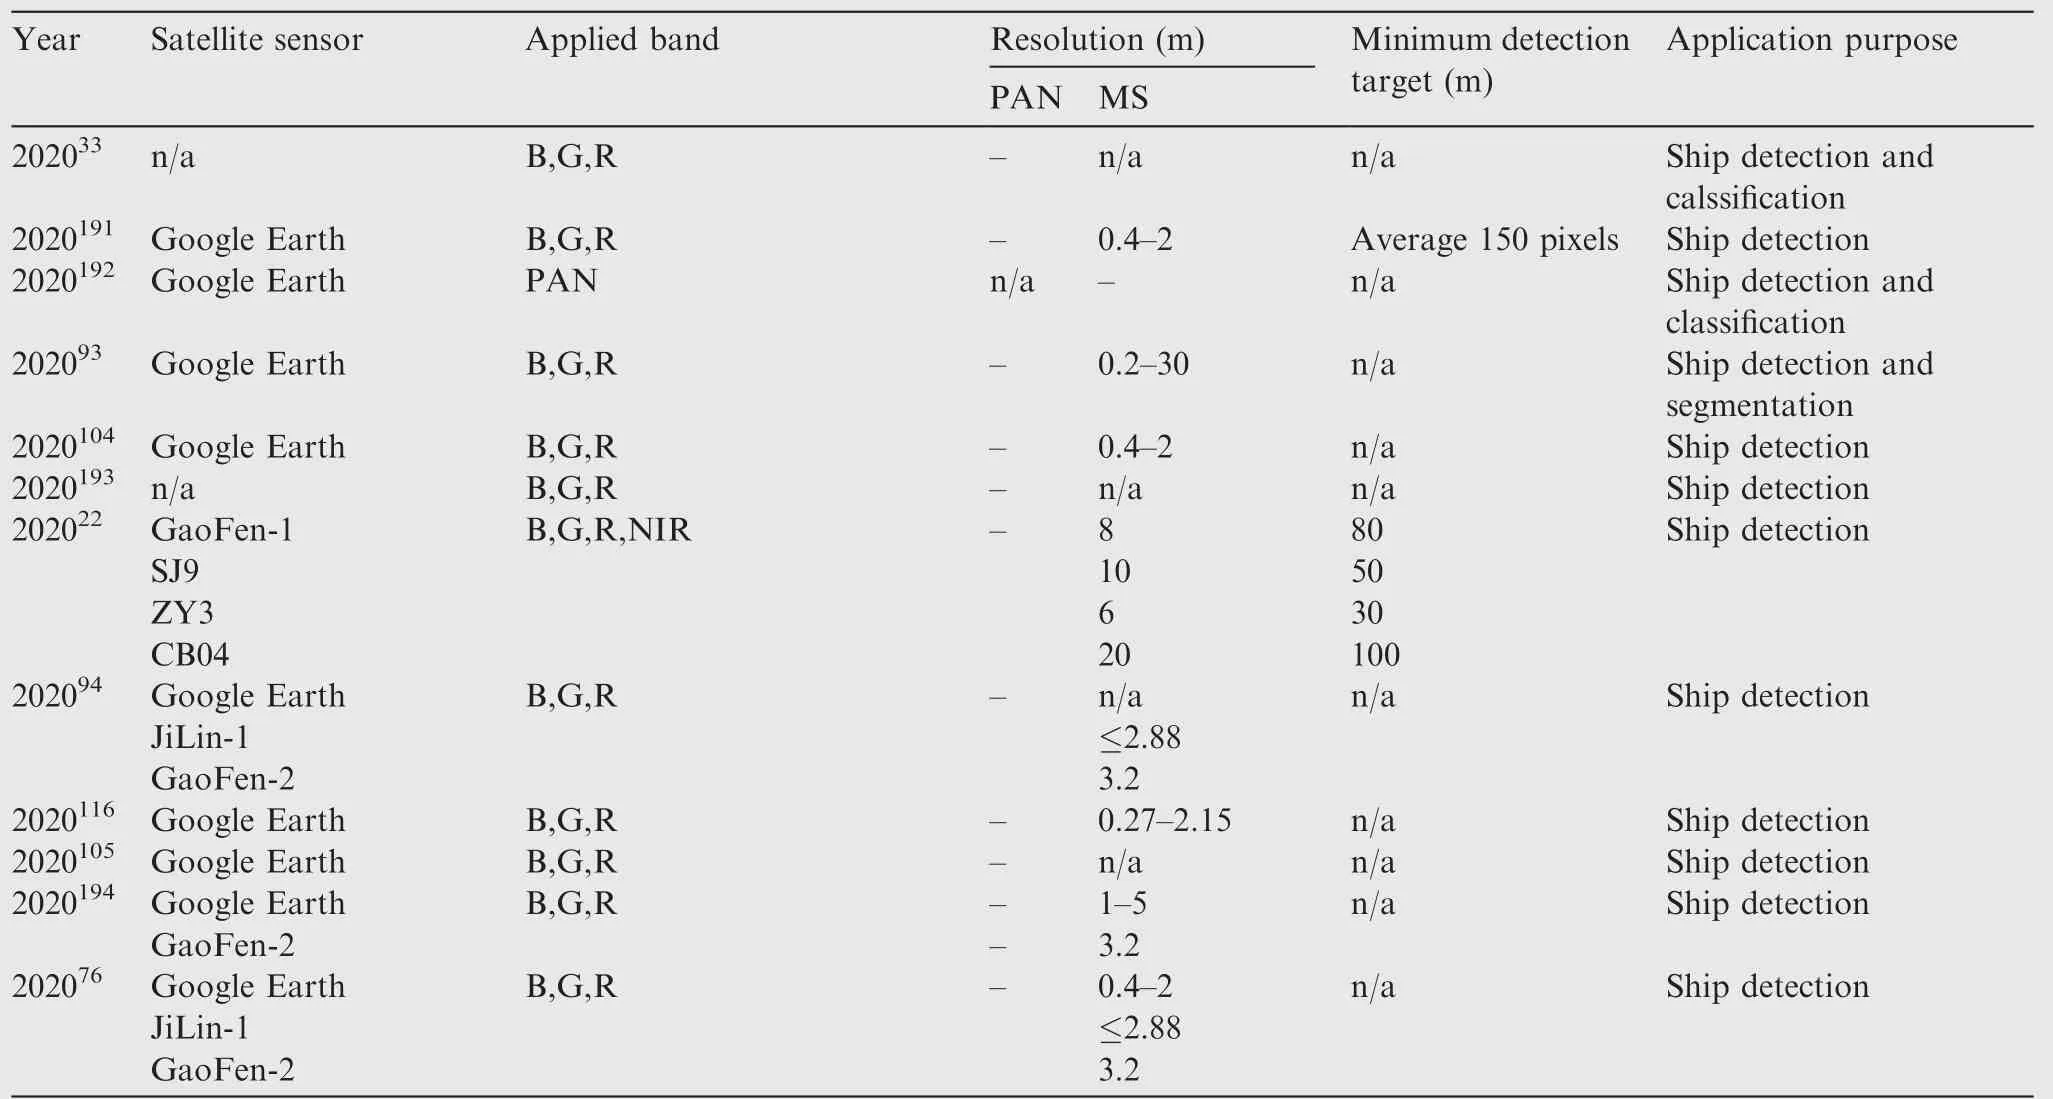
Table A1 (continued)
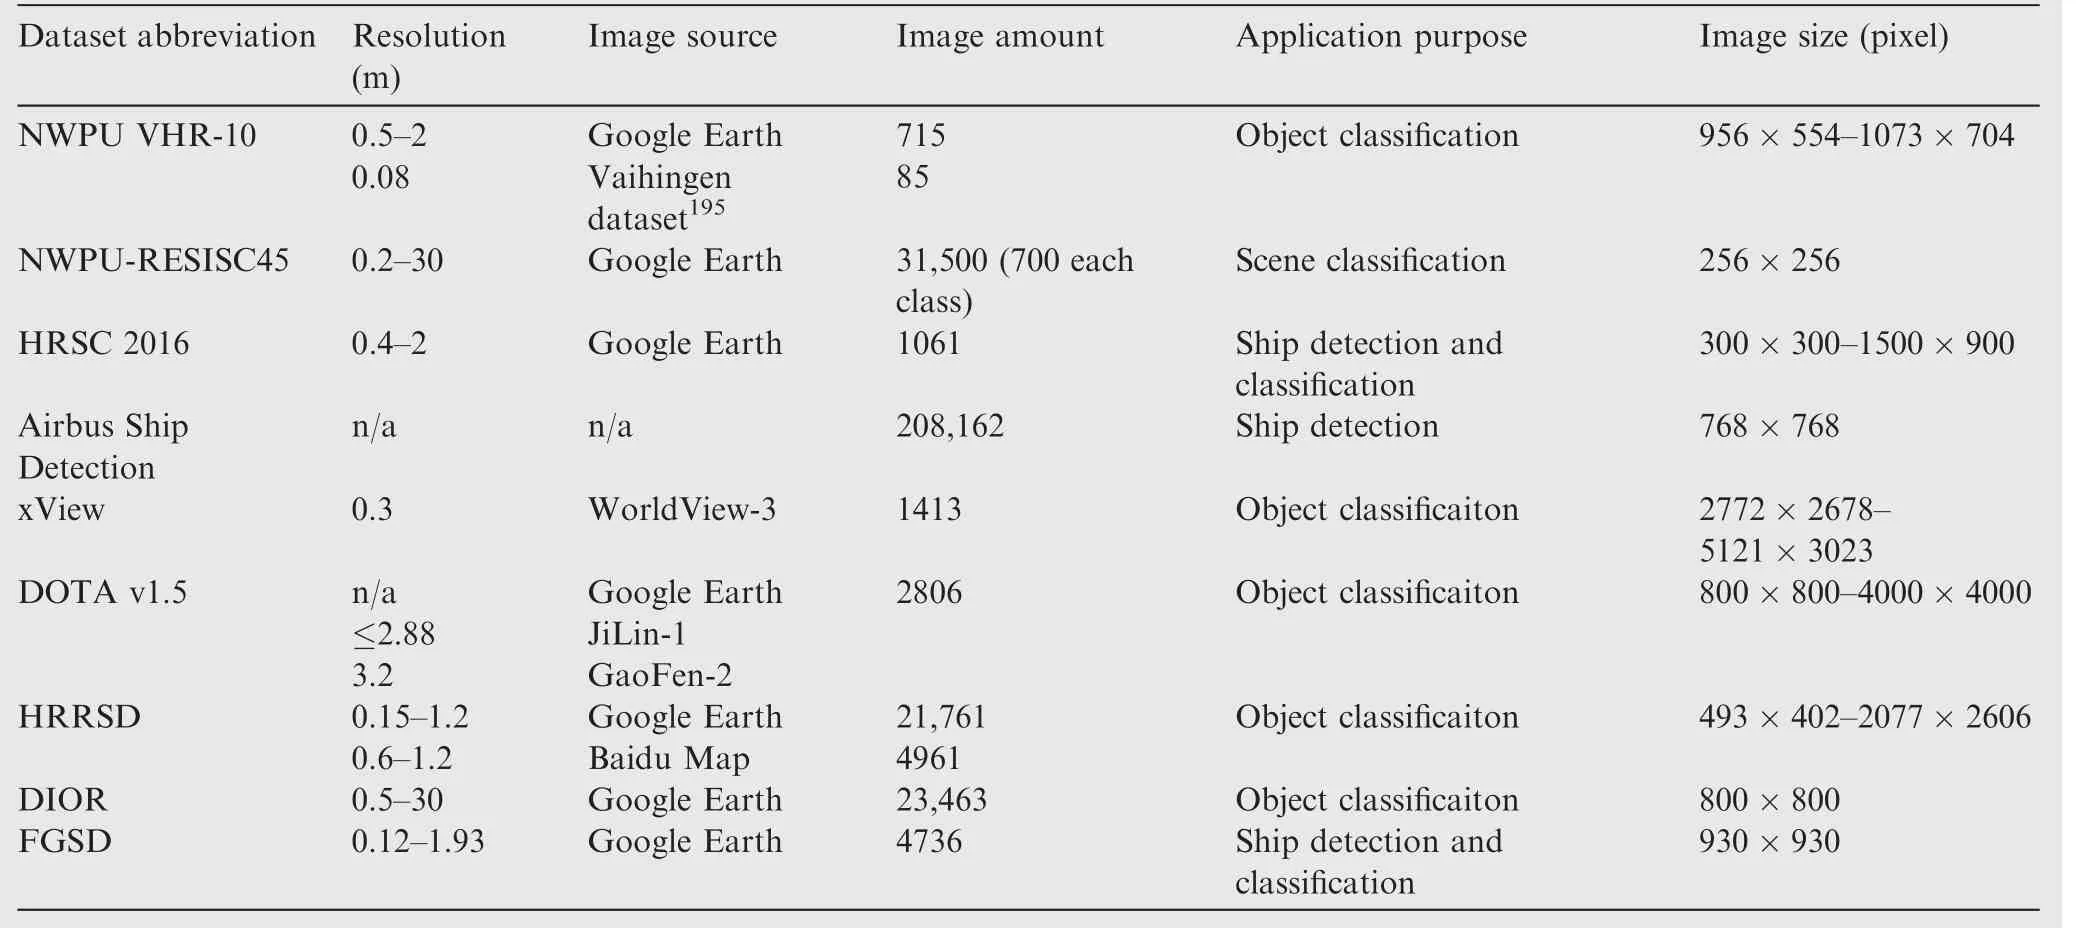
Table A2 Detail information of datasets that can be applied to ship detection.
 CHINESE JOURNAL OF AERONAUTICS2021年3期
- CHINESE JOURNAL OF AERONAUTICS的其它文章
- Criteria for hypersonic airbreathing propulsion and its experimental verification
- Effect of scavenge port angles on flow distribution and performance of swirl-loop scavenging in 2-stroke aircraft diesel engine
- Variational method based robust adaptive control for a guided spinning rocket
- Inertial parameter estimation and control of non-cooperative target with unilateral contact constraint
- Theoretical modeling of vectoring dual synthetic jet based on regression analysis
- Effects of surface roughness on the aerodynamic performance of a high subsonic compressor airfoil at low Reynolds number
