Effect of scavenge port angles on flow distribution and performance of swirl-loop scavenging in 2-stroke aircraft diesel engine
Zheng XU, Fenzhu JI, Shuiting DING, Yunhai ZHAO, Yu ZHOU,Qi ZHANG, Farong DU
a School of Energy and Power Engineering, Beihang University, Beijing 100083, China
b Aircraft/Engine Integrated System Safety Beijing Key Laboratory, Beihang University, Beijing 100083, China
c School of Transportation Science and Engineering, Beihang University, Beijing 100083, China
d Beijing Key Laboratory for High-efficient Power Transmission and System Control of New Energy Resource Vehicle,Beihang University, Beijing 100083, China Received 14 October 2019; revised 31 December 2019; accepted 29 February 2020
KEYWORDS 2-Stroke;Aircraft diesel engine;Computational Fluid Dynamics (CFD);Particle Image Velocimetry(PIV);Scavenge port angles;Swirl-Loop Scavenging(SLS)
Abstract Swirl-Loop Scavenging(SLS)improves the performance of 2-stroke aircraft diesel engine because the involved swirl may not only benefit the scavenging process, but also facilitate the fuel atomization and combustion. The arrangement of scavenge port angles greatly influences incylinder flow distribution and swirl intensity, as well as the performance of the SLS engine. However, the mechanism of the effect and visualization experiment are rarely mentioned in the literature. To further investigate the SLS, Particle Image Velocimetry (PIV) experiment and Computational Fluid Dynamics(CFD)simulation are adopted to obtain its swirl distribution characteristics, and the effect of port angles on scavenging performance is discussed based on engine fired cycle simulation. The results illustrate that Reynolds Stress Turbulence model is accurate enough for in-cylinder flow simulation. Tangential and axial velocity distribution of the flow, as well as the scavenging performance,are mainly determined by geometric scavenge port angles αgeom and βgeom. For reinforcement of scavenging on cross-sections and meridian planes, αgeom value of 27° and βgeom value of 60° are preferred, under which the scavenging efficiency reaches as high as 73.7%.Excessive swirl intensity has a negative effect on SLS performance,which should be controlled to a proper extent.
1. Introduction
Compared to conventional and mature 4-stroke cycle, the 2-stroke cycle has been proven to be an effective scheme for aircraft diesel engines in the last few decades due to high power density.1The crankshaft speed and thermal efficiency are developed as high as possible to pursue high power-to-weight ratio and low specific fuel consumption,which requires high-qualified scavenging process as improper scavenging strategy may influence the initial condition for the combustion process, thus deteriorate the fuel economy, output power and emission.2
Generally, there are three types of scavenging configurations: cross-flow, uniflow and loop scavenging, among which the scheme of uniflow scavenging with exhaust poppet valves and loop scavenging with piston-controlled ports are commonly used.3In contrast to uniflow scavenging, loop scavenging demonstrates lower mechanical loss and a more compact structure, as well as better cylinder permeability.4However,the engine performance with loop scavenging is usually unsatisfactory due to the low scavenging efficiency and no incylinder swirl involved, which affects fuel atomization and combustion.5Therefore, it seems pretty necessary to improve scavenging efficiency and seek the possibility of organizing swirl for loop scavenging.6
Currently, to investigate the impact of swirl on scavenging efficiency and engine performance,researchers mainly focus on the swirl in uniflow scavenging.7,8Ingvorsen et al.9,10studied the flow dynamics of weak and strong swirls in a uniflow scavenging cylinder and adopted Laser Doppler Anemometry(LDA) to measure axial velocity, as well as investigate the influence of swirl number by changing the port angles. Ma and Wu et al.11,12analyzed the influence of port angle on swirl intensity and uniflow scavenging efficiency, and the tracer gas method is used to measure the scavenging performance. Hemmingsen et al.13investigated the turbulent swirling flow in a uniflow-scavenged 2-stroke engine by Computational Fluid Dynamics (CFD), and compared large eddy simulation approach and Reynolds-Averaged Navier-Stokes approach.Schnipper et al.14,15employed Particle Image Velocimetry(PIV)to test and analyze the swirling flow of uniflow scavenging in 2-stroke marine diesel engines, which was consistent with the numerical results.However,in the aspect of loop scavenging,there are few literatures that mention the organization of swirl to improve engine performance.16Goldsborough and Van Blarigan17,18proposed a Swirl-Loop Scavenging (SLS)method,or called hybrid-loop scavenging.The scavenging flow forms swirl along the cylinder wall, reaches cylinder head and then returns along the cylinder axis to the exhaust port. Bai et al.19modified loop scavenging to SLS configuration by increasing ports number,which can improve the engine power by 11%. Accordingly, moderate swirl not only benefits the high efficiency of scavenging process, but also facilitates the mixing of injected fuel and fresh air, which contributes to the consequent combustion. Furtherly, the swirl accelerates the cooling of the cylinder wall, which averages temperature distribution and thus avoids thermal deformation. Moreover,the structure parameters of scavenge ports greatly influence the flow distribution of in-cylinder swirl. For instance, variation of port angles adjusts the swirl with different directions and intensities, which affects the scavenging process and engine performance obviously.As a result,it is of considerable significance to obtain the optimal values of scavenge port angles. LDA and PIV visualization experiments are usually performed to measure the velocity distribution of swirl influenced by port angles,and to validate the accuracy of CFD simulation. However, the influence of scavenge port angles on swirl distribution and scavenging performance of the SLS engine is rarely investigated yet. Moreover, the visualization experiment of SLS engine is also scarce. Therefore, it is necessary to perform further investigation on these aspects to improve SLS performance and take advantage of the compact and lighter loop scavenging scheme in 2-stroke aircraft diesel engines. As the in-cylinder swirl in SLS engine is bidirectional and distinguishing with the unidirectional swirl in uniflow scavenging,the investigation of SLS flow distribution and port angles optimization is particular and meaningful.
To develop the SLS configuration,this paper designs a PIV experimental system, which contains flow system and test system, to investigate the swirl distribution under different scavenge port angles. In addition, as simulation result of swirl distribution is pretty sensitive to different turbulence models,the paper discusses the applicable turbulence model for CFD simulation, and study the effect of scavenge port angles on flow distribution and scavenging performance.20It is desirable and significant to obtain the optimal scavenge port angles in SLS engine and promote the loop scavenging to be used in 2-stroke aircraft diesel engines.21The rest of this paper is organized as follows. Section 2 illustrates the SLS model and PIV experimental scheme. Section 3 discusses the CFD simulation method for swirl distribution and makes a simulation case for engine fired cycle. Section 4 shows the result of PIV and CFD simulation and discusses the influence of port angles on tangential velocity and axial velocity distribution of SLS engine, as well as analyzes their effect on scavenging performance. This is followed by the concluding remarks in Section 5.
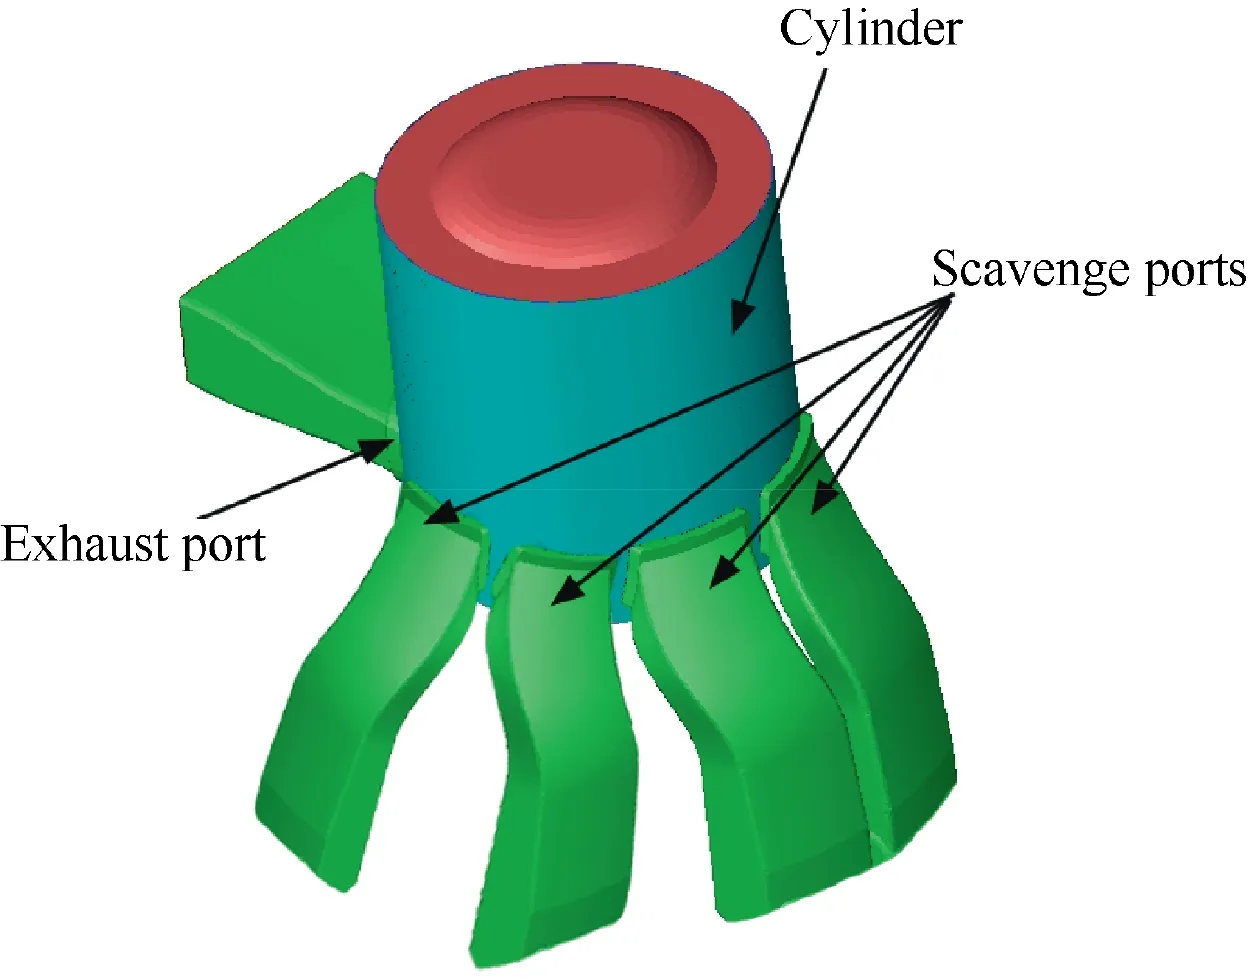
Fig. 1 SLS configuration of actual engine.
2. PIV experiment
2.1. Model description
2-stroke aircraft diesel engine based on SLS configuration adopts four scavenge ports, one exhaust port, direct-injection and bowl-shape combustion chamber, as illustrated in Fig. 1.The geometric and operating parameters of the engine are shown in Table 1. The ‘‘ATDC” means ‘‘After Top Dead Center”.
The PIV model of the SLS configuration and model parameters are shown in Fig. 2. To acquire uniform in-cylinder flow and clear characteristics of tangential and axial velocities,scavenge and exhaust ports are arranged circumferentially in the PIV model. The exhaust ports are set up below the scavenge ports for the convenience of PIV test, whose influence on incylinder velocity distribution has been validated minimal and negligible in the CFD simulation. Scavenging flow generates swirl along the cylinder wall to the head, and returns to thebottom as inside swirl, hence the scavenging swirl is bidirectional.22The cylinder model has a total height of H and a diameter of D. A conical shell is installed as inlet (scavenge ports), and the half cone angle is defined as αgeom. Twenty adjustable guide vanes, with the installation positions parallel to the cylinder axis, are fixed in the conical shell to generate strong swirl circumferentially and uniformly. In the top view,the angle between guide vane and radial plane is defined as βgeom. The cylindrical coordinate system (r, θ, z) is adopted,with the origin located at the center of cylinder top.The outlet(exhaust ports) consists of several square holes, which are circumferentially and uniformly distributed on the sidewall near cylinder bottom. The heights of scavenge and exhaust ports are Hinand Houtrespectively. Hmidis the distance between them. Different installation types of guide vanes can change the values of αgeomand βgeom, and thus the effects of αgeomand βgeomvariation on swirl distribution are studied.
The swirl number Sn23is commonly adopted to define swirl intensity. This paper uses geometric swirl number Sgeomto estimate Sn.24Assumed that the intake flow runs strictly along the geometric direction of the guide vanes, the axial flux of tangential momentum Gθand the axial momentum flux Gzcan be expressed as Gθ=ρUr,geomAinUθ,geomr, and Gz=ρUr,geomAinUz,geomrespectively, where Ur,geom, Uz,geom,Uθ,geomand Ainrepresent radial, axial, and tangential velocity of the inlet, as well as inlet area respectively. ρ is the flow density.According to the geometric relationship, the parameters have the following relationship:

It can be seen that αgeomand βgeomdetermine the direction of cylinder inlet velocity, and they are called geometric scavenge port angles. Therefore, geometric swirl number Sgeomcan be expressed as:

Considering Eq. (2), Sgeomcan be further expressed as:
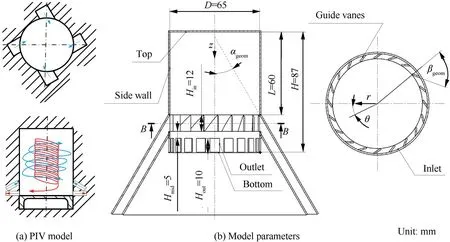
Fig. 2 PIV model of SLS configuration and model parameters.
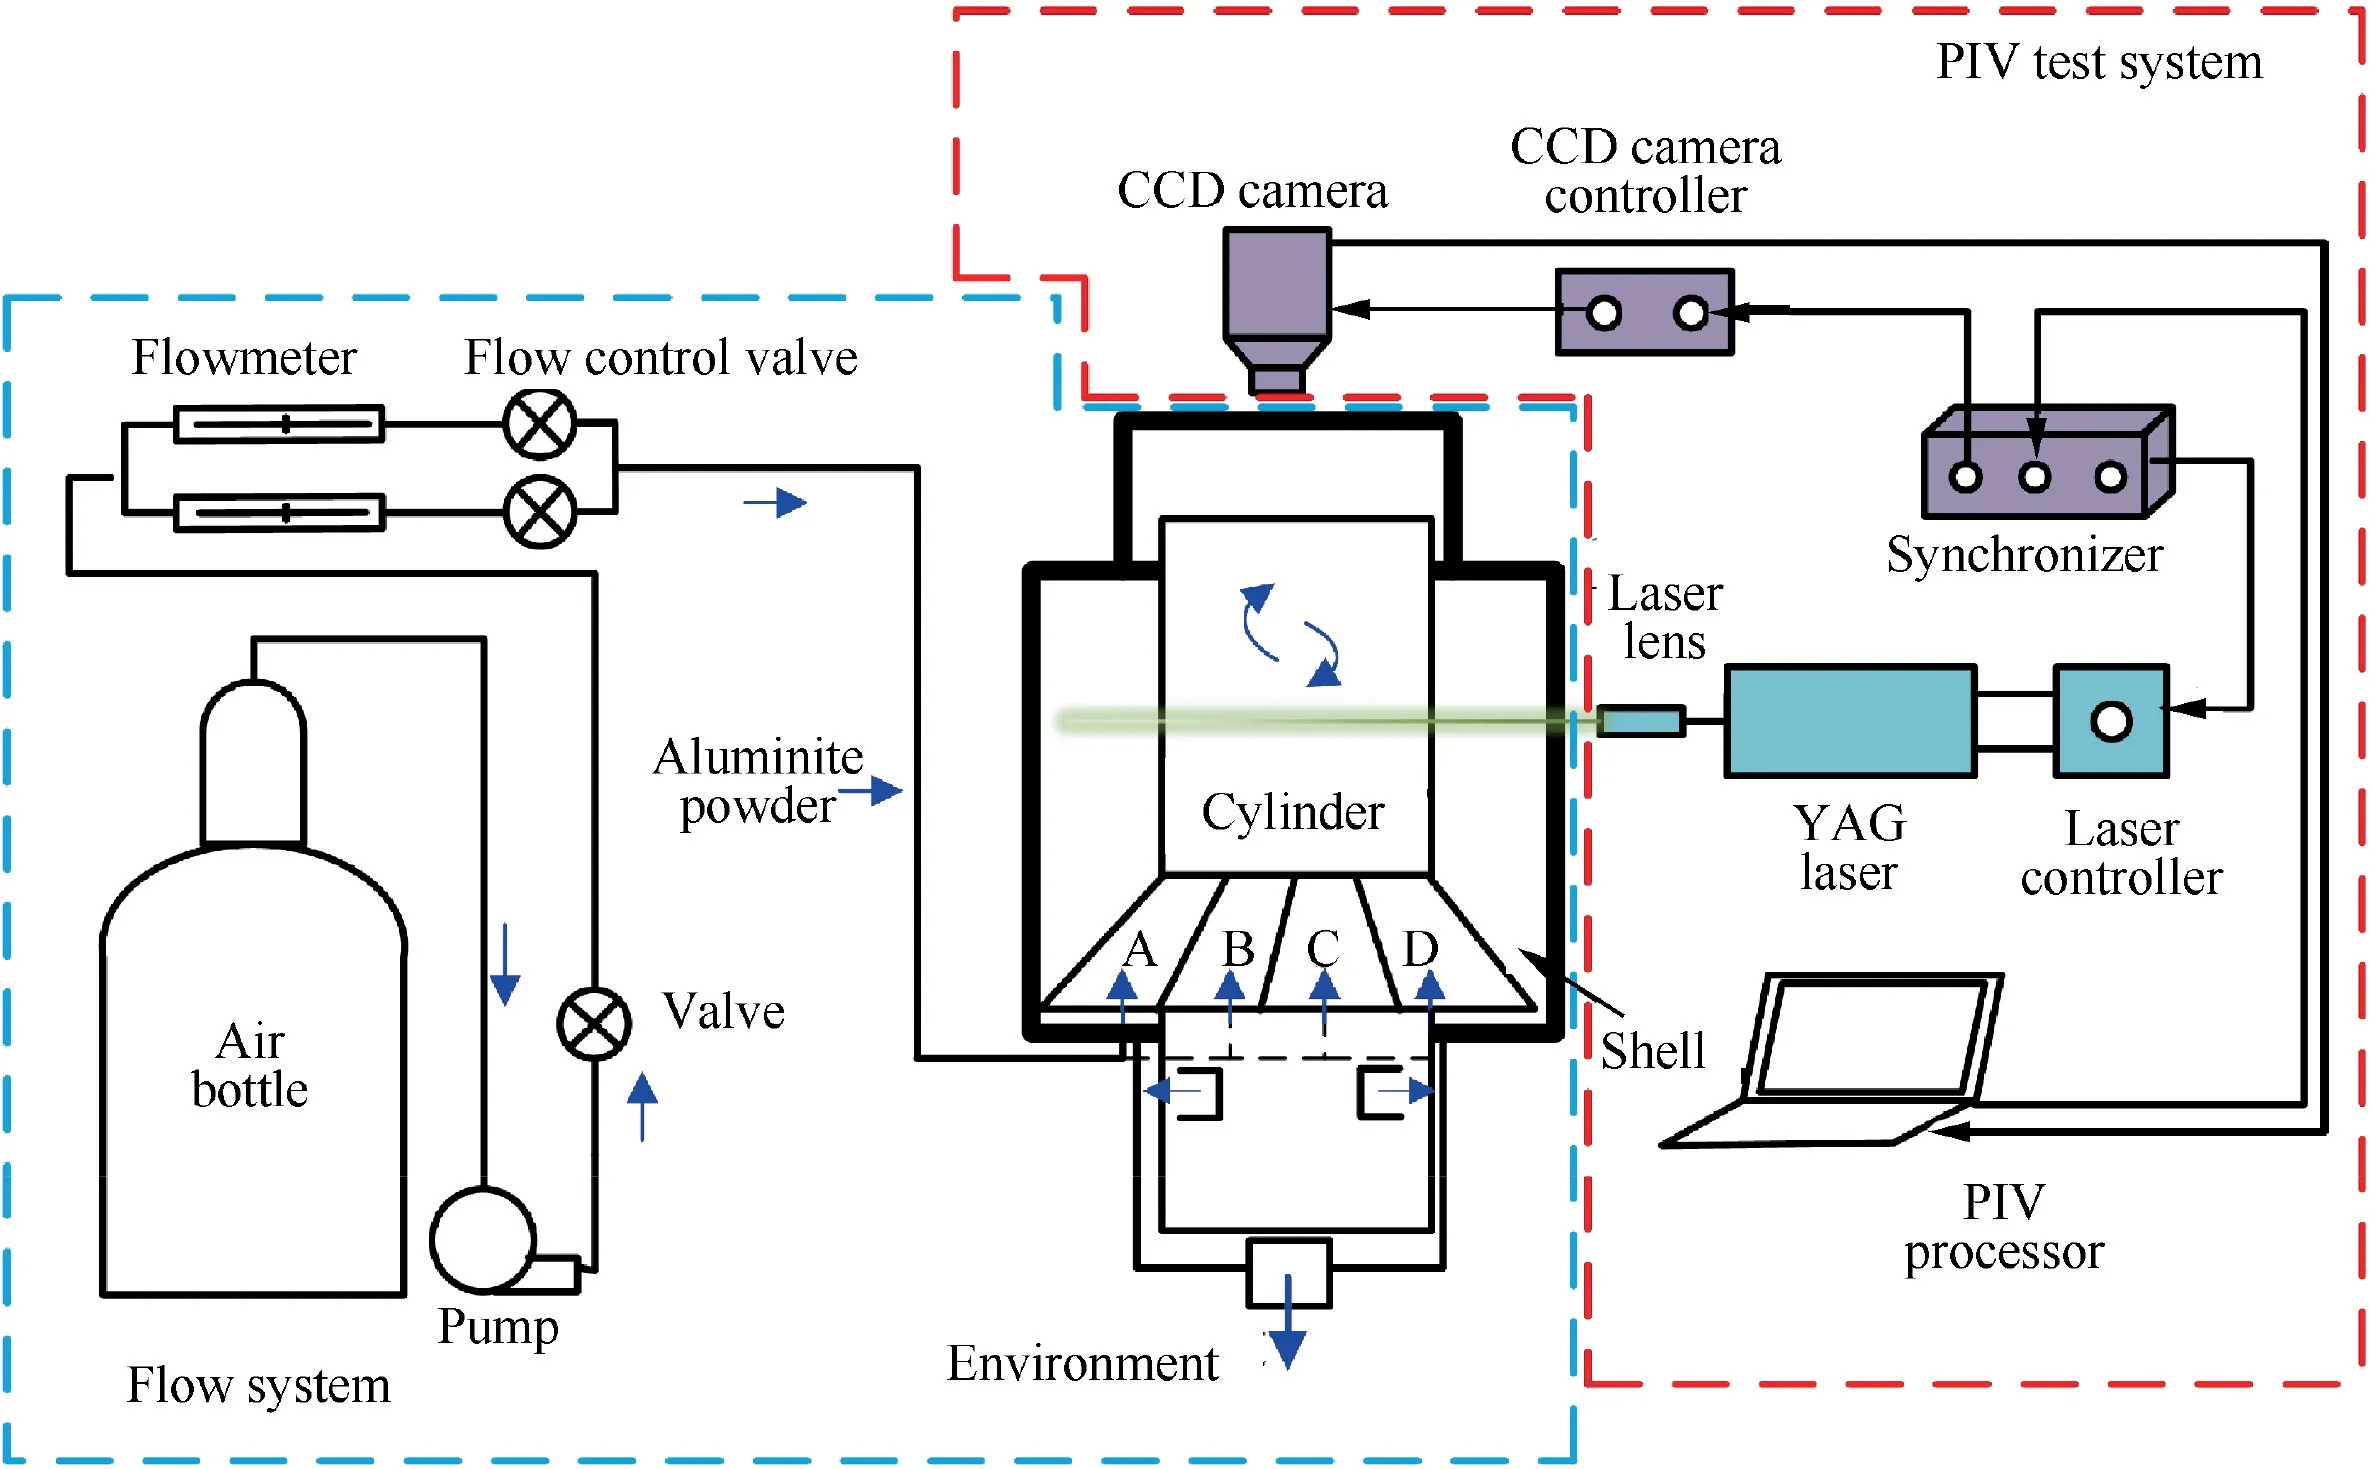
Fig. 3 Schematic diagram of PIV experimental system.

where Sgeomcan be completely determined by the αgeomand βgeom.
2.2. PIV experimental system
The PIV experimental system is displayed in Fig.3.The entire system includes flow system and PIV test system.The flow system takes air as working fluid and aluminite powder as tracer particle.25
The pump drives air entering the flow system, with a valve to adjust mass flow rate. The air firstly flows into two parallel flowmeters with different measurement ranges. Flow control valves adjust the flow rate into each flowmeter to improve the measurement accuracy. The volumetric flow rate of the air is adjusted to 3 L/s and the error is within ±5%. Coming out from flowmeter, the air is symmetrically divided into four axis-symmetric pipes A,B,C and D respectively, and then the air enters shell and cylinder through guide vanes.The cylinder and shell in PIV model are assembled as shown in Fig. 4.Although the PIV model neglects piston movement system and exhibits some differences from the actual conditions, it is able to analyze the variation of flow velocity distributions with the change of the port angles.
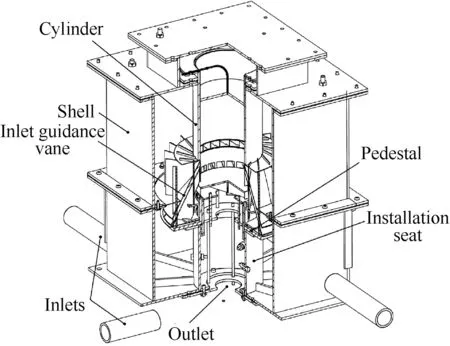
Fig. 4 Assembly of cylinder and shell in PIV model.
The LaVision two-dimensional PIV test system includes YAG laser, CCD camera, laser controller, CCD camera controller and synchronizer. The flow distribution of crosssection at z/L=1/2 position (C3 plane mentioned below)and meridian plane (θ=0°) are measured. The Camera should be perpendicular to the measuring surface when working.26Hence,on one hand,camera is arranged above the cylinder when measuring C3 cross-section, with the shooting direction coaxial to the cylinder axis.On the other hand,when measuring meridian plane, the camera can be moved to the side of the cylinder.The shooting direction is adjusted perpendicular to the cylinder axis and measured meridian plane, as exhibited in Fig. 5. The high-speed CCD camera and YAG laser are synchronized by the synchronizer and software DaVis 8.0 is adopted to deal with the images. In the PIV experiment,the CCD camera and PIV monitor are launched firstly and focal length is adjusted to make the image clear.Then,the calibration board is used to calibrate the capture parameters of the camera, and continuous adjustments are conducted to make the images of calibration board center and areas around clear enough. Finally, the flow system and YAG laser start to work,and then laser intensity,as well as the angles of laser arm and lens are altered until the particle image is displayed clearly.Moreover, the particle quantity should be controlled to gain better tracking features and uniform distribution. The laser controller plays a significant role in the control of the laser pulse interval when CCD camera controller adjusts the frame rate.The laser pulse interval is determined by the flow velocity,which is from 550 μs to 1600 μs on cross-section measurement,and 1000 μs to 3000 μs on meridian-plane measurement respectively. The particle images of flow distribution in crosssection and meridian-plane are illustrated in Fig.6.The shooting frequency of camera is 5 Hz. For each test point, 300 images are taken for averaging. After the acquisition of particle images, cross-correlation analysis is adopted to deal with PIV images and obtain velocity vector distributions.27
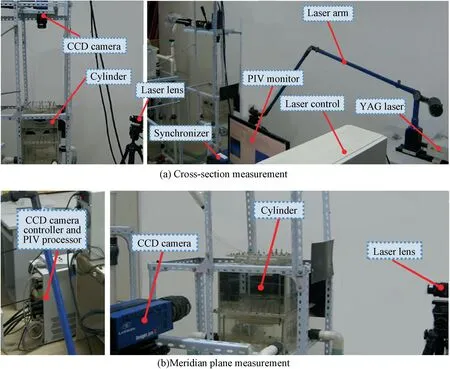
Fig. 5 Modules of PIV test system and different camera locations.
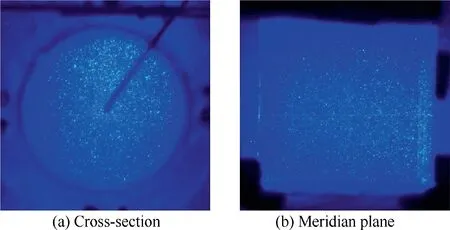
Fig. 6 Particle images of flow distribution in cross-section and meridian plane.
3. CFD simulation
3.1. Swirl simulation model
A CFD numerical model is established to investigate the incylinder swirl distribution and the influence of port angles,which adopts compressible viscous model and finite volume method to solve the control equations. ANSYS FLUENT software is used as the simulation software.
The turbulence model has a significant influence on swirl simulation results.Several approaches have been used and discussed in the literature.28,29In order to balance both model predictive ability and computation cost,the simulation adopts Reynolds-average equation as the solution equation. Both k-ε model and Reynolds Stress Model (RSM) are based on the Reynolds-Averaged Navier-Stokes (RANS) equation. In rectangular coordinates system, RANS can be expressed as30:
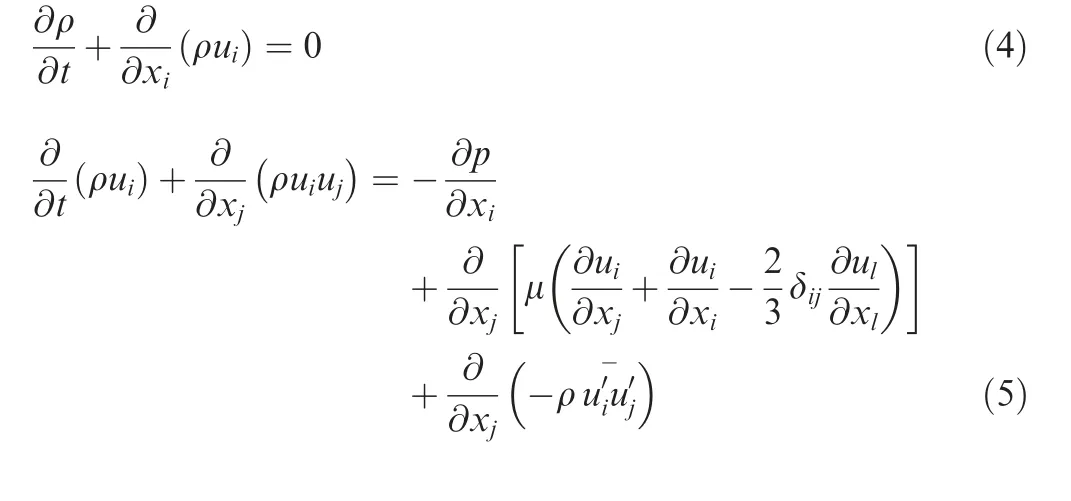
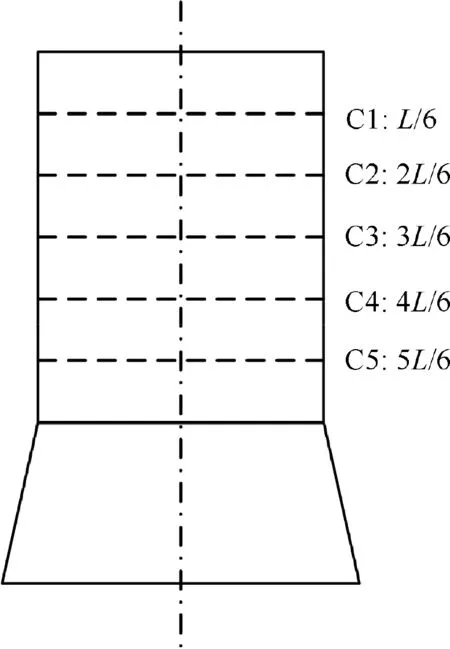
Fig. 7 Position of cross-sections C1-C5.
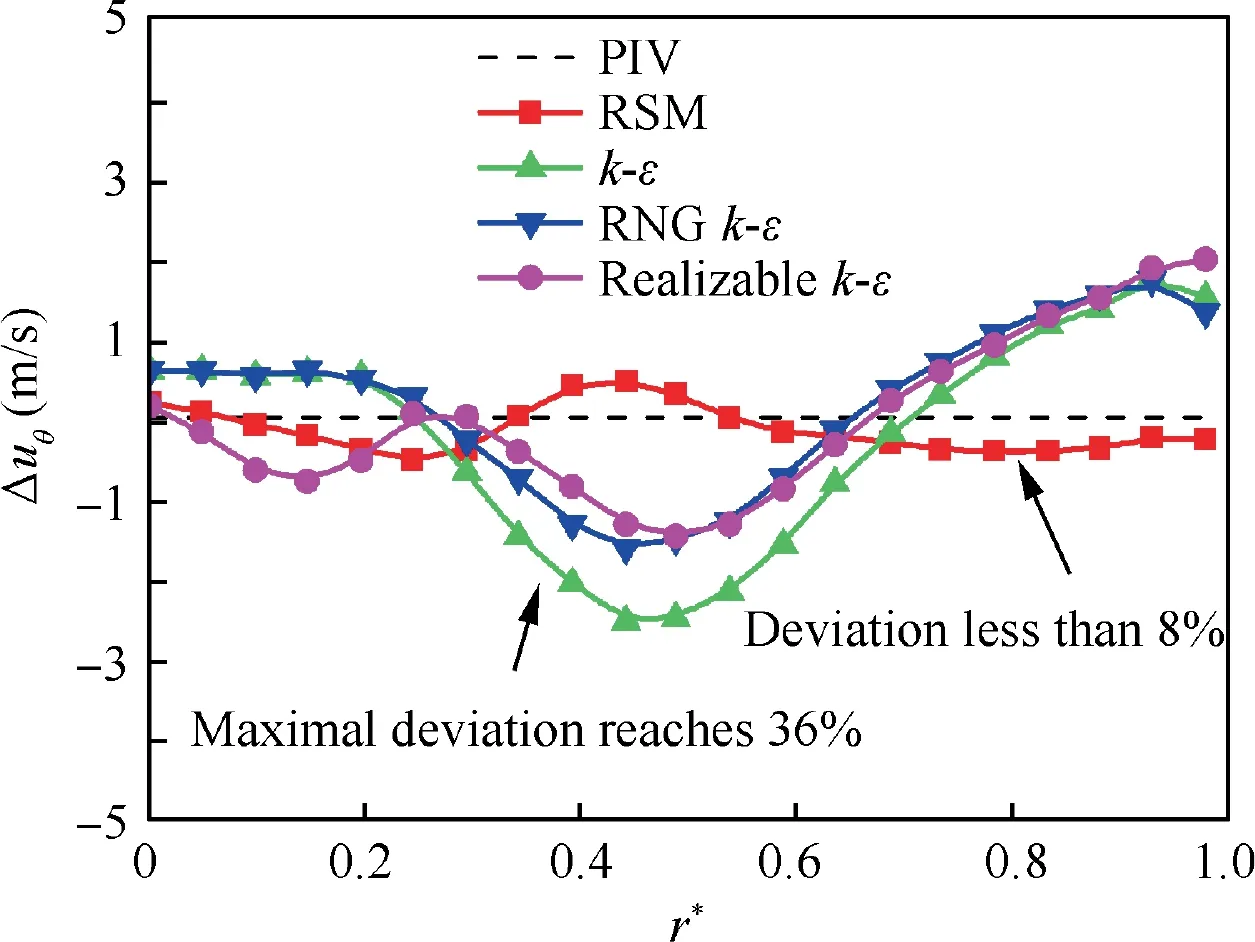
Fig. 8 Deviation of tangential velocity in C3 cross-section among RSM, k-ε models simulation and PIV test results.
The explanation for variables in Eq. (5) can be found in Ref.30. The Reynolds stress termshould be closed.Hence, turbulence model needs to be established to solve RANS equation. Generally, k-ε models, including standard,RNG (Re-Normalization Group), and Realizable k-ε models,are not recommended for strong swirl numerical simulation,but the RSM model takes into account the effects of rapid changes of swirl streamline curvature, rotation, and strain,which makes the results more accurate.30The positions of cross-sections C1-C5 are shown in Fig. 7. For the swirl measurement and simulation, tangential velocity is the most sensitive and significant parameter, which should be primarily considered and compared for CFD and PIV cases. Fig. 8 demonstrates the deviation of tangential velocity Δuθin C3 cross-section among RSM,k-ε models simulation and PIV test results under αgeomof 30° and βgeomof 60° (r* is the normalized radius). The convergence of CFD simulation is obtained under the condition that all the residual curves are below 10-3(energy residual below 10-6) and the mass flow balance between inlet and outlet is achieved.31It can be seen that the results of the RSM model is closer to that obtained by PIV experiment than that by k-ε models. The maximal velocity deviation between k-ε models and PIV reaches 36% while the deviation under RSM model is less than 8% in any radius position.
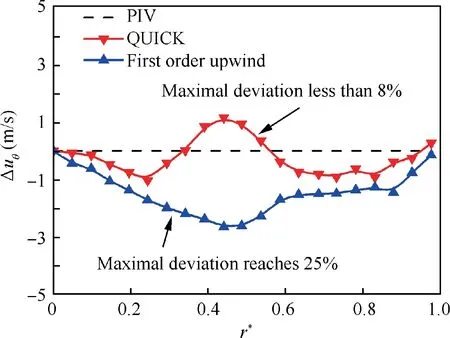
Fig. 9 Deviation of tangential velocity distribution in crosssection C3 among momentum first order upwind, QUICK discretization simulation and PIV results.
In addition to turbulence model, the discretization scheme also has a large impact on the results.32-34In this paper,PRESTO! and QUICK are chosen as the pressure and momentum discretization respectively due to their suitability for strong swirl.Fig.9 shows the deviation of tangential velocity distribution in cross-section C3 among momentum first order upwind,QUICK discretization simulation and the results by PIV experiment under αgeomof 30°and βgeomof 60°.It can be seen that the QUICK discretization matches PIV results closely.For turbulent kinetic energy, turbulence dissipation rate and Reynolds stress, the simulation adopts the second order upwind discretization. For pressure-velocity coupling, SIMPLEC is used mainly because it represents good convergence in swirl simulation.
3.2. Engine fired cycle simulation
The paper simulates the engine fired cycle with actual cylinder configuration (Fig. 1) and investigates the scavenging performance under different port angles. The RSM turbulence model, standard wall function and SIMPLEC algorithm are employed. Considering the spray, collision, wall adhesion and evaporation of fuel droplet, the wave breakup model is activated. Species transport model and volumetric reactions are preferred for the combustion model. Since in 2-stroke engine, the flow condition of last cycle has a great influence on the current cycle, the simulation of multiple cycles is performed. When cycle difference is reduced to a specific value,the result can be reliable.35The criteria include intake and exhaust mass flow rate, as well as the in-cylinder gas mass at the end of scavenging process. For boundary conditions, the inlet and outlet pressure values are set constant.36The temperature of cylinder head,wall and piston top are set according to experimental results in Table 2.
Scavenging performance can be evaluated by scavenging parameters, including the volumetric efficiency ηc, scavenging efficiency ηs, and delivery ratio λ, which are defined as37:

where mais the mass of fresh air remained in cylinder at the end of gas exchange process; m0is the mass of fresh air filling the cylinder under the intake status; mbis the residual burned gas in cylinder at the end of gas exchange process; miis thetotal mass of fresh air through scavenge port during gas exchange process. Swirl intensity can be evaluated by swirl ratio R38:
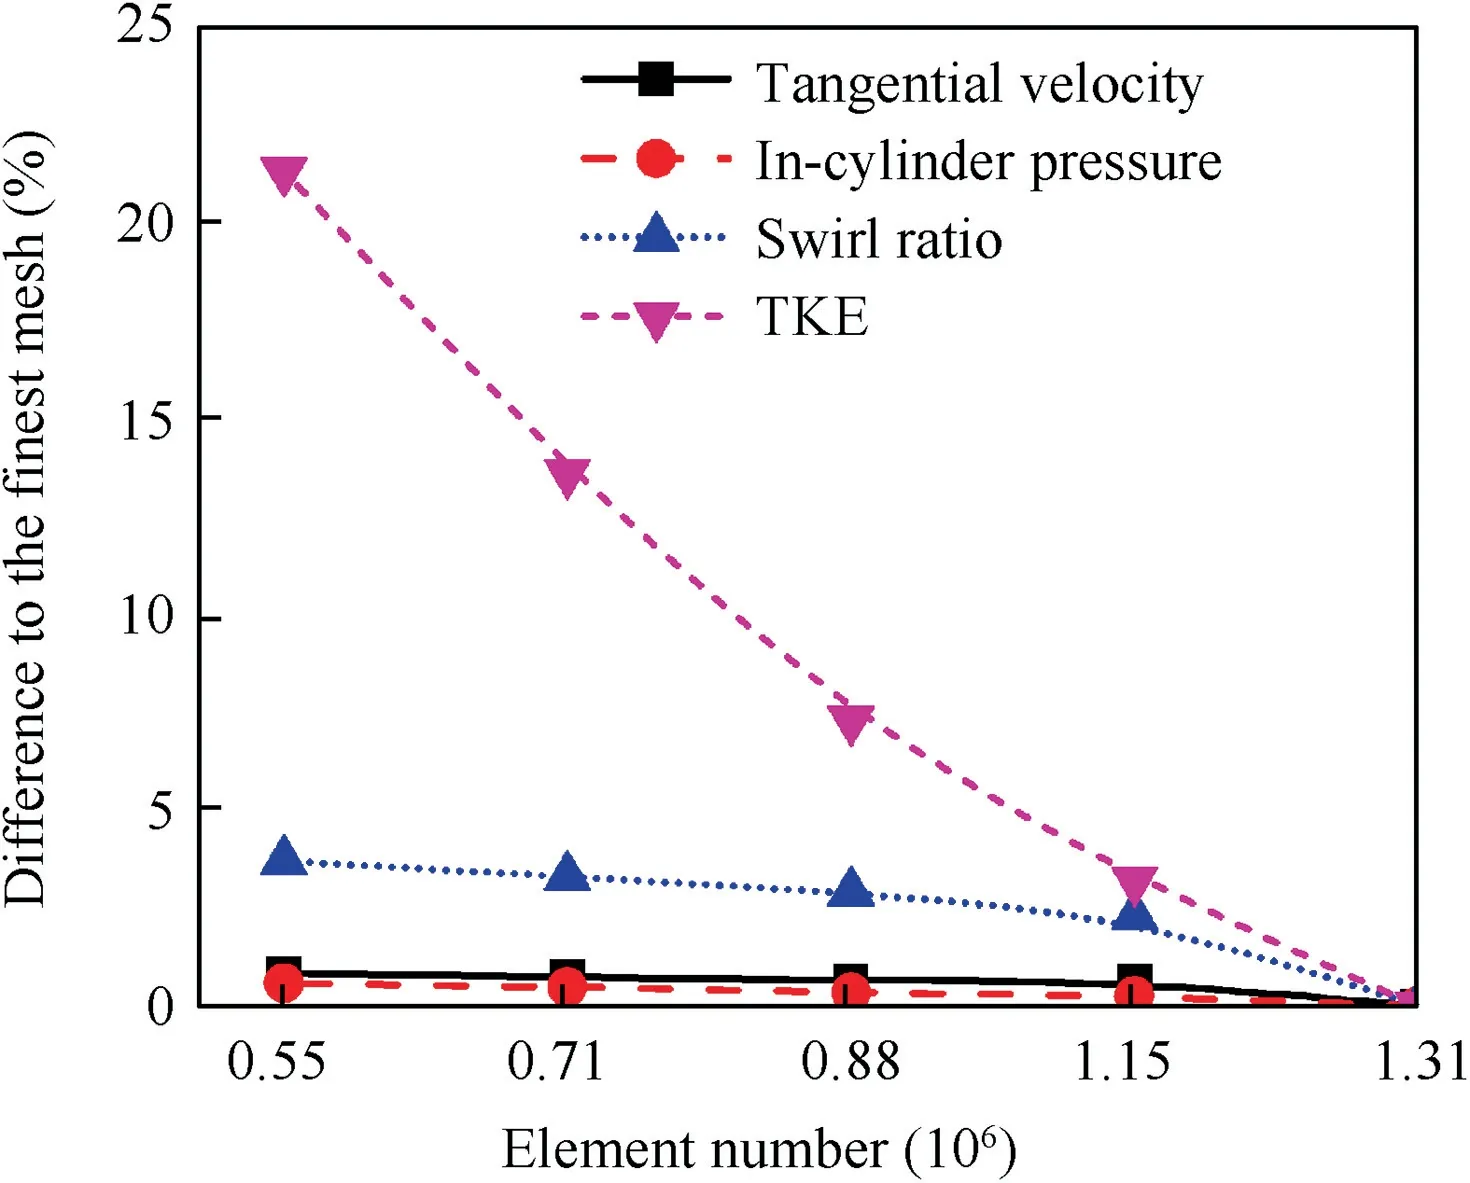
Fig. 10 Mean difference of evaluated parameters for mesh independency study.
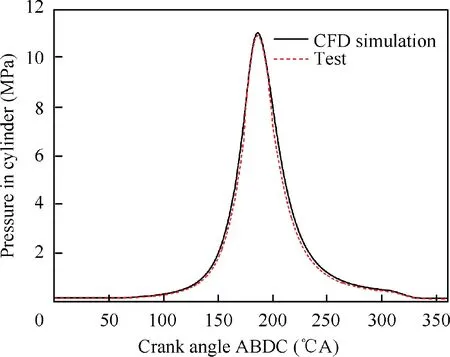
Fig. 11 Comparisons of cylinder pressure curves between CFD model and test results.

where ω is the angular velocity of the swirl and N is the engine speed.
To validate the rationality of model parameters and simulation methods of CFD fired cycle model, the mesh independent study is completed in the cold flow condition, and the simulated cylinder pressure curve under combustion condition has been compared with the fired tested data. Five different amounts of mesh and four parameters including tangential velocity,in-cylinder pressure,swirl ratio and Turbulent Kinetic Energy (TKE) are adopted to verify the mesh independent study. Comparison of the evaluated parameters difference between each mesh and the finest mesh is displayed in Fig. 10. For tangential velocity, in-cylinder pressure, swirl ratio and TKE, the value differences between element number of 1.15 and 1.31 million are 0.63%, 0.26%, 2.3% and 3.2%respectively,which is eligible for mesh independent.Therefore,mesh with 1.15 million elements is selected to conduct simulation,under which the geometric coincidence rate reaches 99%.Besides, as illustrated in Fig. 11, the combustion simulation result of selected mesh agrees well with the cylinder pressure curve from the test results, with the 3.1% maximum error between them, which verifies the accuracy of the CFD model.The ‘‘ABDC” means ‘‘After Bottom Dead Center”.
4. Results and discussion
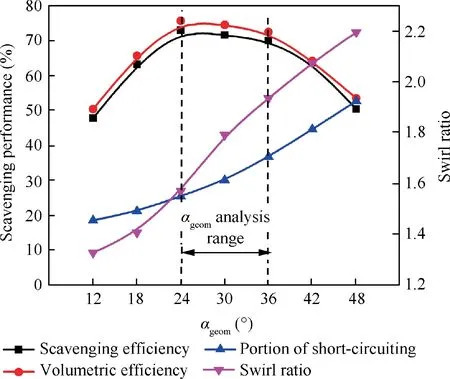
Fig. 12 Scavenging performance and swirl ratio under different αgeom.
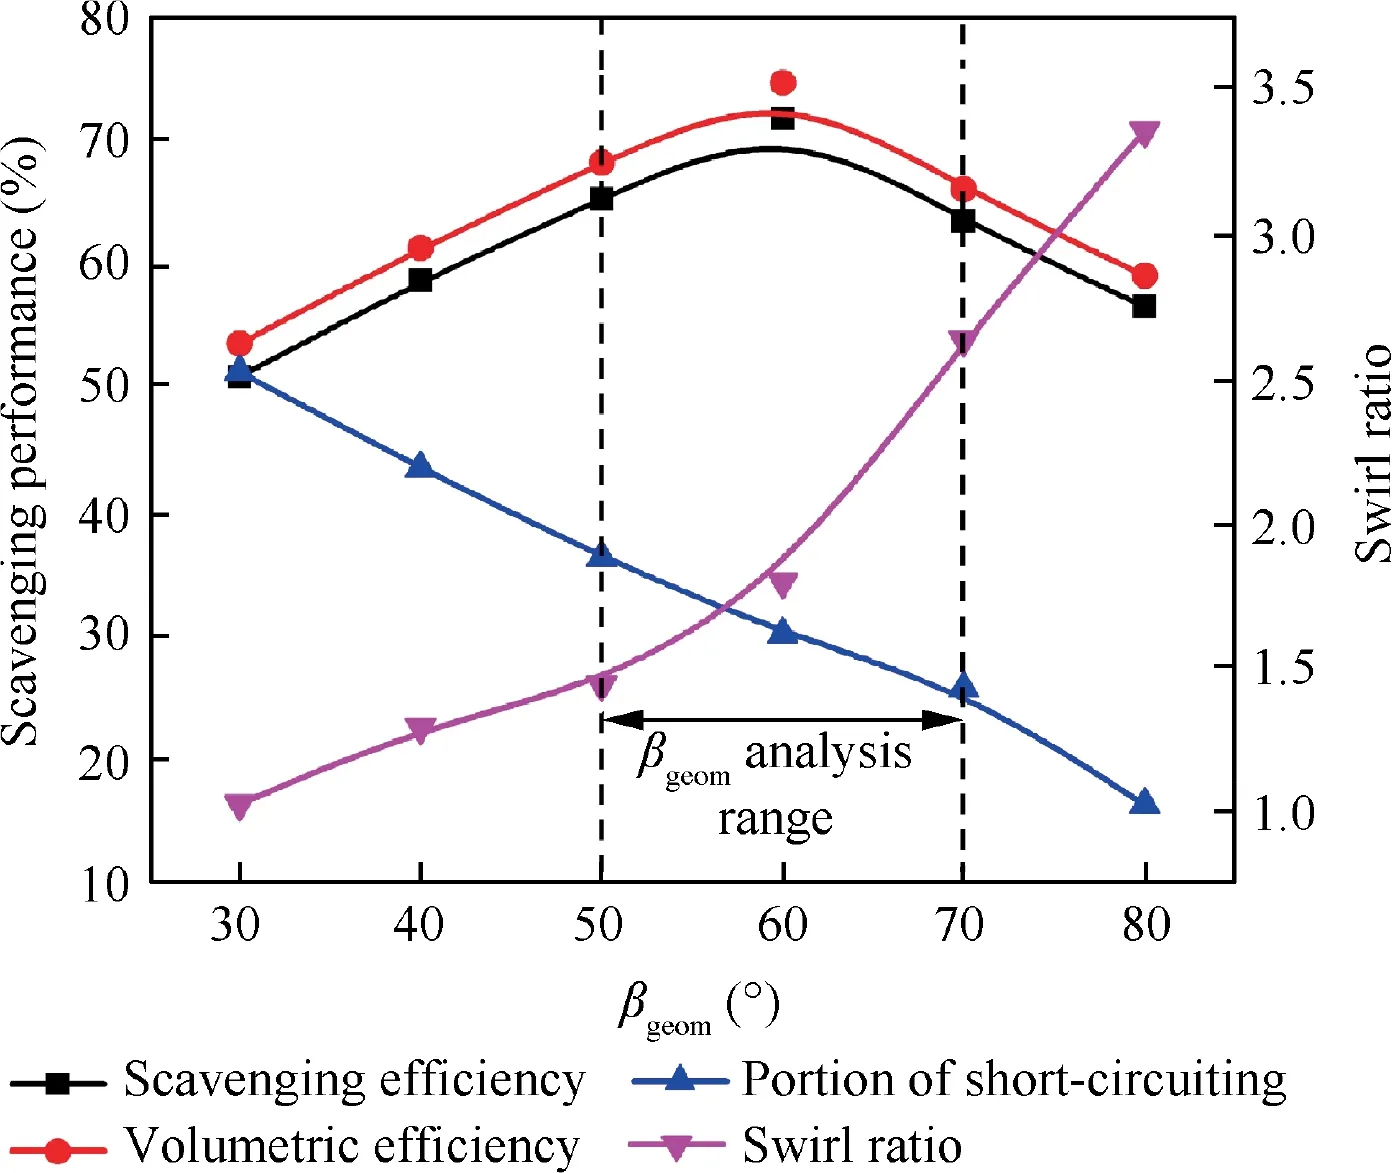
Fig. 13 Scavenging performance and swirl ratio under different βgeom.
The tangential velocity and axial velocity can reveal the mechanism and basic shape of SLS engine flow distribution. Normally tangential velocity and axial velocity mainly affect scavenging performance of cross-sections and meridian planes respectively. This section analyzes the distribution of the tangential and axial velocity of steady swirl model based on PIV and CFD results under different port angles αgeomand βgeom.Also, the variation of velocity distribution and swirl number caused by different port angles significantly affect scavenging performance, so the scavenging performances under different angles are analyzed in fired cycle simulation. A wide range of αgeom(12°-48°) and βgeom(30°-80°) is simulated in fired engine cycle,displayed in Fig.12 and Fig.13.Firstly,the scavenging efficiency and volumetric efficiency are unsatisfactory due to the reduced fresh charge when αgeomis small, and an overlarge αgeommay lead to the increasing portion of shortcircuiting. Secondly, a small βgeomalso causes a large portion of short-circuiting, while an overlarge βgeomhinders the scavenging of residual gas in cylinder center. As a result, the 24°-36° range of αgeomand 50°-70° range of βgeomare determined for further analysis due to the excellent scavenging performance,acceptable portion of short-circuiting and moderate swirl ratio.
4.1. Tangential velocity distribution
Fig. 14 illustrates the distribution of the tangential velocity uθin cross-section C3 from PIV result.It can be seen that the distribution is consistent with Rankine combined vortices, especially in view of internal rigid swirl and external free swirl.39Similar velocity distribution has also been verified in other bidirectional swirl flows, such as cyclone separators flow field.40Fig.15 manifests the distribution of tangential velocity in cross-sections C1-C5. In addition to C5, although C1-C4 occupy different axial positions, their distribution curves are almost consistent. The tangential velocity near cylinder wall in C5 is prominently deviated from other cross-sections due to the separation of intake flow. Except for near-wall area,the radial distribution of tangential velocity in C5 is basically coincident with C1-C4. Therefore, we can conclude that the tangential velocity distribution is independent with the axial position.41
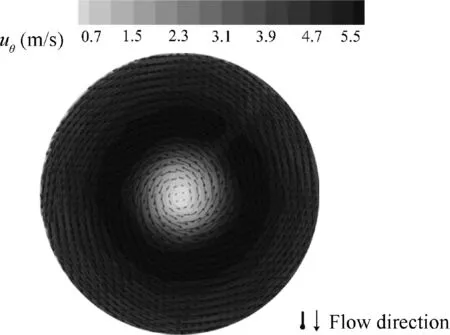
Fig.14 Tangential velocity distribution in cross-section C3 from PIV result.

Fig. 15 Radial distributions of tangential velocity in crosssections C1-C5.
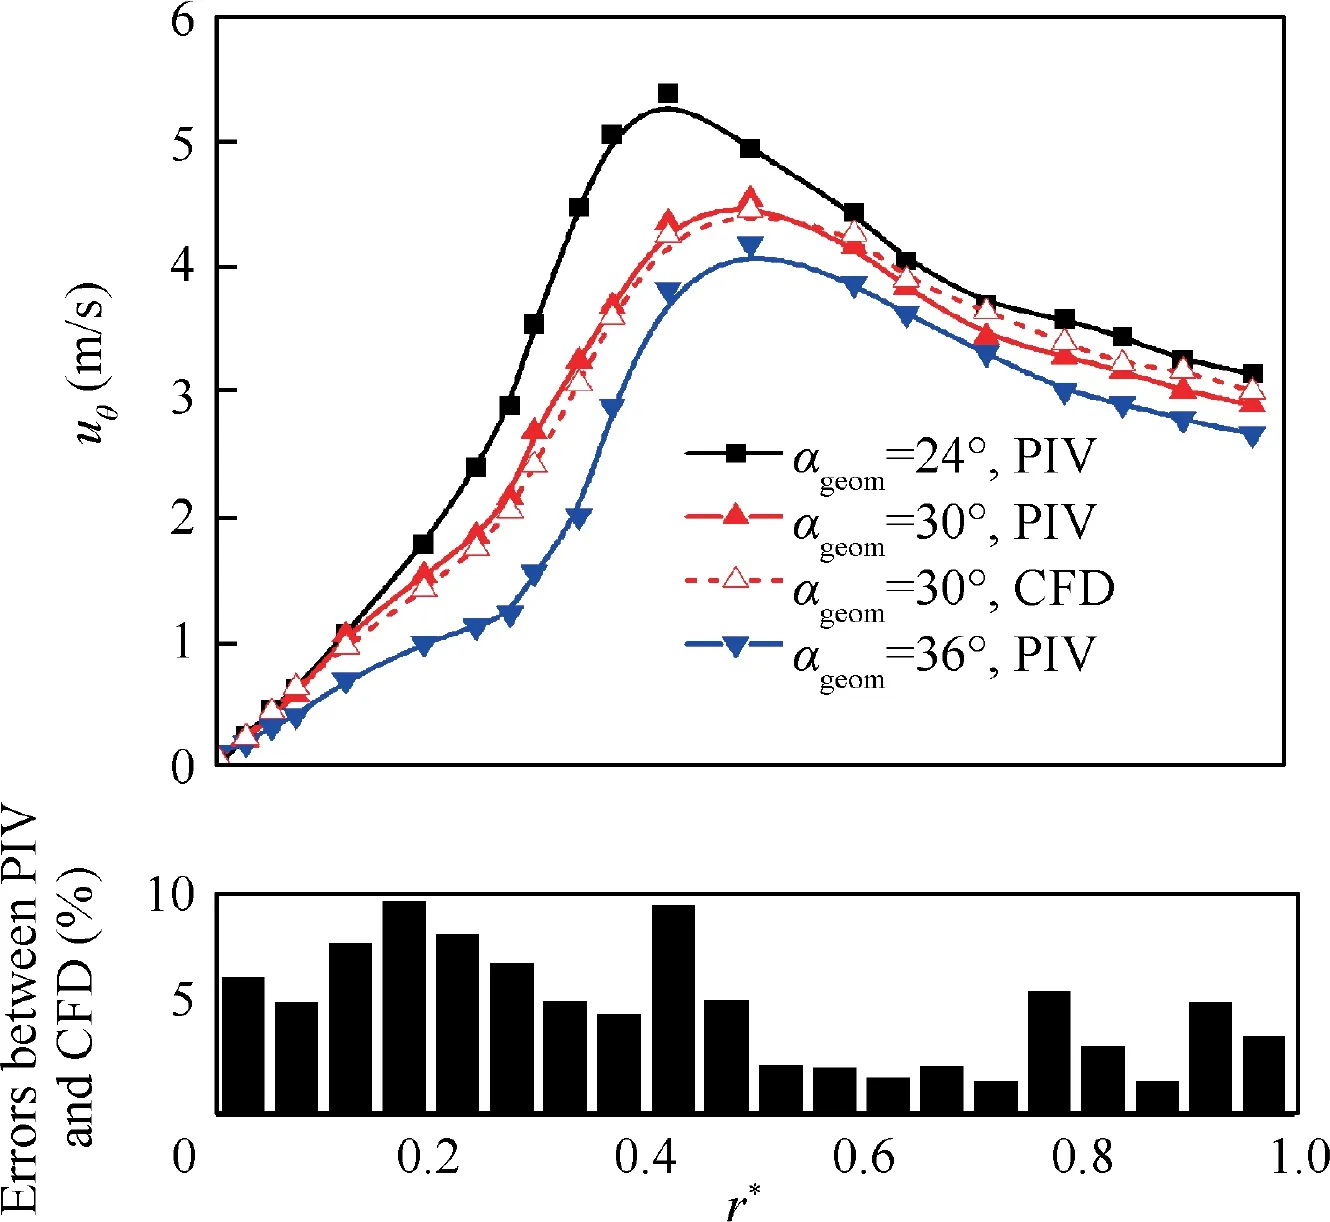
Fig. 16 Radial distribution of tangential velocity at different αgeom in cross-section C3.
Fig.16 depicts the radial distribution of PIV-test tangential velocity in C3 plane under different αgeom, with a CFD curve under αgeomof 30° for comparison, and the βgeomis set to 60°for all cases.It can be observed that as the αgeomincreases,both the value and distribution of tangential velocity change accordingly. Firstly, as αgeomincreases from 24° to 36°, the value of maximum tangential velocity decreases gradually from 5.3 m/s to 4.1 m/s, approximately 23% declines. Similarly, as αgeomincreases from 24° to 36°, the radial position of maximum tangential velocity increases gradually from 0.41 to 0.5.Generally,the increase of average tangential velocity enhances the scavenging performance of cross-sections,thus a smaller αgeommay be a preferred choice in this perspective. The average and maximum error between PIV and CFD are 4.9% and 9.7% respectively, which indicates acceptable accuracy.
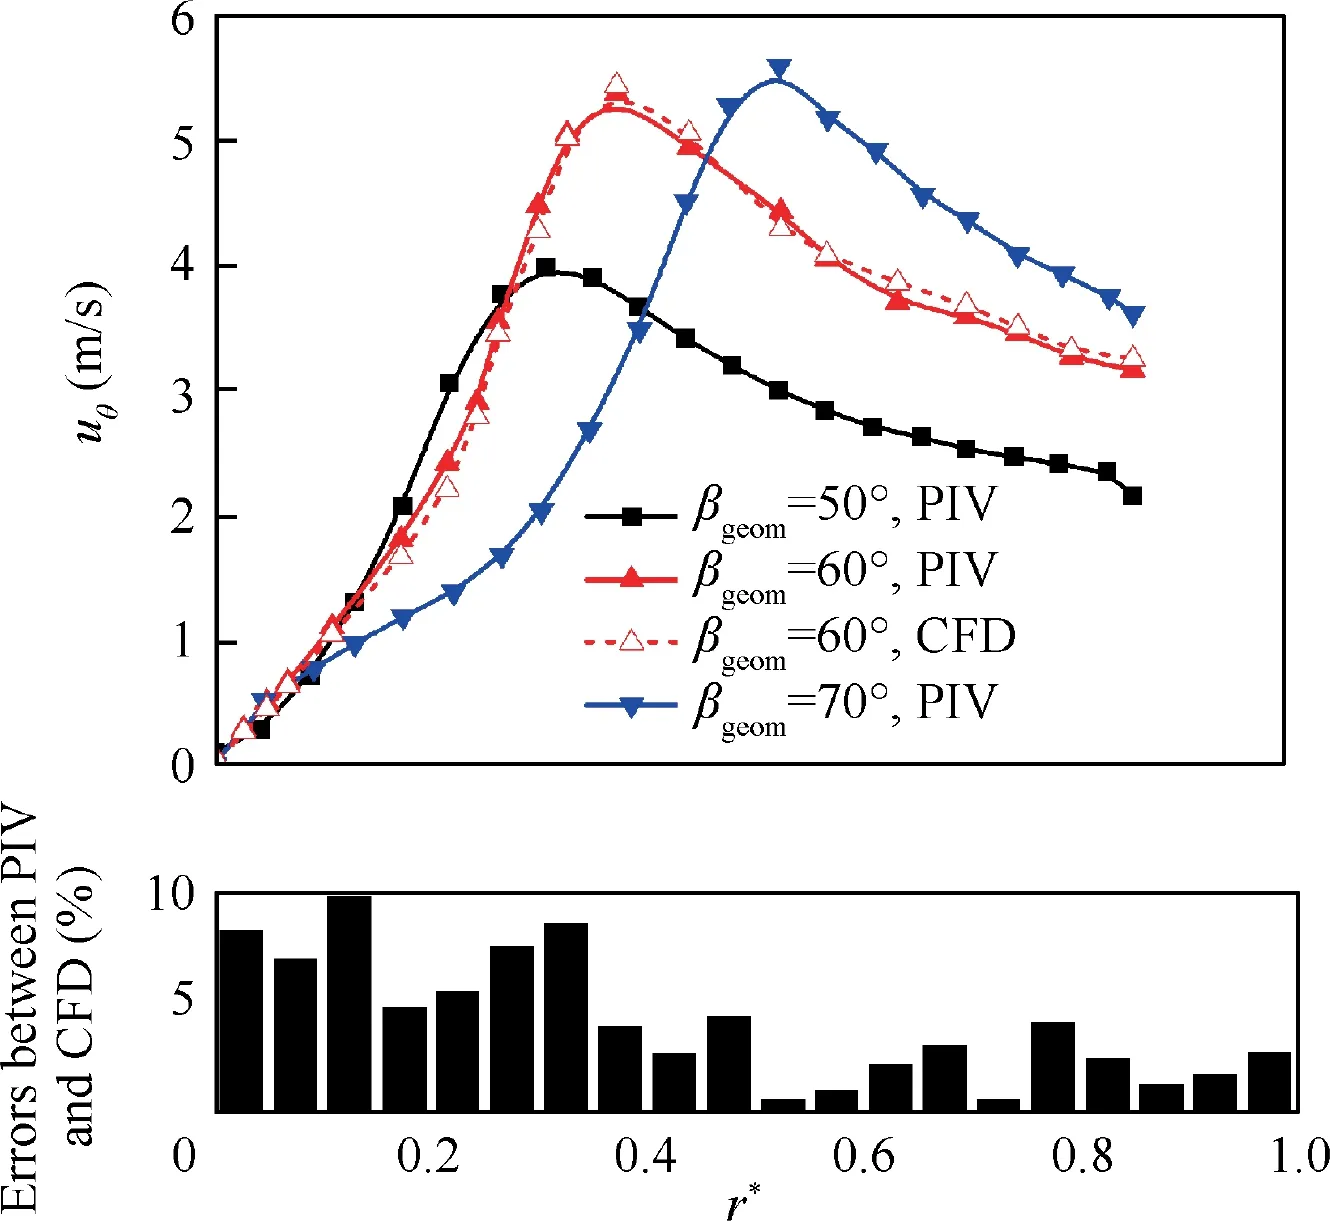
Fig.17 Radial distribution of tangential velocity under different βgeom in cross-section C3.
Fig.17 demonstrates the radial distribution of PIV test tangential velocity of C3 plane under different βgeom,with a CFD curve under βgeomof 60°for comparison,and the αgeomis set to 24°for all cases.It can be observed that as βgeomincreases,the value and distribution of tangential velocity reflect a more considerable variation than αgeom.Firstly, as βgeomincreases from 50°to 70°,the value of maximum tangential velocity increases gradually from 3.9 m/s to 5.5 m/s, approximately 41% rises.Similarly, as βgeomincreases from 50° to 70°, the radial position of maximum tangential velocity also increases gradually from 0.36 to 0.6. The average tangential velocity under βgeomof 60° reaches the highest, which indicates that, in perspective of enhancing the scavenging performance of cross-sections, a moderate βgeommay be preferred. The average and maximum error between PIV and CFD are 4.6% and 9.8% respectively,which indicates acceptable accuracy.
4.2. Axial velocity distribution
Fig. 18 manifests axial velocity distribution in meridian plane from CFD and PIV result.From this figure,bidirectional swirl can be clearly observed.The direction from the cylinder top to bottom is defined as the positive direction of the flow velocity.From the result,the axial velocity is negative near the cylinder wall, which indicates that the flow is toward the top of cylinder. However, in the center of cylinder, the axial velocity is positive, which indicates that the flow is toward the bottom of cylinder. In the middle of these two areas, there is a zeroaxis velocity layer. Fig. 19 shows the radial distribution of axial velocity uz, whose values are taken from points in the intersection lines(dashed lines in Fig.18)of PIV test meridian plane and C1-C4 cross-sections(C5 is neglected because it near scavenge port).Similarly,it can be seen that axial velocity lines of different cross-sections intersect with the zero-velocity line almost at the same point, so the axial position of zero-axial velocity layer is almost independent to cross-sections. However, the value of axial velocity is closely related to the axial position of cross-sections. Far from cylinder top, the axial velocity is much higher in the same radial position, which verifies that the axial velocity of bidirectional swirl becomes much lower on the way to cylinder top, conversely, it may be much higher on the way to the cylinder bottom. In addition to bidirectional swirl, the central recirculation zone13can also be observed from axial velocity distribution,in which the velocity is extremely low.
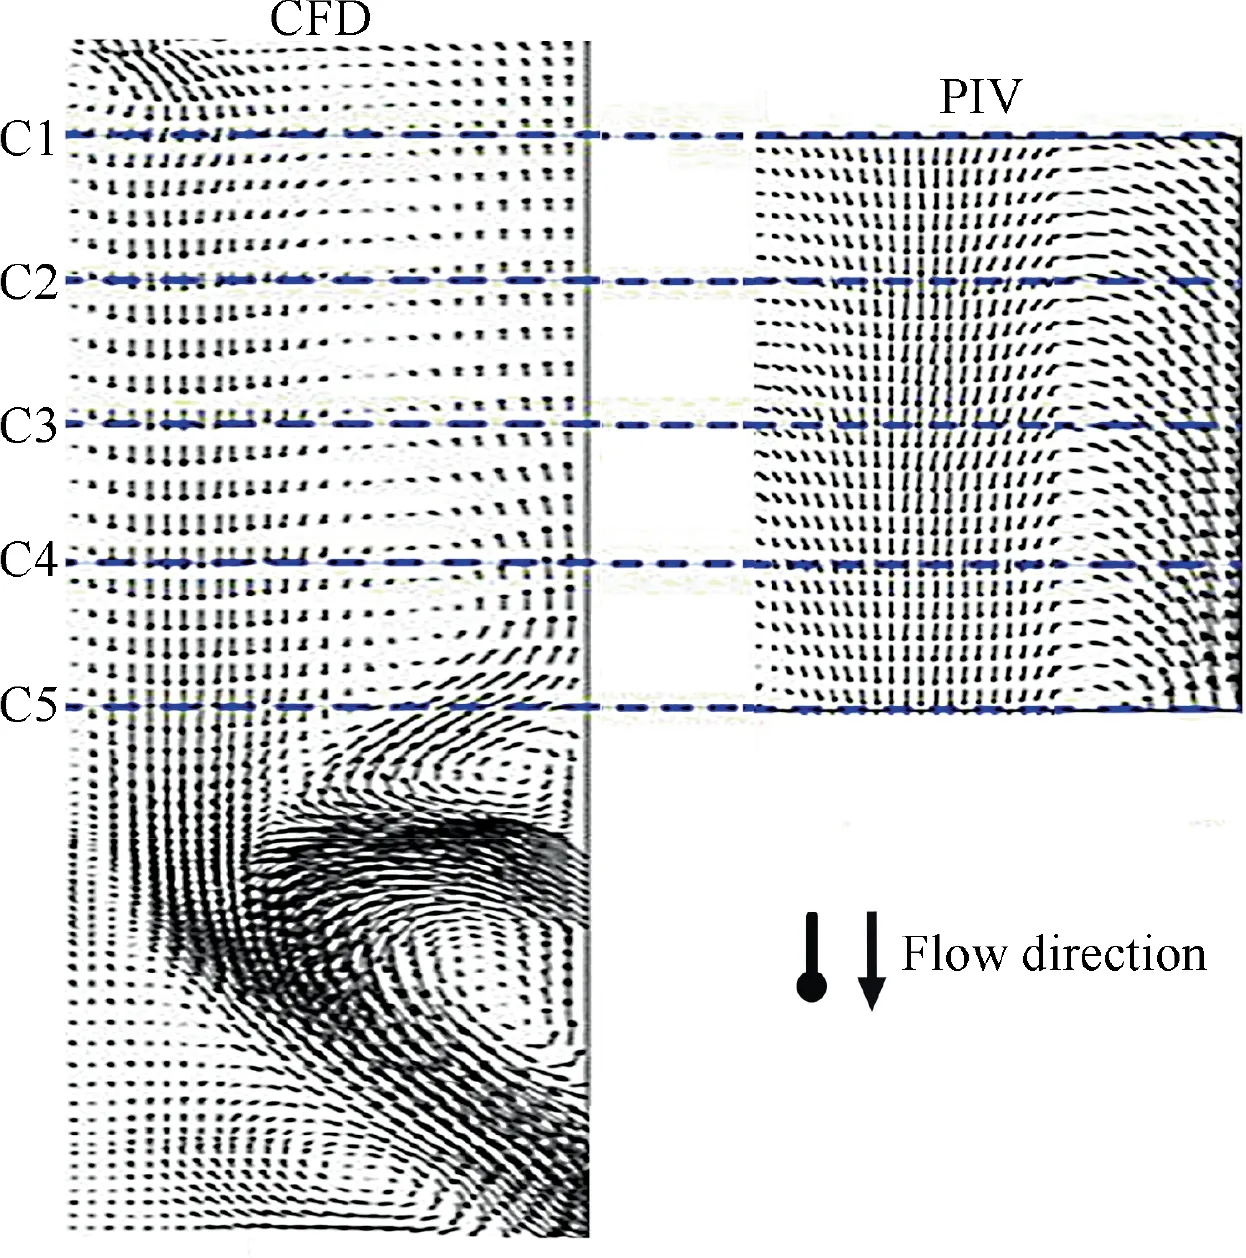
Fig. 18 Axial velocity distribution in meridian plane from CFD and PIV result.
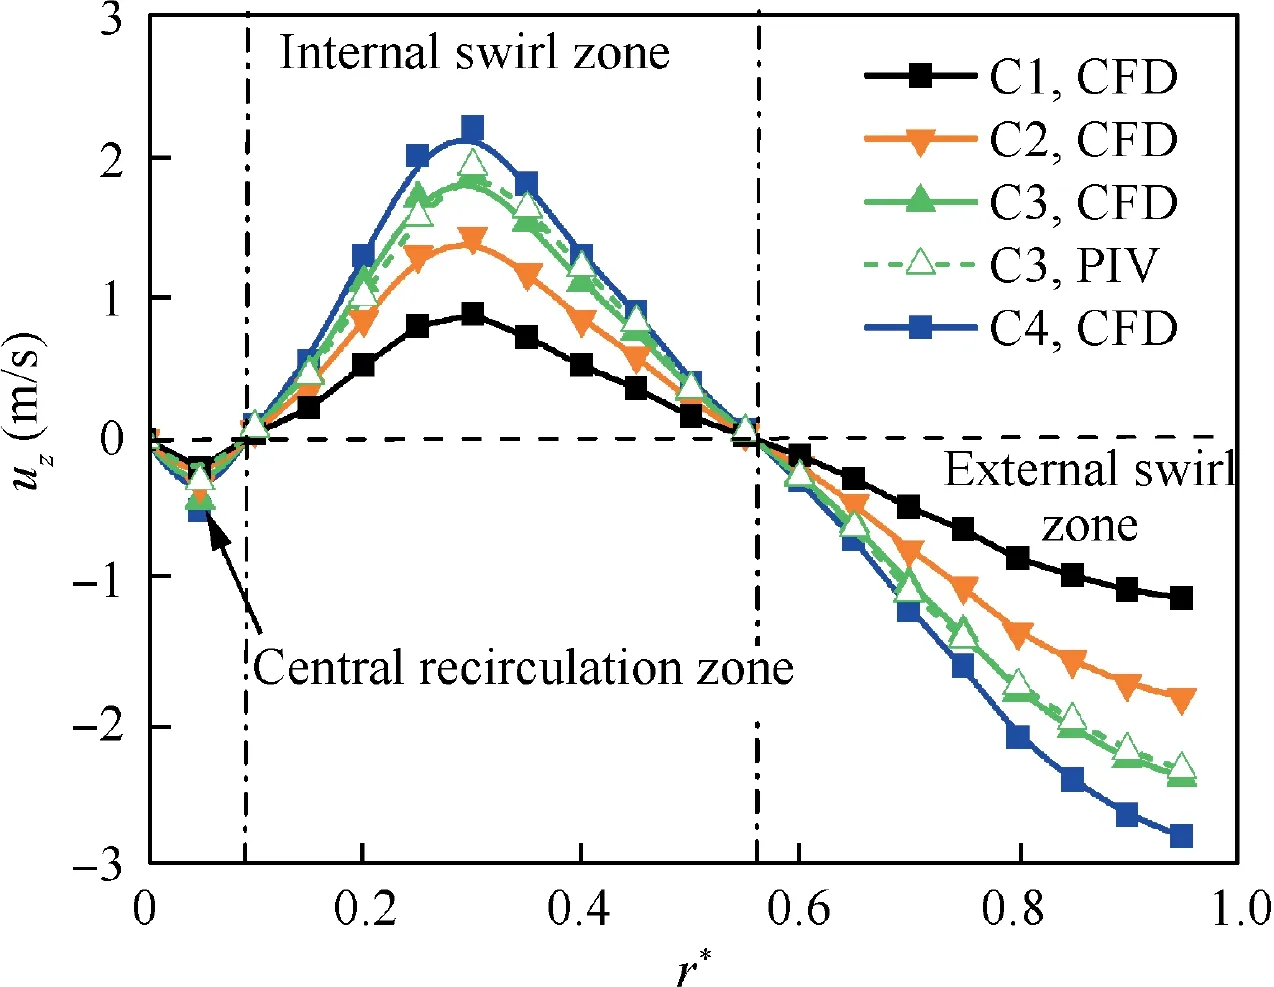
Fig.19 Radial distribution of axial velocity in cross-sections C1-C4.
Fig. 20 displays the radial distribution of PIV-test axial velocity under different αgeom, with a CFD curve under αgeomof 30° for comparison. It can be seen that as αgeomincreases from 24° to 36°, the value of maximum axial velocity in internal swirl decreases gradually from 1.8 m/s to 0.6 m/s, approximately 67% declines. The radial position of maximum axial velocity varies slightly. As αgeomincreases from 24° to 36°,the position increases gradually from 0.3 to 0.36. The size of central recirculation zone is almost uninfluenced by the variation of αgeom.The axial velocity of external swirl also decreases as αgeomincreases. Generally, the increase of average axial velocity enhances the scavenging performance of meridian planes. As a result, a smaller αgeommay also be appropriate in this aspect. The average and maximum error between PIV and CFD are 6.3% and 9.8% respectively, which indicates acceptable accuracy.
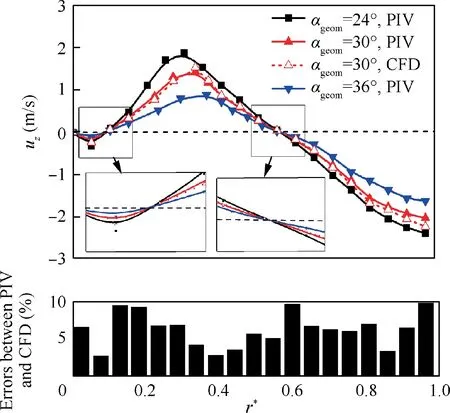
Fig. 20 Radial distribution of axial velocity under different αgeom in cross-section C3.
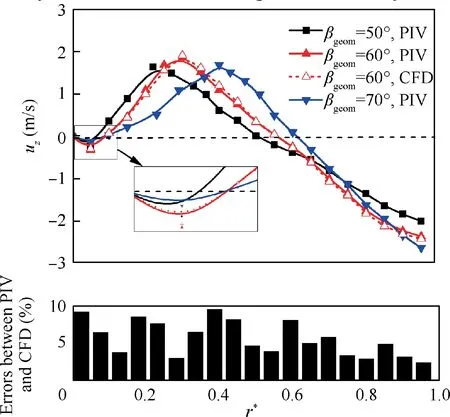
Fig. 21 Radial distribution of axial velocity under different βgeom in cross-section C3.
Fig. 21 displays the radial distribution of PIV-test axial velocity under different βgeomin cross-section C3, with a CFD curve under βgeomof 60° for comparison. It can be seen that as βgeomincreases, the value and distribution of axial velocity have changed. As βgeomincreases from 50° to 60°,the value of maximum axial velocity in internal swirl increases from 1.5 m/s to 1.8 m/s,and as βgeomincreases from 60°to 70°,the value decreases from 1.8 m/s to 1.5 m/s.Similarly,as βgeomincreases from 50°to 70°,the radial position of maximum axial velocity and zero- axis velocity layer also increases gradually from 0.23 to 0.42 and 0.5 to 0.63 respectively. The size of central recirculation zone is almost uninfluenced by the variation of βgeom. For external swirl, the axial velocity increases as βgeomincreases. However, the average axial velocity under βgeom= 60° reaches the highest, so in view of enhancing meridian planes scavenging performance, a medium βgeomis also considerable. The average and maximum error between PIV and CFD are 5.8%and 9.7%respectively,which indicates acceptable accuracy.
4.3. Performance analysis of scavenging
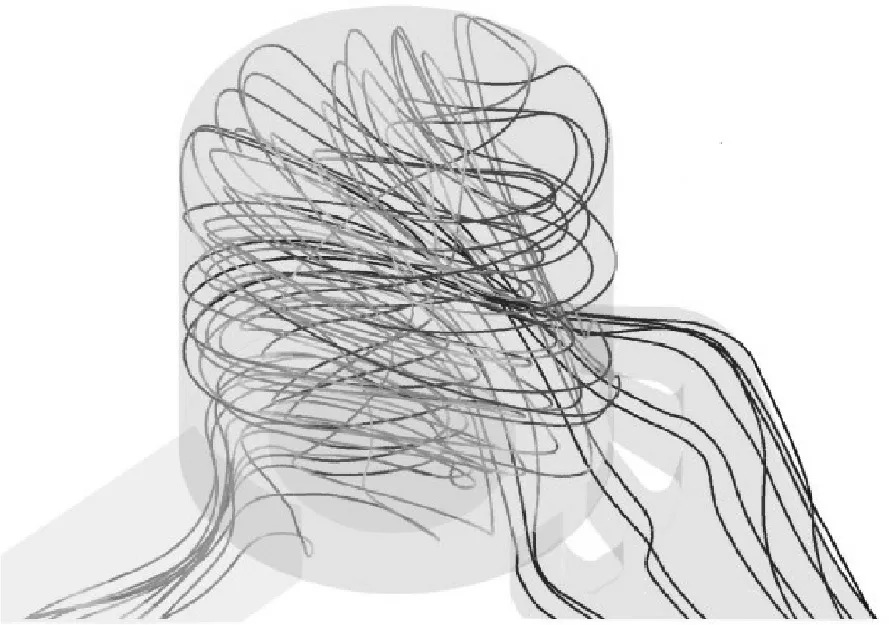
Fig. 22 Flow streamline in scavenging process.
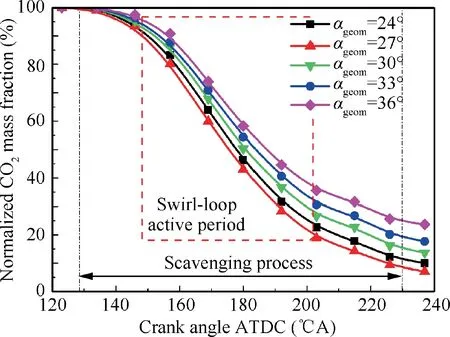
Fig. 23 In-cylinder CO2 mass fraction variation under different αgeom.
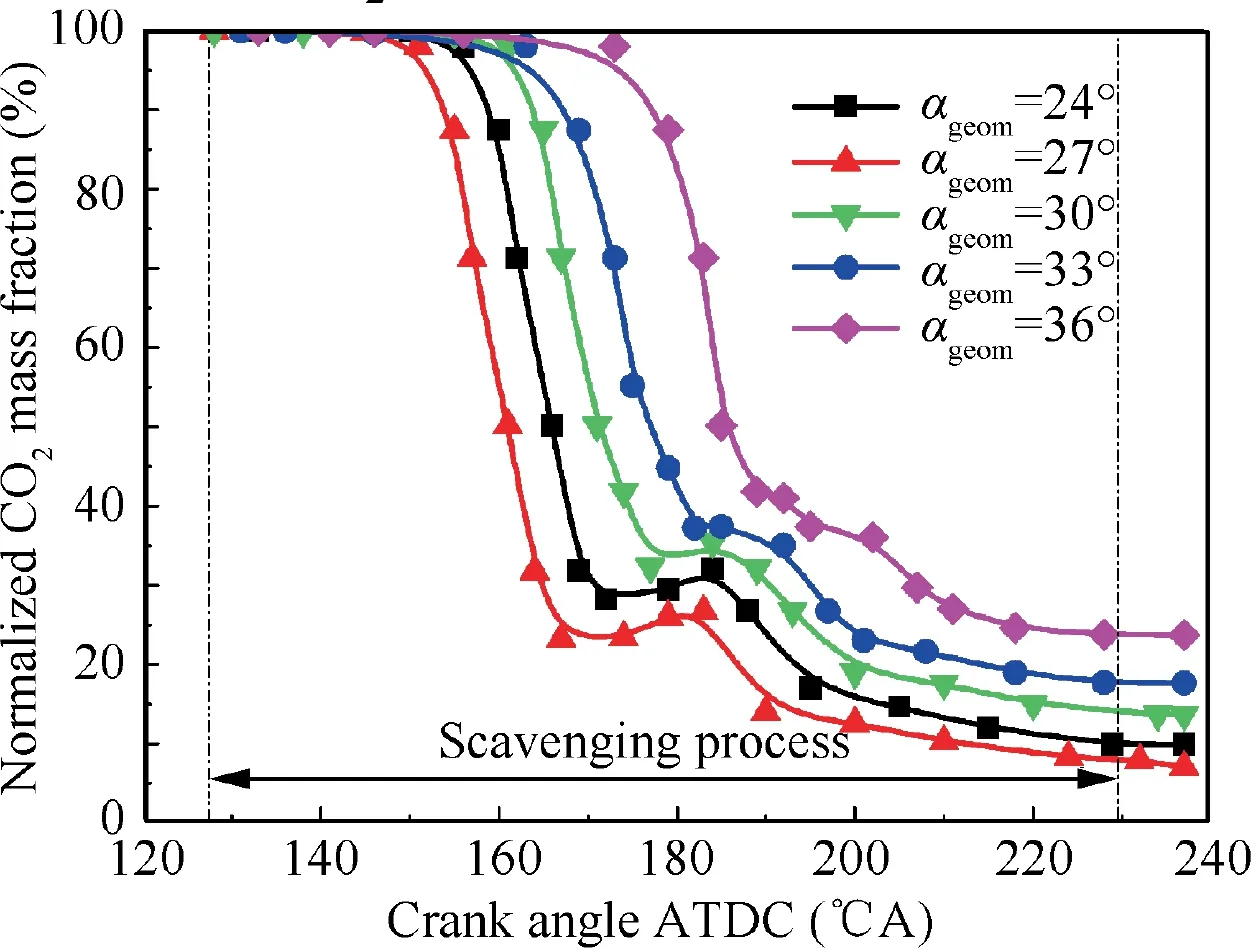
Fig. 24 Exhaust port CO2 mass fraction variation under different αgeom.
Fig. 22 illustrates flow streamlines in the scavenging process.The bidirectional swirl can also be observed in engine fired cycle simulation. Scavenging performances under different αgeom(αgeom=24°,27°,30°,33°,36°)are analyzed when βgeomis set to be constant 60°. The variations of normalized CO2mass fraction in cylinder and exhaust port are shown in Fig. 23 and Fig. 24 respectively, and the fraction at the end of combustion (beginning of gas exchange process) is calibrated and defined as 100% for the convenience of comparison. It can be seen from the figures that, when αgeomdecreases from 36° to 24°, the direction of scavenge port is raised towards cylinder top. As a result, the short-circuiting of scavenging process is mitigated. It means the raised-up of scavenge port can suppress the short-circuiting in the middle of scavenging process.However,the raised-up of scavenge port reduces the effective area of scavenge port, which may cause the decrease in intake flow rate and delivery ratio. Table 3 shows the scavenging performance and swirl parameters of the engine under different αgeom. It can be seen from the Table 3, when βgeomis set to be constant 60°, the scavenging efficiency ηs,volumetric efficiency ηc,and delivery ratio λ reach their maximum value under αgeomof 27° When αgeomis larger than 27°,ηsand ηcdecrease,but λ increases gradually as αgeomincreases. Swirl ratio R is taken at the middle timing of scavenging process and it increases as αgeomincreases,which is consistent with the variation rule of Sgeom, indicating that Sgeomcan effectively reflect the in-cylinder swirl intensity. At the same time, Greater swirl intensity produces an adverse effect on scavenging performance,so it is pretty necessary to control it properly.
On the basis of constant αgeomof 27°, scavenging performances under different βgeom(βgeom=50°, 55°, 60°, 65°,70°)are also analyzed.The variations of normalized CO2mass fraction in cylinder and exhaust port are shown in Fig.25 andFig.26 respectively. It can be seen from the figures that,when βgeomincreases from 50° to 60°, intake flow direction deviates from the cylinder axis gradually,and the CO2mass fraction at the end of scavenging process decreases. It is mainly because the direction is divergently towards exhaust port as the flow direction deviates from cylinder axis, which helps suppress the short-circuiting and retain fresh air in cylinder.When βgeomincreases from 60 to 70°,CO2mass fraction at the end of scavenging process increases to some extent. Because of large βgeom, both average tangential velocity and axial velocity are reduced, which depresses the scavenging performance, especially in cylinder center.Table 4 illustrates the scavenging performance and swirl parameters of the engine under different βgeom.It can be seen from Table 4 that when αgeomis constant 27°, the scavenging efficiency ηsand volumetric efficiency ηc,reach their maximum value under βgeomof 60°. When βgeomis larger than 60°, ηsand ηcdecrease obviously as βgeomincreases. When βgeomis smaller than 60°, ηsand ηcincrease as βgeomincreases. Delivery ratio λ decreases, but swirl ratio R increases gradually as βgeomincreases, which is consistent with the variation rule of Sgeom. It indicates that Sgeomcan effectively reflect the in-cylinder swirl intensity, and excessive swirl intensity produces a negative effect on scavenging performance.Again,it is quite crucial to control the swirl intensity to a moderate extent.

Table 3 Scavenging performance under different αgeom.
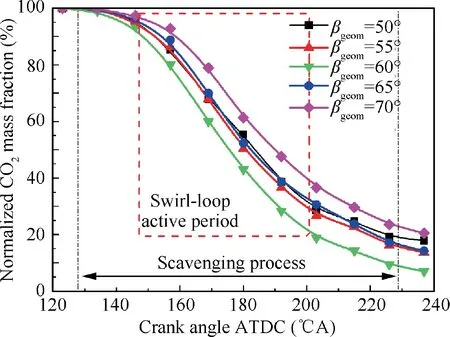
Fig. 25 In-cylinder CO2 mass fraction variation under different βgeom.
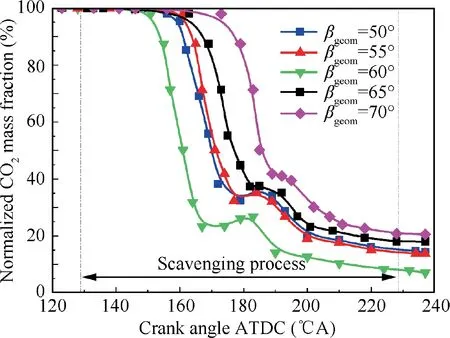
Fig. 26 Exhaust port CO2 mass fraction variation under different βgeom.
5. Conclusions
This paper designs a PIV experimental system to investigate the swirl distribution under different scavenge port angles and validate the CFD method based on SLS scheme in 2-stroke aircraft diesel engines. Engine fired cycle simulation is performed to study the effect of port angles on scavenging performance.The study helps to obtain the optimal values of portangles for SLS engines, and explores the feasibility of loop scavenging used in 2-stroke engines. The main contributions are summarized as follows:

Table 4 Scavenging performance under different βgeom.
(1) PIV experiment and CFD simulation validate that the SLS flow distribution is bidirectional. RSM turbulence model and QUICK discretization scheme are more suitable for SLS simulation and match the measured result.
(2) The distribution of the tangential velocity is almost unchanged in different cross-sections. The distribution and the maximum velocity are closely related to geometric scavenge port angles αgeomand βgeom. The influence of βgeomon the distribution is greater than that of αgeom.To improve the scavenging performance of crosssections, αgeomvalue of 27° and βgeomvalue of 60° may be preferred.
(3) The shape of axial velocity distribution and the position of zero-axial velocity layer are almost the same in different cross-sections but the velocity values are various.The distribution, maximum velocity and the position of zero-axial velocity layer are also related to αgeomand βgeom. To boost the scavenging performance of meridian planes, αgeomvalue of 27° and βgeomvalue of 60° are also appropriate.
(4) In engine fired cycle simulation,αgeomand βgeomare two essential parameters influencing the scavenging performance,whose change causes the variation of normalized CO2mass fraction curve, scavenging efficiency ηs, volumetric efficiency ηc, and delivery ratio λ in different degrees. As expected, the ηsreaches the maximum as 73.7% when αgeomis 27° and βgeomis 60°.
(5) Geometric swirl number Sgeomand swirl ratio can effectively reflect the in-cylinder swirl intensity. Furtherly,greater swirl intensity may produce adverse effects on scavenging performance of 2-stroke engines, so it is pretty necessary to control it to a proper extent.
In the future study,some scavenge and exhaust ports in the PIV model can be closed to analyze the influence of ports position on flow distribution. Moreover, experiments such as tracer gas method can be adopted to evaluate the performance of SLS engine under fired condition.
Declaration of Competing Interest
The authors declare that they have no known competing financial interests or personal relationships that could have appeared to influence the work reported in this paper.
Acknowledgements
This work was supported by the Basic Research Program of the National Natural Science Foundation of China (Nos.51775025 and 51205015) and China Key Research and Development Plan (No.2018YFB0104100).
 CHINESE JOURNAL OF AERONAUTICS2021年3期
- CHINESE JOURNAL OF AERONAUTICS的其它文章
- Criteria for hypersonic airbreathing propulsion and its experimental verification
- Ship detection and classification from optical remote sensing images: A survey
- Variational method based robust adaptive control for a guided spinning rocket
- Inertial parameter estimation and control of non-cooperative target with unilateral contact constraint
- Theoretical modeling of vectoring dual synthetic jet based on regression analysis
- Effects of surface roughness on the aerodynamic performance of a high subsonic compressor airfoil at low Reynolds number
