Effects of surface roughness on the aerodynamic performance of a high subsonic compressor airfoil at low Reynolds number
Mingyang WANG, Chengwu YANG, Ziliang LI, Shengfeng ZHAO,Yanfeng ZHANG, Xin’gen LU,*
a Key Laboratory of Light-Duty Gas-Turbine, Institute of Engineering Thermophysics, Chinese Academy of Sciences, Beijing 100190, China
b University of Chinese Academy of Sciences, Beijing 100049, China
KEYWORDS Aerodynamic performance;Compressor airfoil;Low Reynolds number;Separation bubble;Surface roughness;Viscous dissipation
Abstract The aerodynamic performance of compressor airfoil is significantly affected by the surface roughness at low Reynolds number(Re).In the present study,numerical simulations have been conducted to investigate the impact of surface roughness on the profile loss of a high subsonic compressor airfoil at Re=1.5×10⁵.Four roughness locations,covering 10%,30%,50%and 100%of the suction surface from the leading edge and seven roughness magnitudes(Ra)ranging from 52 to 525 μm were selected.Results showed that the surface roughness mainly determined the loss generation process by influencing the structure of the Laminar Separation Bubble (LSB) and the turbulence level near the wall.For all the roughness locations,the variation trend for the profile loss with the roughness magnitude was similar.In the transitionally rough region,the negative displacement effect of the LSB was suppressed with the increase of roughness magnitude,leading to a maximum decrease of 14.6%, 16.04%, 16.45% and 10.20% in the profile loss at Ra=157 μm for the four roughness locations, respectively. However, with a further increase of the roughness magnitude in the fully rough region,the stronger turbulent dissipation enhanced the growth rate of the turbulent boundary layer and increased the profile loss instead. By comparison, the leading edge roughness played a dominant role in the boundary layer development and performance variation.To take
1. Introduction
For a compression system in an engine core operating at high altitudes,the Reynolds number(Re)based on the blade chord may decrease by one order of magnitude. At low Reynolds number (Re ~105), the onset of the boundary layer transition on the compressor blade surface is delayed and the laminar flow tends to separate, which forms a separated shear layer that undergoes a subsequent transition to turbulent flow. This is denoted as the separation flow transition, and a Laminar Separation Bubble (LSB) will be visible on the blade surface.1With a further decrease of Re, the compressor profile loss will increase rapidly on account of the growth of the LSB, especially when Re decreases below a critical value, where there is a risk of severe laminar separation without turbulent reattachment, seriously limiting the efficiency and stability of compressors.2,3
To control the boundary layer separation and transition on the turbomachinery blades at low Re, several active and passive control techniques have been developed, such as pulsed vortex generator jets,4boundary layer suction,5and string wire.6Furthermore,the unsteady effects from upstream wakes were also considered.7-9Compared with others, the method based on the blade surface roughness shows superiority in controlling the boundary layer development effectively without applying extra complex geometries onto the blade. Thus, the effect of roughness on the aerodynamic performance of compressors has become an interesting research topic in the past few decades.
Extensive measurements and numerical simulations have been conducted for detailed investigations of roughness effects on compressors. Bammert and Woelk10compared the performance of a 3-stage axial compressor with smooth and rough blades,they observed a maximum decline of 30%in the overall pressure ratio and a 15%-20% volume flow decreased as the blades were roughened. Syverud et al.11,12conducted a measurement for an 8-stage axial compressor with rough blades,for which the adiabatic efficiency was decreased by 4%.Suder et al.13experimentally found that the blade roughness increased the shock loss in a transonic compressor rotor and the roughness covering near the leading edge contributed to the most performance degradation. Gbadebo et al.14focused on the endwall separation affected by roughness in a singlestage low-speed compressor, the roughness induced a larger hub corner separation with serious blockage and radial flow movement. Morini et al.15,16numerically surveyed the effects of different nonuniform combinations of surface roughness levels on the performance of NASA stage 37,with results from simulations showing that the stage performance was mainly affected by the roughness on the suction surface. A similar method was employed by Chen et al.to investigate the NASA stage 35 performance with smooth and rough blades under different Re conditions.17They observed that with a blade roughness magnitude of 50 μm, the maximum decrease in pressure ratio was approximately 4.1% and 8.4% under low and high Re conditions, respectively.
Several studies have also investigated the effects of roughness on the aerodynamic performance of compressor cascade.Back et al.18revealed that roughness in the aft half-chord region of a suction surface was mainly responsible for an increased profile loss and deviation for a highly loaded compressor cascade at Re=3×10⁵-6.4×10⁵. Im et al.19measured the boundary layer integral parameters and turbulent level for a low-speed compressor airfoil with a roughened leading edge and found that both the size of the LSB and the turbulent level downstream of the bubble region were decreased,leading to a slight reduction in profile loss at Re=2.1×10⁵.However,the airfoil performance was seriously deteriorated at Re=4.5×10⁵-6.5×10⁵. Leipold et al.20reported that despite the suppression of LSB upon application of roughness onto a blade at Re=3×10⁵, an additional profile loss was observed due to the rapid growth in the turbulent boundary layer.Kong et al.21presented the experimental results for a linear compressor cascade at Re=5×10⁵, and found that the blade roughness increased the skin friction,enhancing the turbulent separation near the trailing edge and thickening the wake.
Despite the efforts highlighted above,the previous research mainly focused on the performance of low-speed compressor airfoil at high Re conditions (Re>2×10⁵), and the roughness caused a negative effect in most cases. However, as the Re decreases below the critical level of 2×10⁵, the onset of the boundary layer transition on the compressor blade is delayed and the laminar region is extended. As such, the impact of the blade surface roughness on the profile loss and the detailed mechanism for this are longing to be further studied. Therefore, this paper presented a numerical investigation of the effects of roughness magnitudes and locations on the performance of a high subsonic compressor airfoil under a lower Re condition (Re=1.5×10⁵), particular emphasis was placed on the detailed comparison of the structure of LSB, boundary layer development, and turbulent level for the surface covered with different roughness magnitudes and locations, and the underlying physics of airfoil performance affected by surface roughness was clarified.
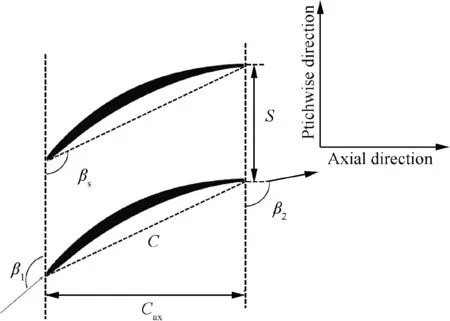
Fig. 1 V103 cascade.
2. Compressor cascade and numerical methods
2.1. Baseline geometry
The compressor blade profile used in this study is a high subsonic airfoil named V103 (Fig. 1), designed for the stator hub section in a highly loaded compressor. The thickness distribution of NACA 65 is superimposed on the camber line and the chord is extended to 180 mm to obtain a high resolution in measurements.22The inlet Mach number (Ma) and flow angle(β1)is 0.67 and 132°respectively,and the airflow remains subsonic at the design point in the compressor cascade passage.Detailed geometric and aerodynamic parameters are listed in Table 1.
2.2. Roughness magnitudes and locations
2.2.1. Roughness magnitudes
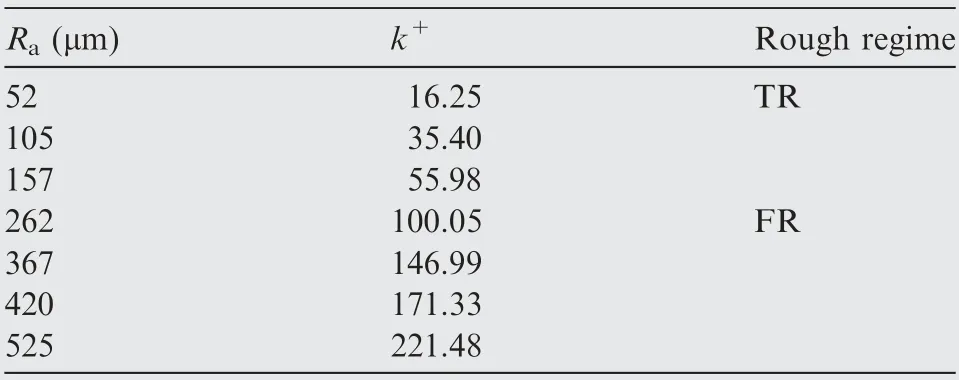
Previous works have indicated that only the roughness element protrudes through the local viscous sublayer in the turbulent region and that the roughness can influence the flow characteristics.23At the condition of Re ~105, the laminar flow region might be extended over 50% of the suction surface from the leading edge, and the laminar separation and transition will become more sensitive to roughness. In the present study,seven roughness magnitudes (the centerline averaged roughness, Ra) ranging from 52 μm to 525 μm were selected, which are representative roughness levels for those measured in real compressors in service.24
According to the relation proposed by Koch and Smith,25the equivalent sand-grain roughness (ks) can be calculated from the centerline averaged roughness (Ra) (see Eq. (1)),and the roughness magnitude can be further converted into a dimensionless roughness parameter k+(roughness Reynolds number) based on the Re and ks, see Eq. (2) and Eq. (3).26

where
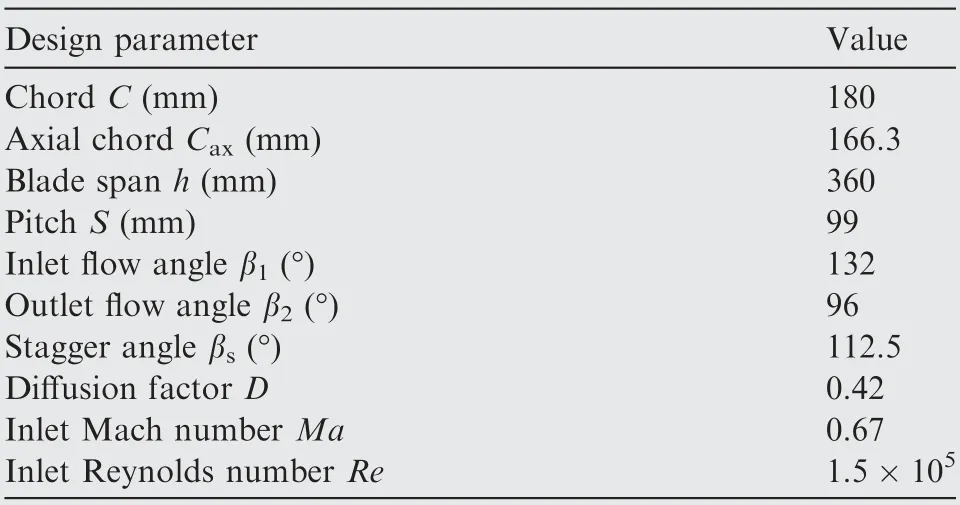
Table 1 Geometric and aerodynamic parameters for V103 cascade.

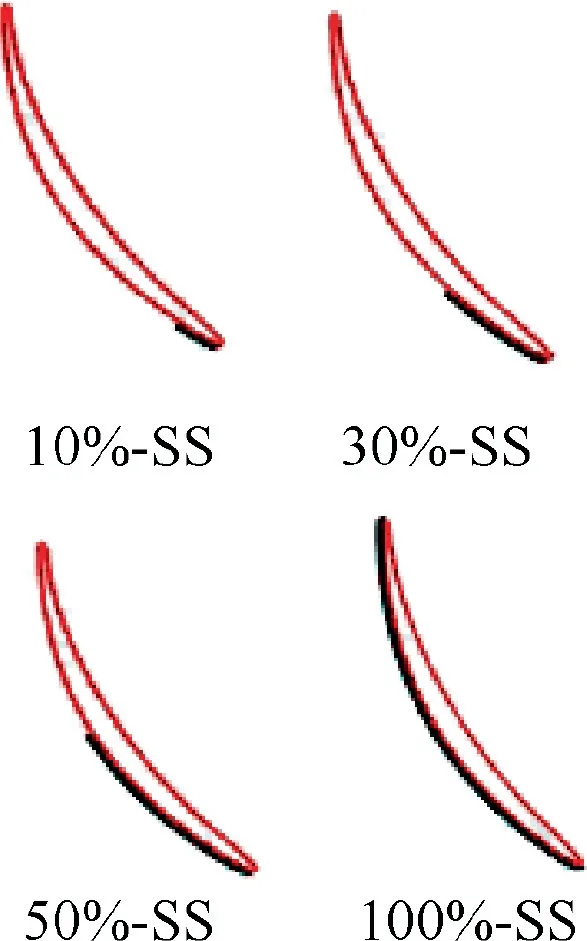
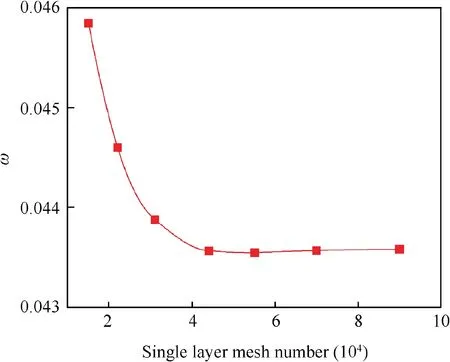
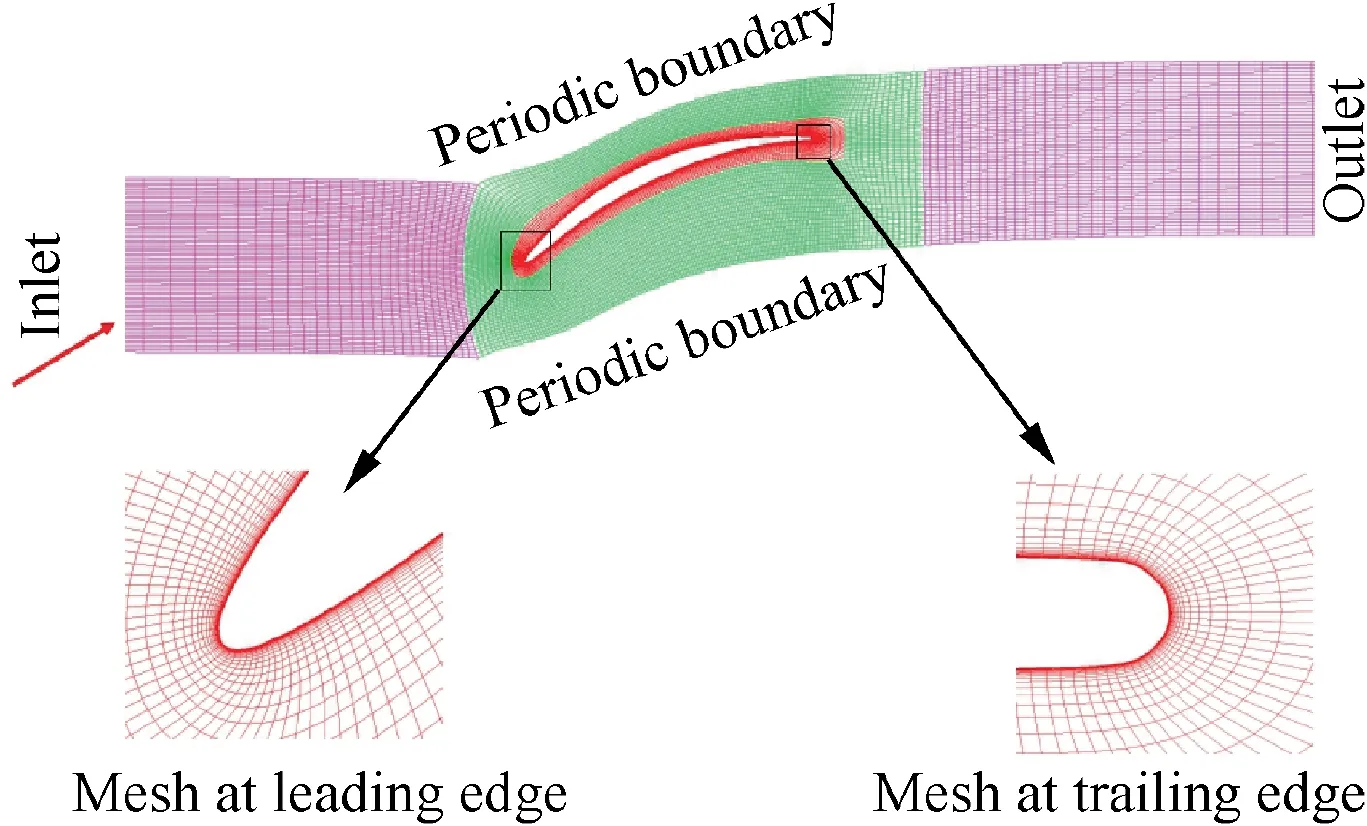
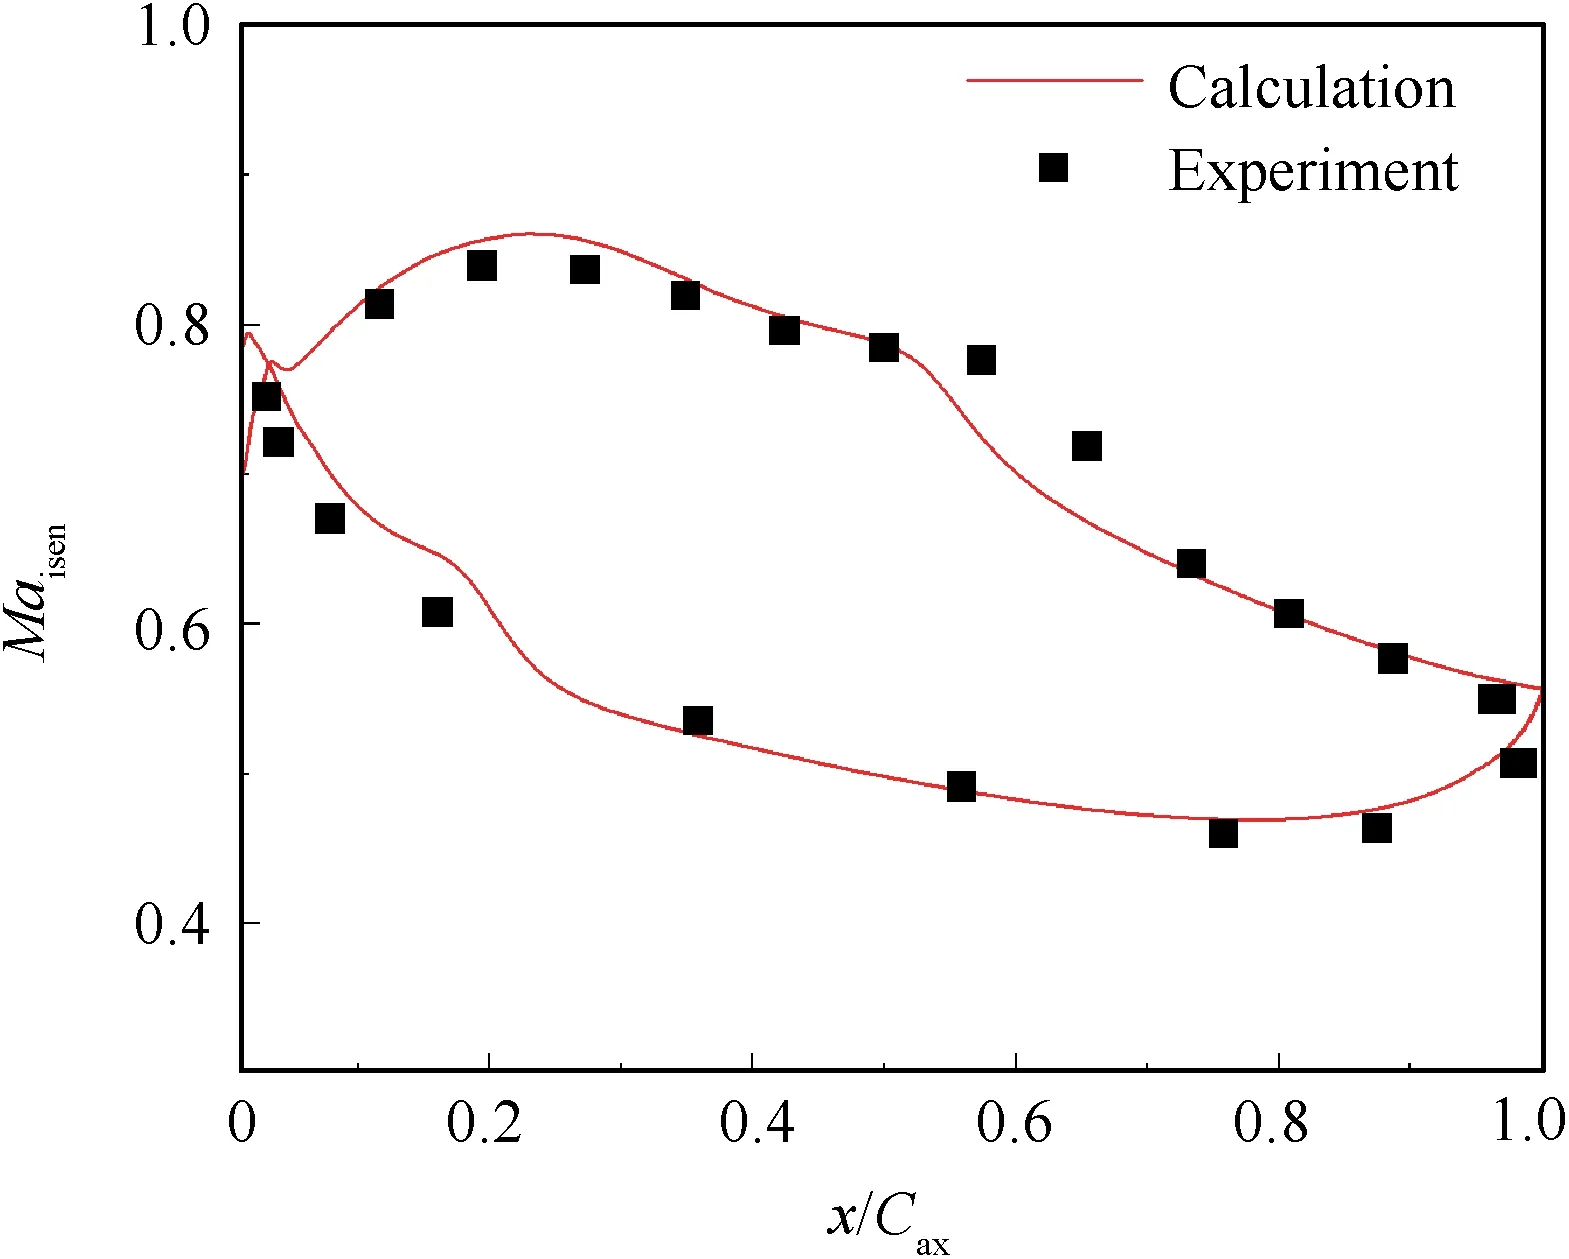
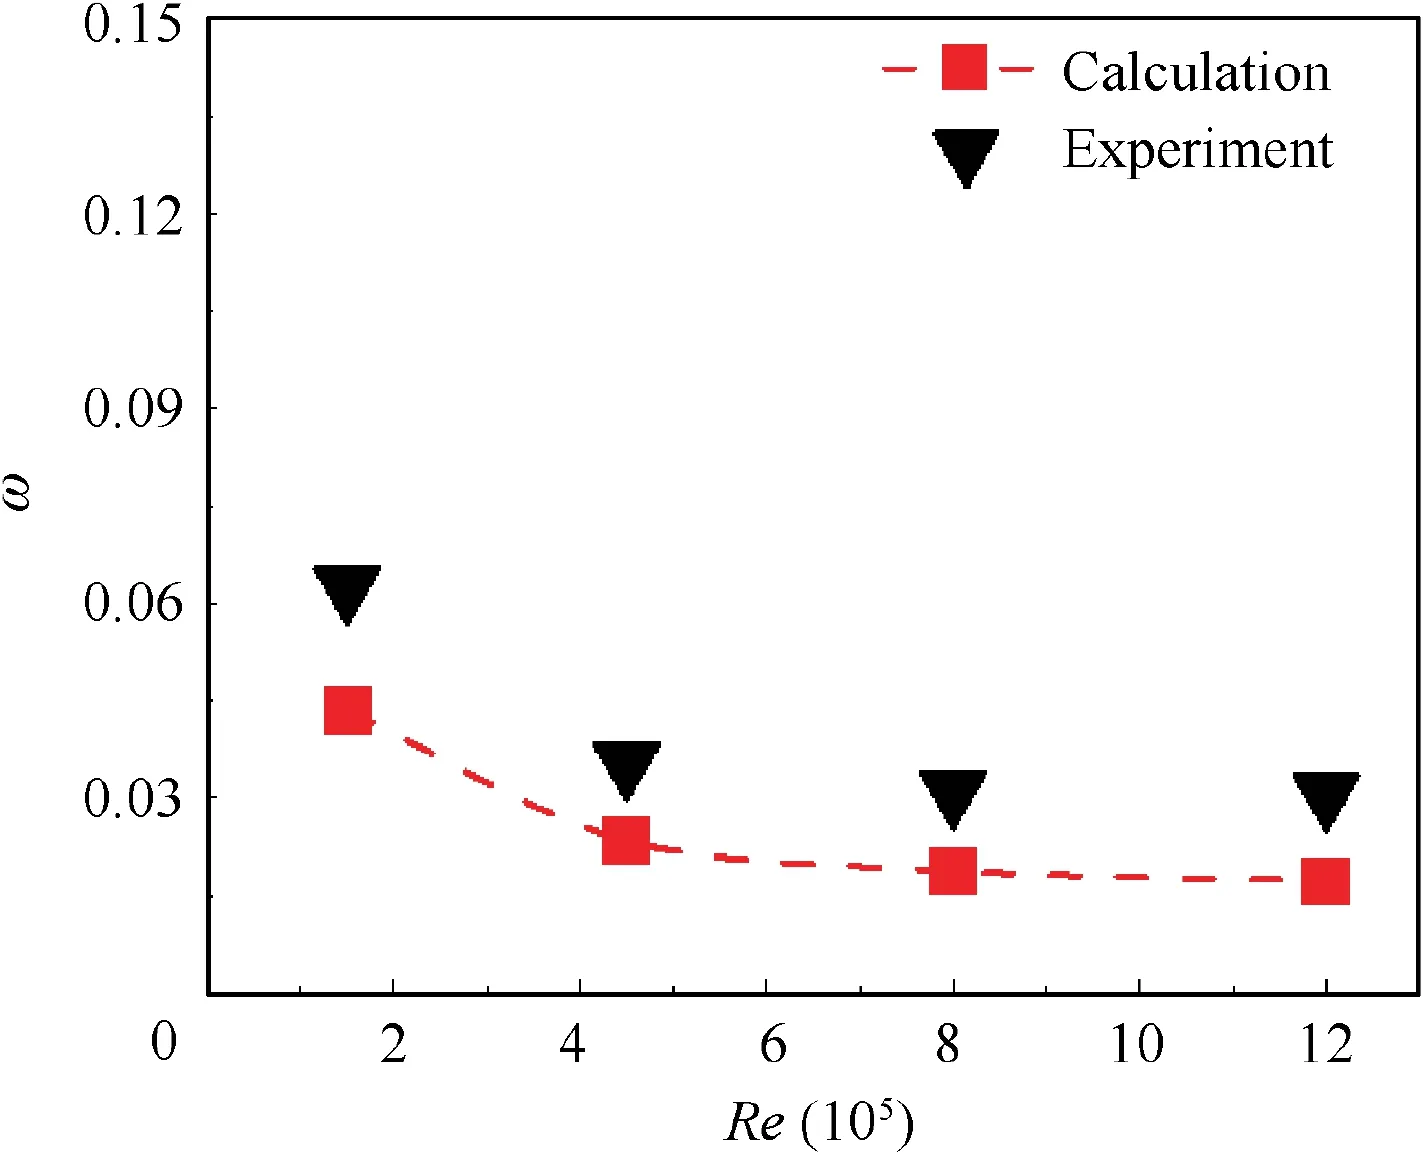
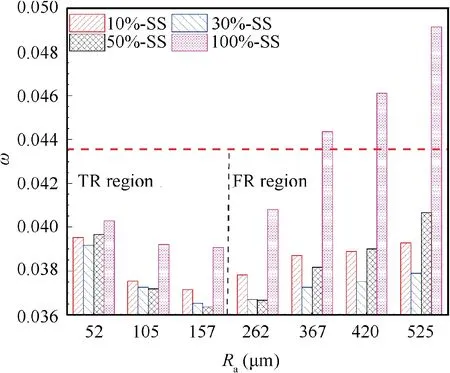
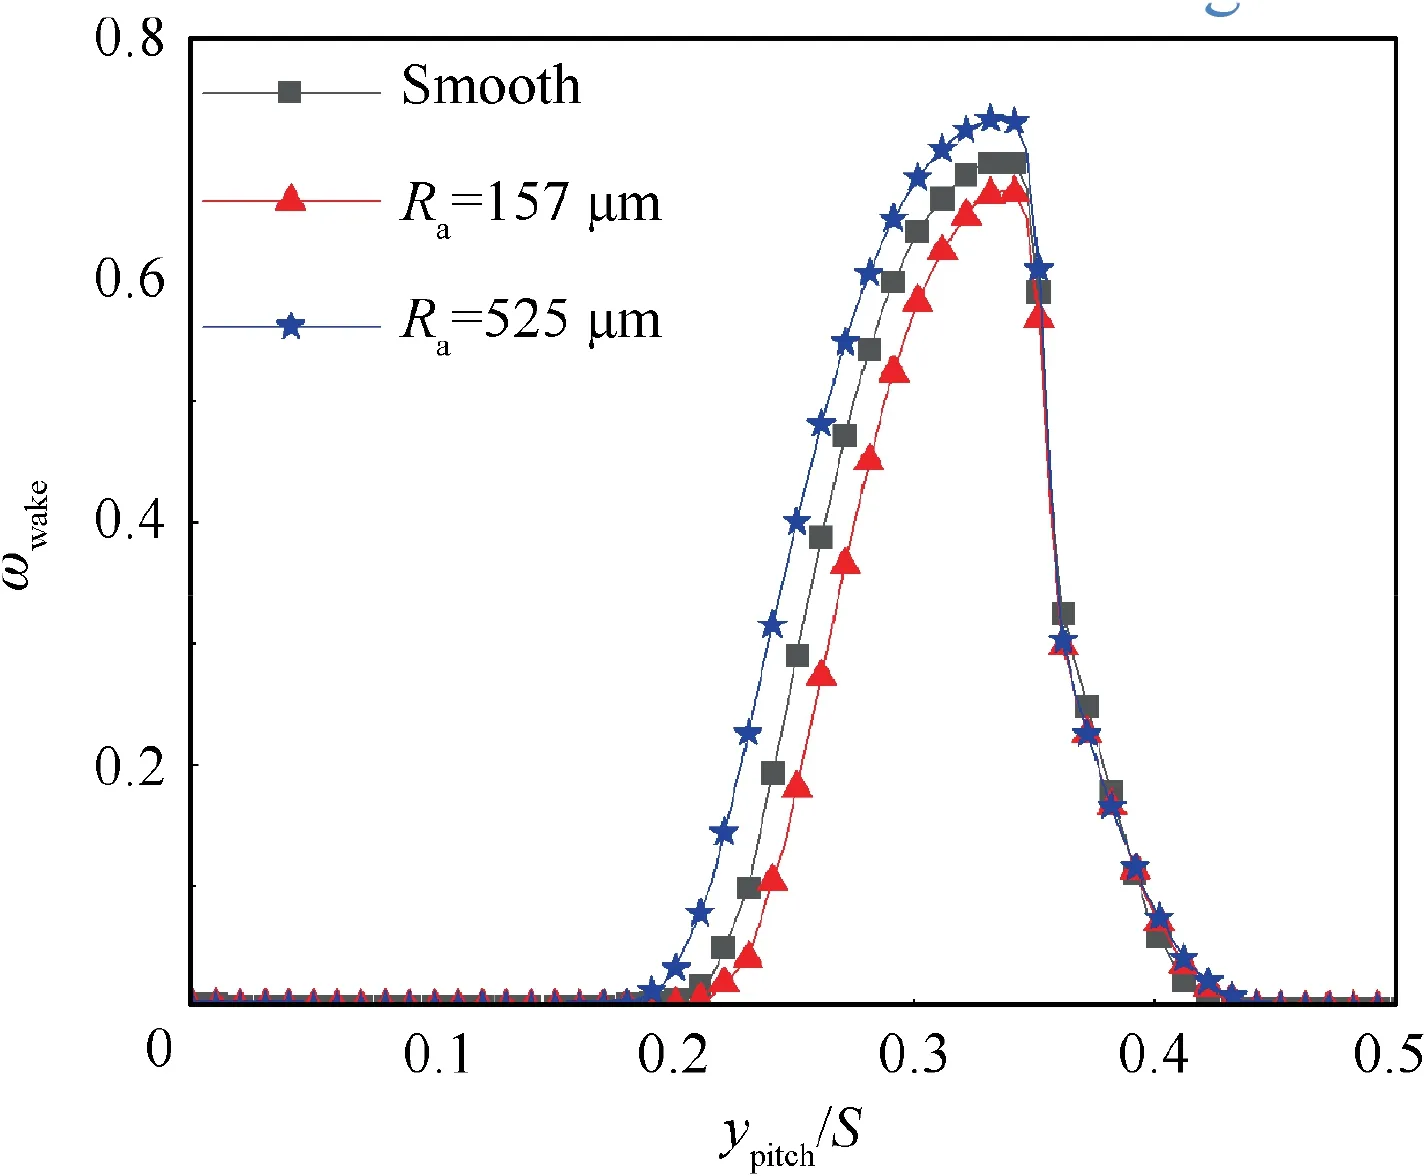
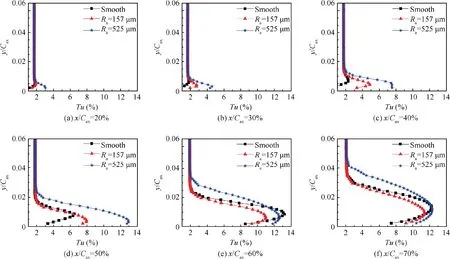
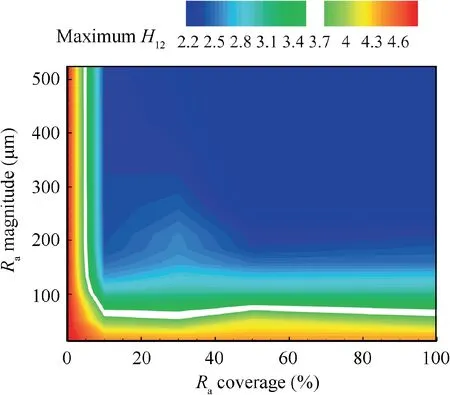
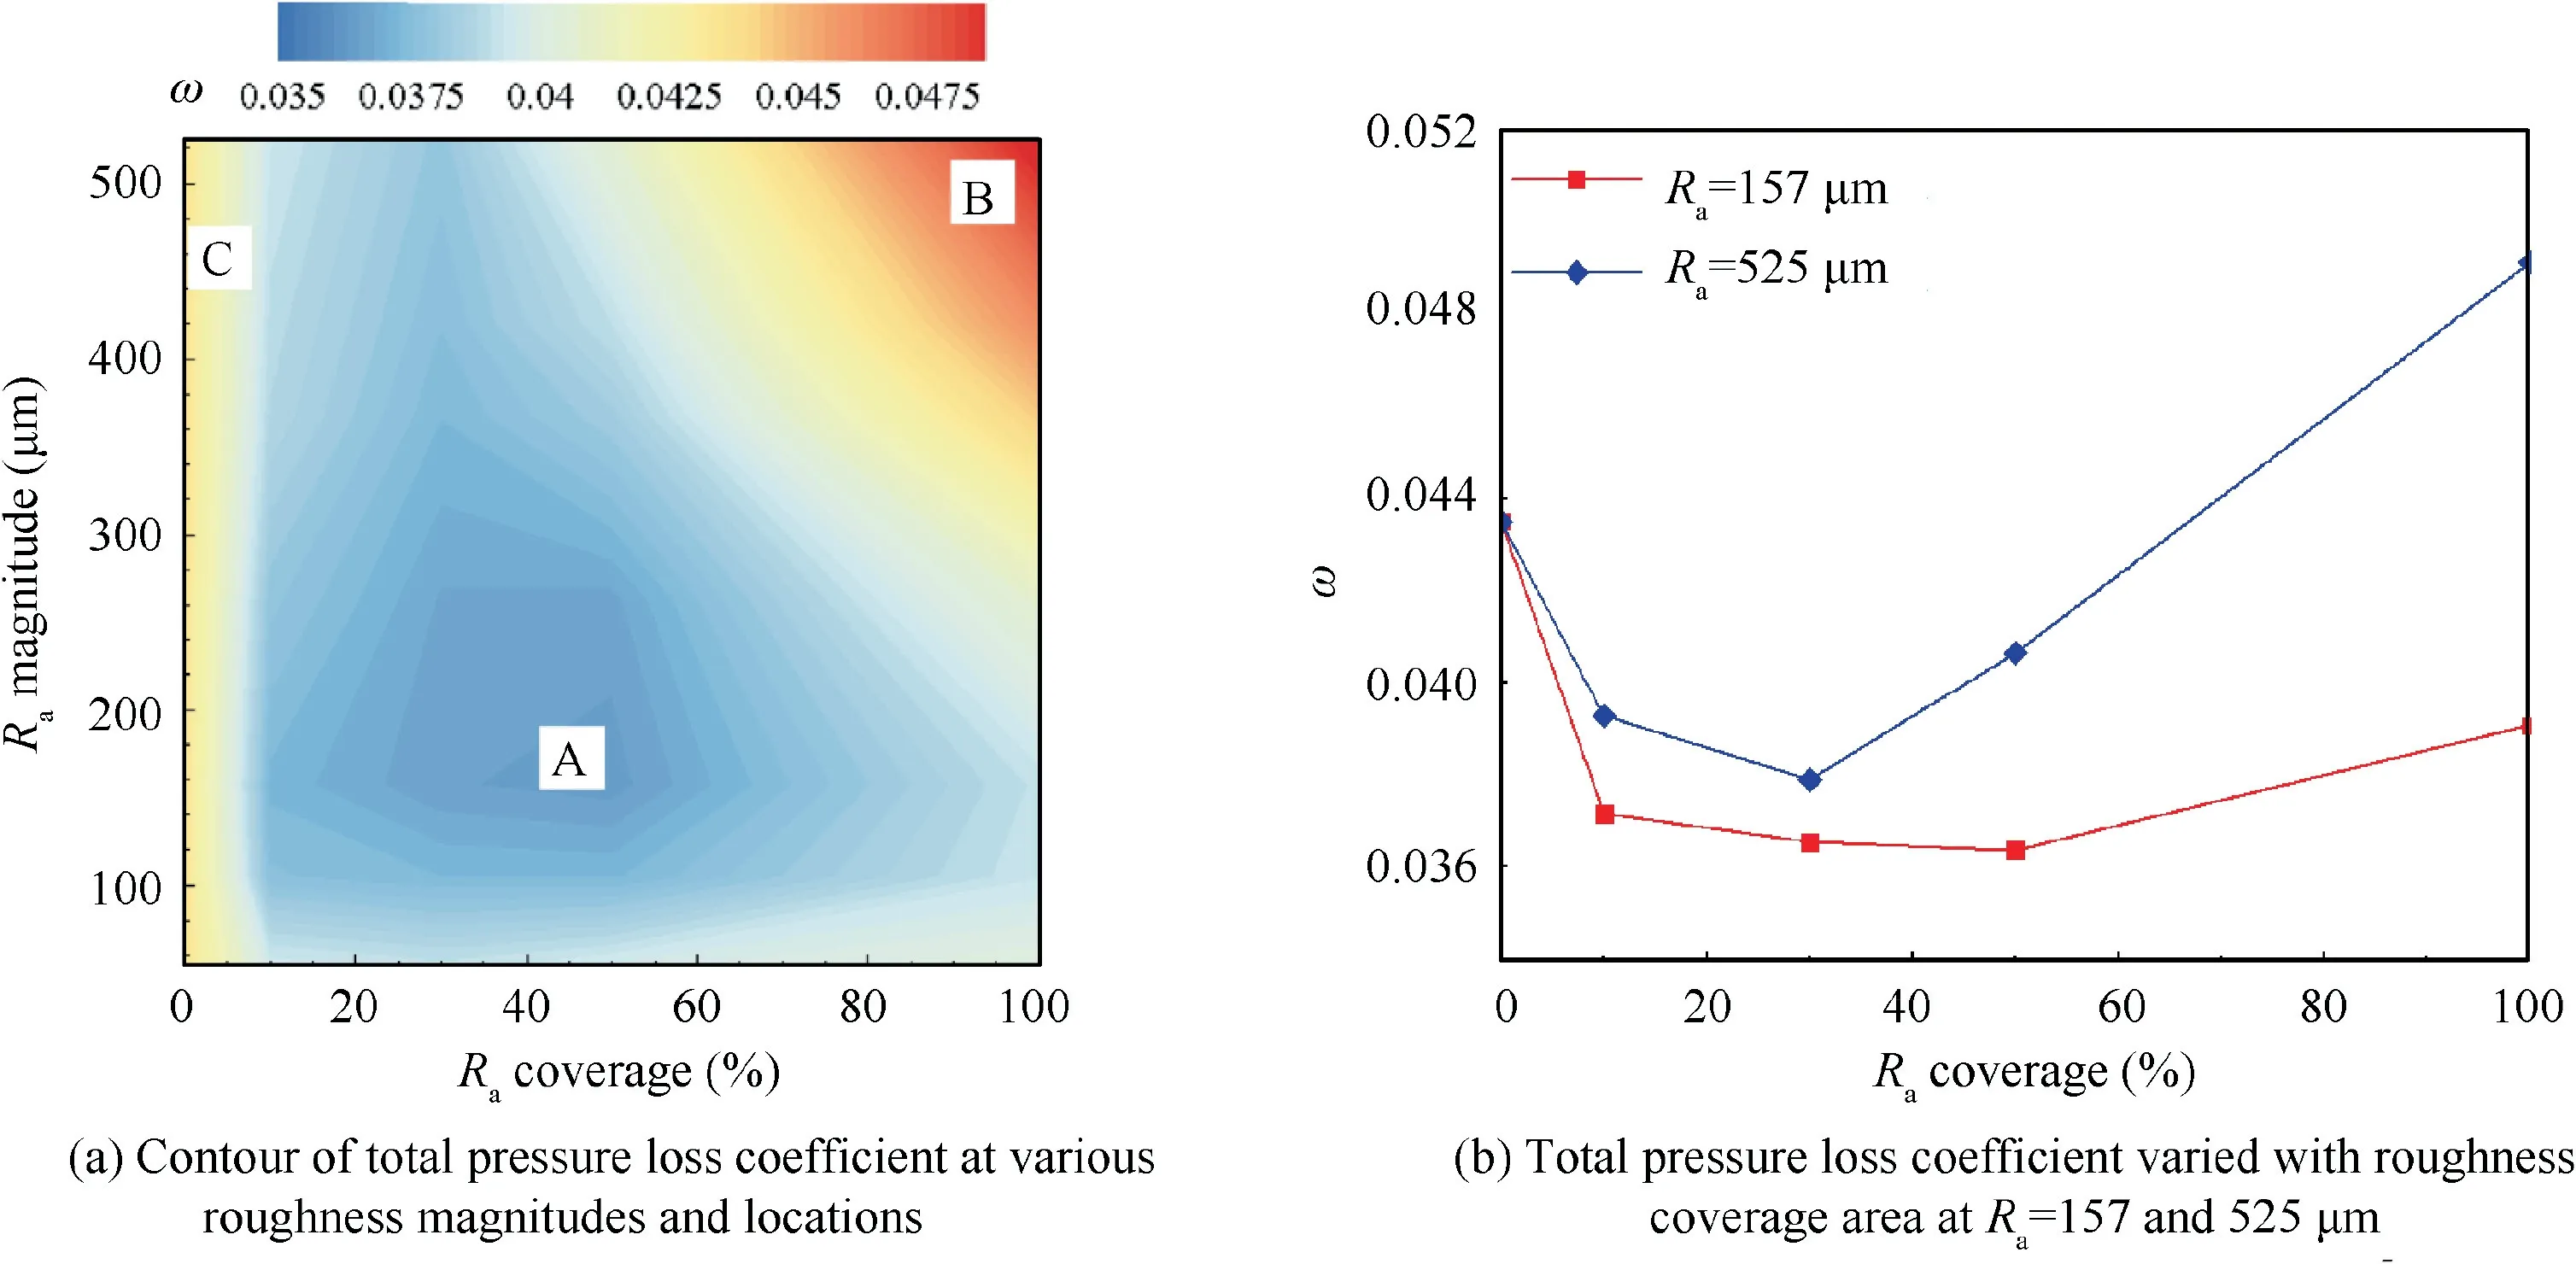
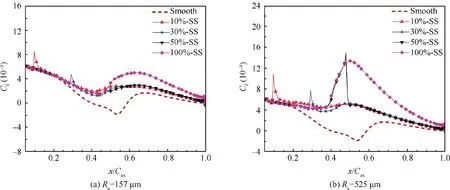
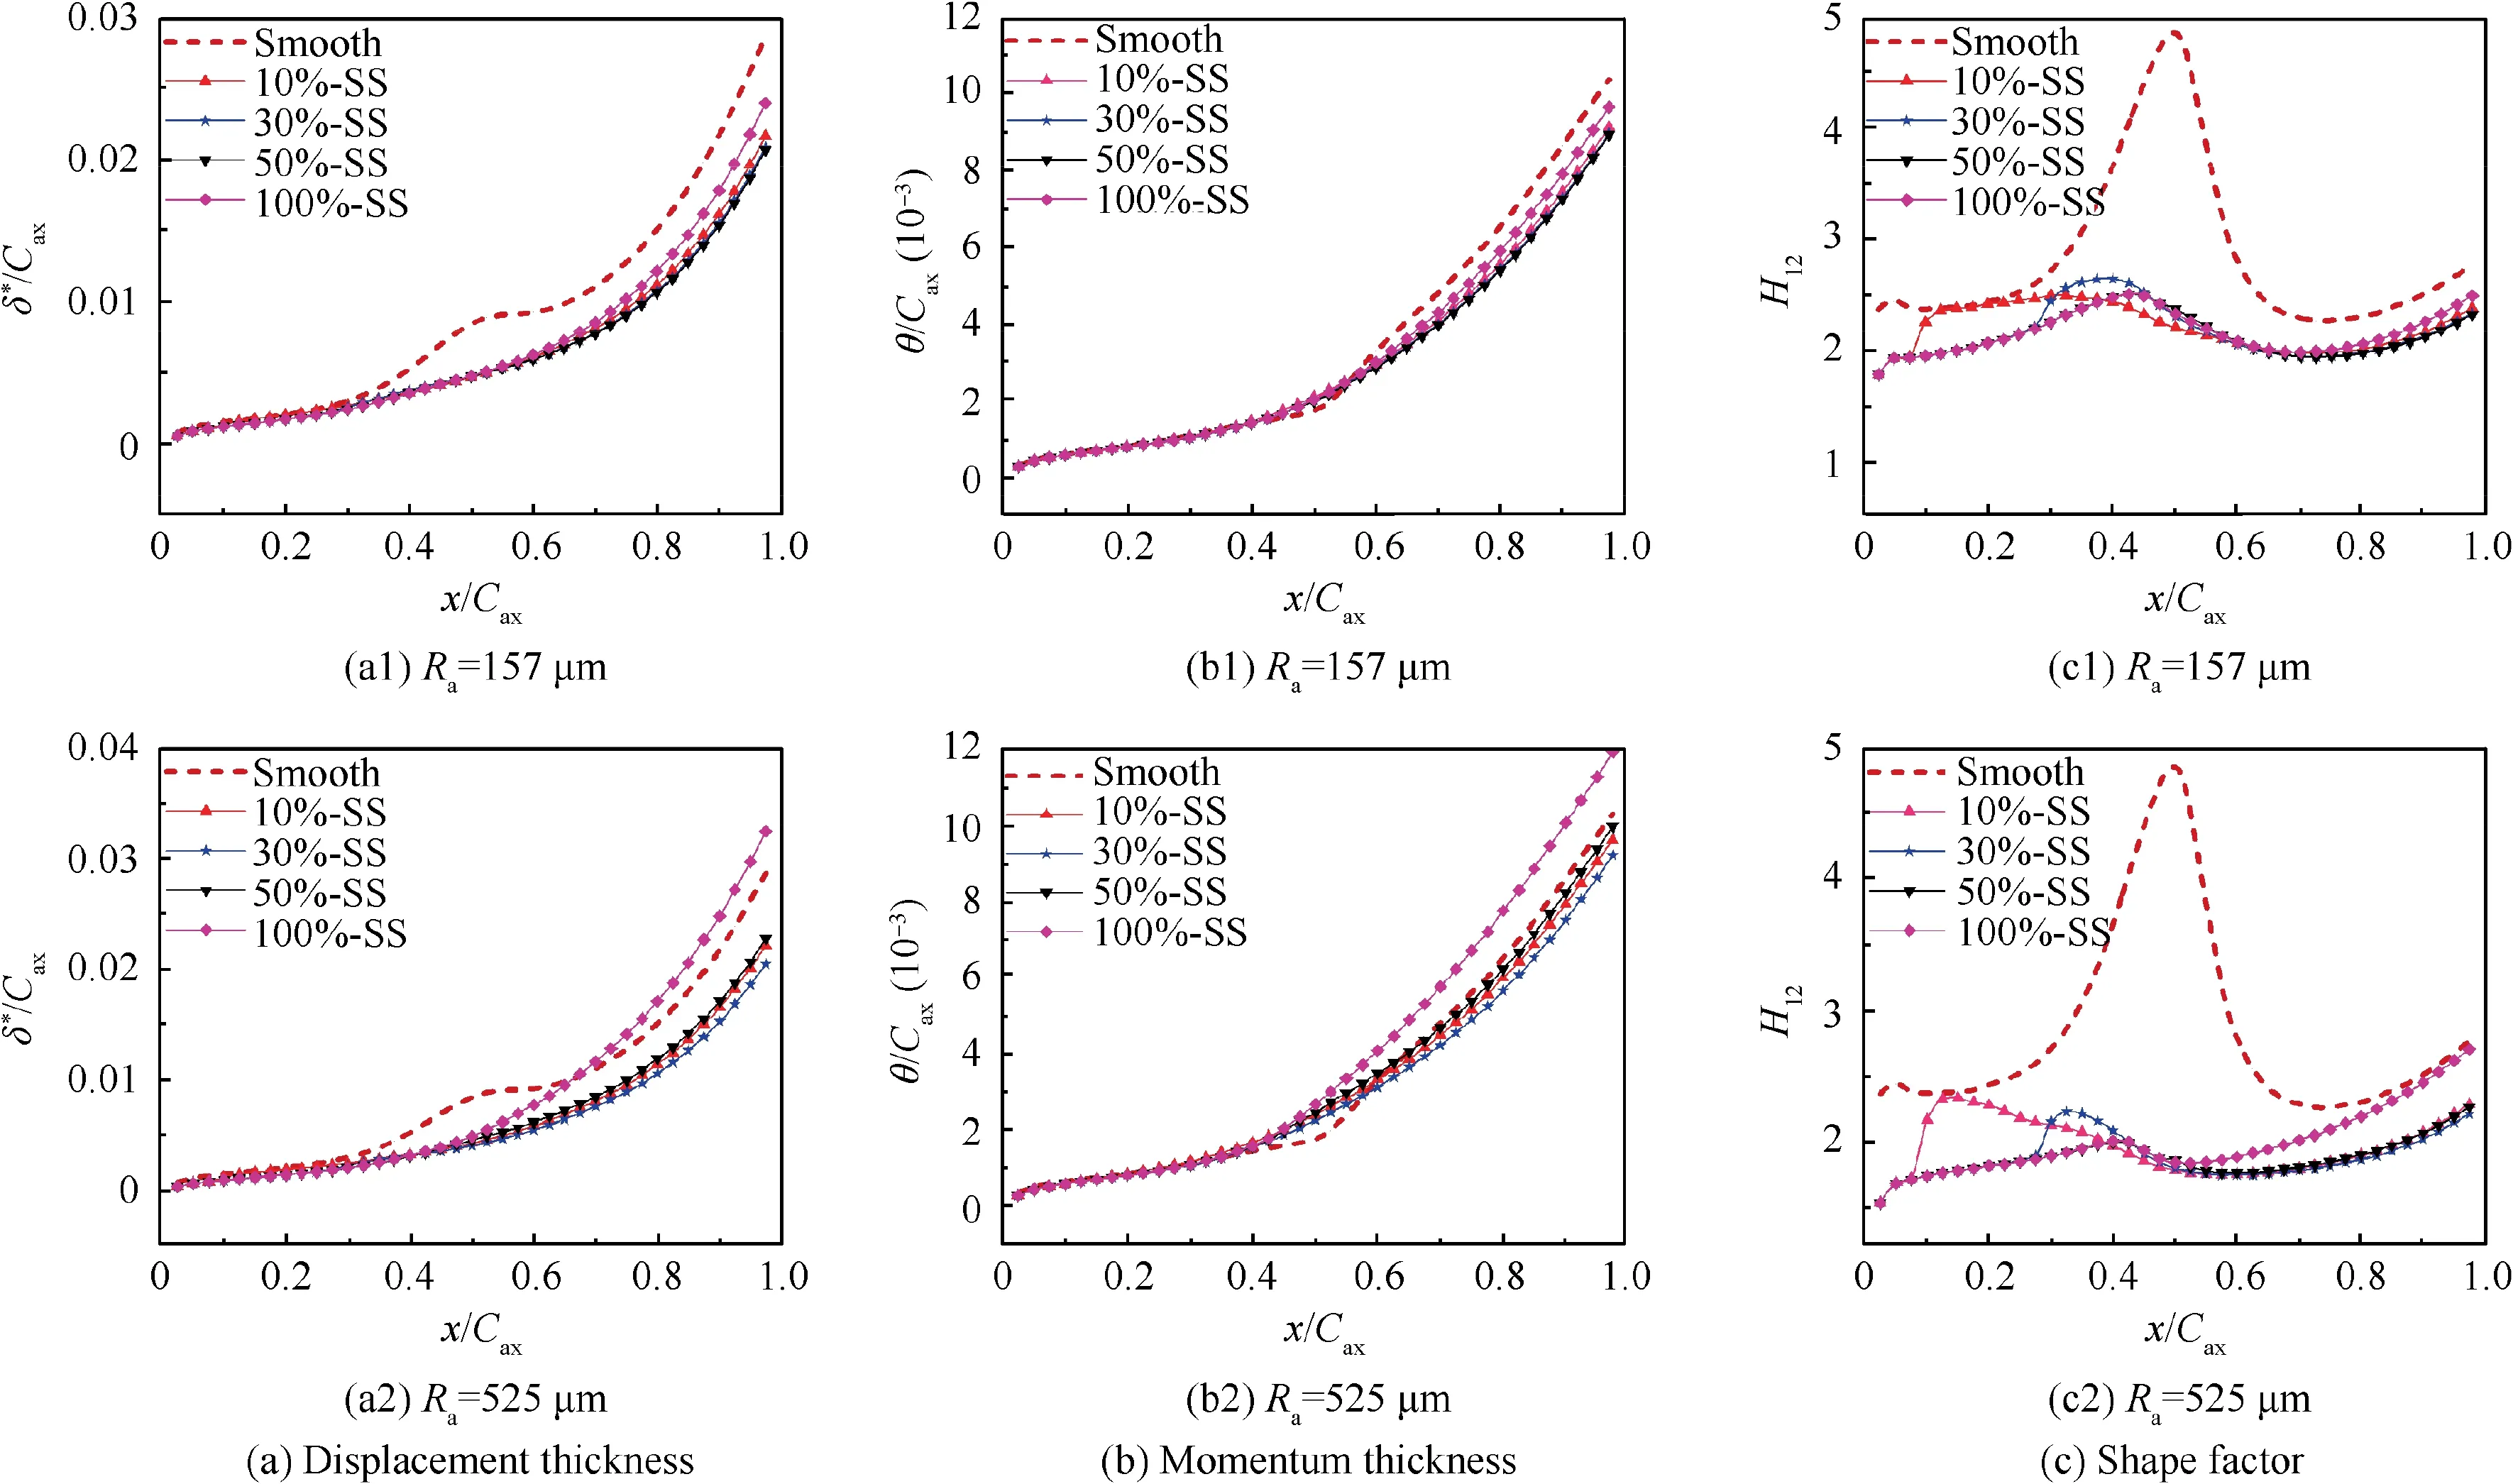
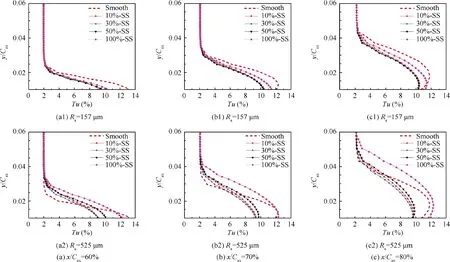
The roughness Reynolds number k+is a useful criterion to classify the roughness regime and estimate the effect of roughness on the flow characteristics. For a k+value below 5, the flow loss is barely affected by roughness (aerodynamically smooth region),while for 5 2.2.2. Roughness locations Four roughness locations were applied onto the suction surface, including a roughness covering 10%, 30%, 50% and 100% of the suction side from the leading edge (labeled 10%-SS, 30%-SS, 50%-SS, and 100%-SS, as shown in Fig. 2). Seven roughness magnitudes in Table 2 were selected for each roughness location to investigate the effects of roughness on the profile loss in detail. 2.3.1. Turbulence and wall modeling Numerical simulations were conducted using the commercial CFD software, ANSYS CFX. This code solves the threedimensional, steady, Reynolds-Averaged form of the Navier-Stokes(RANS)equations based on a finite volume.To capture the laminar boundary layer separation and transition phenomenon on the blade surface under low Re condition, the Shear Stress Transport (SST) turbulence model, coupled with the correlation-based γ-Reθtransition model was employed in computations. The topology of the mesh was O4H, generated in NUMECA/Autogrid and then exported to the CFX solver.The near-wall grid was refined and a maximum dimensionless wall distance y+=1 was achieved on the first node off the solid wall. A grid independence test has been conducted, as shown in Fig. 3 (ω is the total pressure loss coefficient). Results revealed that approximately forty thousand grid elements were needed for S1 to reach the mesh convergence. The mesh for S1 is shown in Fig. 4. The automatic near-wall treatment method were used in the present study. As the mesh is refined, it will automatically switch from wall-functions to a low-Re near wall formulation by means of providing an additional formulation,which allows the highly accurate simulations in the sublayer portion of theboundary layer. Also, the wall treatment method has been extended for the rough walls. When a roughness height has been specified for a wall, the automatic rough wall treatment is used,otherwise the automatic smooth wall treatment.Moreover, the automatic near-wall treatment is combined with the transition model,and the transition momentum thickness Reynolds number in the γ-Reθmodel is modified to simulate the roughness effect. Table 2 Roughness magnitudes on suction side. Fig. 2 Roughness locations on suction side. Fig 3 Mesh independence study. Fig. 4 Computational mesh. 2.3.2. Boundary conditions For the computation domain, the inlet plane was located at 150%of the axial chord upstream of the leading edge,the total pressure P01,total temperature T01and inlet flow angle β1were imposed onto the inlet boundary,and the turbulence level was set to 3.8% according to the experimental condition.22While the outlet plane was extended at 200% of the axial chord downstream of the cascade and the average static pressure P2was specified. The pitchwise boundaries were connected by a periodic condition. On the blade surface and the endwall, non-slip adiabatic conditions were applied. Fig. 5 Experimental and numerical results of Maisen at Re=1.5×10⁵. 2.3.3. Numerical validation Extensive measurements for the V103 cascade were conducted by Boese and Fottner.22Fig. 5 compared the numerical and experimental results for the isentropic Mach number (Maisen)distribution at Re=1.5×10⁵.The predicted Maisenwere consistent with the experimental data, and the plateau (a nearly constant pressure distribution)in the diffusion region implying the laminar separation and subsequent transition process were also captured. However, the predicted transition location at the end of the plateau slightly moved upstream. This was mainly because that some correlation functions in the γ-Reθtransition model were determined based on the many experiments on a flat plate, and there were some inherent shortcomings in accurately predicting the transition process on the compressor suction surface with high curvature. Moreover,the ability of RANS method for capturing the complex dynamics of vortexes in the separation flow was limited,which resulted in the underestimation of the total pressure loss under all Re conditions, as shown in Fig. 6. Nevertheless, the predicted result showed a similar trend compared with the measurement data,so the numerical method was relatively reliable and can be used for further investigations. Fig. 6 Experimental and numerical results of total pressure loss for smooth blade at different Re. (1) Profile loss The total pressure loss coefficient ω of the compressor airfoil under different roughness magnitudes and locations covered onto the suction surface was calculated respectively, as shown in Fig.7.The ω was defined as the total pressure difference between the aerodynamic inlet (100% of the axial chord upstream of the leading edge) and outlet (150% of the axial chord downstream of the trailing edge) at the midspan, and the total pressure difference was normalized by the inlet dynamic pressure. where P0is the total pressure,and P is the static pressure.The subscript 1 and 2 represent the aerodynamic inlet and out plane, respectively. The variation trends for the profile loss with the roughness magnitudes were similar for all roughness locations. The red dot line in Fig.7 indicated the profile loss of a smooth surface(ω=0.0435).In the transitionally rough region(Ra≤157 μm,TR),the profile loss was decreased gradually with the increase of roughness magnitude. The maximum reduction in profile loss was approximately 14.6%, 16.04%, 16.45% and 10.20%at Ra=157 μm for the four roughness locations (10%-SS,30%-SS, 50%-SS, and 100%-SS), indicating that the roughness in the transitionally rough region has considerable potential to improve the aerodynamic performance of the compressor airfoil at low Re.However,with a further increase of roughness magnitude from 157 μm (in the fully rough region, FR), the profile loss began to increase instead, especially for the case of 100%-SS, a rapid increase in profile loss was observed, which was increased by 13% at Ra=525 μm compared with the smooth case. Therefore, the positive effect of surface roughness on reducing the profile loss at low Re was weakened or even eliminated in the fully rough region. Fig. 7 Profile loss vs roughness locations and magnitudes at Re=1.5×10⁵. To investigate the underlying physics of the profile loss affected by different roughness magnitudes,two representative roughness magnitudes of 100%-SS, Ra=157 μm, and 525 μm, were selected to compare with the smooth case(Ra=0).The first one,Ra=157 μm,was in the transitionally rough regime and reduced the profile loss most significantly,while the second one,Ra=525 μm,was the typical roughness magnitude in the fully rough regime and deteriorated the aerodynamic performance. (2) Blade loading and wall shear stress Fig. 8 showed the isentropic Mach number (Maisen) and skin friction coefficient(Cf)distribution of the suction surface.For the smooth case (Ra=0), the laminar flow separation occurred at x/Cax=39.6% and reattached on the wall at x/Cax=58.3%,a closed LSB was visible on the suction surface.Correspondingly, there was a nearly constant pressure region(plateau) in the bubble region. As the suction surface was roughened with Ra=157 μm, the laminar separation was eliminated and the plateau disappeared. As the roughness magnitude increased to 525 μm, the onset of transition moved upstream and the skin friction increased to a relatively high level in the turbulent region, compared with the case of Ra=157 μm. (3) Velocity contour near the wall The velocity U near the wall of the suction side was given in Fig. 9 (the value was normalized by the inlet velocity U1), the black dot line indicated the boundary layer displacement thickness(δ*)and the black solid lines were the streamlines near the wall.For a smooth blade(Ra=0),a wedge-shape LSB formed on the suction surface. It seemed that the boundary layer development and the loss generation process were closely associated with the LSB. On one hand, it can be seen that the displacement thickness distribution showed good consistency with the external boundary of the LSB.Before laminar separation, the displacement thickness grew gently, however, a steep increase in the displacement thickness was found in the bubble region,which reached its local peak at the location of the maximum thickness of the LSB, then continued growing up at the aft half-chord. As such, much low momentum flow was accumulated near the trailing edge, resulting in serious flow blockage and wake mixing near the trailing edge. Moreover, there was a distinct reverse flow region inside the bubble, the flow mixing in the re-circulation also further increased the profile loss. This can be denoted as the displacement effect of the LSB, which enhanced the loss generation and degraded the aerodynamic performance of the compressor airfoil. As the suction surface was roughened with the magnitudes of 157 μm,the laminar separation was eliminated and the negative displacement effect of LSB on the performance of airfoil was avoided.As such,the growth rate of the boundary layer in the turbulent region was much smaller and the accumulation of the low momentum flow near the trailing edge was mitigated. Also, the reversed flow inside the bubble disappeared.Therefore, a maximum profile loss reduction of 10.20% was achieved. However, with a further increase of roughness magnitude from 157 μm to 525 μm, the boundary layer grew rapidly in the turbulent region and much more low momentum flow was accumulated near the trailing edge instead. Fig. 8 Isentropic Mach number and skin friction of suction side vs roughness magnitudes at Re=1.5×10⁵. Fig. 9 Velocity contour near the wall of the suction side vs roughness magnitudes at Re=1.5×10⁵. (4) Wake loss distribution Fig. 10 compared the loss coefficient in the wake region(ωwake) plotted versus the nondimensional pitch distance(ypitch/S). As the blade surface was covered by the roughness of 157 μm, despite the locus of the maximum loss barely changing in the pitch direction, the wake width and depth decreased visibly due to the less low momentum flow accumulated near the trailing edge. As the roughness magnitude further increased from 157 μm to 525 μm, both the maximum loss magnitude and wake width were enhanced steeply, which were both larger than those of smooth case,indicating that the larger roughness magnitudes in the fully rough region thickened the wake and degraded the performance instead. These were all consistent with the results as shown in Fig. 9. Fig. 10 Wake loss coefficient vs roughness magnitudes at Re=1.5×10⁵. (5) Boundary layer analysis To detect the underlying physics of the aerodynamic performance of compressor airfoil affected by the surface roughness,the boundary layer integral parameters, including displacement thickness(δ*),momentum thickness(θ)and shape factor(H12)were given in Fig.11.The displacement and momentum thickness were normalized by the axial chord length(Cax).For the smooth blade, due to the existence of LSB on the suction surface, a rapid increase in both displacement thickness and momentum thickness was found in the bubble region. The shape factor H12can also be used to indicate laminar separation, transition, and turbulent reattachment. Thwaites27and Walker28found that the laminar flow separation occurred at H12=3.7 and the turbulent flow reattached on the wall as H12was decreased from the peak value to 3.5.For the smooth blade, the peak value of H12reached 4.8 at x/Cax=50%,implying serious local separation occurred.As the suction surface was roughened with Ra=157 μm,the onset of transition was promoted, so the location of the H12peak moved further upstream. Also, as the laminar separation was eliminated, the H12peak value decreased to 2.5.As such,the turbulent boundary layer was increased more slowly due to the suppression of LSB. The momentum thickness near the trailing edge was decreased by 6.9% and the flow blockage and mixing were weakened, so the airfoil performance was improved. By comparison, with the roughness further increasing from 157 μm to 525 μm, the transition point moved further upstream and the momentum thickness began to increase quickly at x/Cax=40%. Moreover, the growth rate of the momentum thickness after the transition was larger on account of the higher skin friction,so the momentum thickness near the trailing edge was increased by 13.23% compared with that of smooth case. Fig. 11 Boundary layer integral parameters for suction side vs roughness magnitudes at Re=1.5×10⁵. (6) Turbulence intensity Fig.12 compared the turbulence level distribution at different streamwise locations.Before laminar separation(such as x/Cax=20%, 30%), the turbulence level for the two rough blade cases was larger than that of the smooth case,especially at Ra=525 μm. However, as the LSB was suppressed on the rough blade with Ra=157 μm, the turbulence level downstream of the LSB (such as x/Cax=50%, x/Cax=60%, and x/Cax=70%) was slightly reduced, it can be concluded that the roughness in the transitionally rough region not only suppressed the negative displacement effect of the LSB on the wake thickening but also reduced the turbulent level downstream of the LSB, which weakened the turbulent dissipation and further contributed to the profile loss reduction. With the roughness magnitude further increasing to 525 μm, the rapid increase in turbulence level downstream of the LSB,inducing stronger viscous dissipation,was dominant in the loss generation process. As such, the advantage of suppressing the LSB was overcompensated and the profile loss was increased instead. From what has been mentioned above, it can be supposed that the positive and negative effect of surface roughness, suppressing the LSB and inducing strong turbulent dissipation, should be balanced in order to significantly improve the aerodynamic performance of the compressor airfoil at low Re. (1) Laminar separation Fig. 12 Turbulence level at different streamwise locations vs roughness magnitudes at Re=1.5×10⁵. Fig. 13 Maximum boundary layer shape factor vs roughness magnitudes and locations at Re=1.5×10⁵. The laminar separation played an important part in the aerodynamic performance of the compressor airfoil at low Re.To investigate the impact of the roughness on the laminar separation, the maximum value of H12under different roughness magnitudes and locations was compared in Fig. 13. For the smooth case, the maximum value of H12reached 4.8 and larger laminar separation occurred on the suction surface. As the roughness magnitude was larger than 105 μm and covered more than 10% of the suction surface from the leading edge,the maximum value of H12decreased far below 3.7. In other words,the leading edge roughness mainly determined the elimination of laminar separation on the suction surface. (2) Profile loss Fig. 14(a) showed the contour of the total pressure loss coefficient(ω)under different roughness magnitudes and locations (the roughness coverage region was marked using the percentage of the entire suction surface area,see Fig.2).Compared with the smooth case (Region C), a roughness covered between 30%and 50%of the suction surface from the leading edge, and the magnitude ranging approximately from 150 μm to 200 μm (Region A) reduced the profile loss most significantly. However, with further increasing the roughness coverage area and magnitude,such as that for region B,where the roughness covered more than 80% of the suction surface with a magnitude exceeding 500 μm, the airfoil performance was seriously deteriorated. Fig.14(b)compared the variation trends for the total pressure loss coefficient (ω) with the roughness coverage area at Ra=157 μm and 525 μm,respectively.At a roughness magnitude of 157 μm,the profile loss was decreased rapidly(approximately 14.6%)as 10%of the suction surface from the leading edge was roughened, but there was little improvement when the roughness coverage area further increased from 10% to 50% of the suction surface. It seemed that the leading edge roughness contributed to the most performance improvement.When the roughness magnitude increased to 525 μm, the profile loss kept decreasing with the increase of roughness coverage area until 30% of the suction surface. As such, the maximum reduction in profile loss was 12.9%. In general,the variation in the trend for the profile loss with the roughness coverage area was similar for Ra=157 μm and 525 μm, but the profile loss was more sensitive to the roughness coverage area at higher roughness magnitude. (3) Skin friction and boundary layer analysis The skin friction coefficient and the boundary layer integral parameters for the suction side at Ra=157 and 525 μm were given in Figs. 15 and 16. At the roughness magnitude of 157 μm, the roughness covering only 10% of the suction surface from the leading edge was sufficient to eliminate laminar separation, then the negative effect of LSB on thickening the boundary layer was suppressed. Thus, the flow mixing and blockage near the trailing edge were both mitigated, leading to a significant reduction in the profile loss. With the roughness coverage area increasing from 10%to 50%of the suction surface from the leading edge,as the roughness magnitude was relatively small, the disturbance induced at the end of roughness coverage area was too weak to trigger a complete transition process. As such, the onset of the transition process occurred identically at x/Cax=40% for all the roughness locations, and there was a less distinguished difference of boundary layer displacement and momentum thickness.Therefore, the profile loss was barely affected. As the entire suction surface was roughened, the skin friction in the turbulent region increased to a very high level,enhancing the stronger viscous dissipation and resulting in a rapid increase in profile loss. Fig. 14 Total pressure loss coefficient vs roughness magnitudes and locations at Re=1.5×10⁵. Fig. 15 Skin friction coefficient of suction side vs roughness locations at Ra=157 μm and 525 μm. Fig. 16 Boundary layer integral parameters of suction side vs roughness locations at Ra=157 μm and 525 μm. However, at a larger roughness magnitude of 525 μm, the boundary layer development became more susceptible to the roughness location. For the roughness covering 10% and 30% of the suction surface from the leading edge (10%-SS,30%-SS), a complete transition process occurred at the end of roughness coverage area, which can be demonstrated by the H12reaching its peak near the location of x/Cax=10%and x/Cax=30%, respectively. Compared with the 10%-SS case, the transition of the 30%-SS was delayed and the skin friction between x/Cax=10% and x/Cax=50% was lower;therefore, the boundary layer grew rather slowly in the turbulent region.As for the 50%-SS and 100%-SS cases,the transition occurred nearly at x/Cax=40%, the larger skin friction in the turbulent region caused the rapid growth in boundary layer thickness,which degraded the aerodynamic performance of airfoil. (4) Turbulence intensity Fig. 17 Turbulence level at different streamwise locations vs roughness locations at Re=1.5×10⁵. Fig. 17 compared the turbulence level at different streamwise locations at Ra=157 μm and 525 μm, respectively. At Ra=157 μm, all the roughness locations covered on the suction surface decreased the turbulent level due to the depression of the LSB.For roughness coverage ranging from 10%to 50%of the suction side from the leading edge,the difference for turbulence level was almost indistinguishable, so the viscous dissipation was also nearly equivalent. However, when the entire suction surface was roughened,the stronger viscous dissipation induced in the turbulent region resulted in larger profile loss. At a roughness magnitude of 525 μm, for the case of 10%-SS, the transition occurred earlier than that of the 30%-SS case, the turbulent boundary layer was more fully developed,so the turbulence level was slightly higher. As the roughness coverage area increased to 50% or 100% of the suction surface,the turbulence level was increased more rapidly;in particular, for the 100% case, the turbulence level was much larger than that of the smooth surface. Therefore, the airfoil performance was seriously deteriorated. This paper investigated the impact of roughness magnitude(Ra) and location on the aerodynamic performance of a high subsonic compressor airfoil at low Re (Re=1.5×10⁵). The main findings can be summarized as follows: (1) The surface roughness mainly determined the loss generation process by influencing the structure of LSB and the turbulence level near the wall.In the transitionally rough region, the roughness had the potential to eliminate the LSB, the negative displacement effects of which on thickening the wake and inducing the stronger turbulent dissipation were suppressed; the maximum reduction in profile loss was approximately 14.6%, 16.04%, 16.45%and 10.20% at Ra=157 μm for the four roughness locations.However,with a further increase in roughness magnitude after the LSB was eliminated, the advantage of LSB suppression was gradually overcompensated by the stronger viscous dissipation in the turbulent region.As such, the growth of the turbulent boundary layer was enhanced and the aerodynamic performance of the compressor airfoil was deteriorated instead. (2) The leading edge roughness played a dominant role in eliminating the laminar separation and contributed to the most improvement in aerodynamic performance.At a roughness magnitude of 157 μm, the roughness covering 10% of the suction surface from the leading edge was sufficient to eliminate the LSB and the profile was decreased by 14.6%; little further reduction in profile loss was observed as the roughness coverage area further increased from 10% to 50% of the suction surface. At a higher roughness magnitude of 527 μm, the boundary layer development and the aerodynamic performance were more sensitive to the roughness location,the profile loss kept decreasing distinctly until 30% of the suction surface was roughened. (3) The roughness covering on the blade surface showed the potential in controlling boundary layer development and improving airfoil performance significantly at low Re,if the effects of the roughness on suppressing LSB and inducing strong viscous dissipation can be effectively balanced. Declaration of Competing Interest The authors declare that they have no known competing financial interests or personal relationships that could have appeared to influence the work reported in this paper. Acknowledgments The authors wish to acknowledge the financial support of the National Natural Science Foundation of China (No.51836008) and the National Major Science and Technology Project of China (No. 2017-II-0010-0024) for this project.2.3. Numerical methods
3. Discussion and results
3.1. Effects of roughness magnitude on the aerodynamic performance of airfoil at Re=1.5×10⁵




3.2. Effects of roughness location on the aerodynamic performance at Re=1.5×10⁵
4. Conclusions
 CHINESE JOURNAL OF AERONAUTICS2021年3期
- CHINESE JOURNAL OF AERONAUTICS的其它文章
- Criteria for hypersonic airbreathing propulsion and its experimental verification
- Effect of scavenge port angles on flow distribution and performance of swirl-loop scavenging in 2-stroke aircraft diesel engine
- Ship detection and classification from optical remote sensing images: A survey
- Variational method based robust adaptive control for a guided spinning rocket
- Inertial parameter estimation and control of non-cooperative target with unilateral contact constraint
- Theoretical modeling of vectoring dual synthetic jet based on regression analysis
