Individual Identification of Electronic Equipment Based on Electromagnetic Fingerprint Characteristics
Han Xu,Hongxin Zhang,Jun Xu,Guangyuan Wang,Yun Nie,Hua Zhang
1 School of Electronic Engineering,Beijing University of Posts and Telecommunications,Beijing 100876,China
2 Beijing Aerospace Vehicle Design Department Beijing,China,Beijing 100876,China
Abstract:With the rapid development of communication and computer,the individual identification technology of communication equipment has been brought to many application scenarios.The identification of the same type of electronic equipment is of considerable significance,whether it is the identification of friend or foe in military applications,identity determination,radio spectrum management in civil applications,equipment fault diagnosis,and so on.Because of the limited-expression ability of the traditional electromagnetic signal representation methods in the face of complex signals,a new method of individual identification of the same equipment of communication equipment based on deep learning is proposed.The contents of this paper include the following aspects:(1)Considering the shortcomings of deep learning in processing small sample data,this paper provides a universal and robust feature template for signal data.This paper constructs a relatively complete signal template library from multiple perspectives,such as time domain and transform domain features,combined with high-order statistical analysis.Based on the inspiration of the image texture feature,characteristics of amplitude histogram of signal and the signal amplitude co-occurrence matrix (SACM)are proposed in this paper.These signal features can be used as a signal fingerprint template for individual identification.(2) Considering the limitation of the recognition rate of a single classifier,using the integrated classifier has achieved better generalization ability.The final average accuracy of 5 NRF24LE1 modules is up to 98% and solved the problem of individual identification of the same equipment of communication equipment under the condition of the small sample,low signal-to-noise ratio.
Keywords:signal fingerprints;histogram-based signal feature;starting point detection;signal level cooccurrence matrix;ensemble Learningn
I.INTRODUCTION
The individual identification of communication radiation sources is a vital topic research area in the field of communication.It is defined as the feature measurement of the received transmission signal of the communication equipment and the process of determining the communication individual that generates the signal based on the prior information.The individual identification of the communication radiation source is due to the hardware difference that makes it possible to determine which device the signal comes from to achieve individual tracking and confirmation.For a long time,the identification of communication signal fingerprint characteristics has essential significance in both military and civilian fields.Different from the radar signal recognition [1],developed earlier,the individual signal difference is minimal,the feature extraction is painful,and the communication unique characteristics research is still in the preliminary research stage,the recognition effect still has some drawbacks,and there is a big gap with the actual application.The premise of early identification of individual radiation sources is that the types of radiation sources are known,such as the identification of radar radiation sources.The amplitude,frequency,phase,distribution information,and intrapulse modulation law of radar radiation source signal is used as the signal traditional characteristics and individual parameters.When a radiation source is replaced,a new feature template needs to be established for the original radiation source without the extensiveness of signals.Because of this situation,this paper focuses on the establishment of the feature template,including signal standard features and texture features so that to propose a feature extraction and classification algorithm based on machine learning.In recent years,machine learning algorithms such as random forest [2],and GBDT have been widely used in various fields and have become essential breakthroughs in the field of communications.Compared with traditional signal recognition methods,Machine learning has the advantages of high recognition efficiency,low resource requirements,scalability,and easy implementation.As a branch of machine learning,ensemble learning show an increasingly active image in recent years.Ensemble learning [3]requires the generation of a large variety of classifiers.Compared with individual classifiers,it can improve diversity by adding input data perturbations,attribute perturbations,output representations,and algorithm parameters.On account of this,this paper studies the subtle individual features of steadystate communication signals-that is,the difficulty of analyzing and extract signal fingerprints for the unique identification problem of different communication radiation sources of the same type and the working pattern.Then the signal fingerprint is classified and identified by ensemble learning.The overall architecture of the same type of electronic device recognition algorithm based on the signal fingerprint proposed in this paper is shown in the Figure1.This project first uses 5 NRF24LE1 modules of the same type and different batches as the signal emission source and uses 2.4G antenna and ESMD (Wideband Monitoring Receiver.) to receive and store the data packets of 5 modules.Then the starting point of the 5 kinds of signals is detected by the mean slip window method.In this paper,the basic theory of signal fingerprinting is studied.From the point of the generation mechanism,a variety of communication signal processing methods are used for exploring the extraction method of signal fingerprint features from different perspectives such as time domain,frequency domain,time-frequency domain,and high-order spectrum to upbuilds the feature template of individual identification of communication radiation source.Through the confusion matrix and other learning indicators,this paper compared the learning effects of different classifiers and selected the models with high accuracy for signal classification tasks.The feasibility and effectiveness of signal fingerprinting and machine learning methods are demonstrated by the experimental results in the application of subtle difference signal recognition engineering.
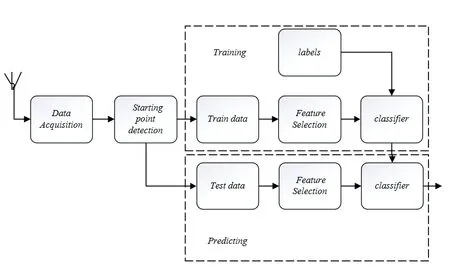
Figure1.Schematic diagram of the overall structure.
II.FEATURE EXTRACTION
2.1 Data Acquisition
Signal Emission:Five NRF24LE1 modules of different batches of the same type are used as signal sources.NRF24LE1 is an enhanced 51Flash high speed and low-power MCU using 2.4G wireless transmission,which includes built-inn 128bit AES hardware encryption,6-12bit ADC,two high-speed oscillators and two low-speed oscillators.It is usually deployed over the 2.4-2.4835GHz ISM Frequency band.Keil uvision4 was used for compiling the launch program and download it to NRF24LE1 and continuously transmit data packets to the outside world.The five different periods for the NRF24LE1 module are the 7th week of 2011,31st week of 2011,24th week of 2014,48th week of 2015,and 24th week of 2016.Signal Reception and Storage:Use 2.4G antenna and ESMD to receive and store data packets of 5 modules.ESMD covers the bandwidth range of 20M to 6G and has high-performance digital signal processors and programmable gate array to accommodate the best signalto-noise ratio of different signals.The paper used the format of the WAV for storage and collected data.The original signal visualization is shown in Figure2.
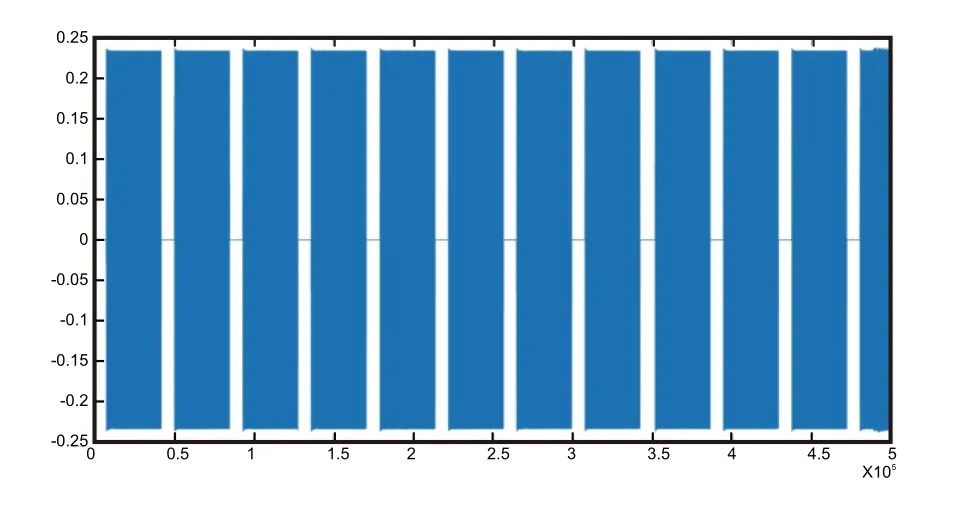
Figure2.Original signal.
2.2 Starting Point Detection
Since the data packets are sent at certain time intervals,in addition to useful data information,there is a certain amount of noise signal in the gap between each data packet.To facilitate feature extraction of the acquired signal in the later stage and reduce the influence of noise on the extracted features,the data packet is removed from the original signal.This paper proposes a signal interception method based on the mean sliding window.Firstly,the paper takes the absolute value of all the signals and flip it from below the coordinate axis to above.In this way,when the packet is sent,the average value of the signal is tremendous.In the gap between data packets,the signal amplitude is small,and the mean value is low because there is only noise in the data.Since there are approximately 10 data points from one peak to a valley,the window length is set to be 50,and the sliding length of the window is 20 so that the data is overlaid with 30 data points in each slip.The mean values of 50 data points gathered.The project used 0.04 mv as the threshold of the starting point of a packet start,and the mean value of the sliding window at the end of the data packet is set to 0.02 mv.After the sliding window traverses the original signal,the intercepted data packet can be stored as TXT files.The signal after interception is shown in Figure3.
2.3 Feature Selection
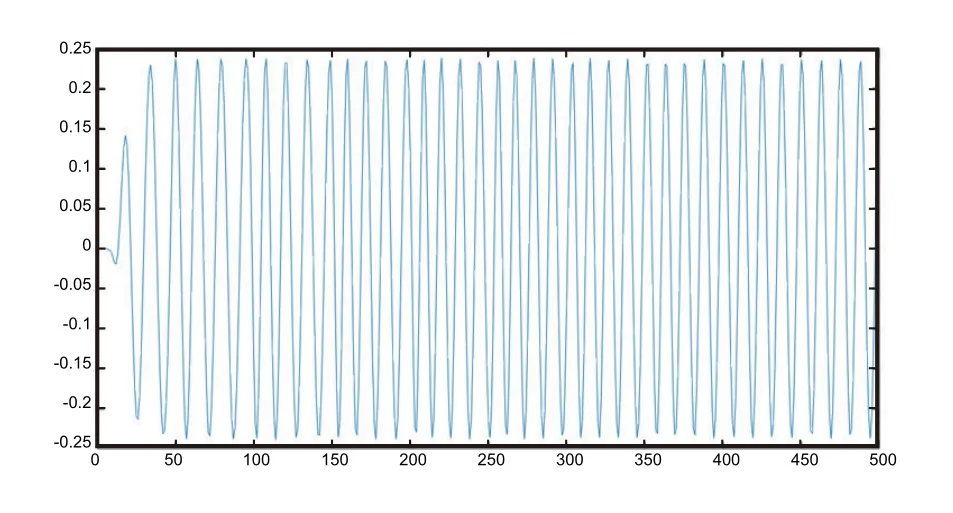
Figure3.Signal diagram after starting point detection.
In 1970,the Hjorth parameter was introduced as a characteristic statistical indicator in the field of timedomain signal processing.[4]used flexible analytic wavelet transform (FAWT) for the decomposition of electroencephalogram (EEG) for the analysis of epileptic seizures in EEG signals with Hjorth parameters as features for these signals.Mobility:It represents the proportion of the average frequency or standard deviation of the power spectrum.It is defined as the square root of the first derivative variance of the signal y(t)divided by the variance of the signal y(t).

Complexity:Indicates the change in frequency.

Activity:Indicates the signal power

Kurtosis:The kurtosis used for measuring the probability distribution of variables.The fourth-order standard moment of a function can be defined as:

where is the fourth-order central moment and is the standard deviation.Kurtosis is defined as the fourthorder center moment divided by the square of the probability distribution variance minus three.”3” is to make the normal distribution have a kurtosis of zero.

First-order difference mean and maximum

Second-order difference mean and maximum

Coefficient of variation:It is defined as the ratio of the standard deviation to the mean.It can be considered that the coefficient of variation is the same as standard deviation and variance,which are absolute values reflecting the degree of discretization of data.The value of the data is not only affected by the degree of dispersion of the variable values,but also by the average level of the values of the variables.

Skewness:The 3rd moment 3 represents the 3rd order central moment;refers to the standard deviation.In the general case,when the statistical data is rightbiased,
Sk>0,and the larger the value,the higher the degree of right deviation;when the statistical data is leftbiased,Sk<0,and the smaller the value,the higher the degree of left deviation.When the statistics are symmetrically distributed,there isSk.

Maximum,mean,variance,wavelet energy of wavelet coefficients.[5]uses wavelet features and stepby-step classification technology to diagnose CT images.[6]uses empirical mode decomposition and elevated wavelet transform to classify EEG signals.Wavelet transform (WT) is a new transform analysis method.It inherits and develops the idea of localization of short-time Fourier transform.At the same time,it overcomes the shortcomings that the window size does not change with frequency and can provide a ”time-frequency” window that changes with frequency.It is an ideal tool for signal timefrequency analysis and processing.Its main characteristic is that it can fully highlight some aspects of the problem through transformation,and the time(space)frequency,especially for partial analysis.Through scaling translation operations,the signal (function) is gradually multi-scale thinning,and finally,the time division is achieved at high frequency and frequency subdivision at a low frequency so that can automatically adapt to the requirement of time-frequency signal analysis and focus on any detail of the signal,solving the difficult problem of Fourier transform.From equation(10),the wavelet transform has two variables:scale and translation.The scale controls the expansion and contraction of the wavelet function,and the translation amount controls the translation of the wavelet function.The scale corresponds to the frequency,and the amount of translation corresponds to time.

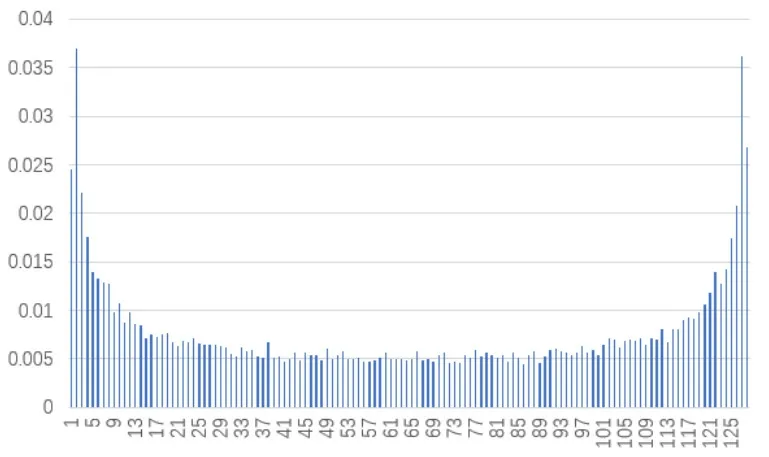
Figure4.Hist-based signal texture features.
The texture feature is often used in image classification task,which has rotation invariance and strong resistance to noise.The description methods of texture features can be divided into the following categories:statistical method,geometric method,signal processing method,etc.In this paper,inspired by the texture features of images,an algorithm for extracting texture features based on signal amplitude histogram and signal amplitude co-occurrence matrix is proposed.[7]uses the directional gradient histogram(HOG)feature extraction method to characterize normal,benign and malignant primary gastric images.The signal amplitude histogram is an essential statistical feature of the signal.Histograms can reflect the distribution of data.To describe the distribution of signal amplitude information.It can be analyzed to obtain some useful statistical characteristics of the signal.First,the total signal value is divided into N bins equally,and normalized to 1 through N.After counting the number of occurrences of each signal value,the paper added them to the histogram,and then normalized them to probability using total signal values.The experiment takes the histogram probability of signals as input,and output histogram-based signal features by designing various feature functions.The histogram-based signal feature can be used for distinguishing signal.Histogram probability of the NRF signal is shown in Figure4.Define the order origin moment and the step center moment of the histogram:
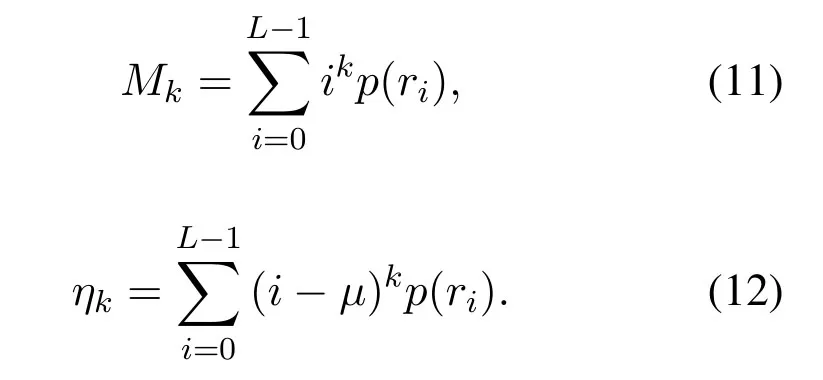
For the analysis of the amplitude histogram-based signal texture feature quantity,the following histogram statistical features can be used:Histogram mean value:

Histogram variance:the measure of the dispersion of signal distribution:

Histogram kurtosis:

Histogram skewness:
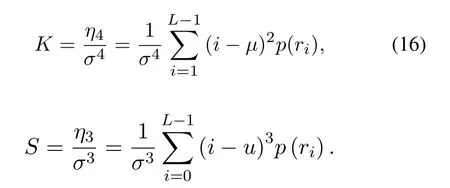
Histogram energy:The distribution of equal probability has the smallest energy.

Histogram entropy:The distribution with equal probability has the largest entropy.

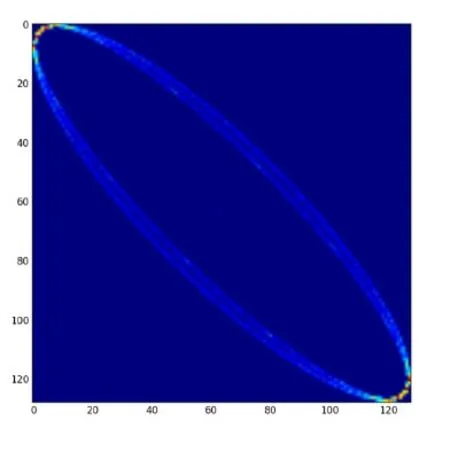
Figure5.SLCM probability visualization of NRF signals.
[8]uses the Gray Level Cooccurrence Matrix(GLCM)to represent non-tumor and tumor image extraction features.Texture features,such as contrast,dissimilarity,homogeneity,angular second moment(ASM),energy,mean and standard deviation,are used to distinguish them.If the signal amplitude histogram describes the probability distribution of the amplitude value of the signal,then the amplitude co-occurrence matrix of the signal is the probability distribution of the occurrence of every two amplitude values on the signal.The signal level co-occurrence matrix refers to a standard method for describing textures by studying the spatial correlation properties of signal scales.Because the texture is formed by the signal scale distribution repeatedly appearing in the spatial position,there is a specific signal-scale relationship between the two signal values separated by a certain distance in the signal space,which is the spatial correlation property of the signal scale.SLCM is a second-order statistic.First,the experiment divided the more extended signal into N segments equally,that is,the signal length is N and take any point x in the signal and another point x+a deviating from it,and set the signal value of the pair to (g1,g2).Fixing the distance,the experiment made the point slide with step s over the entire onedimensional signal and traverses the entire signal to obtain all values.For the whole signal,the number of occurrences of each value (g1,g2) is counted,which are arranged into an N*N square matrix and normalized to the probability of occurrenceP(g1,g2) by dividing it by the total number of times.Such a square matrix is called an SLCM(signal level co-occurrence matrix).Figure5 shows the SLCM probability visualization of the NRF signal.For finer textures,the distance a and step size s is set to (1,1) in this project.Thus,One-dimensional signal space coordinates are transformed into a description of ”value pair,” forming a signal level co-occurrence matrix.Many texture features can be derived by computing a signal level co-occurrence matrix:Texture Contrast:The larger the signal value pair with a large contrast,the larger the value.The larger the value of the element away from the diagonal in the grayscale matrix,the larger the Con.

Correlation:describe the degree of similarity between row and column elements in SLCM.It reflects the extension length of a specific signal value in a certain direction.The longer it extends,the higher the correlation.It is the measurement of the linear relation of signal values.When the values of the matrix elements are evenly equal,the correlation value is immense;conversely,if the matrix cell values differ significantly,the correlation value is small.

The second-order moment of the angle [8]:also called energy,is a measure of the uniformity of the distribution of the signal value.When the element distribution of GACM is concentrated near the main diagonal,the distribution of the signal value in the local area is relatively uniform,and the value of ASM is correspondingly larger.Conversely,if all values of the co-occurrence matrix are equal,the Asm value is small.

Texture entropy:is a measure of the amount of signal information.Texture information also belongs to signal information.When all elements in the cooccurrence matrix have maximum randomness,all values in the spatial co-occurrence matrix are almost equal.The entropy is enormous.It represents the degree of non-uniformity or complexity of the texture in the signal.

Maximum probability:the maximum value of the probability.

Deviation:The deviation moment is also called homogeneity,which is a measure of the local uniformity of the signal values.If the local level of the signal is uniform,the homogeneity value is larger.

2.4 Signal Fingerprints
In this paper,38 texture features of the above design were extracted from each NRF signal sample.These signal characteristics and five types of signal tags are spliced to obtain 2500 rows and 40 columns of signal feature tables,which are used as signal fingerprints and are sent to the classifier for training.Figure6 shows the distribution of 39 features as the vertical axis and the 5 types of signals as the horizontal axis.By visualizing the amplitude histogram and amplitude co-occurrence matrix of different NRF signals,the differences of different types of signals can be intuitively seen in Figure6.For each module,the proportion of 39 features in the total features is significantly different,which provides a foundation for subsequent classification based on the signal fingerprint.
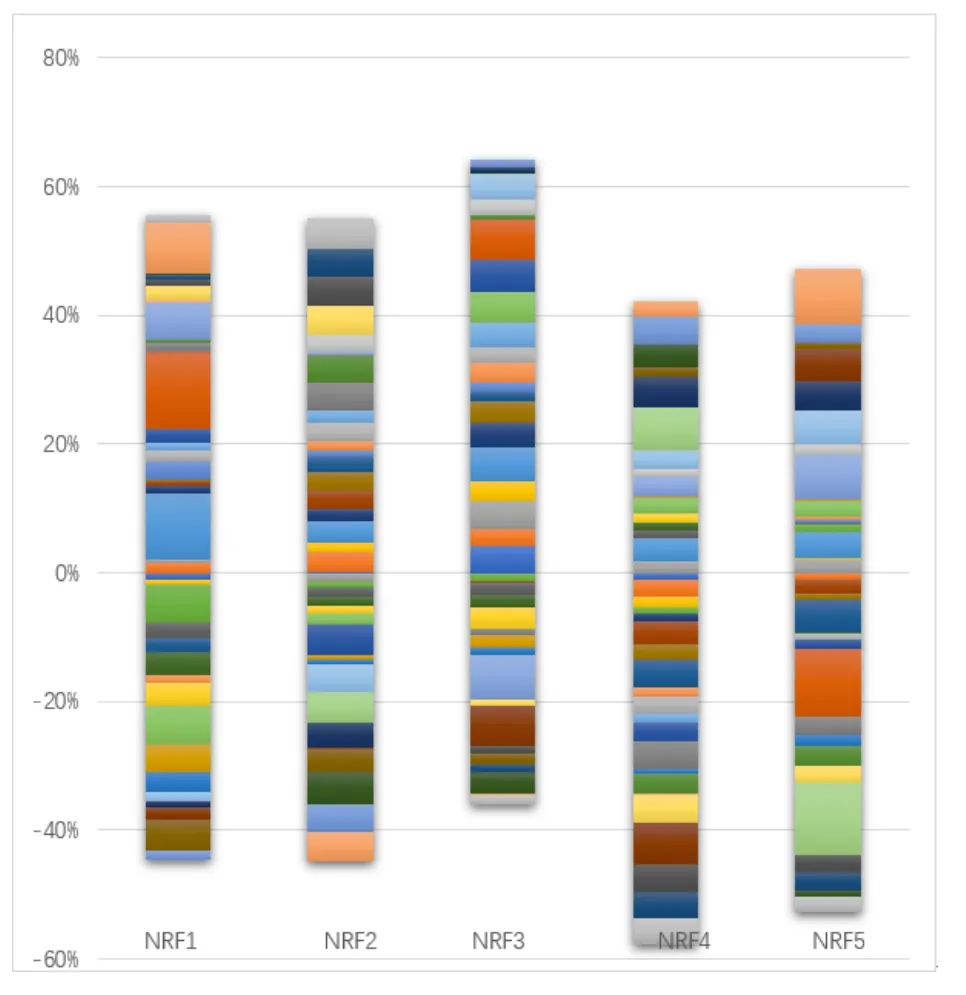
Figure6.Fingerprint visualization of 5 kinds of signals.
III.ENSEMBLE LEARNING
3.1 Base Classifier
Decision Tree:[9]uses sparse PCA and soft decision tree classifier to classify EEG signals for epilepsy.The decision tree learning algorithm consists of three parts:feature selection,tree generation,and pruning.The algorithm takes the training set D,the threshold of the Gini coefficient,and the threshold of the number of samples as input.The output is the decision tree T.The algorithm starts from the root node,and recursively builds the CART tree with the training set.For the current node,the data set is D.If the number of samples is less than the threshold or there is no feature,the decision subtree is returned,and the current node stops recursive.Calculate the Gini coefficient of sample set D.If the Gini coefficient is higher than the threshold,return to the decision tree subtree,and the current node stops recursive.Calculate the Gini coefficient of the feature value pair data set D of each feature existing in the current node.Among the calculated Gini coefficients,feature A with the smallest Gini coefficient and the corresponding eigenvalue a is selected.According to the optimal feature and the optimal feature value,the data set is divided into two parts D1 and D2,and the left and right nodes of the current node are established.The data set D of the left node is D1,and the data set D of the right node is D2.Recursively perform 1-4 steps on the left and right child nodes to generate a decision tree.
3.2 Ensemble Classification Methods
Bagging In [10],the application of four fundamental ensemble learning methods (Bagging,Boosting,Stacking,and Voting) with five different classification algorithms(Neural Network,Support Vector Machines,k-Nearest Neighbor,Naive Bayes,and C4.5)with the most optimal parameter values on signal datasets is presented.The bagging method reduces the variance of the base estimator by introducing randomness in the process of building the model.The inputis the sample set,and the weak classifier iteration is T.The output is the final strong classifier f(x).1) For t=1,2,...,T:The t random sampling of the training set Gt(x),the total number of acquisitions is m times,and the sampling set containing m samples is obtained.b)Training the tweak learner Gt(x)with the sample set Dt 2)In the category prediction,one of the categories or categories in which the Tweak learners cast the most votes is the final category.·Random Forest[11]studies the automatic recognition method of modulation type of communication signal under low signal-to-noise ratio.By analyzing the signal entropy,three features are selected,and the random forest is used as a classifier to obtain a high recognition rate for several communication signal modulation types under low signal-tonoise ratio.The random forest is an evolutionary version of the Bagging algorithm.First,the random forest uses the CART decision tree as a weak learner.Secondly,for the ordinary decision tree,we select an optimal feature among all the n sample features on the node to do the left and right subtree partitioning,but the random forest randomly selects a part of the sample features on the node.Among this randomly selected sample features nsub,an optimal feature is selected to be the left and right subtree partition of the decision tree.This further enhances the generalization capabilities of the model.·Boosting Through the AdaBoost algorithm based on weak classifier integration,the recognition of the radar signal data set is realized.[12]Different training sets are implemented by adjusting the weights corresponding to each sample.Different weights correspond to different sample distributions,and this weight is the classifier's increasing emphasis on the wrong sample.By changing the sample distribution,the classifiers are gathered on those samples that are difficult to distinguish,and the learning is easy to be misclassified,and the weight of the misclassified data is increased.Such misclassified data has a more significant effect on the next iteration.For these weights,on the one hand,they can be used as a sampling distribution to sample the data;on the other hand,weights can be used for learning the classifiers that favor high-weight samples,and a weak classifier can be promoted to a robust classifier.·GBDT Lifting tree USES addition to model and forward step algorithm to optimize the learning process.When a loss function is a squared loss function and an exponential loss function,each step of optimization is simple,such as learning the residual regression tree by the squared loss function.However,for general loss functions,it is not easy to optimize each step,such as the absolute value loss function and Huber loss function in the figure above.To solve this problem,Freidman proposed a gradient lifting algorithm:using the fastest descent approximation method,that is,using the value of the negative gradient of the loss function in the current model,as the approximate value of the residual error of the lifting tree algorithm in the regression problem,to fit into a regression tree.Taking the characteristic dimension m of the training set and the number of training set samples n as the analysis premise,for the classification model of CART decision tree,the candidate attribute used in each internal node division is the entire attribute set.It makes every layer of the network structure need to scan the training set.Therefore,the computational complexity of the cart decision tree model can be expressed as O(mnlogn).For the random forest classification model,if the experiment uses M tree to vote,then the computational complexity of the model is generally represented as O(Mmnlogn).However,in the process of generating decision-making tree in the forest,due to the introduction of the feature selection of randomness,make each node when the selected attributes only(a subset of feature)as a candidate set of genera,so each node optimal properties determine the time will be reduced,to make the time complexity of random forest model training is often less than O(Mmnlogn).For the GBDT classification model,assuming the number of iterations is T,the computational complexity of this model is usually about O(Tmnlogn).But in the actual cases,GBDT model of the tree is generated based on Serial computing,and all the sample classification probability value matrix is constantly updated with the iteration,which makes the actual operation of each generation take a long time.It also wastes time because of other factors,resulting in the complexity of GDBT model training time is often greater than o(Tmnlogn).
IV.EVALUATION
This experiment was completed on Intel(R)Core(TM)i5- 7200U 2.5GHz CPU and 4G memory PC.MATLAB 2017 software was used for writing and debug the signal starting point detection program,pycharm3.0 compiler,and python3.5 was used for feature extraction,build and debug model.500 signals of different batches of A,B,C,D,and E chips were collected using the test instrument,totaling 2,500 original signals.Each signal is saved as a text file.The original data is cut out by the starting point procedure,39 features are extracted for each intercepted signal,and finally,the extracted feature data is saved in CSV format,so he CSV file of 2500 rows and 40 columns are obtained including a label column,which is the input of each model.
The classification effect of the model under different parameters can be obtained by exhausting all the parameters through the grid search.The maximum tree depth and the number of weak classifiers in the random forest are used as parameters to be adjusted.To find the search parameters,an ideal scoring method need to be determined.Error rate and accuracy have many drawbacks as classification evaluation indicators,but the precision and recall are measurement methods that are more suitable for demand.For the two-category problem,according to the combination of its real category and the prediction category,the sample can be divided into the following:True Positive,False Positive,True Negative,False Negative,which are represented by TP,FP,TN,and FN respectively.The confusion matrix is a visual display tool for evaluating the quality of the classification model.Each column of the matrix represents the sample condition predicted by the model;each row of the matrix represented theactual state of the sample.The confusion matrix for the classification results is shown in TABLE 1.

Table1.Comparisons of BER.
When performing a multi-category task,A combination of any two categories corresponds to a confusion matrix[13].By averaging the corresponding elements of the multi-category confusion matrix,the average value TP,FP,TN,and FN are obtained.Based on these elements,micro-R,micro-P,micro-F1 is calculated.
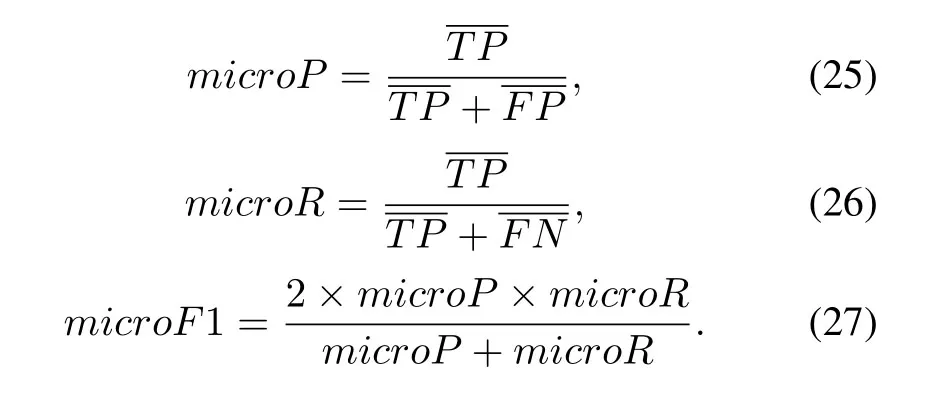
The experiment randomly selected 20% of the preprocessed data as the test set.The grid search[14]and parameter traversal method were used for adjusting the parameters,and the model with the highest average correct rate was saved.The classification result table and confusion matrix obtained by the different classifiers for the 5 batches of NRF signals are table 2.From the above results,it can be seen that both GBDT and random forest have a recognition rate of 98%,showing a strong classification ability.This is because ensemble learning can bring many benefits.First,from the perspective of statistical,there might have been a mistake to use a single classifier,and a combination of different classifiers can reduce this risk.Second,from the perspective of computational,the learning algorithm may fall into a local best,and the optimal generalization performance cannot be obtained.Third,from the perspective of representation,if the hypothesis space of a single learner does not conform to the real hypothesis,the hypothesis space can be made larger,and the invalid learning can be avoided by combining multiple classifiers.
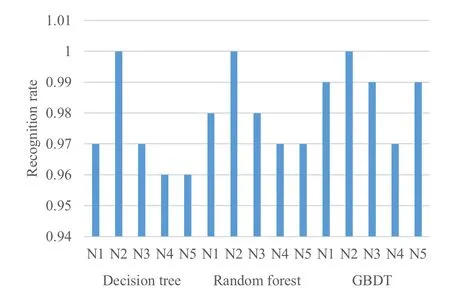
Figure7.Recall rate of 5 kinds of signals.
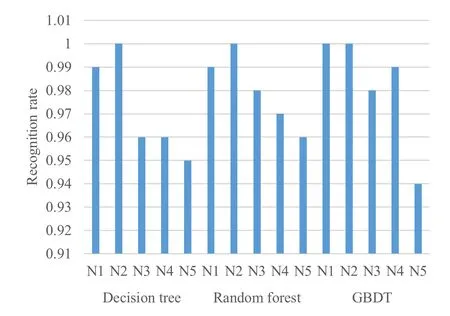
Figure8.Precision rate of 5 kinds of signals.
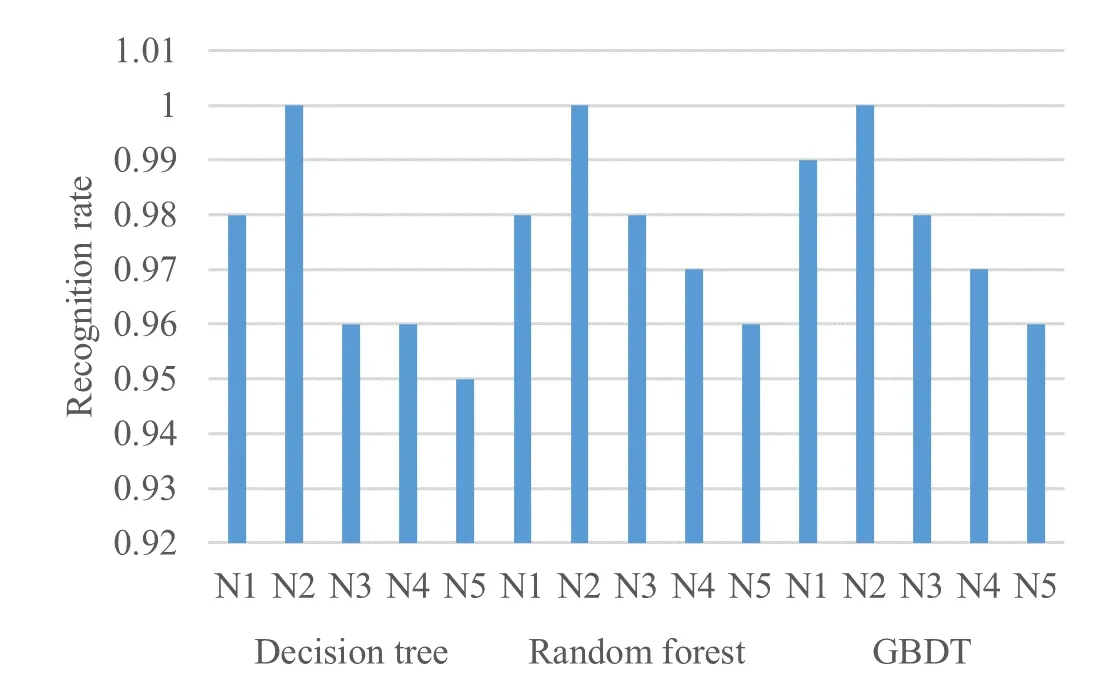
Figure9.F1 score of 5 kinds of signals.
It can be seen by comparing model precision,the boosting classifier is the best of all classifiers,followed by random forest and decision trees.According to the confusion matrix,N2 has the best recognition effect,and the three classifiers all get 100%recognition accuracy.N4 and N5 are more prone to misjudgment than other categories.For the recall rate,the recognition performance of random forest and GBDT method is similar,and both classifiers are better than the decision tree.Compared with a single decision tree,the randomforest classifier and GBDT classifier based on decision tree integration have higher accuracy and more stable performance for fingerprint identification of radiation source signals.Finally,the importance of the above characteristics is sorted.The specific steps for the random forest to calculate the importance of a single feature are as follows:Step 1:use f features of M samples to test the model performance of each tree that has been generated in the random forest,and the calculation error value iserror1.Step 2:to calculate the importance of feature f,add noise interference to feature f,get a new data set,and recalculate the error value as error2.Step 3:In this tree,the importance of feature f is.If there are n trees in the random forest,the importance of this feature f in the random forest model should be �(error2-error1)/N.By evaluating the importance of 39 features,the importance of the first 15 features is shown in Figure10.It can be seen that the second-order difference mean feature is more important than other features.
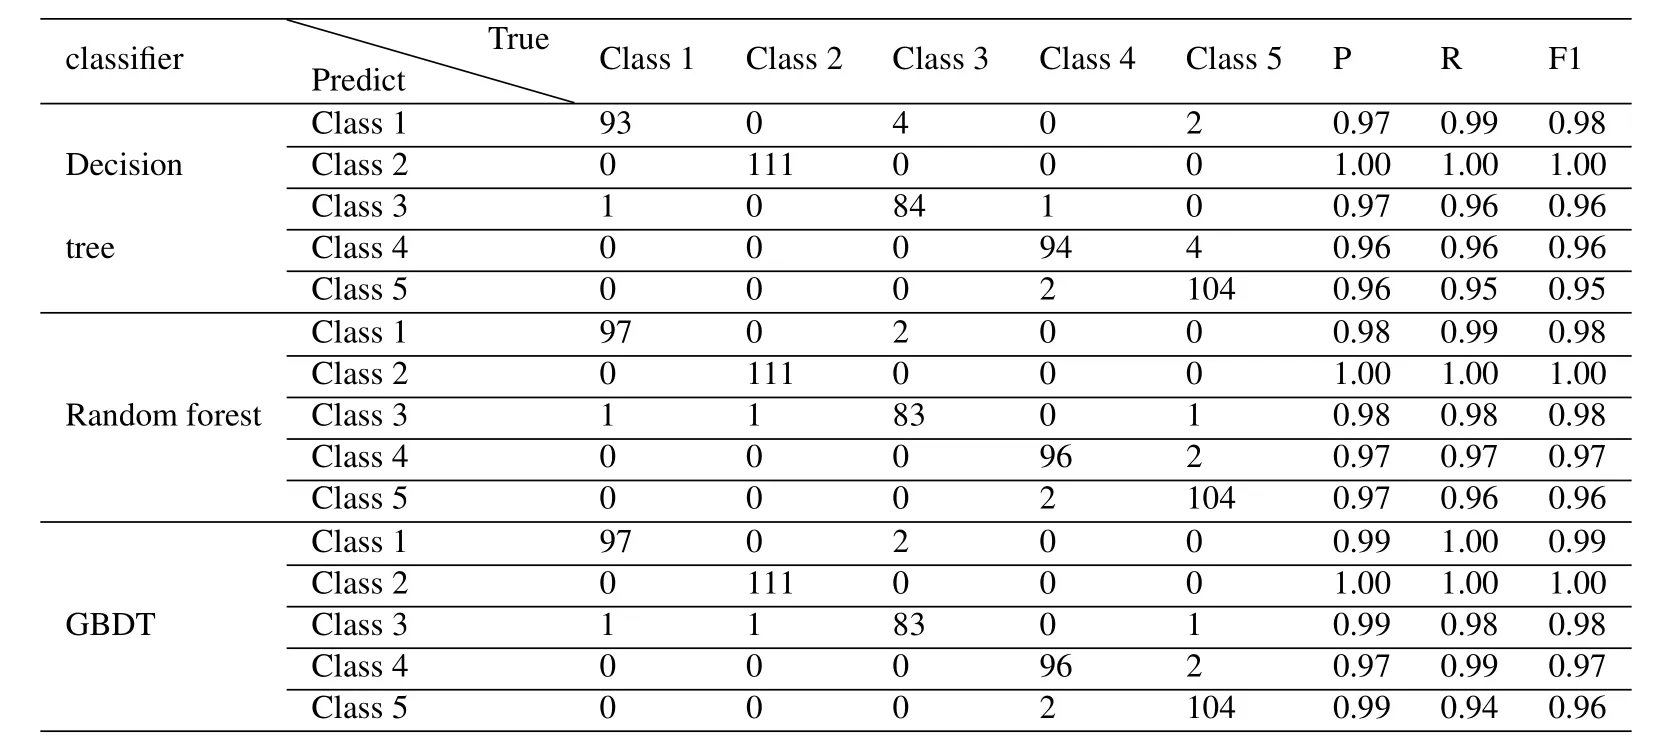
Table2.Comparisons of BER and PAPR reduction Results with different companding schemes.
The GBDT model was used to test the influence of GACM features and amplitude histogram features on the prediction effect.The prediction results are shown in Figure11.Experimental results show that the characteristics of GACM and the characteristics of amplitude histogram are important features to distinguish different signal sources.Due to the complex characteristics and non-stationarity of the signal waveform,extracting key features is very important for classification.As can be seen from the definition,GACM is very sensitive to the periodic structure.The histogram feature is mapped to a fixed level through signal amplitude,which has the advantages of wavelength insensitivity and noise robustness.Therefore,GACM and histogram functions play an obvious role in device identification.
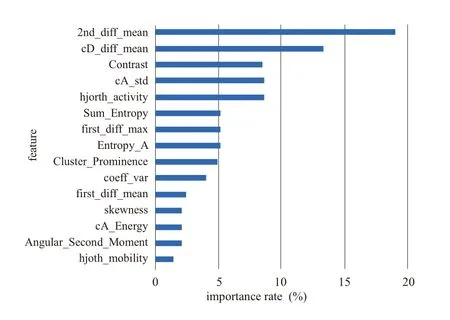
Figure10.The influence of GACM Feature and amplitude histogram Feature on the prediction effect.
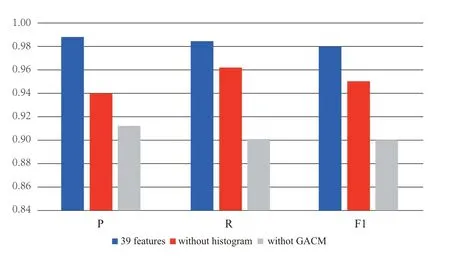
Figure11.Feature importance.
V.CONCLUSION
There are many application scenarios for individual identification of communication equipment,which is of great significance in electronic countermeasures,wireless network security,and other fields,and has been widely studied in recent years.With the rapid development of signal processing technology,there are more and more signal modulation methods,increasing rf equipment,and more and more complex electromagnetic environment.The traditional modulation identification technology is challenging to meet the individual identification needs of the radiation source.The characteristics of the communication signal fingerprint generally originate from uncontrollable or unintentional error factors in the design,manufacture,and operation of the communication transmitter.These fingerprint features are acquired and analyzed by the signal receiver to identify different transmitting devices,which is the research purpose of the project.The project uses five NRF24LE1 modules of the same type and different batches as signal transmitter sources.The antenna and receiver are used for receiving and store data packets of five modules.Considering the shortcomings of deep learning in processing small sample data,this paper provides a universal and robust feature template for radio signal data.A useful signal fingerprint library including 39 kinds of features such as time-frequency features,envelope features,amplitude histogram-based,and SLCMbased signal features is constructed.A useful signal recognition system is designed using the most advanced ensemble learning method,which achieves 98% recognition accuracy,and proves the feasibility of subtle difference signal recognition based on signal fingerprint characteristics.For the identification task of electronic devices,future work can be started from the following aspects:1.As the electromagnetic environment becomes more and more complex,the recognition effect of the algorithm proposed in this paper in a low signal-to-noise ratio environment still has a lot of room to improve.How to use deep learning algorithms to remove noise and extract the essential characteristics of the signal still needs further exploration.2.Research on the processing mechanism of unknown new signal needs to be carried out,such as restarting network training automatically.
VI.CONCLUSION
In this paper,a novel NCT scheme is proposed to reduce the PAPR of OFDM signals,based on continuously differentiable reshaping of the PDF of signal amplitudes.The original PDF is cut off for PAPR reduction,and lower and medium segments of original PDF are scaled and linearized respectively.The linearized segment is set to be the tangent of the scaled version at the inflexion point,so as to make the new PDF continuous and differentiable and reduce the OOB radiation as much as possible.Parameters are appropriately selected so as to maintain the constraint conditions of unity CDF and constant power.In addition,a new receiving method is proposed to reduce system BER,at the cost of a little increase in algorithmic complexity.Simulation results indicate that at the same PAPR reduction level,the proposed scheme without decompanding process can achieve similar or better BER performance,compared with other typical companding schemes,and when the new receiving method is employed,the BER performance can effectively be improved further.Additionally,simulation results confirm the superiority of the proposed scheme in terms of OOB radiation.
VII.ACKNOWLEDGMENT
This work was supported by the National natural science foundation of China (No:62071057)and Beijing nature fund (No:3182028).The support is gratefully acknowledged.
- China Communications的其它文章
- Edge Caching in Blockchain Empowered 6G
- Spectrum Prediction Based on GAN and Deep Transfer Learning:A Cross-Band Data Augmentation Framework
- Layered D2D NOMA
- Fully Connected Feedforward Neural Networks Based CSI Feedback Algorithm
- Erasure-Correction-Enhanced Iterative Decoding for LDPC-RS Product Codes
- Power Allocation for NOMA in D2D Relay Communications

