CNN-Based Intelligent Safety Surveillance in Green IoT Applications
Wengang Cao,Jianing Zhang,Changxin Cai,Quan Chen,Yu Zhao,Yimo Lou,Wei Jiang,Guan Gui,*
1 College of Telecommunications and Information Engineering,Nanjing University of Posts and Telecommunications,Nanjing 210003,China
2 School of Computer Science,Nanjing University of Posts and Telecommunications,Nanjing 210003,China
3 School of Electronic and Information,Yangtze University,Jingzhou 434023,China
Abstract:Safety surveillance is considered one of the most important factors in many constructing industries for green internet of things (IoT) applications.However,traditional safety monitoring methods require a lot of labor source.In this paper,we propose intelligent safety surveillance (ISS) method using a convolutional neural network (CNN),which is an autosupervised method to detect workers whether or not wearing helmets.First,to train the CNN-based ISS model,the labeled datasets mainly come from two aspects:1)our labeled datasets with the full labeled on both helmet and pedestrian;2)public labeled datasets with the parts labeled either on the helmet or pedestrian.To fully take advantage of all datasets,we redesign CNN structure of network and loss functions based on YOLOv3.Then,we test our proposed ISS method based on the specific detection evaluation metrics.Finally,experimental results are given to show that our proposed ISS method enables the model to fully learn the labeled information from all datasets.When the threshold of intersection over union (IoU)between the predicted box and ground truth is set to 0.5,the average precision of pedestrians and helmets can reach 0.864 and 0.891,respectively.
Keywords:convolutional neural network (CNN);internet of things (IoT);intelligent safety surveillance;deep learning;auto-supervised method
I.INTRODUCTION
During 2014 to 2018,in china,there are 3014 accidents happened in construction sites,which caused nearly 4000 staffs dead [1].After analyzing these statistics,we find that falling down and hitting by heavy objects dominant in all the accidents.Most of these accidents could be avoided by wearing safety equipment and intelligent safety surveillance in the green internet of things (IoT) applications.However,for many workers,due to varieties of reasons,they occasionally forget to wear safety equipment.Thus,supervision on workers about whether they are wearing safety equipment is so much significant for safe production.In the construction site,the detection of construction worker with or without helmet mainly includes video surveillance and manual supervision,which are time-consuming and laborious.Since most construction sites are equipped with monitoring system,the use of computer vision technology in the system can not only avoid time consuming labour intensive task,but also point out the worker without helmet in time and accurately against accidents.
In this paper,we mainly discuss the recognition method of whether construction workers wear helmets or not for possible applications in energy efficiency IoT(Green IoT)[2].It is a hot topic to use computer vision technology to solve this problem.Many scholars have studied the detection algorithm of whether construction workers wear helmets or not.K.Li et al.[3]proposed a detection of whether wearing safety helmets or not for perambulatory workers in power substation.They quickly locate pedestrians by using moving object segmentation algorithms and human body classification algorithms.Then,the head area of the human body is cut off and the color features are extracted to identify whether the worker is wearing a safety helmet.A.Rubaiyat et al.[4]combined the frequency-domain information of the image with a human detection algorithm using histogram of oriented gradient to detect construction workers.Then extract the color features of the image and cyclic Hough transform to detect helmet uses for the construction worker.K.Dahiya et al.[5]first detected bike riders from surveillance video using background subtraction and object segmentation.Then it determines whether bikerider is using a helmet or not using visual features and binary classifier.However,most of these methods use traditional computer vision methods to solve the problem of helmet recognition.These methods are difficult to adapt to very complex work environments.
In recent years,deep learning becomes popular by virtue of convolutional neural network which does not need hand-crafted features.Deep learning technology has been successfully applied in intelligent wireless communications [6-10],network traffic predication[11-15]and internet of things[16-25].H.Huang et al.[6]proposed a deep learning based fast beamforming design method and achieved advanced results.Y.Wang et al.[7]proposed a deep learning-based method to achieve high accuracy automatic modulation recognition (AMC) and later developed light AMC method[8].G.Gui et al.[9]proposed a novel and effective deep learning aided non-orthogonal multiple access system to achieve the robust and efficient access approaches.J.Sun et al.[10]proposed a deep learning behavioral modeling and linearization method for wideband radio frequency power amplifiers in fifth-generation wireless communications.G.Gui et al.[11]used deep learning technology to develop flight delay predication method based on aviation big data.F.Tang et al.[12]proposed a deep learning based intelligent traffic load prediction-based adaptive channel assignment algorithm in software defined network based internet of things.X.Xiao et al.[26]used deep learning for video transmission in UAVs.W.Wang et al.[27]exploited creeping waves to improve the security of IoT devices.
In this paper,we use object detection algorithm based on deep learning technology to detect pedestrian and helmet.At present,CNN-based object detection algorithms can be divided into two categories.The first is the two-stage object detection algorithm based on the regional candidate box,including R-CNN[28],Fast R-CNN [29],Faster R-CNN [30],etc.The twostage algorithm has a relatively high accuracy rate and a relatively slow running speed,which is suitable for the scene with higher accuracy requirements.The second is the regression based one-stage object detection algorithm,including YOLOv1 [31],YOLOv2 [32],YOLOv3[33],SSD[34],etc.The one-stage algorithm has relatively low accuracy and relatively fast running speed,which is suitable for the scene with high realtime requirement.Due to the high real-time requirements of the construction site scene,we use YOLOv3 to detect pedestrians and safety helmets.With the improvement of computing device performance,we can easily deploy CNN models to edge computing devices[35].K.M.Shahiduzzaman et al.[36]a cloudnetwork-edge architecture to enhance fall detection,prevention and protection which consists of the medical cloud,edge networks and end-devices,such smart helmet.J.Pan et al.[37]used deep learning and mobile edge computing technology to develop a lowcost unmanned surveillance system consisting of remote measuring stations and a monitoring center.In this work,edge devices can be directly connected to surveillance cameras,which greatly reduces the image data and computation that the network needs to transmit.
The use of deep learning technology to detect pedestrians and helmets requires a large number of images containing pedestrians and helmets.Different datasets label pedestrians and helmets differently.For example,there are a large number of pedestrian samples in MS COCO 2017 [38],and we don't know if there are helmet samples in these images.Some datasets labeled only helmet samples,and we don't know the information of pedestrian samples in these datasets.In this paper,we have collected a large number of images containing pedestrians and helmets.These images are labeled differently,and most of them are not fully labeled for pedestrians and helmets.The data we need must contain all the labeled information of pedestrians and helmets in the image,so some parts labeled images cannot be directly used for training YOLOv3.we solve the problem of label conflicts between different datasets by adding the label information of the dataset which the image belongs to into the loss function.Experiment results are given to validate the designed model structure and training method.
The rest of this paper is organized as follows.In Section II,we introduced the collected dataset.In Section III,we introduce the YOLOv3 algorithm and proposed method for resolving conflicts in dataset annotation.In Section IV,we introduced implementation details and experiments to verify the method.Finally,we conclude this work in Section V.
II.OUR LABELED DATASETS
CNN-based object detection algorithms can be divided into three types:supervised learning,semisupervised learning and unsupervised learning.Compared with semi-supervised and unsupervised learning algorithms,supervised learning algorithms have a great advantage of the validation performance when a large number of labeled data training is used.Therefore,we collect a lot of images with pedestrian and helmet bounding box information to train the neural network.The training and validation dataset contain 79902 images,289693 pedestrian samples and 37657 helmet samples.For easy understanding,we divide the collected images into Dataset A,Dataset B and Dataset C.
Dataset A:This dataset is made by randomly sampling frames of the real infrastructure video and collecting some images on the Internet.We use labeling software to label pedestrians and helmets in these images.The label information includes the position and category of the object in the image.There are a total of 6512 images,21663 pedestrian samples and 18410 helmet samples.Some images of Dataset A are shown in Figure1.
Dataset B:This dataset is a company's private dataset which contains a large number of factory production monitoring images.When this dataset was collected,only the helmets in the image were labeled.That is to say,the image in this dataset are labeled only for helmets and not for pedestrians.The number of pedestrian samples is unknown.There are a total of 6582 images with 19247 helmet samples.Some images of Dataset A are shown in Figure2.
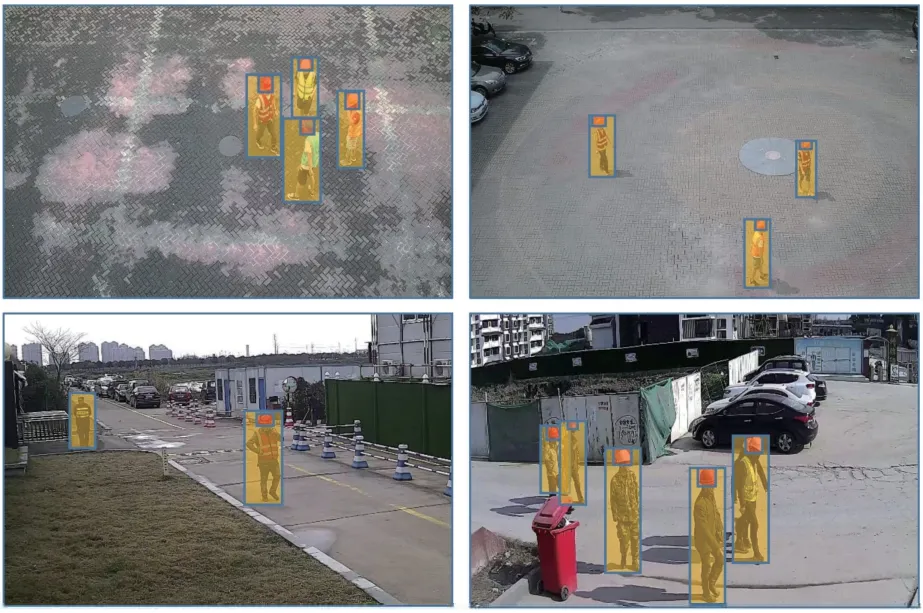
Figure1.In Dataset A,the positions of pedestrians and helmets are marked and shown in the figure.
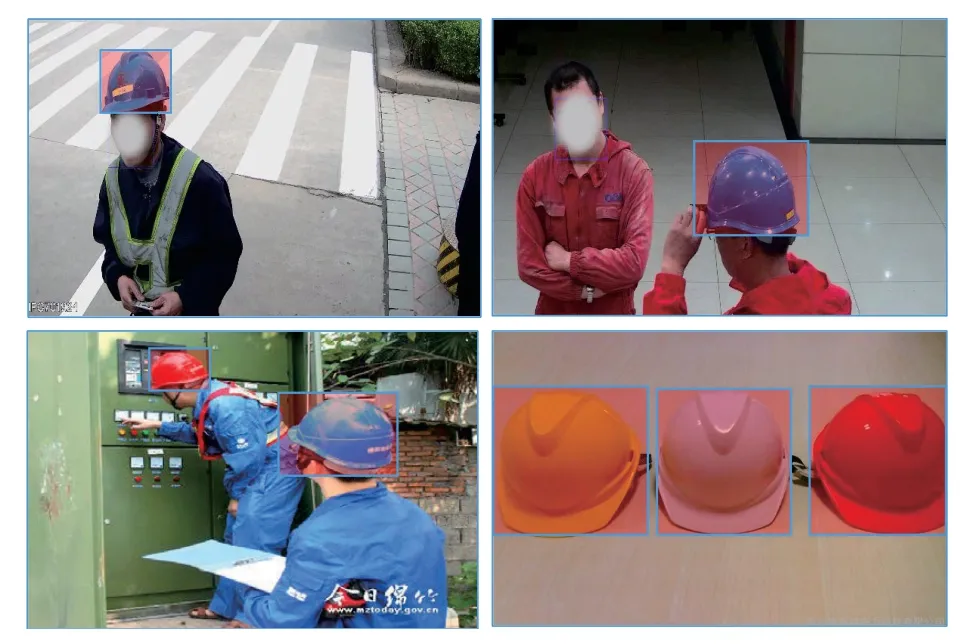
Figure2.In Dataset B,only the helmet's information is available.The location of the pedestrian is unknown.
Dataset C:This dataset is COCOPersons,which is a subset of MS COCO 2014[38]from the images with ground-truth bounding boxes of “person”.There are 64115 images in the “train” dataset for training,and the 2693 images in the “val” dataset for validation.There are a total of 268030 pedestrian samples.The images in this dataset are labeled only for pedestrians.After random sampling and observation of the images,we can consider that there are no helmet samples in this dataset.Some images of Dataset C are shown in Figure3.
In fact,only Dataset A and C can be used to train YOLOv3,while Dataset B cannot be directly used to train YOLOv3.That is to say,we cannot fully use of all the datasets.
III.OUR PROPOSED METHOD
In this section,we first introduce object detection algorithm,i.e.,CNN-based YOLOv3.YOLOv3 is used to detect pedestrians and helmets in construction site surveillance videos.Then,the limitations of YOLOv3 on the collected dataset are pointed out.Finally,we design a new network structure and training method to improve YOLOv3.
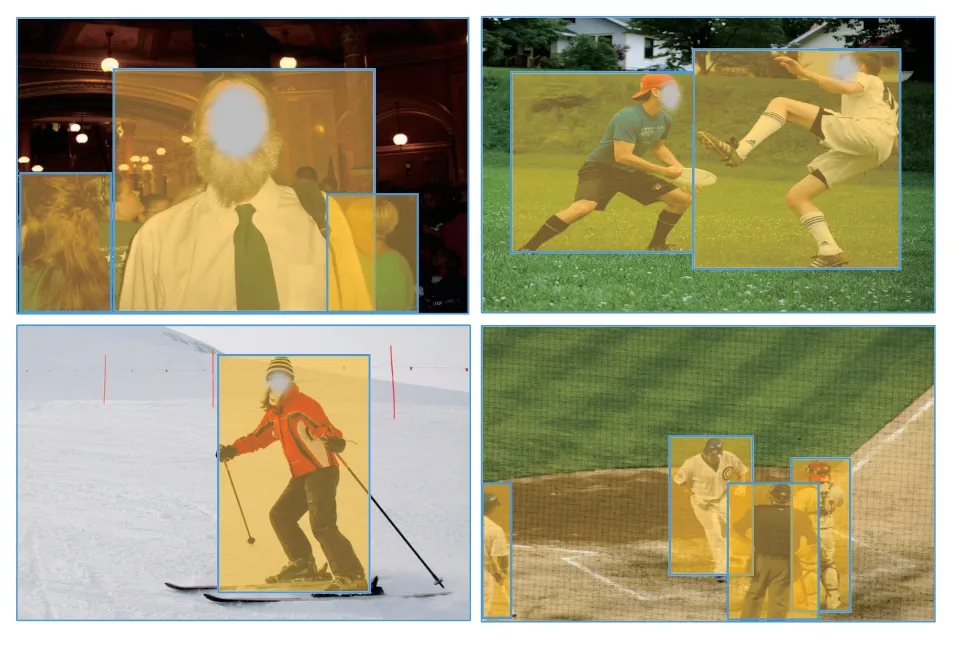
Figure3.In Dataset C,only the pedestrian's information is available.There are no helmet samples in these images.
3.1 YOLOv3
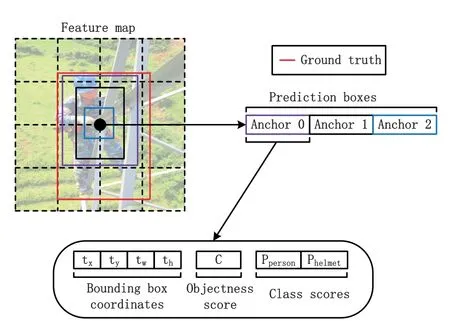
Figure4.Attributes of prediction feature map.
Unlike Faster R-CNN and other two-stage algorithms that split object detection into object candidate and classifier regression,YOLO series algorithms treat object detection as a regression problem,and directly get the location and category information of the object by feeding the image into the model.The YOLOv3 is an improved algorithm based on YOLOv1 and YOLOv2.By absorbing the design ideas of Batch Normalization [39]and ResNet [40]to Dark-Net19 [32],DarkNet53 [33]is designed as the backbone of the YOLOv3.YOLOv3 adopt feature pyramid networks [41]through dividing Darknet53 into three scales.Similar to some object detection algorithm such as SSD and Faster R-CNN,YOLOv3 also uses bounding box prior to predict the bounding box of object.YOLOv3 uses k-means algorithm to determine 9 bounding box priors from the training dataset,and divides them into feature maps of the three scales.This scheme enables YOLOv3 to have a significantly improved accuracy compared with YOLOv2 and YOLOv1 at the same running speed.As shown in Figure4,each vector on the prediction feature map is divided into three groups which corresponding to three prior boxes(Anchor).Each Anchor predicts 4 coordinates for the ground truth (tx,ty,tw,th),and 2 information for the object,objectness(C)and category(P).Cshould be set to 1 if the bounding box prior overlaps a ground truth object by more than any other bounding box prior.If the cell is offset from the top left corner of the feature map by (cx,cy) and the bounding box prior has width and height (pw,ph),then the predictions correspond to:
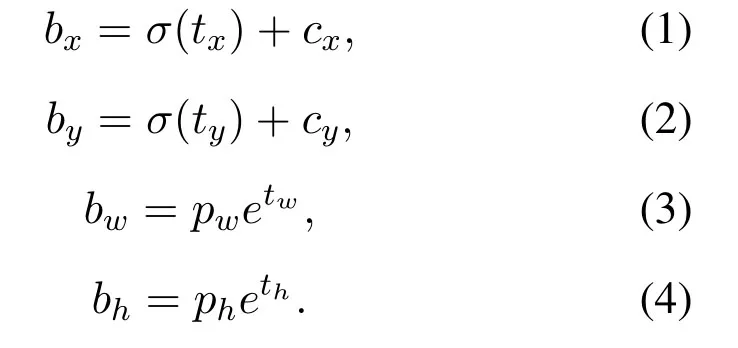
wherebx,byare the center of the object,andbw,bhare the width and height of the object.Figure5 is a visualization for(1-4).YOLOv3 predicts 74529 bounding boxes for each input image and then selects the best one through non maximum suppression[42].
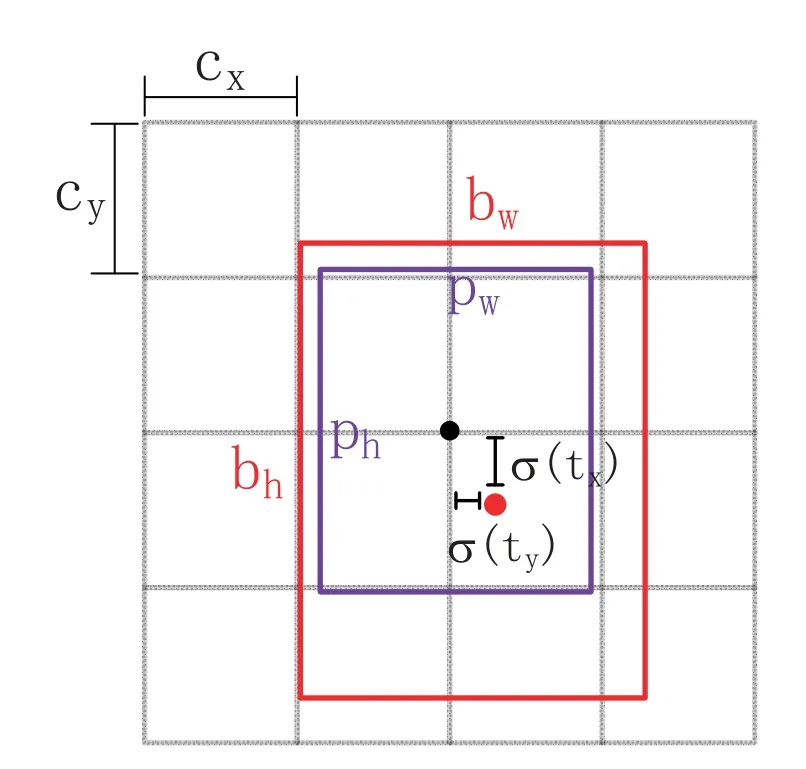
Figure5.The relationship between ground truth,bounding box priors and location prediction.
The loss function for YOLOv3 is described as:
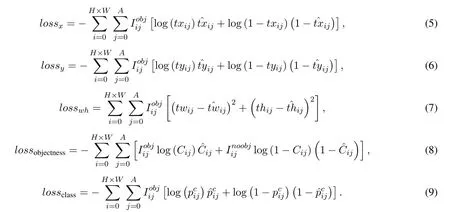
In (5-9),HandWrepresent the scale size of the feature map.In the function,Ais set to 3 which correspond to the three bounding box priors allocated to each scale,and different bounding box priors are responsible for predicting objects of different sizes.Among them,(5-6) and (8-9) are cross-entropy loss functions,and (7) is mean square error functions.ˆxis the ground truth andxis the predicted value.As shown in Figure4,each vector on the feature map will be predicted as(tx,ty,tw,th,C,P1,P2).lossx,lossyandlosswhare the loss functions used to optimize bounding box.lossobjectnessandlossclassare loss functions used to optimize object attributes and classification tasks.Whenis set to 1,it indicates that thejthbounding box prior at gridiof the feature map has object,which is a positive sample.Whenis set to 1,it indicates that the bounding box prior at gridiof the feature map has no object,which is a negative sample.Whenis equal to 1 oris equal to 1,the sample of the feature map will contribute to the loss of training.Whenis equal to 0 oris equal to 0,the sample of the feature map do not participate in the network training.
3.2 Improved YOLOv3
It can be seen that YOLOv3 loss functions related toare (5-9),and this part of loss functions is only contributed by location labeled with object in image.However,only (8) is related towhich contributes loss while no location labeled(thought as background)in image.(8)is why we can't use Dataset B directly.
Figure6 is the image that only labeled for pedestrians.For the convenience of analysis,we setAto 1.i=2×8 + 5=21 is the position at (2,5) of the feature map.We know from Figure6 that when gridi=21,36,44,53 and=1,while others equal to zero.When put this image into YOLOv3 model which detect both helmet and pedestrian,if the model get a certain level of recognition,it will realize existing pedestrians at gridi=21,36,44,53 and gridi=19,50 should have helmets.However,what we provided only has information of pedestrians,the model will reduce the output of gridi=19,50 for helmets.In other words,we told the model gridi=19,50 is background with no object,which against our intention that we want the model to detect helmets.For the same reason,when we label helmet but not label pedestrian,conflict will happen.In this condition,the model we trained has high possibility to be overfitting.
By analysis above,we know that if we want to train a model to detect both pedestrians and helmets based on YOLOv3,every image in training dataset must be labeled both of them.Thus,for datasets we mentioned above,only dataset A and C could be used to training.In fact,adding label information of the dataset which the image belongs to into training procedure will solve this problem.We assumed that loss function of some model is described as:whereTis quantity of tasks,Bis batch size,losst,bis the loss function oftthtask inbthimage.Lt,bis label condition oftthtask inbthimage.Lt,b=1 means labeled andLt,b=0 means unlabeled.We utilize gradient descent to upgrade the model.The upgraded function shows below:
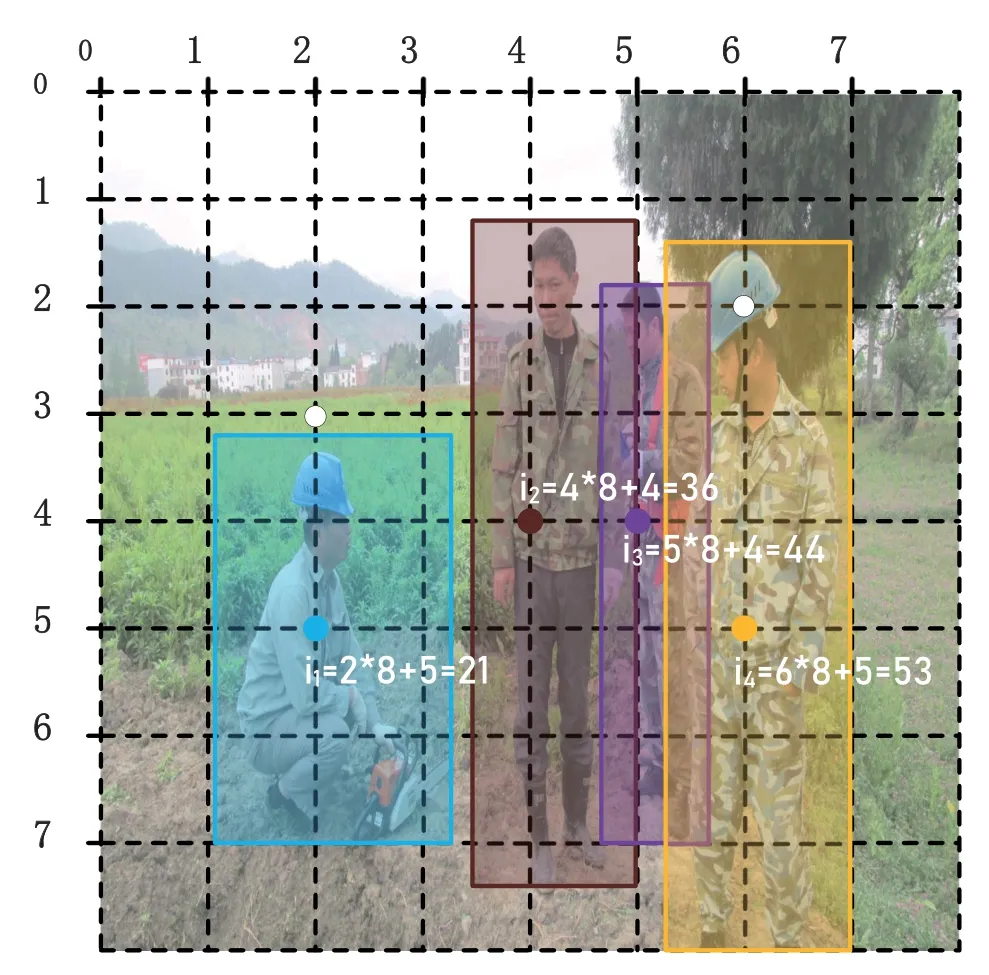
Figure6.The image only labeled for pedestrians.
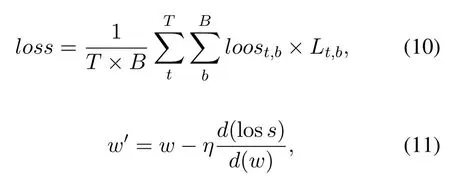
wherewis weight of the model.Substituting (10)into(11),we could get:

From (12),we know that whenLt,bis equal to 1,losst,bcould upgrade the parameter of the model,and whenLt,bis equal to 0,losst,bcould not upgrade the parameter of the model.When input image labeled some task,this image will contribute information for the learning of the task,otherwise it will not contribute information.We use this principle to improve YOLOv3 by merging attribute of objectness and category,and adding the input image information about which dataset it belongs to into loss function.Specific process is showing below.
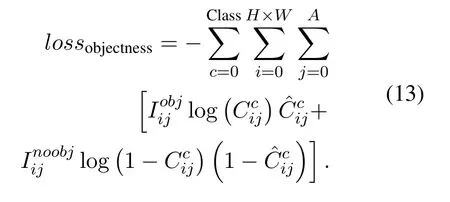
Merging attribute of objectness and category:we change the output of YOLOv3 from(tx,ty,tw,th,C,Pperson,Phelmet)into(tx,ty,tw,th,Cperson,Chelmet),which means turning the separate detection about object and category into joint detection.The improved YOLOv3 will predict category and objectness at the same time.Hence,(9) should be discarded and we change(8)to(13).
Putting label information of the image into loss function:we put label information of the image into(13),turning it into(14).
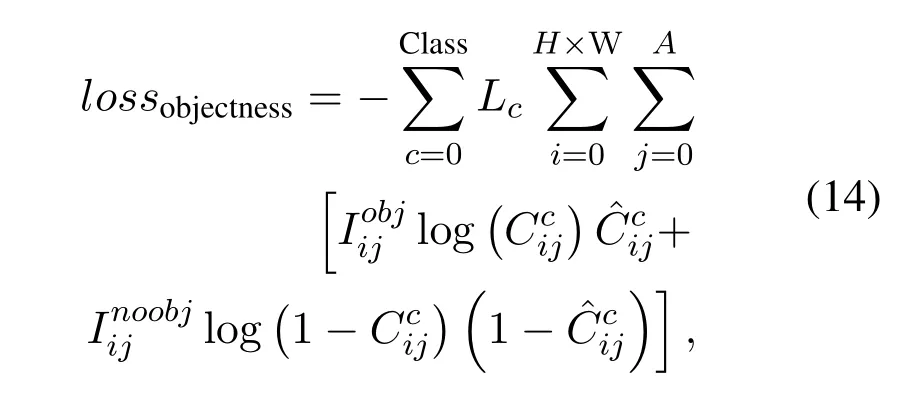
wherec=0 means pedestrians,andc=1 means helmets.For some image belongs to the dataset only labeled helmets,whichL0=1 andL1=0;for some image belongs to the dataset only labeled pedestrians,which and ;for some image belongs to dataset both labeled helmets and pedestrians,whichL0=1 andL1=1.WhenLc=0,the gradient of the loss related categorycwill turn into zero,and this image has no contribution to detection categoryc,even if there is some object belongs to categorycin this image.
By analysis above,we redesign the model structure of YOLOv3.As shown in Figure7,We separate the last 1×1 convolution into two parallel 1×1 convolution branches,detecting pedestrians and helmets respectively.After that we set bounding box priors to helmets and pedestrians separately.After clustering the pedestrian samples in the three dataset,9 bounding box priors of pedestrian branches are obtained as follows:(6,11),(12,23),(19,47),(31,38),(35,76),(61,115),(92,207),(154,258),(295,399).Similarly,for helmets,we obtain the following 9 bounding box priors:(19,15),(38,31),(46,44),(56,38),(64,55),(135,55),(165,118),(227,184),(373,307).We know from these bounding box priors that the bounding box priors of pedestrian is close to a rectangle,while the bounding box priors of helmet is closer to a square.This means that the scale of pedestrian and helmet is very different.Separating the prediction of helmet and pedestrian and setting 9 bounding box priors for them respectively,will reduce the learning difficulty for the model.
IV.EXPERIMENT RESULTS
In this section,we first describe the implementation details.Secondly,we describe the datasets used in the three experiments.Finally,we compare the results of these three experiments to verify our method.
4.1 Implementation Details
We re-implement YOLOv3 in the TensorFlow [43]neural network framework.The pre-trained model we use is YOLOv3 trained on the MS COCO2014 [38].Except for the last two 1×1 convolution block of each scale,which is randomly initialized,other convolution block in the model are initialized with the parameters of the pre-trained model.ADAM [44]is used to optimize the model.For all experiments we trained 30 epochs.When training the model,in the first 20 epochs,freeze the parameters of the batch normalization layer and update only the parameters of the last two 1×1 convolution block of each scale.In the last 10 epochs,train and update all the parameters of the model.Following [45],we use warmup and cosine schedule to dynamically adjust the learning rate,which is an effective way to improve the performance of the model.The upper and lower bounds of the learning rate we use are 0.0001 and 0.000001.During the warm-up period of the first two epochs,the learning rate increased linearly from 0 to 0.0001.During the second epoch to the 30thepoch,the learning rate is reduced from 0.0001 to 0.000001 using a cosine drop.We train the model on one GTX 1080Ti,and the batch size is set to 6.
4.2 Details of the Three Experiments
To compare the effectiveness of our method for processing unlabeled images,we performed three experiments based on the training dataset and loss function used.
Experiment A:Use Dataset A and Dataset C to train improved YOLOv3.Due to Dataset A and Dataset C is labeled with both pedestrians and helmets,there is no need to distinguish whether label information about which dataset input image belongs to is added to the loss function.
Experiment B:Use Dataset A,Dataset B and Dataset C to train improved YOLOv3.The label information of the input image is not added to YOLOv3 loss function during training.That is,the original YOLOv3 loss function is used.
Experiment C:Use Dataset A,Dataset B and Dataset C to train improved YOLOv3.The label information of the input image is added to YOLOv3 loss function during training.That is,the improved YOLOv3 loss function is used.
The other training parameters of these three methods are the same as the implementation details.We use the metrics [46]in COCO to evaluate the performance of the improved YOLOv3.The main metrics are Average Precision(AP)and Average Recall(AR).As show in Table1,ignore detection means that when an input image is not labeled with a category,we will discard the detection results of this category.
4.3 Performance of the Improved YOLOv3
In experiment A,we use Dataset A and Dataset C whi-ch labeled with both pedestrians and helmets to train the improved YOLOv3.Table1 is the result of evaluation on the test set of Dataset A,Dataset B and Dataset C.We know that forAR1andAR10,regardless of whether the detection result is ignored,their values are unchanged for all classes.This means that for the existing label,the recall is unchanged.However,theAPof pedestrian has decreased after retaining all detection results,while theAPof the helmet has not changed.The reason for the decline in theAPof pedestrian is that there are a large number of unlabeled pedestrian samples in Dataset B,and when these pedestrians are detected by the network,the evaluator will treat them as false positives,so the average precision of pedestrians will decline while the average recall of pedestrians remains unchanged.This proves that the model has a certain ability for pedestrian detection.However,theAPof the helmet is too low,and this model is not capable of detecting the helmet.As shown in Figure8,the model directly trained by Dataset A and Dataset C can detect most pedestrians in Dataset B,even though these pedestrians are not involved in training.This model cannot effectively detect the helmet in Dataset B.In experiment B,we use Dataset A,Dataset B and Dataset C to train the improved YOLOv3.The label information of the input image is not added to YOLOv3 loss function during training.Table2 is the result of evaluation on thetest set of Dataset A,Dataset B and Dataset C.After putting all three datasets into training,we know that theAPof helmet has been greatly improved compared with the experiment A.However,theAPof pedestrian remained unchanged when all the test results were retained.This is dangerous because there are a large number of unlabeled pedestrian samples in Dataset B.When these unlabeled pedestrian samples are not detected,theAPof pedestrians will not change much.It can be considered that the model trained in experiment B has no ability to detect pedestrians for Dataset B.Figure9 shows some detection results of the model on Dataset B.It can be seen that this model can detect the helmet samples well,while it cannot detect the pedestrian samples.Obviously,using Dataset A,Dataset B,and Dataset C to train improved YOLOv3 directly,the trained model will over fit.In experimentC,we use Dataset A,Dataset B and Dataset C to train the improved YOLOv3.The label information of the input image is added to YOLOv3 loss function during training.Table3 is the result of evaluation on the test set of Dataset A,Dataset B and Dataset C.We know from Table3 that theAPof helmet is greatly improved compared with Table1,and theAPof pedestrian will decline when all detection results are retained,which is the same as Table1.Therefore,the model can detect the unlabeled pedestrian samples in Dataset B.It means that when the annotation information of the image is added to the loss function,the information will greatly affect the sample content learned by the model.The network structure and learning method designed by us can solve the conflict problem of unlabeled images in different dataset.Figure10 shows some detection results of this model on Dataset B.We can see from Figure10 that this model has a good detection result for pedestrians and helmets.
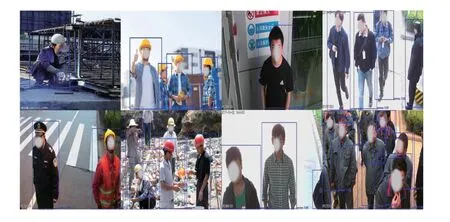
Figure8.Some detection results of experiment A on Dataset B.Only pedestrians are detected.
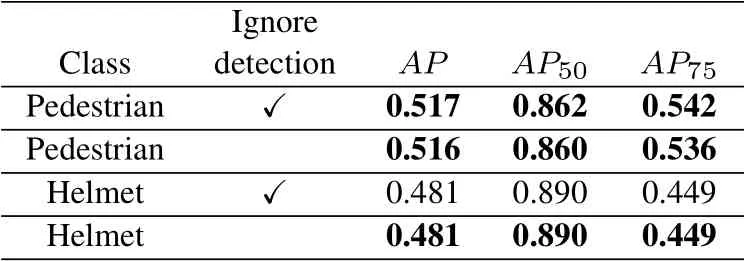
Table2.The average precision of experiment B.
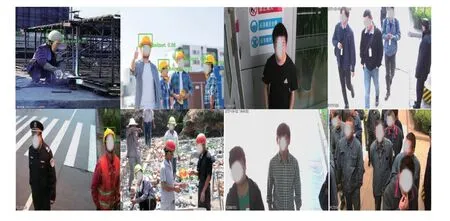
Figure9.Some detection results of experiment B on Dataset B.Only helmets are detected.
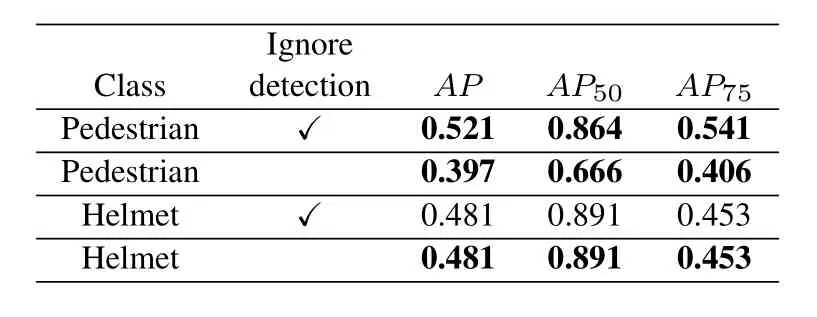
Table3.The average precision of experiment C.
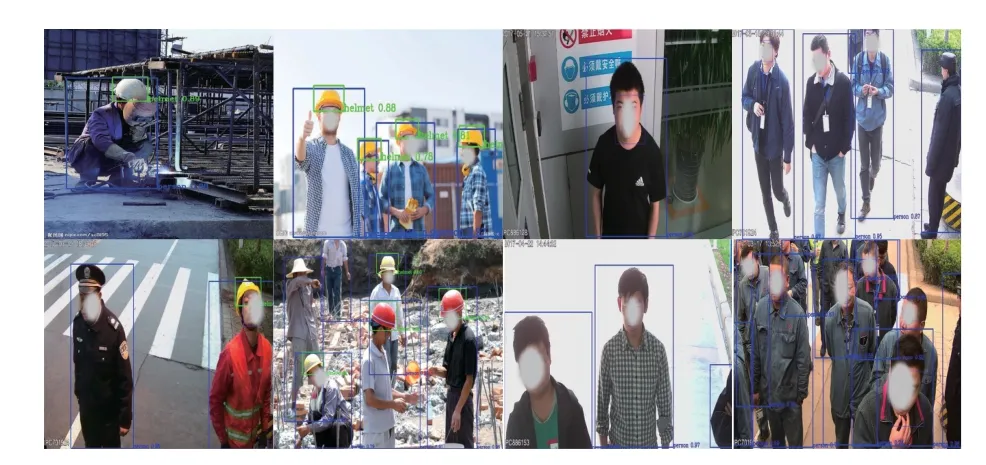
Figure10.Some detection results of experiment C on Dataset B.Pedestrians and helmets are detected.
V.CONCLUSION
In this paper,we proposed an ISS method based YOLOv3,and then applied it in helmet and pedestrian detection.By separating the categories,the detection of the helmet and pedestrian is divided into two parallel branches,and 9 prior boxes are set for each branch.By adding the annotation information of the image to the loss function of YOLOv3,we can eliminate the error effect of unlabeled samples,which enables us to make full use of the labeled samples in different datasets.The results of experiment C show that our proposed ISS method achieves the best results.In our experiment,when the thresh of IoU is set to 0.5,the of helmets is 0.891,and the of pedestrians is 0.864.In the future,we will prune and quantify this model to running it on edge devices.
- China Communications的其它文章
- Edge Caching in Blockchain Empowered 6G
- Spectrum Prediction Based on GAN and Deep Transfer Learning:A Cross-Band Data Augmentation Framework
- Layered D2D NOMA
- Fully Connected Feedforward Neural Networks Based CSI Feedback Algorithm
- Erasure-Correction-Enhanced Iterative Decoding for LDPC-RS Product Codes
- Power Allocation for NOMA in D2D Relay Communications

