Rolling element bearing diagnostics based on EMD and logarithm of short-time energy
Fan CHEN,Xiao-yu ZHANG
(Jiangmen Polytechnic,Jiangmen 529030,China)
Abstract:Studies show that defected rolling element bearing brings out periodic impact force.Therefore,extracting the cyclic characteristics of the impact force is of significant importance for the bearing diagnosis.In the present study,a novel fault characteristic frequency extraction method is proposed based on the empirical mode decomposition(EMD)and the logarithm of the short-time energy.Firstly,the intrinsic mode function(IMF)containing the fault is sifted by the empirical mode decomposition and correlation coefficient.Then the short-time energy of the IMF is integrated and the natural logarithm is considered to obtain the energy curve.Finally,the fault characteristic frequency of the bearing is found by the spectral analysis of the energy curve.The effectiveness of the proposed method is verified by simulation and experiments.Comparison of the proposed method with Hilbert envelope method and energy operator method shows that the proposed method can highlight the fault characteristic frequency.
Key words:Rolling element bearing,Fault diagnosis,EMD,Logarithm of short-time energy
Rolling element bearing is an important component of the rotary machinery equipment.Studies show that the bearing failure can caused by many reasons such as problems in machining,installation and maintenance[1].When there is a defect in the working surface of the rolling element bearing,periodic impact occurs,that affects the working accuracy and stability of the rotary machinery equipment.Accordingly,monitoring and fault diagnosis of bearings is of significant importance in the field of fault diagnosis of the rotary machinery[2].
Vibration detection is commonly used in the fault diagnosis of the rolling element bearing[3].It is worth noting that a challenging issue of the fault diagnosis through this method is to extract the impact period,which is the fault characteristic frequency.In this regard,the resonance demodulation is the main way to extract the fault characteristic frequency.Currently,conventional demodulation methods are envelope demodulation[4]and energy operator demodulation[5].In the envelope demodulation,the fault is identified by observing the characteristic frequency and its harmonics.However,the diagnosis accuracy of the envelope demodulation method is affected by noise and other frequencies,including the shaft frequency and its harmonics.These noise frequencies make it hard to identify faults[6].In order to enhance the signal to noise ratio(SNR),narrowband filtering is required prior to demodulation.Empirical mode decomposition(EMD),as a narrow-band filtering method,decomposes signals and cooperates with the Hilbert envelope demodulation,namely Hilbert-Huang transform(HHT)[7-9].
Teager energy operator is another fault feature extraction algorithm,which can improve the harmonic feature of impacts[10-12].Moreover,the short-time energy is a feasible way to find the fault characteristic frequency[13].However,it presents many sidebands with the characteristic frequency enhanced.
In the present study,it is intended to improve the energy extraction algorithm.To this end,an innovative method is proposed for fault feature extraction of the rolling element bearing fault.Firstly,the signal is decomposed by EMD,and the fault frequency band of the signal is investigated through the correlation coefficient.Then the energy of a narrow-band signal is integrated into short-time and the logarithmic curve of the energy is obtained.Finally,the fault characteristic frequency is observed in the amplitude spectrum analysis of the curve.
1 Empirical mode decomposition[14]
In the empirical mode decomposition(EMD),a signal is decomposed into several intrinsic mode functions and a residue.The main hypothesis of the EMD method is that a signal is composed of some intrinsic mode functions(IMF).The process of the EMD algorithm is as follows:
1)All of local maximum and minimum points of signal x(t)are connected by cubic spline curves as the upper and lower envelope of x(t)respectively,while the mean is defined as m10(t).
2)Let h10(t)=x(t)-m10(t).If h10(t)is not an intrinsic mode function,it is considered as a signal that should be processed.The above mentioned steps are repeated to obtain m11(t),which is a new mean of the upper and lower envelopes.
3)Let h11(t)=h10(t)-m11(t),which is an IMF.The loop is stopped at the same time.Otherwise,the loop will be continued.If the requirements are satisfied after k times,the first IMF component can be calculated as c1(t)=h1k(t).
4)It is necessary to set a criterion to stop the above mentioned loop.In other words,the upper limit of k should be determined.Then,SD is defined in the form below to accomplish the work.

It should be indicated that the value for SD varies between 0.2 and 0.3.
5)The residue r1(t)is considered as a new original data,and steps(1)~(3)are repeated to obtain the second IMF component c2(t).This process is repeated until all IMFs and a residue are obtained.
6)Finally,x(t)is decomposed into the following expression:

Since there are multiple IMFs here,it is necessary to sift the IMF that contains the fault.Therefore,the correlation coefficients of IMFs are calculated.The correlation coefficient of discrete sequences x(n)={x1,x2,…,xn}and x(n)={x1,x2,…,xn}is defined as

The correlation coefficient always vary within the range of[-1,1],where a higherρxyindicates a stronger correlation.The IMF with the highest correlation coefficient is considered as the fault signal.
2 Logarithm of short-time energy
The signal energy is defined as the square of the amplitude,which indicates the instantaneous characteristics of the signal.The impact of bearing elements should be quickly attenuated due to the presence of damping.Meanwhile,the square of the instantaneous signal amplitude is regarded as the kinetic energy of the signal.Moreover,there is potential energy in the signal at this time.The square of the signal amplitude is not sufficient to express the total energy of the signal,including kinetic energy and potential energy.The integral mean of the energy over a period can be approximated as the instantaneous total energy.
Although noise may cause local disturbance to samples,it does not affect the short-time integrated signal.It should be indicated that short-time energy has a better anti-noise capability[15].The total signal energy at the time t0is mathematically expressed as

For the convenience of calculation,the integral time is set as the period of carrier.k=3,4,5,…
Moreover,the single impulse response of a faulty bearing is described as:

Whereξandωndenote the damping ratio and undamped natural frequency,respectively.Moreover,A andφare the initial amplitude and initial phase,respectively.
Equation(5)is integrated according to Equation(4).Then,its approximate solution is described as:

Taking the natural log of Equation(6)yields the following expression:

It is found that the logarithmic energy decreases linearly with time,which is a right triangle.Compared with an exponential decay curve,its amplitude spectrum is more concentrated in the characteristic frequency,rather than scattered on harmonics,which is favorable to observe the fault characteristic frequency.
3 Simulation
In this section,periodic pulses are used to simulate the vibration of a defected bearing[16].Let A=1,ξ=0.08,ωn=4 000,φ=0°,with a 30%Gaussian white noise.Then generate 100 pulses,while the pulse amplitude decays exponentially.The fault characteristic frequency is 50 Hz,so the pulse interval is 0.02 seconds.Fig.2 indicates that the EMDdecomposition is performed on the simulated signal.It is observed that there are significant impacts on IMF1 and IMF2.
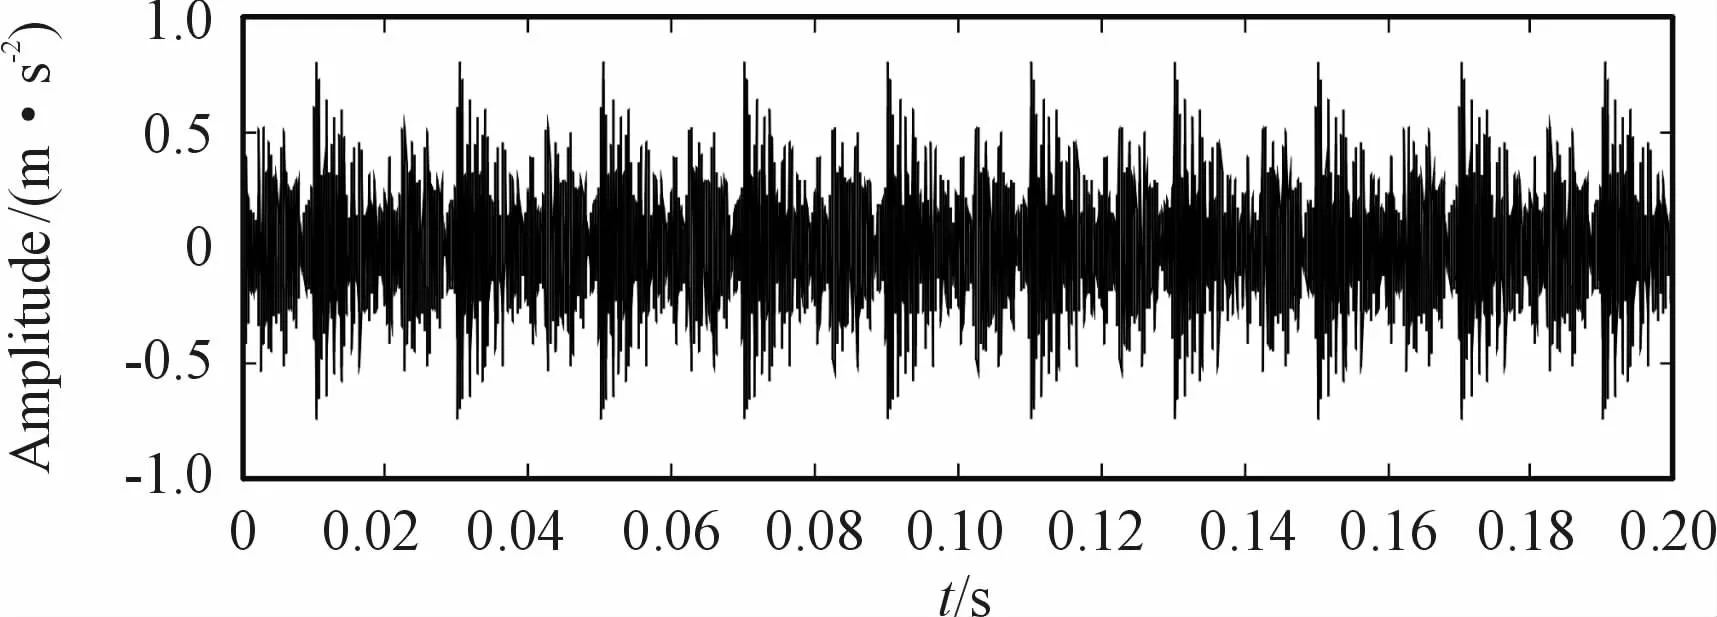
Fig.1 simulated signal of continuous impact
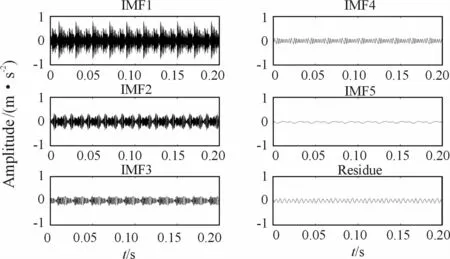
Fig.2 EMD decomposition of simulated signal
Table 1 present the correlation coefficient.It is observed that the correlation coefficient of IMF1 is the highest.

Table 1 Correlation coefficient of simulated signal
The square of IMF1 is integrated at a certain time.Then,the amplitude spectrum of the logarithm energy curve is obtained.Fig.3 shows,the fault characteristic frequency at 50 Hz.
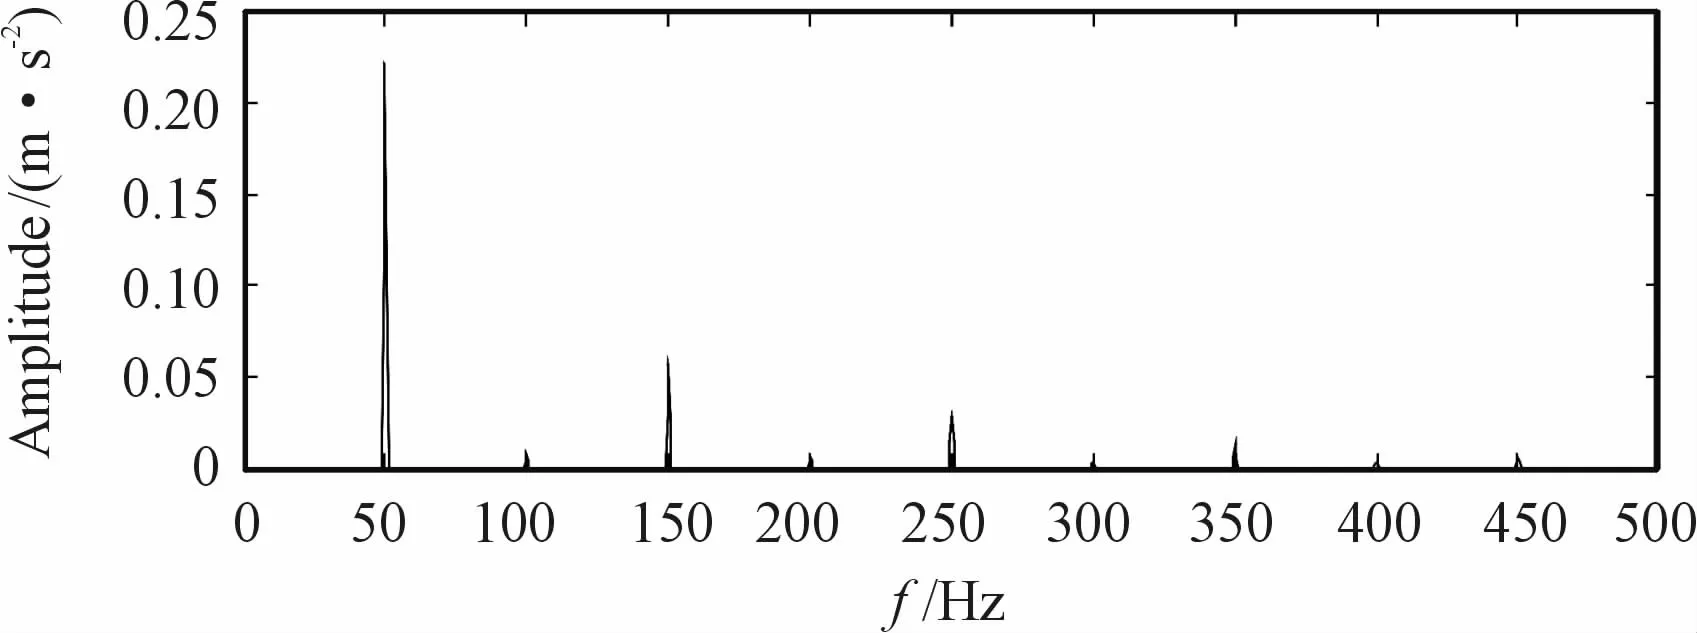
Fig.3 Logarithmic energy spectrum of simulated signal
4 Diagnosis procedure
Fig.4 shows the diagnosis process of the rolling element bearing fault,which is based on the above mentioned analysis.The diagnosis procedure can be described as the following:
1)The vibration signal of bearings is collected through acceleration sensors;
2)The collected signal is decomposed into IMFs by EMD;
3)The correlation coefficient between IMFs and the raw signal is calculated,and the IMF containing fault is sifted;
4)Square of the IMF is integrated at a certain time;
5)Take the natural log of the integral;
6)Obtain the amplitude spectrum of the logarithmic energy curve;
7)Search the fault characteristic frequency in the spectrum,and compare it with the fault characteristic frequency.

Fig.4 Block diagram of the fault diagnosis
5 Cases of the bearing failure
In order to verify the effectiveness of the proposed method,the bearing failure of the Bearing Data Center of Western Reserve University is adopted[17].Fig.5 indicates that the test stand consists of a motor(1.5 kW),a torque transducer,a dynamometer,and control electronics.It should be indicated that the test bearings support the motor shaft.Then,single point faults are introduced to the test bearings using the electro-discharge machining(EDM).The IEPE accelerometers are adopted with the linear frequency band from 0.7 to 13 000 Hz.The bearing type is 6203-2RS and the sampling frequency is 12 kHz.The single point damage with the diameter of 0.1 778 mm and depth of 0.279 4 mm on the bearing element is machined by EDM.The rotational speed and the rotational frequency are 1 797 r/min and 29.95 Hz,respectively.It is estimated that the characteristic frequencies of bearing inner ring fault and outer ring fault are 162.2 Hz,and 107.4 Hz,respectively.The experimental result is compared with the Hilbert envelope and the Teager energy operator.
5.1 Diagnosis of the inner race
Fig.6 illustrates the raw signal of the inner race fault.It is observed that there are irregular impacts masked by noise,and it is hard to identify fault characteristics.
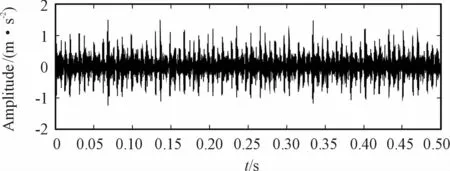
Fig.6 Time-domain signal of the inner race
Table 2 shows that the raw signal is decomposed by EMD and the correlation coefficient is calculated.It is observed that IMF1 has the highest correlation,which is sifted for the next step.

Table 2 Correlation coefficient of inner race
Hilbert transformation,Teager energy operator and logarithmic energy are adopted for the signal processing.Fig.7 shows that FFT transformation is performed to obtain the envelope spectrum,Teager energy spectrum and logarithmic energy spectrum.It is observed that the peak frequency in the envelope spectrum and Teager energy spectrum is 161.8 Hz.Moreover,the peak frequency of the logarithmic energy spectrum is 162.1 Hz.They are similar to the characteristic frequency of 162.2 Hz,which is estimated theoretically.It should be indicated that there are other frequencies in the envelope spectrum and the Teager energy spectrum,which are mainly harmonics of the fault characteristic frequency and the rotational frequency,and sidebands spaced at rotational frequency.These frequencies are depressed in the logarithmic energy spectrum,which increases the fault characteristic frequency.
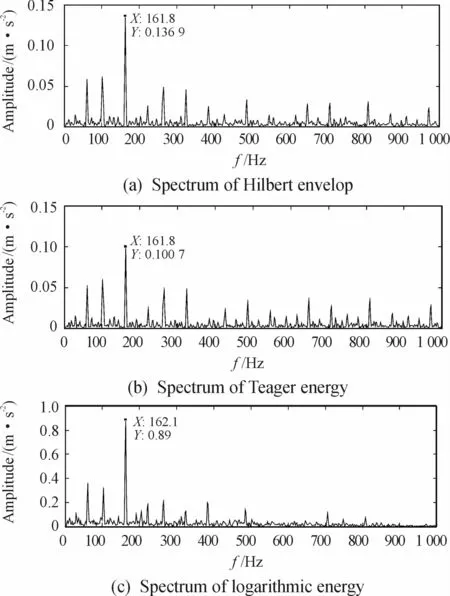
Fig.7 Diagnosis of the inner race
5.2 Diagnosis of the outer race
Fig.8 shows that the raw signal of the outer race is processed in the same way as the method mentioned above.
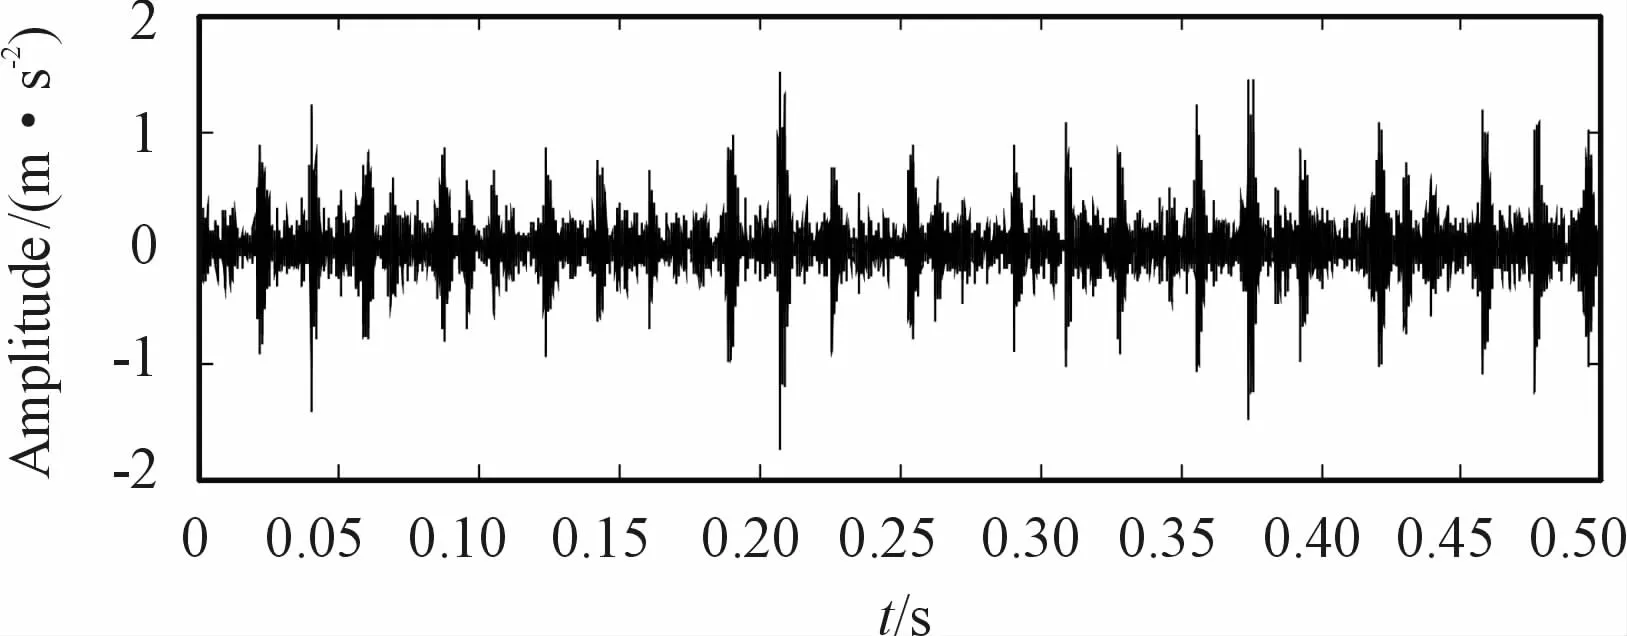
Fig.8 Time-domain signal of the outer race
Table 3 shows that the raw signal is decomposed by EMD and the correlation coefficient is calculated.It is worth noting that IMF1 has the highest correlation coefficient,which is sifted out for the next step.

Table 3 Correlation coefficient of the inner race
Hilbert transformation,Teager energy operator and logarithmic energy are adopted for the signal processing.Fig.9 shows that FFT transformation is performed to obtain the envelope spectrum,Teager energy spectrum and logarithmic energy spectrum.
The peak frequency in the envelope spectrum and Teager energy spectrum is 107.3 Hz.Moreover,the peak frequency of the logarithmic energy spectrum is 107.6 Hz.They are similar to the characteristic frequency of 107.4 Hz,which is estimated theoretically.It should be indicated that there are other frequencies in the envelope spectrum and Teager energy spectrum,which are depressed in the logarithmic energy spectrum.
6 Conclusion
In the present study,a novel method based on the EMD and logarithmic energy is proposed for the fault diagnosis of the rolling element bearing.In order to verify the effectiveness of the proposed method,it is compared with the Hilbert envelope method and Teager energy operator method.The following conclusions are drawn from this study:
1)Signals can be decomposed effectively through EMD,and the signal containing fault can be sifted out through the correlation coefficient.
2)The logarithmic short-time energy of an impulse response signal is synchronized with pulses.The fault characteristic frequency is more significant in the spectrum of the logarithmic energy,which is favorable to the identification of the fault characteristic frequency.
3)Logarithmic energy method can depress harmonics and sidebands better than the Hilbert envelope method and Teager energy operator method.
- 机床与液压的其它文章
- Lubricating performance of conical spindle distribution in the ball piston pump
- Mechanism analysis and control of asymmetrical digital cylinder
- Reliability analysis and calculationof the drive hydraulic system group of combined transportation
- Reliability analysis for cutterhead hydraulic drive system of remanufactured shield machine
- Application of compound buffer hydraulic cylinder in electro-hydraulic load simulator(EHLS)
- Start-up characteristics of a new electro hydrostatic actuator with an accumulator

