
Exploratory study of non-invasive, high-resolution functional macular imaging in subjects with diabetic retinopathy
2021-01-17 13:08ThalmonCampagnoliGborMrkSomfaiJingTianDeliaCabreraDeBucWilliamSmiddy
Thalmon R. Campagnoli, Gbor Mrk Somfai,2, Jing Tian, Delia Cabrera DeBuc, William E. Smiddy
1Bascom Palmer Eye Institute, Miller School of Medicine, University of Miami, Miami, FL 33136, USA
2Department of Ophthalmology, Semmelweis University, Faculty of Medicine, Budapest, Hungary
Abstract
INTRODUCTION
Diabetic retinopathy (DR) is the leading cause of blindness in working-age adults[1-2]. Changes in retinal hemodynamics are presumed to underlie its development and progression. Even though several imaging modalities have allowed improved monitoring of therapy and understanding prognosis, further knowledge would optimize these goals.
Technologies to attempt blood flow quantification in diabetics include video fluorescein angiography (FA)[3], laser Doppler velocimetry and flowmetry[4-10], and color Doppler ultrasound imaging techniques[11]. However, quantitative measurement of macular blood flow velocities (BFVs) is limited by the need for precise eye fixation and alignment for relatively long periods of time. In addition, only arbitrary units are yielded, and small diameter retinal vessels cannot be assessed. While en-face Doppler optical coherence tomography (OCT) has been reported for measuring macular BFVs quantitatively in DR eyes[12-13], only first degree vessels emanating from the optic disc could be assessed.
The Retinal Function Imager (RFI, Optical Imaging Inc., Rehovot, Israel) provides fast, non-invasive functional imaging of the macular microvasculature, including measurement of macular BFVs in absolute values at secondary and tertiary vessels. It also allows construction of high-resolution, noninvasive capillary perfusion maps (nCPMs). Its use has been reported for evaluation of a variety of posterior segment diseases[14-19]. The RFI uses a standard fundus camera coupled with a customized stroboscopic flash lamp and a fast (60 Hz) high-resolution (1024×1024 pixels) digital camera system that captures the moving hemoglobin-filled erythrocytes utilizing green (“red-free”) light (wavelength centered at 548 nm at a bandwidth of 17 nm) and digital subtraction processing algorithms[20-21]to enable BFV measurements through the generation of short movies (8 frames each) by the use of the machine’s built-in software. Additionally, nCPMs are generated by the digital enhancement of alignment of those static frames. The present study investigates the BFV imaging and capabilities of the RFI within DR severity subgroups and in comparison to a healthy control group.
SUBJECTS AND METHODS
Ethical ApprovalThis prospective study was approved by the Internal Review Board of the University of Miami Miller School of Medicine, and was conducted in accordance with the Declaration of Helsinki. Written informed consent was obtained from the patients.
Study and healthy control patients were evaluated at the Bascom Palmer Eye Institute between September 1, 2014 and April 30, 2015 using the RFI and OCT (Spectralis, Heidelberg Engineering Inc., Heidelberg, Germany) or Cirrus (Carl Zeiss Meditec, Dublin, CA, USA). Type 2 diabetic patients with nonproliferative diabetic retinopathy (NPDR) and proliferative diabetic retinopathy (PDR) with or without diabetic macular edema (DME) were studied. Nondiabetic controls had normal cardiac rhythm, normal intraocular pressure (IOP), and otherwise normal ophthalmic exam, including best corrected visual acuity (BCVA) 20/20. The RFI scanning method utilized has been described elsewhere and the protocols were the same as for a previous study we have published in a cohort of eyes with retinal vein occlusions (RVOs)[22-23]. Vessel segments in the macular area that were straight enough to be evaluated were imaged and BFV measured and, as reported in our RVO study, analysis was predicated on sufficiently reliable measurements as standarized by other investigators[24].
A path-constrained cross-correlation technique was used for BFV calculation giving separate BFV results for arteries and veins, again as a standard established by other investigators[24].
Data AnalysisData analysis was made using STATA Statistics software version 14.0 (StataCorp, College Station, Texas, USA). To assess the diあerences in arteriolar and venular BFVs between the DR study groups and controls we performed linear mixed effects models with random intercepts. Data from individual blood vessels were clustered within eyes, and data from each eye were clustered within patients in order to account for intra- and inter-eye correlations. Given the nature of this small pilot study, no power analysis was performed. The level of statistically significance (type-1 error) was defined asP<0.05 (the 5% level).
RESULTS
The current study evaluated 27 eyes of 21 study patients, including 9 eyes diagnosed with NPDR, 9 eyes with PDR, and 9 control eyes. All eyes with NPDR and 5 eyes with PDR had coexisting DME confirmed by OCT examination. Three eyes in the NPDR group were classified as severe; 6 eyes had moderate NPDR. Detailed demographic and clinical information of the study patients with retinopathy are shown in Table 1.
The mean age of the control group was 53y, ranging from 46 to 62y; none had known systemic or ocular morbidities. Table 2 demonstrate BFVs and vessel segmentation subject’s profile and Table 3 tabulates vessels segmentation and BFVs statatistical information between the study groups.
Mean arteriolar BFV in control eyes was 4.19±0.76 mm/s and venular BFV was 2.92±0.72 mm/s. Mean BFVs in the NPDR group were 4.87±2.05 mm/s for arteriolar and 2.94±1.09 mm/s for venular segments.
The mean BFV values for the PDR group included 4.48±2.63 mm/s and 2.61±0.6 mm/s for arteriolar and venules BFVs, respectively. The lower number of segmented vessels identified for study in the PDR group was due to marked capillary drop out. The PDR group consisted of patients with and without DME. When considering only the PDR subjects without DME the velocity values were 4.40±2.07 mm/s and 2.93±0.59 mm/s for arterioles and venules, respectively. For PDR eyes with DME, the arteriolar and venular BFVs were 4.53±3.26 mm/s and 2.36±0.51 mm/s. The arteriolar velocities did not statistically diあer between the overall PDR group when compared to the control (P=0.32) or the NPDR (P=0.57) groups, as well as between the NPDR and the healthy controls groups (P=0.69). The independent analysis of the PDR subgroups also failed to yield statistically significant different results for arteriolar or venular BFVs between the small subgroups of PDR with DMEvsPDR without DME (P=0.48 and 0.16, respectively), as well as for arteriolar BFV between PDR with DME or PDR without DME subgroupsvsthe control (P=0.29 and 0.77, respectively) orvsthe NPDR (P=0.42 and 0.98, respectively) groups.
We found a decrease in venular BFV in the overall PDR group when compared to the control group (P=0.019). No difference in the venular BFV was seen between the NPDRvscontrol groups (P=0.84) as well as between overall PDRvsNPDR groups (P=0.069). However, a statistically significant decrease in the venular BFV was noticed in the PDR with DME subgroup when compared to the NPDR group (P=0.01) while no statistical diあerences were found in the comparison of venular BFV between the PDR without DME subgroup and the NPDR group (P=0.49). The nCPMs provided high-resolution images of the retinal microvasculature in both the healthy, NPDR and PDR subgroups showing the fine capillary changes of the macula non-invasively (Figure 1).
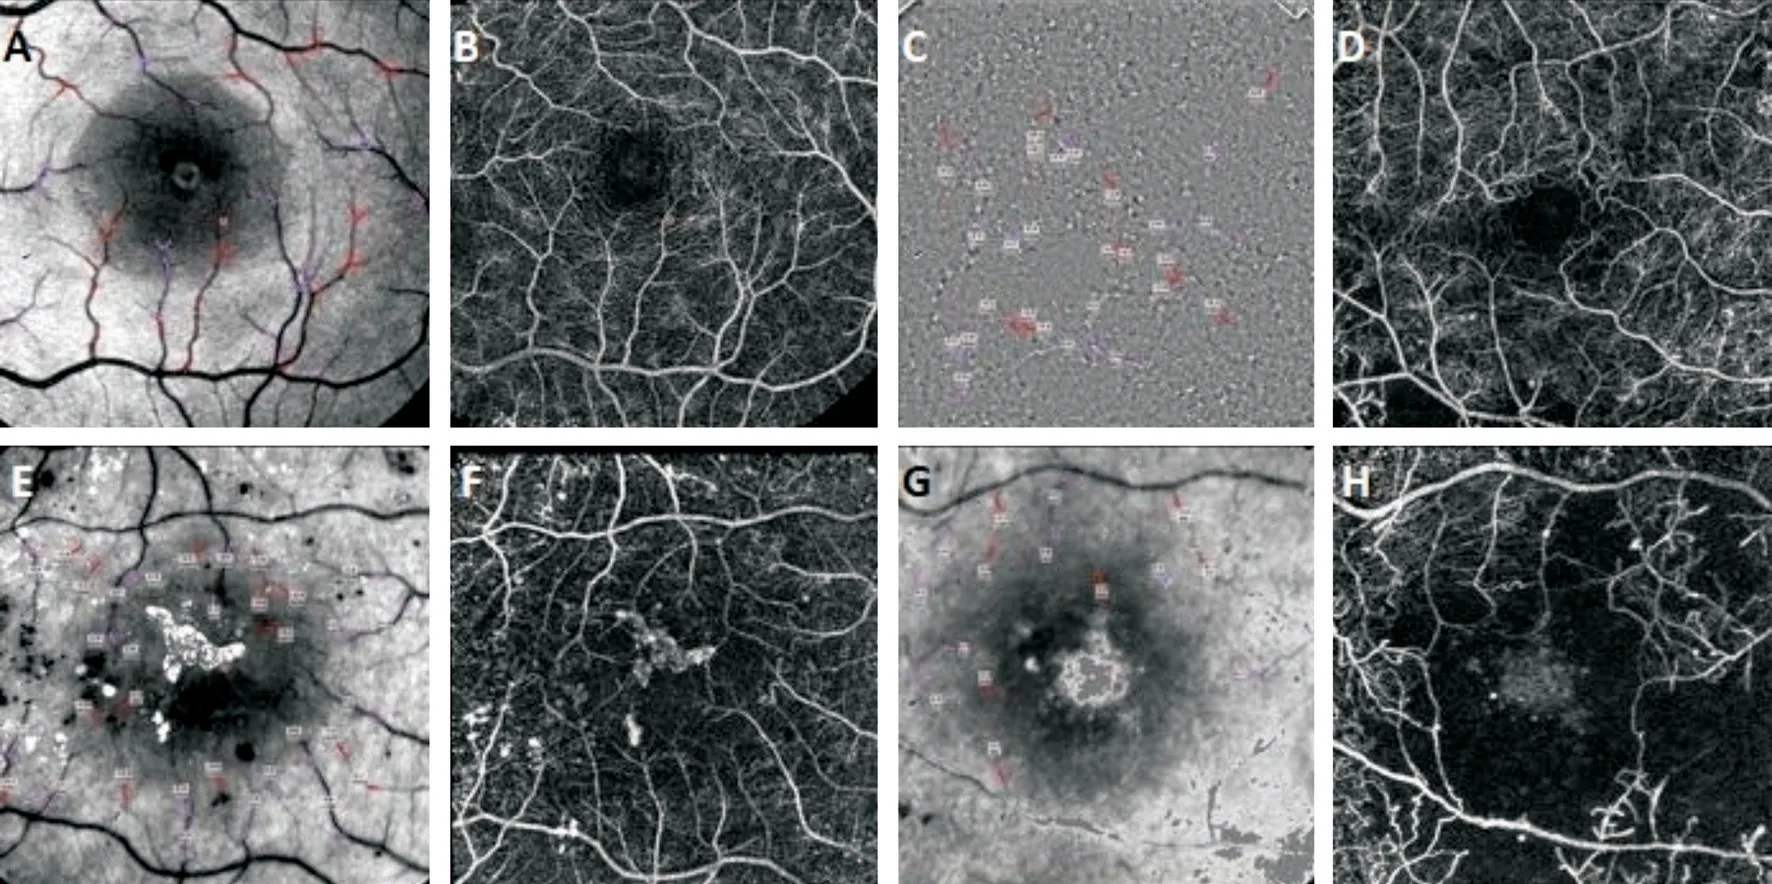
Figure 1 Examples from the study subjects for the labeled fundus images (A, E, G) with the vessel segments, and the nCPMs (B, D, F, H) A and B are from a healthy subject, C and D are from a subject with moderate NPDR and no macular edema, E and F from a subject with severe NPDR and diabetic macular edema, whereas G and H are from a subject with proliferative retinopathy. C is an example of the contrast map showing the movement of the single cells within the vessels, used for the measurement of blood flow velocity. Note the fine structure of the foveal avascular zone imaged noninvasively and also the zones of capillary dropout in D, F, and H.
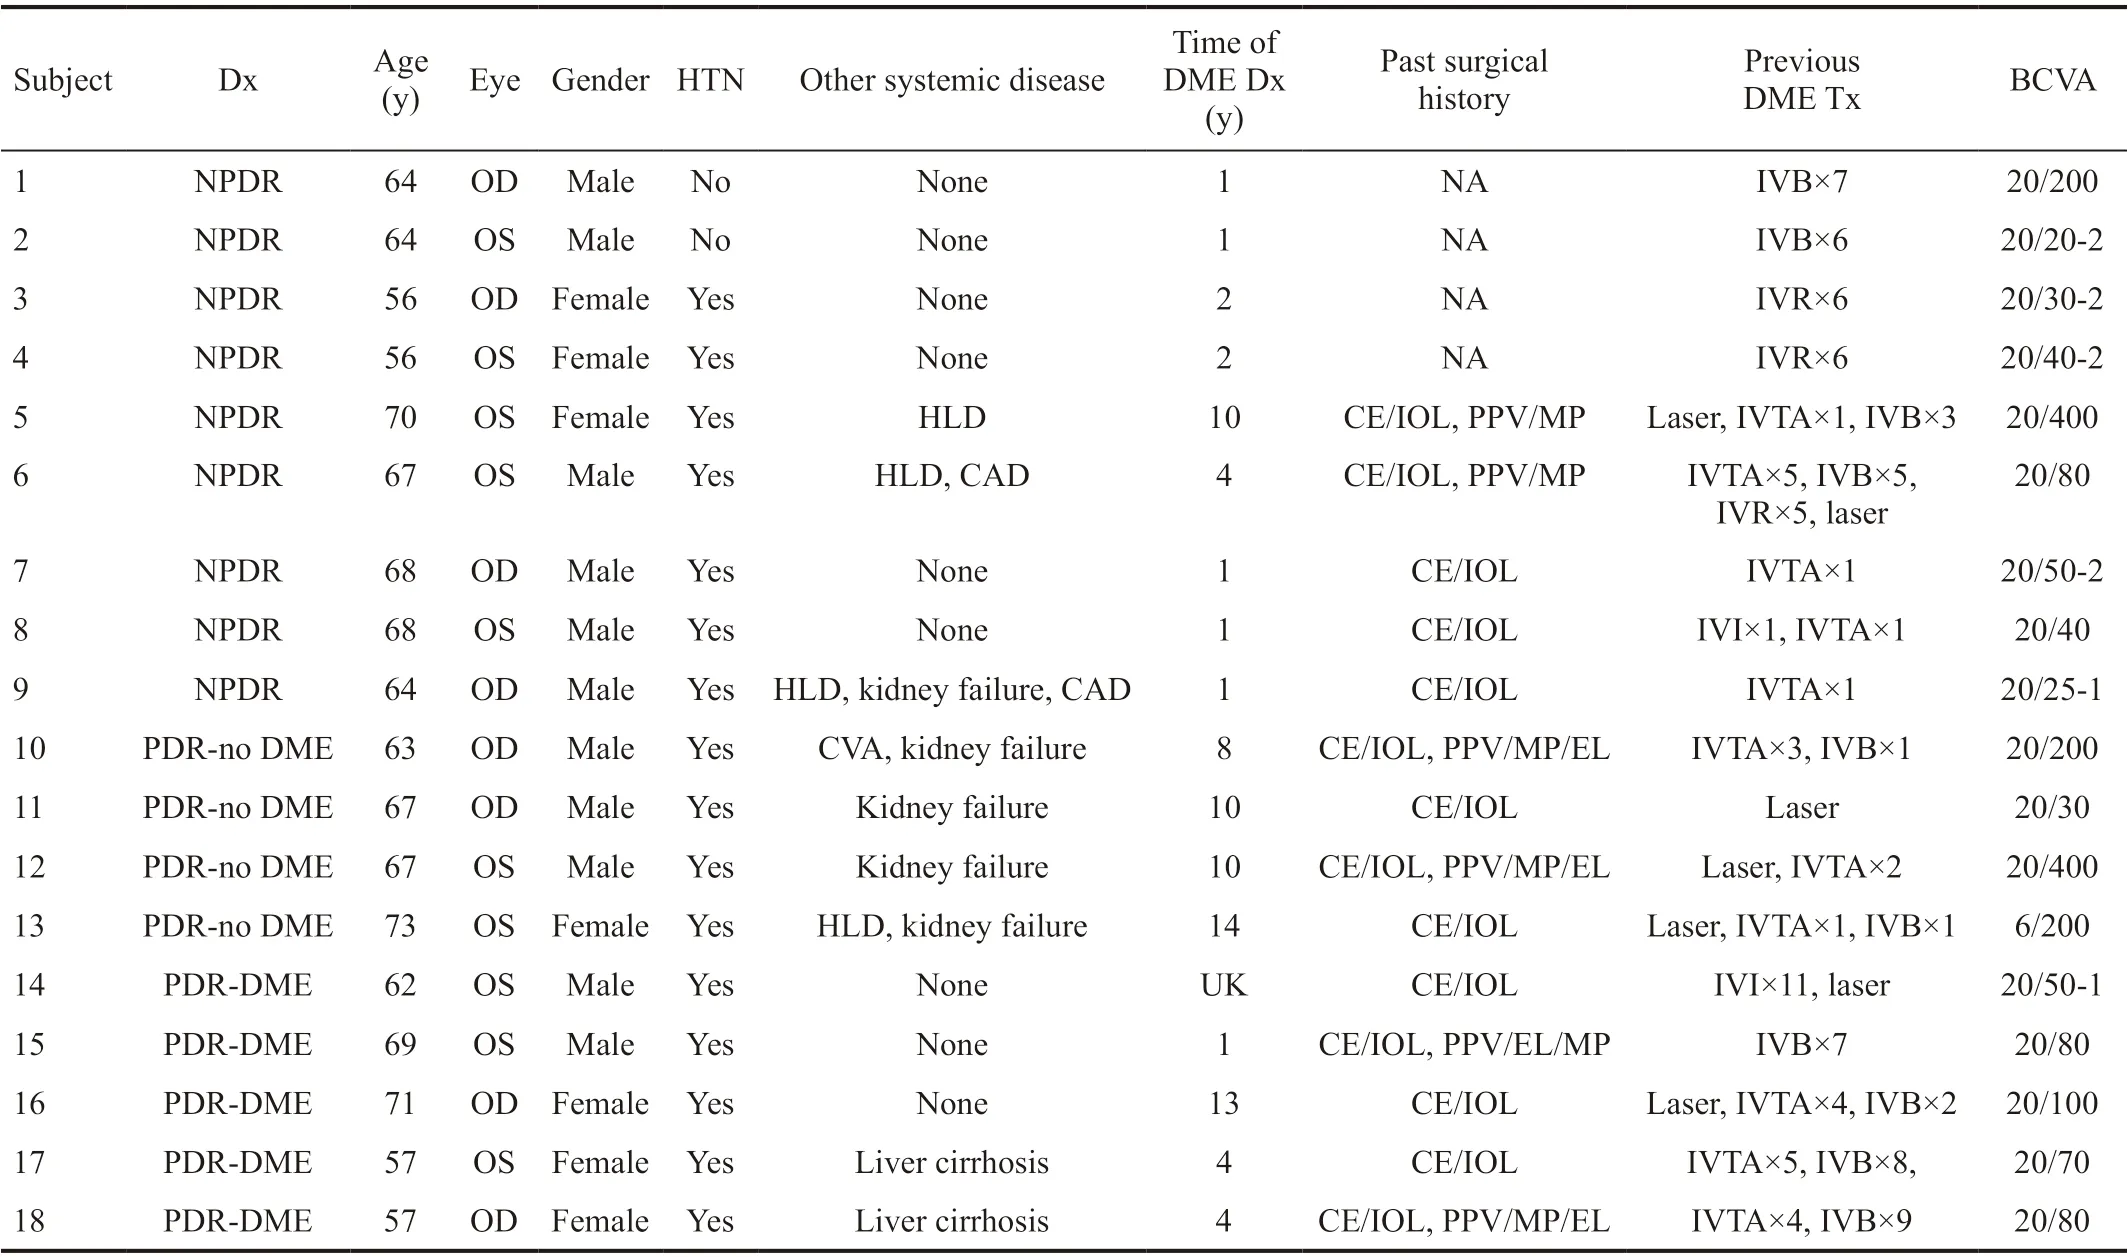
Table 1 Clinical characteristics of study subjects
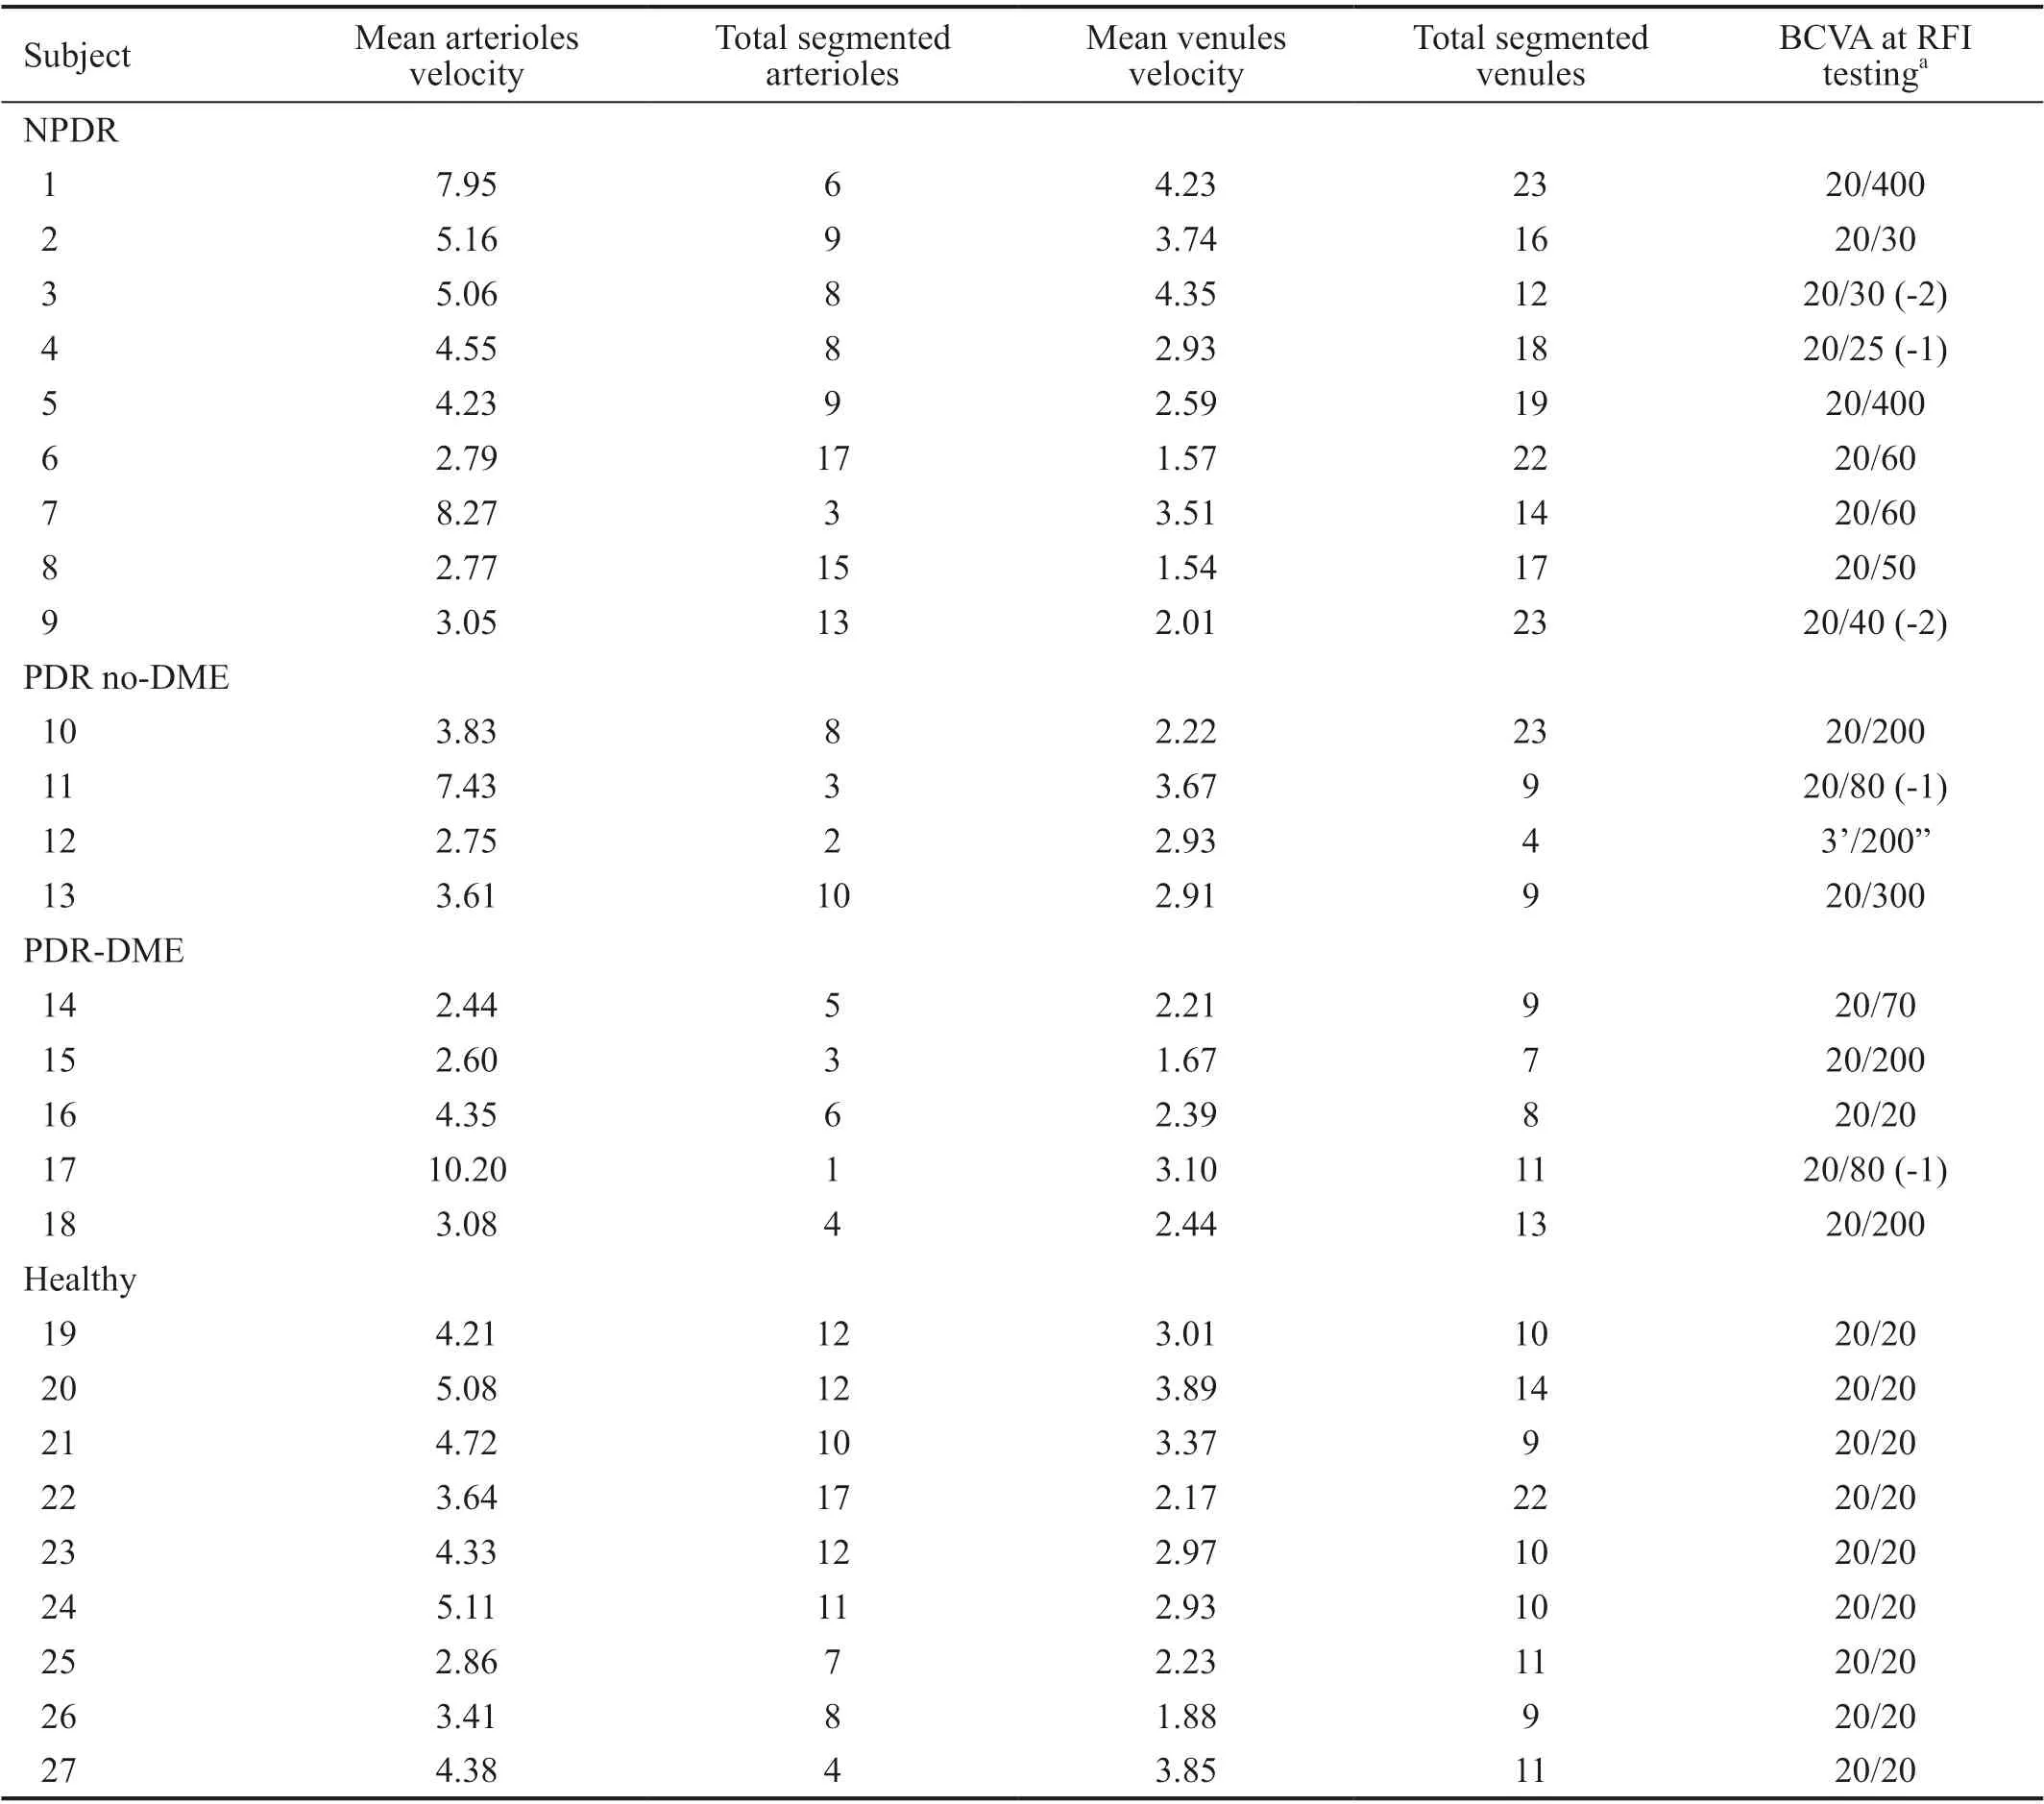
Table 2 Subjects’ blood flow velocity profile
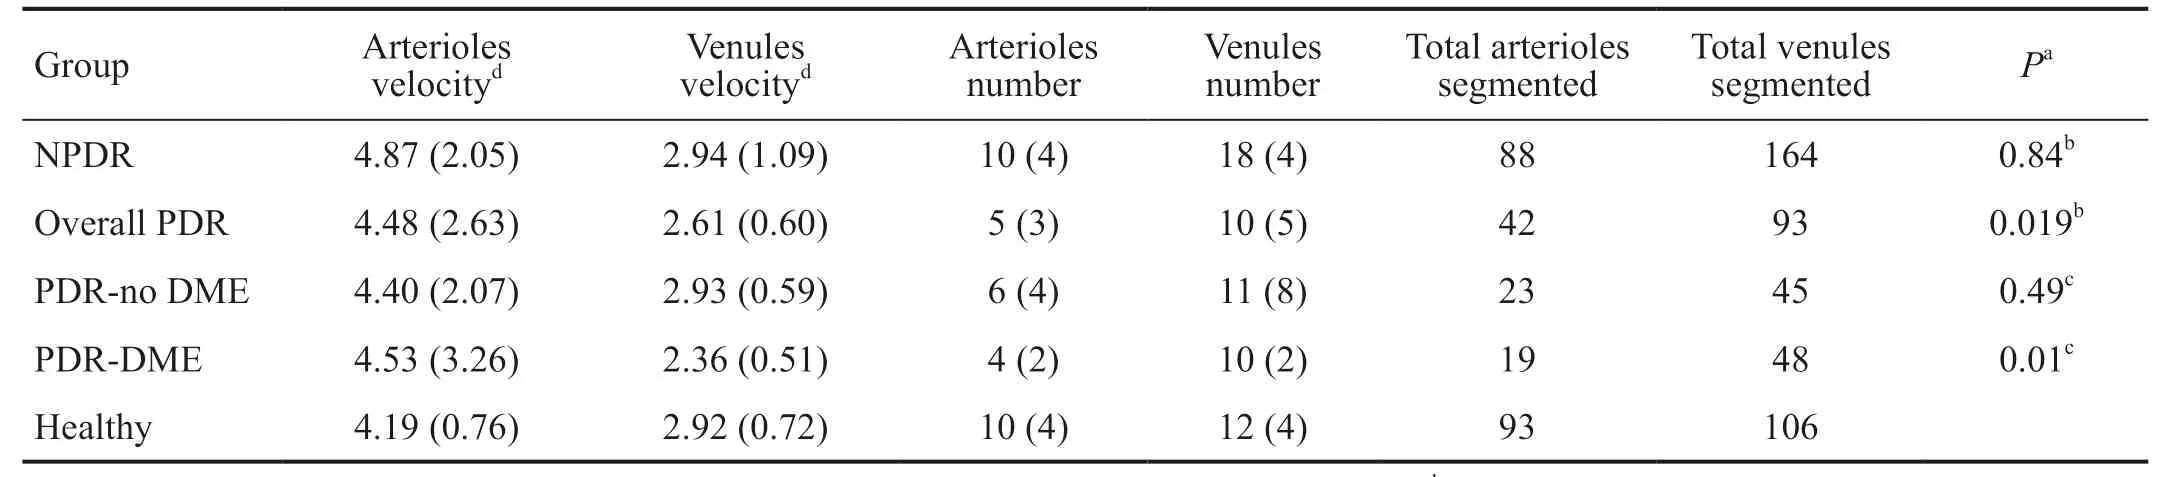
Table 3 Blood folw velocity results among groups mean (SD)
DISCUSSION
The current study demonstrated reduced venular BFV in PDR patients when compared to healthy subjects, and also decreased venular BFV in PDR with DME subjects in comparison to NPDR with DME eyes. However, there were no demonstrable differences in arteriolar BFV among these groups. This reduction of BFV in the venules but not the arterioles suggests diabetic vascular compromise may be more important on the venous rather than on the arteriolar vasculature. Whether this finding was due to the small number of cases in this study, or whether it oあers insight into the pathogenesis of advanced DR is uncertain.
RFI previously has demonstrated a capability to provide highresolution, noninvasive, functional, and quantitative retinal vascular imaging in eyes with retinal vein occlusions, but with a panvascular compromise, that is, a similar decrease in both arteriolar and venular velocities[23]. Previous studies using various imaging techniques such as OCT angiography to study blood flow have been limited to establishing patency (blood vessel cross sectional area and dynamics information), presuming that as a surrogate for blood flow[25-30]. In contrast, the RFI allows quantitative blood flow velocity measurement, which is a step closer to quantitating blood flow. Previous imaging studies (which did not measure absolute flow velocities) showed mixed results in diabetic patients[3-4,6-7,9,31-35]. The wide range of retinal changes encompassed within even the same category of DR severity degree, the likely heterogeneity in vascular dynamics and dysregulation due to multiple variables (degree of capillary closure, hypoxia levels, glycemic state, blood viscosity), and the generally pilot study nature of these reports might account for the lack of consensus. Moreover, existing technologies evaluating blood flow are constrained to evaluating first- or larger second-degree retinal vessels, which might not mirror the changes at the level of more distal macular microvasculature.
BFV is believed to decrease commensurate with increase in DR severity[6,9,36]. A comparative evaluation by Burgansky-Eliashet al[37]including 51 healthyvs58 moderate and severe NPDR eyes utilizing the RFI found significant decrease in both arteriolar and venular BFVs in the NPDR group, but no significant BFV changes between eyes with (33 eyes) and without (25 eyes) clinically-significant DME. Other previous studies comparing NPDRvshealthy subjects BFV have also showed decreased velocities in NPDR eyes[6,38-39]. Landaet al[40]found a positive correlation between venular BFV by RFI and central retinal thickening by OCT imaging evaluation; given all our NPDR subjects presented DME. Landaet al[40]findings may justify the lack of velocity diあerence amongst the current study’s NPDR and healthy controls groups. Konnoet al[41]have also suggested a transition from decrease to increase in arteriolar BFV in diabetic eyes depending upon the duration and severity of retinopathy with increasing BFVs in more advanced cases; they postulated this to be secondary to the occurrence of anastomotic channels (shunts) traversing areas of capillary closure deviating blood directly from the arterioles to the venules. The present study corroborates statistically significantly decreased venular BFV in more severe DR stages (i.e.in the PDR group), but not in NPDR-DME eyes when compared to healthy subjects.
The current study is limited by the sample size because eyes with mild media opacities were excluded since the RFI imaging requires clear media. Additionally, some patients with other coexisting disease had to be eliminated from the study since the RFI’s imaging acquisition is limited by a very intense light which is not tolerated by some individuals. Hence the current study cohort may have represented a selected group. Also, we utilized a semi-automated (partially manual) segmentation method to delineate the vasculature of interest and several blood vessels did not meet the ideal coefficient of variance levels. The RFI in new versions of the software, which is currently under development, might allow inclusion of a broader range of patients and vessels per patient once the need for manual processing of the areas of interest can be automated.
The RFI offers a quantitative assessment of blood flow velocity, a step closer to measuring absolute blood flow volume[42]. The authors believe the RFI provide superior macular microvasculature BFV measurements, which can be important in understanding retinal diseases when in conjunction with precise blood vessel dynamics information. The current study in its pilot nature provided enough evidence to suggest that DR, at least initially might be more of a venular rather than arteriolar disease.
ACKNOWLEDGEMENTS
Conflicts of Interest:Campagnoli TR,None;Somfai GM,None;Tian J,None;DeBuc DC,None;Smiddy WE,None.
 International Journal of Ophthalmology2021年1期
- International Journal of Ophthalmology的其它文章
- Response of L V Prasad Eye Institute to COVID-19 outbreak in India: experience at its tertiary eye care centre and adoption to its Eye Health Pyramid
- Preliminary studies of constructing a tissue-engineered lamellar corneal graft by culturing mesenchymal stem cells onto decellularized corneal matrix
- Therapeutic potential of Rho-associated kinase inhibitor Y27632 in corneal endothelial dysfunction: an in vitro and in vivo study
- Changes of matrix metalloproteinases in the stroma after corneal cross-linking in rabbits
- A multi-omics study on cutaneous and uveal melanoma
- Eあects of quercetin on diabetic retinopathy and its association with NLRP3 inflammasome and autophagy