
A multi-omics study on cutaneous and uveal melanoma
2021-01-17 13:08QiZhangZeNanLinJieChenWenXuZheng
Qi Zhang, Ze-Nan Lin, Jie Chen, Wen-Xu Zheng
1Institute of Pathology and Neuropathology, University of Tuebingen, Tuebingen 72076, Germany
2University Eye Hospital, Center for Ophthalmology, University of Tuebingen, Tuebingen 72076, Germany
3Department of Ophthalmology, Shanghai East Hospital, Tongji University School of Medicine, Shanghai 200120, China
4Department of Ophthalmology, the Second Hospital Aきliated to Jilin University, Jilin University, Changchun 130041, Jilin Province, China
Abstract
INTRODUCTION
Cutaneous melanoma (CM) and uveal melanoma (UM)are two fatal malignancies. They account for more than 90% and 5% of all melanomas respectively. UM is the most common eye tumor and constitutes about 85% of the intraocular malignancies. The incidences of CM and UM were reported to be 100-300 per 1 million and 7 per 1 million per year, respectively[1]. Though CM and UM arise in different tissues, both of them derive from melanocytes. Despite the common origin, the etiopathogenesis, biological processes, metastatic routes and clinical prognosis of these two melanomas diあer greatly from each other[2]. Furthermore, some eあective therapeutic methods applied in the treatment of CM have little eあects on the UM patients. Thus, it’s meaningful to elucidate the detailed distinctive mechanisms underlying these diあerent behaviors of the two tumors[3]. However, cross-cancer studies are rarely performed because of many objective factors such as the limitation of collecting enough samples of varied cancers in a single institution and the huge expenses of largescale cancer researches.
The Cancer Genome Atlas (TCGA) is a dataset that provides comprehensive, multi-level (gene mutation, methylation, mRNA, miRNA, proteins, clinical data) data of 43 selected cancer projects (until Oct. 2018). Because much data on it is publicly available, a lot of TCGA-based studies were already conducted to compare diあerent tumors at a pan-cancer level[4-5].
To the best of our knowledge, this is the first TCGA-based study focusing on the comparison of CM with UM on multiple levels.
MATERIALS AND METHODS
In this study, we used R language (version 3.5.2) and its variety of packages (TCGAbiolinks, TCGAbiolinksGUI and ELMERetc.) to analyze the data from TCGA and illustrate figures[6-8]. In order to eliminate the eあect of metastatic process, only the data of primary tumors were included in the study.
Multiple Genomic Alteration AnalysisIn order to ensure the data quality, mutation annotation format (MAF) files were downloaded from the TCGA data portalviaR. First, the package “TCGAbiolinks” was used to analyze the MAF files of CM (104 files) and UM (80 files) separately. Second, we pooled the MAF files together to identify the top 20 most frequently mutated genes of the combined group which were presented with additional information such as “disease”, “gender” and “race”. All variant coordinates were transferred to genome reference hg38.
Differentially Expressed GenesFirst, we downloaded the combined mRNA data which contained 103 CM samples and 80 UM samples. The combined data was then analyzed with an Array Array Intensity correlation which defined a square symmetric matrix of Pearson correlation among all 183 samples. Second, the combined mRNA data was processed with within-lane normalization and betweenlane normalization. Ultimately, with a threshold of 0.25, diあerentially expressed genes (DEGs) were identified through edgeR function of the package TCGAbiolinks.
Gene Ontology Enrichment AnalysisWith the identified DEGs, we performed the gene ontology (GO) enrichment analysis in three perspectives, biological process, cellular component and molecular function. Besides, 10 most significantly enriched pathways were also identified. The results were plotted by the -log(P-value corrected FDR).
DNA MethylationDNA methylation analysis of both CM and UM were conducted on the platform “Illumina Human Methylation 450”. We searched for differentially methylated CpG sites, which were regarded as possible functional regions involving in gene transcriptional regulation. In order to find these regions, the beta-values of methylation were used for the comparison. First, the calculation of the mean methylation of each tumor was performed. Second, we calculated theP-value by using a Benjamini-Hochberg adjusted Wilcoxon test. Finally, a heatmap of the methylation of CM and UM was generated with R.
Integration of DNA Methylation and Gene Expression DataWe conducted the integration of DNA methylation and gene expression data with the results from step 2 and step 4 by using the “TCGAvisualize_starburst” function in the “TCGAbiolinks” package.
Differentially Expressed miRNAsWe downloaded the combined miRNA data which contained 103 CM samples and 80 UM samples. By using the function “TCGAanalyze_DEA”, we identified the differentially expressed miRNAs between CM and UM patients. The “fdr.cut” and “logFC.cut” were set to be 0.01 and 1, respectively.
ELMER Analysis on Identifying the Differentially Expressed Master Transcription FactorsWith the ELMER package, a Multi Assay Experiment (MAE) object including a DNA methylation matrix and a gene expression matrix was generated. For instance, in the hypomethylated direction, the samples of CM and UM were ranked by the beta values of the DNA methylation and 20% of the samples with the lowest methylation levels were processed with an unpaired onetailedt-test to find out the comparatively hypomethylated probes in CM. Afterwards, the methylation of the probes and the expression of their 10 nearest upstream and downstream genes were tested for an inverse correlation. The diあerentially methylated probes were identifiedviathe Mann-WhitneyUtest and the non-parametric test. Then, we integrated the significant probe-gene pairs to perform the motif enrichment analysis which finally helped to identify the candidate diあerentially expressed master regulatory transcription factors (TFs). The same method was also applied in the analysis of the hypermethylated direction.
RESULTS
Multiple Genomic Alteration AnalysisIn Figure 1A and 2A, we noticed that single nucleotide polymorphism (SNP) was the most common variant type in both tumors when compared with insertion and deletion. Furthermore, in both tumors, “C>T” was the most frequent one in the six classes of single nucleotide variant (SNV) types. With regard to the variant classification, a same ranking order was observed in both groups, with missense mutation ranking first, followed by nonsense mutation, frameshift deletion and frameshift insertion. Besides, CM samples had a median variants’ number of 223.5, with the maximum reaching more than 5000, whereas the median variants’ number of UM was only 11 and the maximum was less than 400. This is concordant with a previous study which reported that CM had more mutational burden than UM[9].
Furthermore, the CM and UM samples were combined together into a pooled analysis (Figure 3). We identified the 20 most frequently mutated genes in the combined group, withTTN(40%) ranking first, followed byMUC16(37%),BRAF(29%),GNAQ(24%),PCLO(21%),DNAH5(21%),GNA11(20%),DNAH7(18%),ADGRV1(18%),LRP1B(17%),FAT4(16%),XIRP2(16%),CSMD1(16%),DNAH9(16%),HYDIN(16%),ANK3(15%),MGAM(15%),THSD7B(15%),FLG(14%),ZFHX4(14%). In the included 184 (104 CM and 80 UM) samples, 172 (93.48%) had at least one mutation in the abovementioned 20 genes.

Figure 1 Multiple genomic alteration analysis of CM A: The counts of 3 variant types; B: The counts of 5 gene variant classifications; C: The variants’ counts of 6 SNP classes; D: The variants’ counts per CM sample; E: The summary of 5 gene variant classification: box plots show median counts and the interquartile range; F: Top 10 most frequently mutated genes in the CM group.
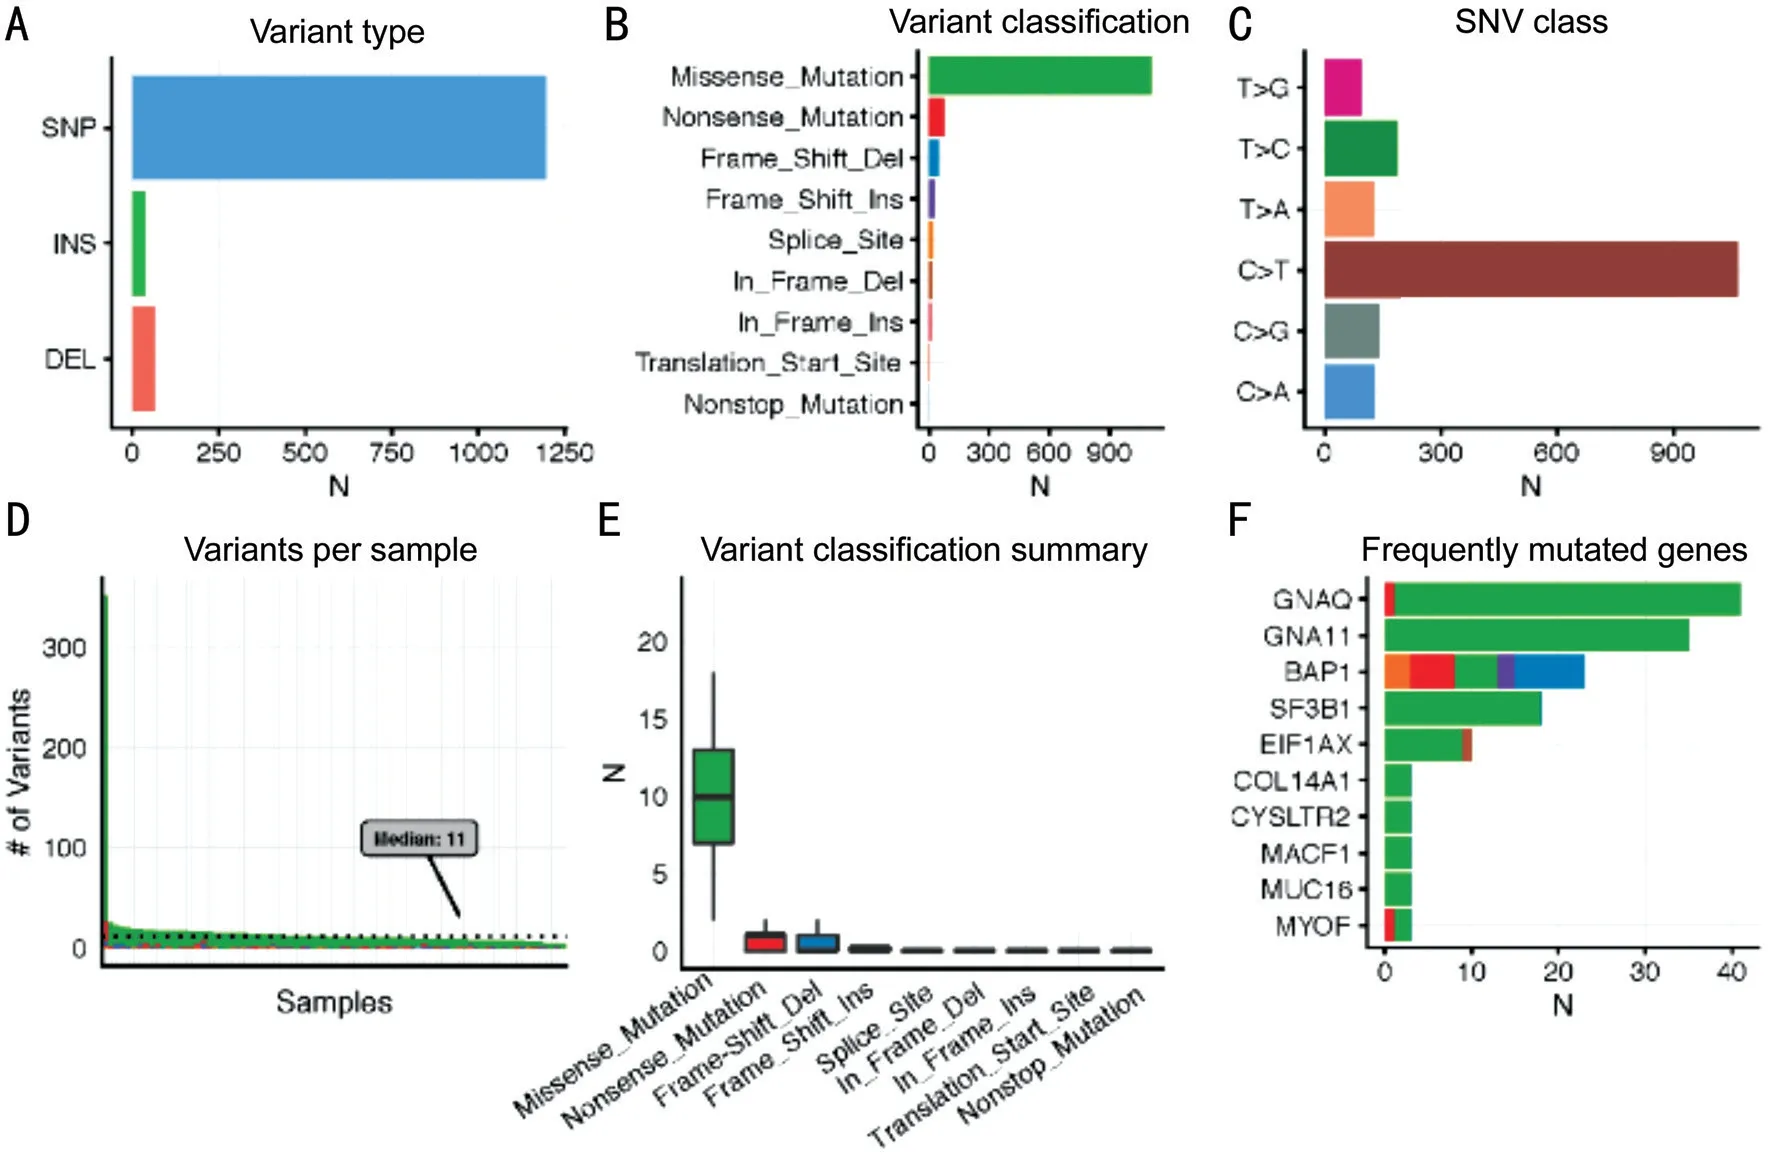
Figure 2 Multiple genomic alteration analysis of uveal melanoma A: The counts of 3 variant types; B: The counts of 9 gene variant classifications; C: The variants’ counts of 6 SNP classes; D: The variants’ counts per UM sample; E: The summary of 9 gene variant classification: box plots show median counts and the interquartile range; F: Top 10 most frequently mutated genes in the UM group.

Figure 3 Top 20 most frequently mutated genes in the combined group of CM and UM The upper histogram shows the variants’ counts per sample. The percentiles at the left border of the main heatmap mean the occurrence ratio of each gene mutation. The right horizontal histogram presents the variant classifications of each gene. The covariate tracks show clusters for disease, gender, race and variant classification type.

Table 1 Top 20 diあerentially expressed genes
Interestingly, mutation on titin, orTTN, occurred in 71 (68%) of 104 CM samples, whereas only 2 (2.5%) of 80 UM samples were identified to haveTTNmutations. In our study, 68 (65 CM and 3 UM) samples were identified to haveMUC16mutations. We also noticed an obvious absence ofBRAFmutation in the UM group. In contrast to these top three mutated genes, 40 of the 44GNAQ-mutated samples originated from UM, with the left four deriving from CM. Thirty-nine samples with mutatedPCLOwere detected in our study. Among them, 38 were CM samples and only one UM sample. Within the 38 mutated CM samples, the number of male samples (n=26) was more than twice as large as the number of female samples (n=12). Three cytoskeletal dynein genesDNAH5,DNAH7andDNAH9were also presented in the top 20 mutated genes. We noticed that only one UM sample was detected withDNAH7mutation while the others were all CM samples. Similarly, few UM samples were found in theXIRP2-,ADGRV1-,LRP1B-,CSMD1-,HYDIN-,MGAM-,FLG-,ZFHX4-,ANK3- andFAT4-mutated groups.
Transcriptomic AnalysisTotally 80 UM and 103 CM mRNA samples were included in the transcriptomic analysis. Finally, 4610 differentially expressed genes were identified. The top 20 diあerentially expressed genes (Table 1) were selected and ordered by the Delta value (the diあerence of gene expression between the two tumors multiplied logFC),i.e.KRT14,KRT6A,KRT16,KRT6B,KRT5,KRT17,KRT1,KRT6C,FN1,APOD,SERPINE2,KRT10,COL1A1,S100A9,SFN,TNC,S100A7,EEF2,S100A8,SPRR1B. Interestingly, 9 of the 20 identified genes belonged to the Keratin family which were abundant in the keratinocytes and were regarded as epithelial markers. And three members of S100 protein family(S100A7,S100A8andS100A9) were also shown in Table 1.
GO Enrichment AnalysisBasing on the results of DEGs, we performed a GO enrichment analysis to classify the DEGs. Three GO types (biological processes, cellular components, molecular functions) and pathways were investigated. The results were ordered by -log10(FDR).
In the 10 identified biological processes, we observed three processes with epidermal characteristics,i.e.the epidermal cell differentiation, epidermis development and keratinocyte diあerentiation. The DEGs also influence the cell and biological adhesion process. Additionally, two sensory organ-associated process,i.e.sensory perception and cognition, were also identified in the top 10 most significant biological processes.
From the perspective of the cellular component, it’s noteworthy that eight of the 10 components were associated with cellular membrane, including plasma membrane, extracellular region part, extracellular region, intrinsic to plasma membrane, integral to plasma membrane, proteinaceous extracellular matrix, extracellular matrix and extracellular space.
With regard to the molecular function, the DEGs were enriched majorly in the binding functions. Despite the eight identified binding functions, the structural molecule activity and chemokine activity were also presented in the top 10 functions. Finally, the DEGs were integrated to identify the most significantly enriched pathways. We noticed that four of the 10 identified pathways were associated with the immune system, including the granulocyte adhesion and diapedesis, agranulocyte adhesion and diapedesis, T helper cell differentiation and the role of nuclear factor of activated T cells (NFAT) in regulation of the immune response. Other presented pathways like hepatic fibrosis/hepatic stellate cell activation and colorectal cancer metastasis signaling were also identified as DEGs-enriched pathways.
DNA MethylationThe methylation data of both tumors (104 CM and 80 UM samples) were acquired through the platform of Infinium Human Methylation 450. First, a comprehensive study was performed to check the mean DNA methylation level of the two tumors. A significant difference of DNA methylation level between the two tumors was confirmed by thettest withP<0.001. Second, a heatmap (Figure 4) was generated to visualize the DNA methylation level across all CM and UM samples. While notable methylation diあerences could be observed between CM and UM, no obvious disparities were detected in genders and races.
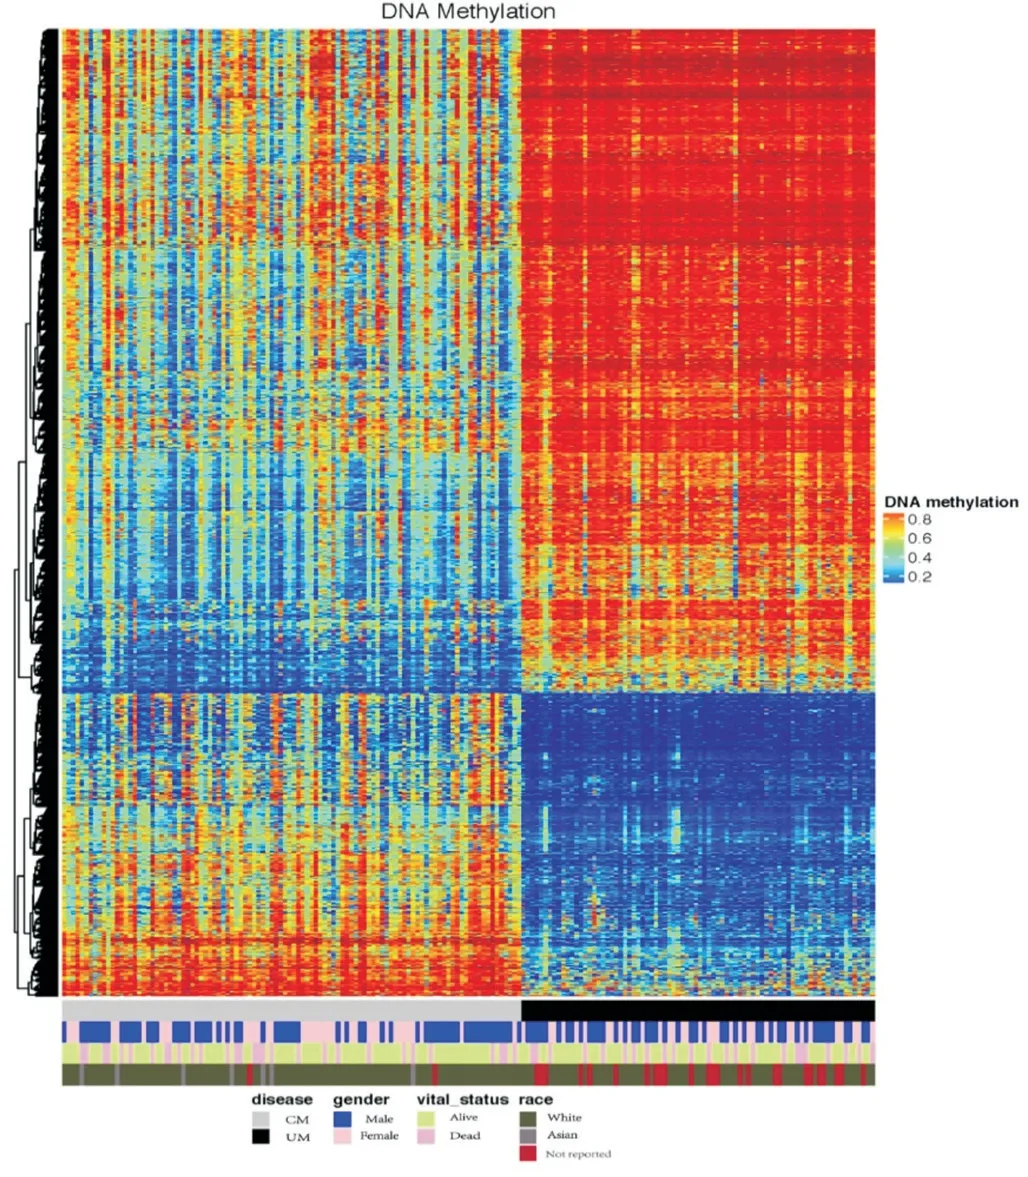
Figure 4 DNA methylation landscape across all CM and UM samples The heatmap shows the DNA methylation levels across CM and UM samples. Covariate tracks show the subtypes of diseases, genders, vital statuses and races.
DEGs and DNA MethylationDNA methylation locating at promoters has been confirmed to have a silencing eあect on the respective genes[10]. To investigate the methylation diあerences between CM and UM, a starburst plot was produced based on the differentially methylated CpG sites and nearby genes (Figure 5). DNA methylation [log10(FDR-correctedP-value)] and DEGs’ expression [log10(FDR-correctedP-value)] were plotted on the x-axis and y-axis, respectively. Both of the horizontal and vertical black dashed lines presented an FDRadjustedPvalue of 10-5. We noticed that most DEGs were downregulated in UM. Within the downregulated DEGs, hypo- and hypermethylation presented no obvious diあerence.
miRNATotally 485 differentially expressed miRNAs were identified. The top 20 miRNAs were presented and ordered by the absolute value of logFC in Table 2. Despite miR-124-1, the other 19 miRNAs were all downregulated in UM. Recent investigations indicated that miR-205, miR-206, miR-203a, miR-124, miR-105-1, miR-200c and miR-516b was significantly downregulated in several types of malignancies[11-16].
Diあerentially Expressed Master Transcription FactorsIn the hypomethylated (comparative hypomethylated in CM than in UM) direction, 39 enrichment motifs were identified while 66 were identified in the hypermethylated direction. Basing on the identified enriched motifs, we found 114 and 116 potential differentially expressed master TFs in hypomethylated and hypermethylated direction, respectively. Many of the identified master regulatory TFs were associated with the epithelial mesenchymal transition (EMT). Particularly, the acknowledged core EMT-TFs,i.e. SNAI1,SNAI2,TWIST1andSIX1were found to be relatively more hypomethylated in the CM than in the UM[17].

Figure 5 Starburst plot based on the differentially methylated CpG sites and nearby genes DNA methylation [log10(FDR-corrected P-value)] and DEGs’ expression [log10(FDR-corrected P-value)] were plotted on the x-axis and y-axis, respectively. Both of the horizontal and vertical black dashed lines presented an FDR-adjusted P value of 10-5.

Table 2 Top 20 diあerentially expressed miRNAs
DISCUSSION
Progress in elucidating the cellular and molecular distinctions between CM and UM has been made majorly in form of directly comparing results from isolated studies of the two tumors which might be restricted by the former studies’ design and heterogeneity of the data. The publicly available data in the TCGA provide an optimal method to conduct a comprehensive study which can avoid the aforementioned problems. The findings of this multi-omics study enable us to elucidate the important problems concerning both malignancies like the role of EMT in CM and UM, the distinctive metastatic routes and organs’ tropism.
The Role of Epithelial Mesenchymal TransitionThe top 20 most frequently mutated genes supported the acknowledged key role ofBRAFandGNAQ/11in the etiopathogenesis of CM and UM, respectively[18-19]. WhileGNAQ/11mutations were found almost uniquely in the UM, the majority of the other 18 mutated genes (includingBRAF) were presented by the CM samples. Within the 18 mutated genes,MUC16,PCLO,DNAH5,DNAH7,DNAH9,ADGRV1,ANK3,FAT4andXIRP2encoded cytoskeleton- and extracellular matrix-related proteins (CECMPs) which were reported to provide the most common class of cancer mutants and estimated to play a role in the EMT[20-23].
On the transcriptomic level, it’s noteworthy that eight of top 20-DEGs are keratin family members which were regarded as epithelial markers. And several previous studies implied that keratins may play a role in the progression of CM[24]. Besides, the DEGs-listedFN1,SERPINE 2,TNC,EEF2andCOL1A1were also regarded as EMT-associated genes which could contribute to the proliferation, diあerentiation and migration of tumors[25-29].
Additionally, 13 of the top 20 diあerentially expressed miRNAs were previously reported to participate in the EMT. And they were all less expressed in CM samples than in UM samples. Ten of the 13 miRNAs,i.e.miR-205, 520c, 520b, 203a, 520f, 122, 124, 526b and 200c, were reported to negatively regulate the EMT through a variety of downstream genes likeCDH1,ZEB1,ZEB2,ADAM9,TGFBR2,SNAI2,ERK,MYC,CCND1,JUNandSNAI1etc[30-37]. Thus, we estimate that the relative low expression of these miRNAs in CM would promote the EMT. Nevertheless, the other three miRNAs, miR-520g, 105 and 1269a were reported to positively regulate the EMT through cooperating withSMAD7,TNF,TGFBandSOX4[38-40]. Therefore, more in-depth studies are needed to help elucidate the role of miRNAs in CM and UM.
In addition, the role of the EMT in diあerentiating CM and UM was also confirmed by the analysis of diあerentially expressed master regulatory TFs. In the 114 identified hypomethylated master regulatory TFs (TFs hypomethylated in CM compared to UM), the first three TFs were LEF1, E2F2 and TRIM62. They were all suggested to positively regulate the EMT[41-43]. After a brief MeSH (Medical Subject Headings) search on “Google Scholar” (https://scholar.google.com/) until Nov. 01, 2018, at least 65 TFs were previously reported to participate in the EMT, with 57 positively-regulating TFs (including three acknowledged key EMT-TFs, SNAI1, TWIST1 and SIX1) and 8 negatively-regulating TFs.
Among the 116 TFs, which were identified as relatively more hypermethylated in CM when compared with UM, we found at least 42 EMT-associated TFs after a brief MeSH search on “Google Scholar”. While 19 of them were reported to negatively regulate the EMT, 23 were found to promote the EMT. Theoretically, the hypermethylation of the 19 negativelyregulating TFs would contribute to the EMT which would support our hypothesis that CM undergoes a more obvious EMT than UM. On the contrary, the hypermethylation of the 23 positively-regulating TFs were supposed to suppress the EMT. Thus, more relevant studies are needed to present a more precise landscape of the TFs’ regulating network in these two tumors.
In summary, our multi-omics results indicate that many distinctions between CM and UM were associated with the EMT.
Metastatic RoutesWhile CM was estimated to spread through hematologic as well as lymphatic dissemination, UM was believed to only metastasize hematogenously[44]. The lymphatic endothelial cells were reported to secrete chemokines such as chemokine (C-C motif) ligand 21 (CCL21) and stroma cell derived factor-1 (SDF-1) which could stimulate the chemotaxisviathe respective receptors C-C chemokine receptor 7 (CCR7) and leucine aminopeptidase 3 (LAP3) on tumor cells[45-46]. Besides, integrin α4β1 expressed on lymphatic vessels was also confirmed to play an essential role in the cancer-associated lymphangiogenesis through binding the corresponding ligands such as vascular cell adhesion molecule-1 (VCAM-1), fibronectin 1 (FN1)[47-48]. Because the lymphatic dissemination was not estimated to be involved in the metastasis of UM, we conject that the expression of CCR7, LAP3, VCAM-1 and FN1 might be lower expressed in UM when compared with CM. Supporting this, the DEGs’ list showed that CCR7 (logFC=-2.378070086), LAP3 (logFC=-1.11), VCAM-1 (logFC=-1.63) and FN1 (logFC=-4.63) were all significantly lower expressed in UM. In addition, we also checked the expression ofVEGFCandVEGFDin the DEGs’ list because of the established involvement ofVEGFC/Dinduced lymphangiogenesis in tumor metastasis[49]. WhileVEGFCandVEGFDwere not presented in the DEGs, we observed thatVEGFAwas lower expressed in UM with a logFC of -1.69 (i.e.significantly higher expressed in CM). Basing on a study in mouse, Björndahlet al[50]and colleagues confirmed that theVEGFAinduced lymphangiogenesis was independent from theVEGFC/Dpathway. Thus, further studies are encouraged to examine the potential role ofVEGFAin the lymph angiogenesis of CM.
Liver Tropism of the Metastatic UMThough CM has no metastatic propensity for the liver, metastatic UM has an obvious unexplained liver tropism. Previous studies of UM have shown that the increased expression of Met gene in the primary tumors would promote the liver metastasis[51]. It was estimated that the liver propensity occurred because of the high HGF expression in the liver cell membrane surface. The activation of Met by binding hepatocyte growth factor (HGF) would lead to a series of downstream reactions which resulted in tumor cell proliferation and progression[52]. Our DEGs’ results confirmed the relatively higher expression of Met in UM than in CM (logFC=2.04). Besides, Krügeret al[53]reported that the inhibition of matrix metalloproteinases (MMPs) would increase the expression level of HGF in the liver, thus promote the metastasis formation. In agreement with this, 13 MMP mRNAs in the DEGs were lower expressed in UM than in CM.
Moreover, basing on a study on UM, Laurentet al[54]have reported that the high expression of PTP4A3 could be seen as a predictor for liver tropism. Correspondingly, our study has proved that the PTP4A3 mRNA was significantly higher expressed in UM than in CM (logFC=1.91).
In summary, the comparison between CM and UM from multiple perspectives presented a comprehensive illustration which provides us a better understanding of these two tumors and new insights for finding better treatment strategies.
ACKNOWLEDGEMENTS
Foundations:Supported by the China Scholarship Council (CSC) Program (No.201708080023; No.201708080104); Deutsche Forschungsgemeinschaft and Open Access Publishing Fund of University of Tübingen.
Conflicts of Interest: Zhang Q,None;Lin ZN,None;Chen
J,None;Zheng WX,None.
 International Journal of Ophthalmology2021年1期
- International Journal of Ophthalmology的其它文章
- Response of L V Prasad Eye Institute to COVID-19 outbreak in India: experience at its tertiary eye care centre and adoption to its Eye Health Pyramid
- Preliminary studies of constructing a tissue-engineered lamellar corneal graft by culturing mesenchymal stem cells onto decellularized corneal matrix
- Therapeutic potential of Rho-associated kinase inhibitor Y27632 in corneal endothelial dysfunction: an in vitro and in vivo study
- Changes of matrix metalloproteinases in the stroma after corneal cross-linking in rabbits
- Eあects of quercetin on diabetic retinopathy and its association with NLRP3 inflammasome and autophagy
- RNA interference targeting NOX4 protects visual function in an experimental model of retinal detachment by alleviating blood-retinal barrier damage