
Dynamic contrast-enhanced magnetic resonance imaging and diffusion-weighted imaging in the activity staging of terminal ileum Crohn's disease
2020-12-11 07:09YinChenWuZeBinXiaoXueHuaLinXianYingZhengDaiRongCaoZhongShuaiZhang
World Journal of Gastroenterology 2020年39期
Yin-Chen Wu, Ze-Bin Xiao, Xue-Hua Lin, Xian-Ying Zheng, Dai-Rong Cao, Zhong-Shuai Zhang
Abstract
Key Words: Crohn’s disease; Ileum; Magnetic resonance imaging; Diffusion-weighted imaging; Perfusion imaging
INTRODUCTION
Crohn’s disease (CD) is a chronic relapsing inflammatory disease of the whole gastrointestinal tract that commonly involves the terminal ileum with a complicated and unclear pathogenesis[1]. This disease has a high morbidity and disability rate among young adults along with a poor curative rate, and the prognosis leads to a low quality of life[2]. The diagnosis and activity staging of CD located in the terminal ileum are usually difficult due to occult onset, which often leads to delayed clinical treatment. However, this type of CD deserves more attention, because it is more likely to have complications requiring surgery than other types[3,4]. Therefore, an accurate evaluation of the activity of this condition is highly necessary for gastroenterologists to develop a reasonable treatment plan. Currently, the activity of CD is diagnosed according to clinical symptoms and staged by the subjective Crohn’s Disease Activity Index (CDAI) based on symptoms, or the objective Crohn’s Disease Endoscopic Index of Severity (CDEIS) on the basis of endoscopy findings[5]. However, the patients’ symptoms are sometimes nonspecific, and the related evaluation also suffers from the clinicians’ subjectivity. Even endoscopy has some inherent disadvantages, such as the inadequate evaluation of large parts of the small bowel, the risk of procedure-related complications and the low patient acceptance rate due to discomfort during the procedure[6,7].
In contrast, magnetic resonance enterography (MRE), as a non-invasive, nontraumatic and non-ionizing method with high soft-tissue resolution, has been increasingly used for the detection of bowel abnormalities[8,9]. However, this method contributes little to assessing the activity of CD. Conventional Magnetic Resonance Index of Activity (MaRIA) is calculated by multiple embedded formulas by wall thickness, relative contrast enhancement (RCE) and two qualitative variables, edema and ulceration, to identify inactive and active disease[10]. Dynamic contrast-enhanced magnetic resonance imaging (DCE-MRI) has been widely accepted as a tool to monitor disease progression in other organs[11-13]and can provide quantitative perfusion and permeability information on the bowel wall to accurately localize lesions, monitor disease activity and evaluate treatment responses[14-17]. Menyset al[18]proposed grading CD with MRE on the basis of magnetic resonance (MR) contrast enhancement, indicating that DCE-MRI may be useful in grading CD. Diffusion-weighted imaging (DWI), which characterizes the random motion of water molecules within the tissue, has been utilized to detect abnormal small bowel segments in CD[19,20]. Otoet al[21]pointed out that DCE-MRI and DWI could differentiate actively inflamed small bowel segments from normal small bowel segments in CD. Thus, DCE-MRI and DWI are both potentially available methods for evaluating the activity of CD. However, few studies have compared correlations of DCE-MRI and DWI with endoscopic findings and CD inflammatory indices to analyze the value of accurate staging CD using these two methods. Moreover, to the best of our knowledge, comprehensive comparisons of the diagnostic performance obtained from single or combined use of DCE-MRI and DWI and these two methods with MaRIA in assessing CD activity staging has not been reported.
Therefore, the purpose of this study was to investigate the diagnostic performance of quantitative parameters derived from DCE-MRI and DWI, the combination of both and MaRIA in staging CD using comprehensive assessment of CDAI and CDEIS by gastroenterologist as the reference standard.
MATERIALS AND METHODS
Patients and preparation
The institutional review board of our hospital approved this retrospective study, and the requirement for patient informed consent was waived because of the retrospective nature of this study. From September 2018 to July 2019, 48 patients (32 males and 16 females, mean age 33.8 ± 14.6 years) were included in this study. The inclusion criteria were as follows: (1) Clinically proven CD involving the terminal ileum (confirmed uniformly by clinical characteristics, medical history and endoscopic histopathology performed within 1 wk before MRE); (2) No treatment between MRE and endoscopy; and (3) Availability of CDAI and CDEIS evaluations (CDAI and CDEIS scores were provided by the gastroenterologists with at least 7 years of experience). The exclusion criteria were as follows: (1) Insufficient MR image quality and (2) Affected bowel walls in the colon segments. On endoscopy, CD appeared as patchy segmental inflammation, cobblestone appearance, worsening friability and ulceration, erosion, edema, and pseudopolyp formation. The sampling sites for endoscopic histopathological examination were the tissue around ulceration and erosion and some normal tissue as a comparison. According to the CDAI and CDEIS values, the enrolled patients were divided into three groups: Remission group (CDAI < 151, CDEIS < 3), mild group (CDAI 151-219, CDEIS 3-8), and moderate-severe group (CDAI > 219, CDEIS > 8).
10月26日-27日,受中等强度冷空气影响,我国大部自西向东将出现一次大风降温及降水过程,气温将下降4℃-8℃,局地降温可达10℃;长江以北大部地区还将伴有4-6级偏北风;此外,内蒙古东北部、东北地区中北部有雨夹雪或雪,东北地区南部有中到大雨。26日,江南大部、华南西部、西南地区东部等地有中到大雨,局地暴雨。
The magnetic resonance imaging (MRI) examinations were performed after the patients fasted for 8 h. Twenty-four hours before the examination, the patients orally took 10 g Senna leaf mixed with 2000 mL water to clean the bowel. Approximately 1 h and 30 min before the examination, 1500 mL of 137.5 mOsm/L mannitol solution mixed with water was ingested to distend the bowels (150 mL per time in 5-min intervals). Ten minutes before the examination, 20 mg of raceanisodamine hydrochloride was slowly injected to prevent intestinal peristalsis.
MRI protocols
The MRI examinations were performed in a 3T MRI scanner (Magnetom Skyra; Siemens) with the patient in a supine position using a multichannel phased-array body coil covering the whole abdomen and pelvis. Before the scan, a bellyband was wrapped around the patient’s abdomen to reduce the motion artefacts. The MRI protocol included conventional static MRE sequences and DCE-MRI sequences. First, static MRE was applied: Coronal and axial 2D fat-suppressed T2-weighted half-Fourier acquisition single-shot turbo spin echo, two axial T2-weighted True FISP (Trufi) sequences with and without fat saturation, DWI (b = 50/800), and unenhanced 3D fat-suppressed T1-weighted volumetric interpolated breath hold examination (3DVIBE). After the intravenous administration of a gadolinium-based contrast medium (0.1 mL/kg bodyweight of gadobenate dimeglumine, MultiHance, Bracco Diagnostics) at an injection rate of 2 mL/s followed by a subsequent injection of the same amount of normal saline, the Twist VIBE-based DCE sequence was continuously applied followed by the coronal and axial T1-weighted Dixon sequence 3 min after administration. The detailed parameters of the MRI protocol are given in Table 1.
Image analyses
The conventional MRE was independently reviewed by two radiologists with 7 years and 10 years of experience in abdominal imaging, respectively. For each patient, the two radiologists identified the inflammatory and normal small bowel. The standards of CD were as follows: (1) Mural segmental thickening (> 3 mm); (2) Distinct abnormal mural hyperenhancement; (3) High signal in the wall on T2-weighted and DWI scans; (4) Adjacent fat stranding and enlarged lymph nodes (> 5 mm in shortest diameter); (5) Penetrating disease (sinus tract, fistula or abscess); and (6) The comb sign (prominent vasa recta)[22]. Based on the conventional MRE and subsequent postcontrast images, the normal-appearing and abnormal segments and locations were defined for further analysis by another gastrointestinal radiologist with 28 years of experience.
MaRIA was calculated for the terminal ileum segment using the following formula[10]: MaRIA = 1.5 × wall thickness (mm) + 0.02 × RCE + 5 × edema + 10 × ulceration (1); RCE was calculated according to: RCE = (WSIpost-enhancement- WSIpre-enhancement)/WSIpre-enhancement× 100 × SDnoisepre-enhancement/SDnoisepost-enhancement(2); where SDnoisepre-enhancementis the average of three standard deviations (SDs) of the signal intensity measured outside of the body before enhancement, and SDnoisepost-enhancementis the same result after enhancement.
The DCE-MRI data were processed using commercially available software (Tissue 4D, Syngo.via; Siemens Healthcare, Erlangen, Germany) to calculate the corresponding parameters using the Tofts model. Specifically, first, a volume of interest (VOI) that contained both normal tissue and the lesion in the terminal ileum was selected on the DCE-MRI. Then, the concentration curve of the VOI was calculated according to the two-compartment Tofts model. This post-processing perfusion model describes the distribution of gadodiamide after injection and predicts a change in the contrast concentration in the tissue as a function of time,C(t), as follows[23]:dC(t)/dt=Ktrans× (Cp(t)-C(t)/υe) (3); where Ktrans(min-1) is the transfer constant from the intravascular to extravascular extracellular space (EES), Veis the EES volume, and Cp(t) is the arterial input function (AIF). Kep, the wash-out constant, is equal to the Ktransdivided by Ve.
Three concentration curves with different AIF and the value of Chi2 of each were provided by the software. The AIF with the minimum of Chi2 was chosen for the subsequent operation. As for the analysis of DCE-MRI parameters, the two radiologists independently and manually delineated two regions of interest (ROIs) (range 39-177 mm2) among the VOI on the normal ileal loop (NIL) and two ROIs (range 15-47 mm2) on the inflamed terminal ileum (ITI) with caution to avoid the image artifacts. All radiologists were blinded to the CDEIS and CDAI score. Then, the Ktrans, Kepand Vewere calculated and the measurements from two radiologists was averaged as the final results for the NIL and ITI. The ADCs were also calculated from the walls of the NIL and ITI. ADC measurements were performed by the same two observers on the same workstation with diffusion analysis software. ITI results were obtained from the area with the brightest signal on the DWI image. Because two DCEMRI and ADC values were calculated for the NIL and ITI in each patient, the mean values were defined as the final results for each patient.
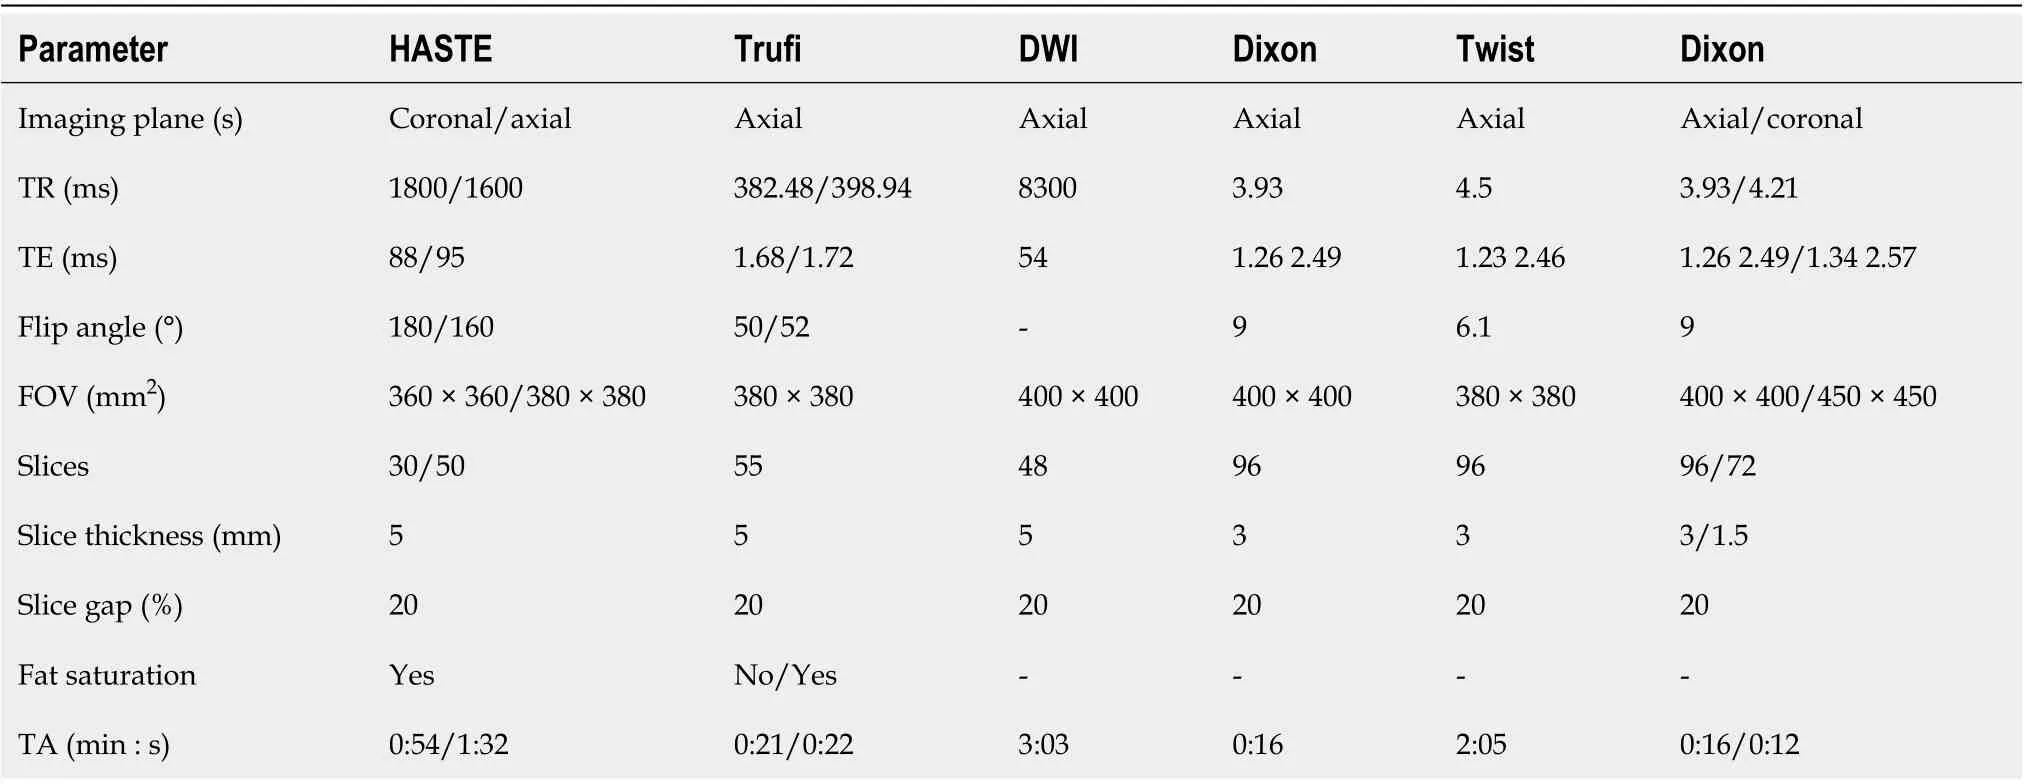
Table 1 Magnetic resonance enterography acquisition parameters
Statistical analysis
Statistical analysis was performed with SPSS software (version 19.0, IBM). The quantitative DCE-MRI parameters, the Ktrans, Kepand Ve, the ADC and MaRIA were tested with the Kolmogorov-Smirnov test for normality and then with the Levene test for variance homogeneity. The quantitative parameters were compared between the terminal ileum and normal ileal loop using the pairedt-test. If the data followed a normal distribution, the parameters were tested by the LSD-test (data obey homogeneity of variance) or Dunnett's T3-test (data do not obey homogeneity of variance) for differences between groups; otherwise, the Kruskal-Wallis test was used. The Spearman test was used to analyze correlations among MaRIA and the parameters and the CDAI and CDEIS scores. Binary logistic regression was used to calculate predicted probability of the Ktrans, Kep, Ve, and ADC. For multi-factors, Ktrans+ Kep+ Veand Ktrans+ Kep+ Ve+ ADC, the beta coefficients were calculated through logistic regression analysis. The scores of both were calculated according to: Ktrans+ Kep+ Vescore = -16.123 -191.557 × Ktrans+ 55.077 × Kep+ 66.178 × Ve(4); Ktrans+ Kep+ Ve+ ADC score = -27.228 -106.268 × Ktrans+ 34.849 × Kep+ 37.763 × Ve+ 27.749 × ADC (5).
Finally, receiver operating characteristic (ROC) curves of the Ktrans, Kep, Ve, ADC, MaRIA, Ktrans+ Kep+ Vescore, and Ktrans+ Kep+ Ve+ ADC score, including the area under the curve (AUC), were analyzed to evaluate the ability to differentiate inactive CD (CD remission) from active CD (mild to severe CD). The threshold was determined by calculating the ROC curves followed by Youden’s index [1- (sensitivity + specificity)]. Statistical significance was defined asP< 0.05. The AUCs were compared using the DeLong test.
Intra- and interclass agreement for the Ktrans, Kep, Ve, ADC and MaRIA in ROI-related measurements was evaluated by Bland-Altman analysis. Statistical significance was defined asP< 0.05.
RESULTS
Forty-eight patients underwent conventional MRE and DCE-MRI, and forty-eight groups of processible images were acquired. Of these, 27.08% were in the remission group (13/48), 41.67% were in the mild activity group (20/48), and 31.25% were in the moderate-severe activity group (15/48).
On DCE-MRI, the Ktrans, Kepand Vein the ITI were higher than those in the NIL (allP< 0.001), and the ADC derived from DWI in the ITI was lower than that in the NIL (allP< 0.001). The differences in the Ktrans, Kep, Veand ADC in the ITI between the groups were statistically significant (allP< 0.001). The Ktrans, Kep,Veand MaRIA were lower in the CD remission group than those in the active CD group, and the ADC was higher in the CD remission group. As the activity increased, the Ktrans, Kep, Veand MaRIA also increased, and the Ktransincreased most among the three groups in three DCE-MRI parameters (Table 2, Figure 1-3).
As shown in Table 3 and Figure 4, the Kepshowed the strongest positive correlations with the CDAI (r= 0.870,P< 0.001), followed by the Ktrans(r= 0.866,P< 0.001) and Ve(r= 0.858,P< 0.001) in DCE-MRI parameters. The ADC showed a strong negative correlation with the CDAI (r= -0.857,P< 0.001). The Ve, Kep, and Ktransshowed moderate positive correlations with the CDEIS (r= 0.571, 0.567, and 0.563,P< 0.001, respectively). The ADC showed a moderate negative correlation with the CDEIS (r= -0.536,P< 0.001). MaRIA showed strong positive correlations with both CDAI (r= 0.890,P< 0.001) and CDEIS (r= 0.842,P< 0.001).
The ROC analysis results of the ability of MaRIA, these parameters and combined parameters, including Ktrans+ Kep+ Veand Ktrans+ Kep+ Ve+ ADC, to differentiate inactive CD from active CD are shown in Table 4. The ROC analysis showed that MaRIA had higher accuracy for differentiating inactive CD from active CD than the individual parameters. The ADC had the highest accuracy for differentiation among the individual parameters, with an AUC of 0.89, and the threshold value was 1.6 × 10⁻³mm2/s. With only DCE-MRI parameters, when the threshold Vevalue was 0.29, differentiation with a sensitivity of 0.83 and a specificity of 0.85 was achieved. By combining the Ktrans, Kepand Ve, the diagnostic performance for detecting remission was improved, with an AUC of 0.80, while the highest AUC was observed when DCEMRI and DWI parameters were combined (Ktrans+ Kep+ Ve+ ADC), with an observed AUC of 0.95 (Figure 5). This combination of parameters had the highest AUC among the combination of DCE-MRI parameters, the ADC and MaRIA alone (allP< 0.05).
The intraclass correlation coefficient was 0.957 for the Ktrans, 0.855 for the Kep, 0.973 for the Ve, 0.941 for the ADC and 0.971 for MaRIA between the two observers (allP< 0.001). The interclass correlation coefficient between observer 1’s first and second measurements was 0.902 for the Ktrans, 0.740 for the Kep, 0.961 for the Ve, and 0.913 for the ADC (allP< 0.001). The interclass correlation coefficient between observer 2’s first and second measurements was 0.922 for the Ktrans, 0.772 for the Kep, 0.957 for the Ve, and 0.900 for the ADC (allP< 0.001). The results of the Bland-Altman analysis for the intraclass and interclass coefficients are shown in Figure 6.
DISCUSSION
Our study demonstrated that the ITI was able to be differentiated from the NIL in patients with CD in the terminal ileum, and that the inflammatory activity could be graded quantitively based on both DCE-MRI and DWI parameters. When the ADC and DCE-MRI parameters were combined, the assessment performance was improved and better than MaRIA.
The ITI had restricted diffusion compared with the NIL as indicated by lower ADC values, which is supported by previous studies, and one of the other important and well-known findings of CD is increased small intestinal wall enhancement[24-26]. As a direct method to evaluate enhancement, the DCE-MRI parameters were derived from a two-compartment general kinetic model to describe the contrast agent distribution after a bolus injection[23]. Ktransand Kep, the transfer constant and the wash-out constant, are proportional to the capillary permeability and blood flow, and Ve, the plasma volume fraction, is proportional to the leakage space. We found that the ITI had higher Ktrans, Kepand Vevalues than those of the NIL, indicating that an inflamed bowel wall could be detected by visual assessments of gadolinium enhancement and abnormal angiogenesis as a feature of the pathogenesis of CD, which manifested as increased blood perfusion and permeability reflected by higher parameters[27-29]. Although this finding is similar to that of previous studies, some results have striking magnitude differences. In Oto’s study[15], the Ktransvalues of the NIL and the ITI were 0.18 to 0.36 min-1and 0.31 to 0.92 min-1, respectively, while the Ktransvalues in this study were 0.07 min-1and 0.12 min-1, respectively. One reason for this discrepancy may be patient preparation before the examination. In Oto’s study[15], a total volume of 1350 mL was administered orally over the course of 45 min before scanning, which may lead to nonuniform and incomplete distension of the bowel segments due to inhomogeneous drinking. This may have an impact on the perfusion measurements as it can lead to an oversized ROI or lower signal in the collapsed small bowel loops[30,31]. Another possible reason for the discrepancy between the two studies lies in the different sample sizes. A total of two ROIs were selected for each segment in the perfusion images of Oto’s study[15], and the mean value was defined, which may lead to a smaller simple size and a higher Ktrans.
Compared to previous studies, our study focused on the correlations of DCE-MRIand DWI parameters with CD activity estimated by more objective indices to grade CD-the CDAI, CDEIS and Kep, the latter of which is a new parameter. We found that the Ktrans, Kepand Veall showed positive correlations with the CDAI and CDEIS, while the ADC decreased when the CDAI and CDEIS increased. The major determinants of the Ktransand Kepare blood flow and the capillary permeability surface area[32]. The high Ktransand Kepin the ITI are likely related to an increase in blood flow but also the vascularity supplying the inflamed tissue[33]. Microvessel density and the vascular endothelial growth factor levels are increased in the mucosal extracts of patients with inflammatory bowel disease compared with those in the normal mucosa[34,35]. Increased vascularity and edema correlating with the level of inflammation in the bowel was shownin vitroby angiography of the resected bowel specimens of patients with inflammatory bowel disease[15]. The basement membrane of the neovasculature is incomplete, which causes a wide endothelial cell gap. The contrast agent molecules can easily pass through and wash out[7]. We believe that both the microvessel density and imperfections increase with disease chronicity, which leads to increased Ktransand Kepvalues in the inflamed bowel wall. The positive correlations of Ktransand Kepwith CDAI and CDEIS also confirm this. Verepresents the volume of extracted contrast agent. Microvascular alterations and continuous epithelial damage to the mucosa have a pathogenic role in initiation and maintenance throughout the whole course of CD. In the advanced stage of inflammation, increases in vascular perfusion, vasospasm, and incomplete neovasculature lead to increased EES contrast agent leakage[21]. This applies to Ve, which has a positive association with CDAI and CDEIS. The negative correlation of ADC and CDAI as well as CDEIS was also observed in this study. The reduced water diffusion is likely related to infiltration of inflammatory cells, dilated lymphatic channels and granuloma development during the CD process[15]and is also associated with fibrosis in the bowel wall[36]. Although, the histologic degrees of bowel fibrosis and inflammation cannot be accurately detected by DWI during the diseasecourse, it is certain that water diffusion restriction develops progressively with the increased activity of CD[36]. These results indicate the potential clinical utility of these quantitative parameters for non-invasive assessment of CD severity. We noted that the correlations between these parameters and CDAI were slightly stronger than those with CDEIS, which may be related to the objectivity of the indicators. CDAI is a subjective assessment of the patients and may overestimate the severity of CD.
艺兴公司房屋租赁业务内部控制制度,存在设计上的缺陷,租赁合同签署以及备案过程中,缺乏审核监管有关规定。在运行风险上,业务部门按月上报核算房屋租赁情况,没有得到很好的执行;稽核也没有发挥应有的作用。

Table 2 Parameters in the normal ileal loop and the inflamed terminal ileum in different staging of Crohn’s disease

Table 3 Correlations of parameters of inflamed terminal ileum with Crohn’s Disease Activity Index and Crohn’s Disease Endoscopic Index of Severity in different staging of Crohn’s disease

Table 4 Receiver operating characteristic analysis results for the parameters for differentiating inactive Crohn’s disease from active Crohn’s disease
MaRIA, an external validation of conventional MRE was used to predict the disease activity of CD due to different clinical treatment plans for inactive CD and active CD in previous studies[10]. This conclusion was verified in our study. However, it is worth noting that the calculation is complicated and inconvenient due to multiple embedded formulas, especially the RCE formula. Moreover, MaRIA included two qualitative parameters, edema and ulceration. Therefore, our study focused on the improved performance of quantitative techniques to differentiate inactive CD from active CD, and further refine its staging. The combination of DCE-MRI and DWI parameters, Ktrans+ Kep+ Ve+ ADC, exhibited a higher AUC for differentiation between inactive CD and active CD compared to individual parameters and MaRIA. It is suggested that the combination of parameters enhances contrast between inactive and active segments, which indicates the potential value of combined DCE-MRI and DWI parameters for grading CD. Even though a variety of clinical scoring tools have been used to monitor the disease activity, there is no established gold standard to provide pathologic information of inactive or active CD[37]. The main advantage of DCE-MRI and DWI in addition to conventional MRE is the ability to provide quantitative, spatially encoded information on entire small bowel segments, which provides more possibility for the objective assessment of CD activity to determine therapies.
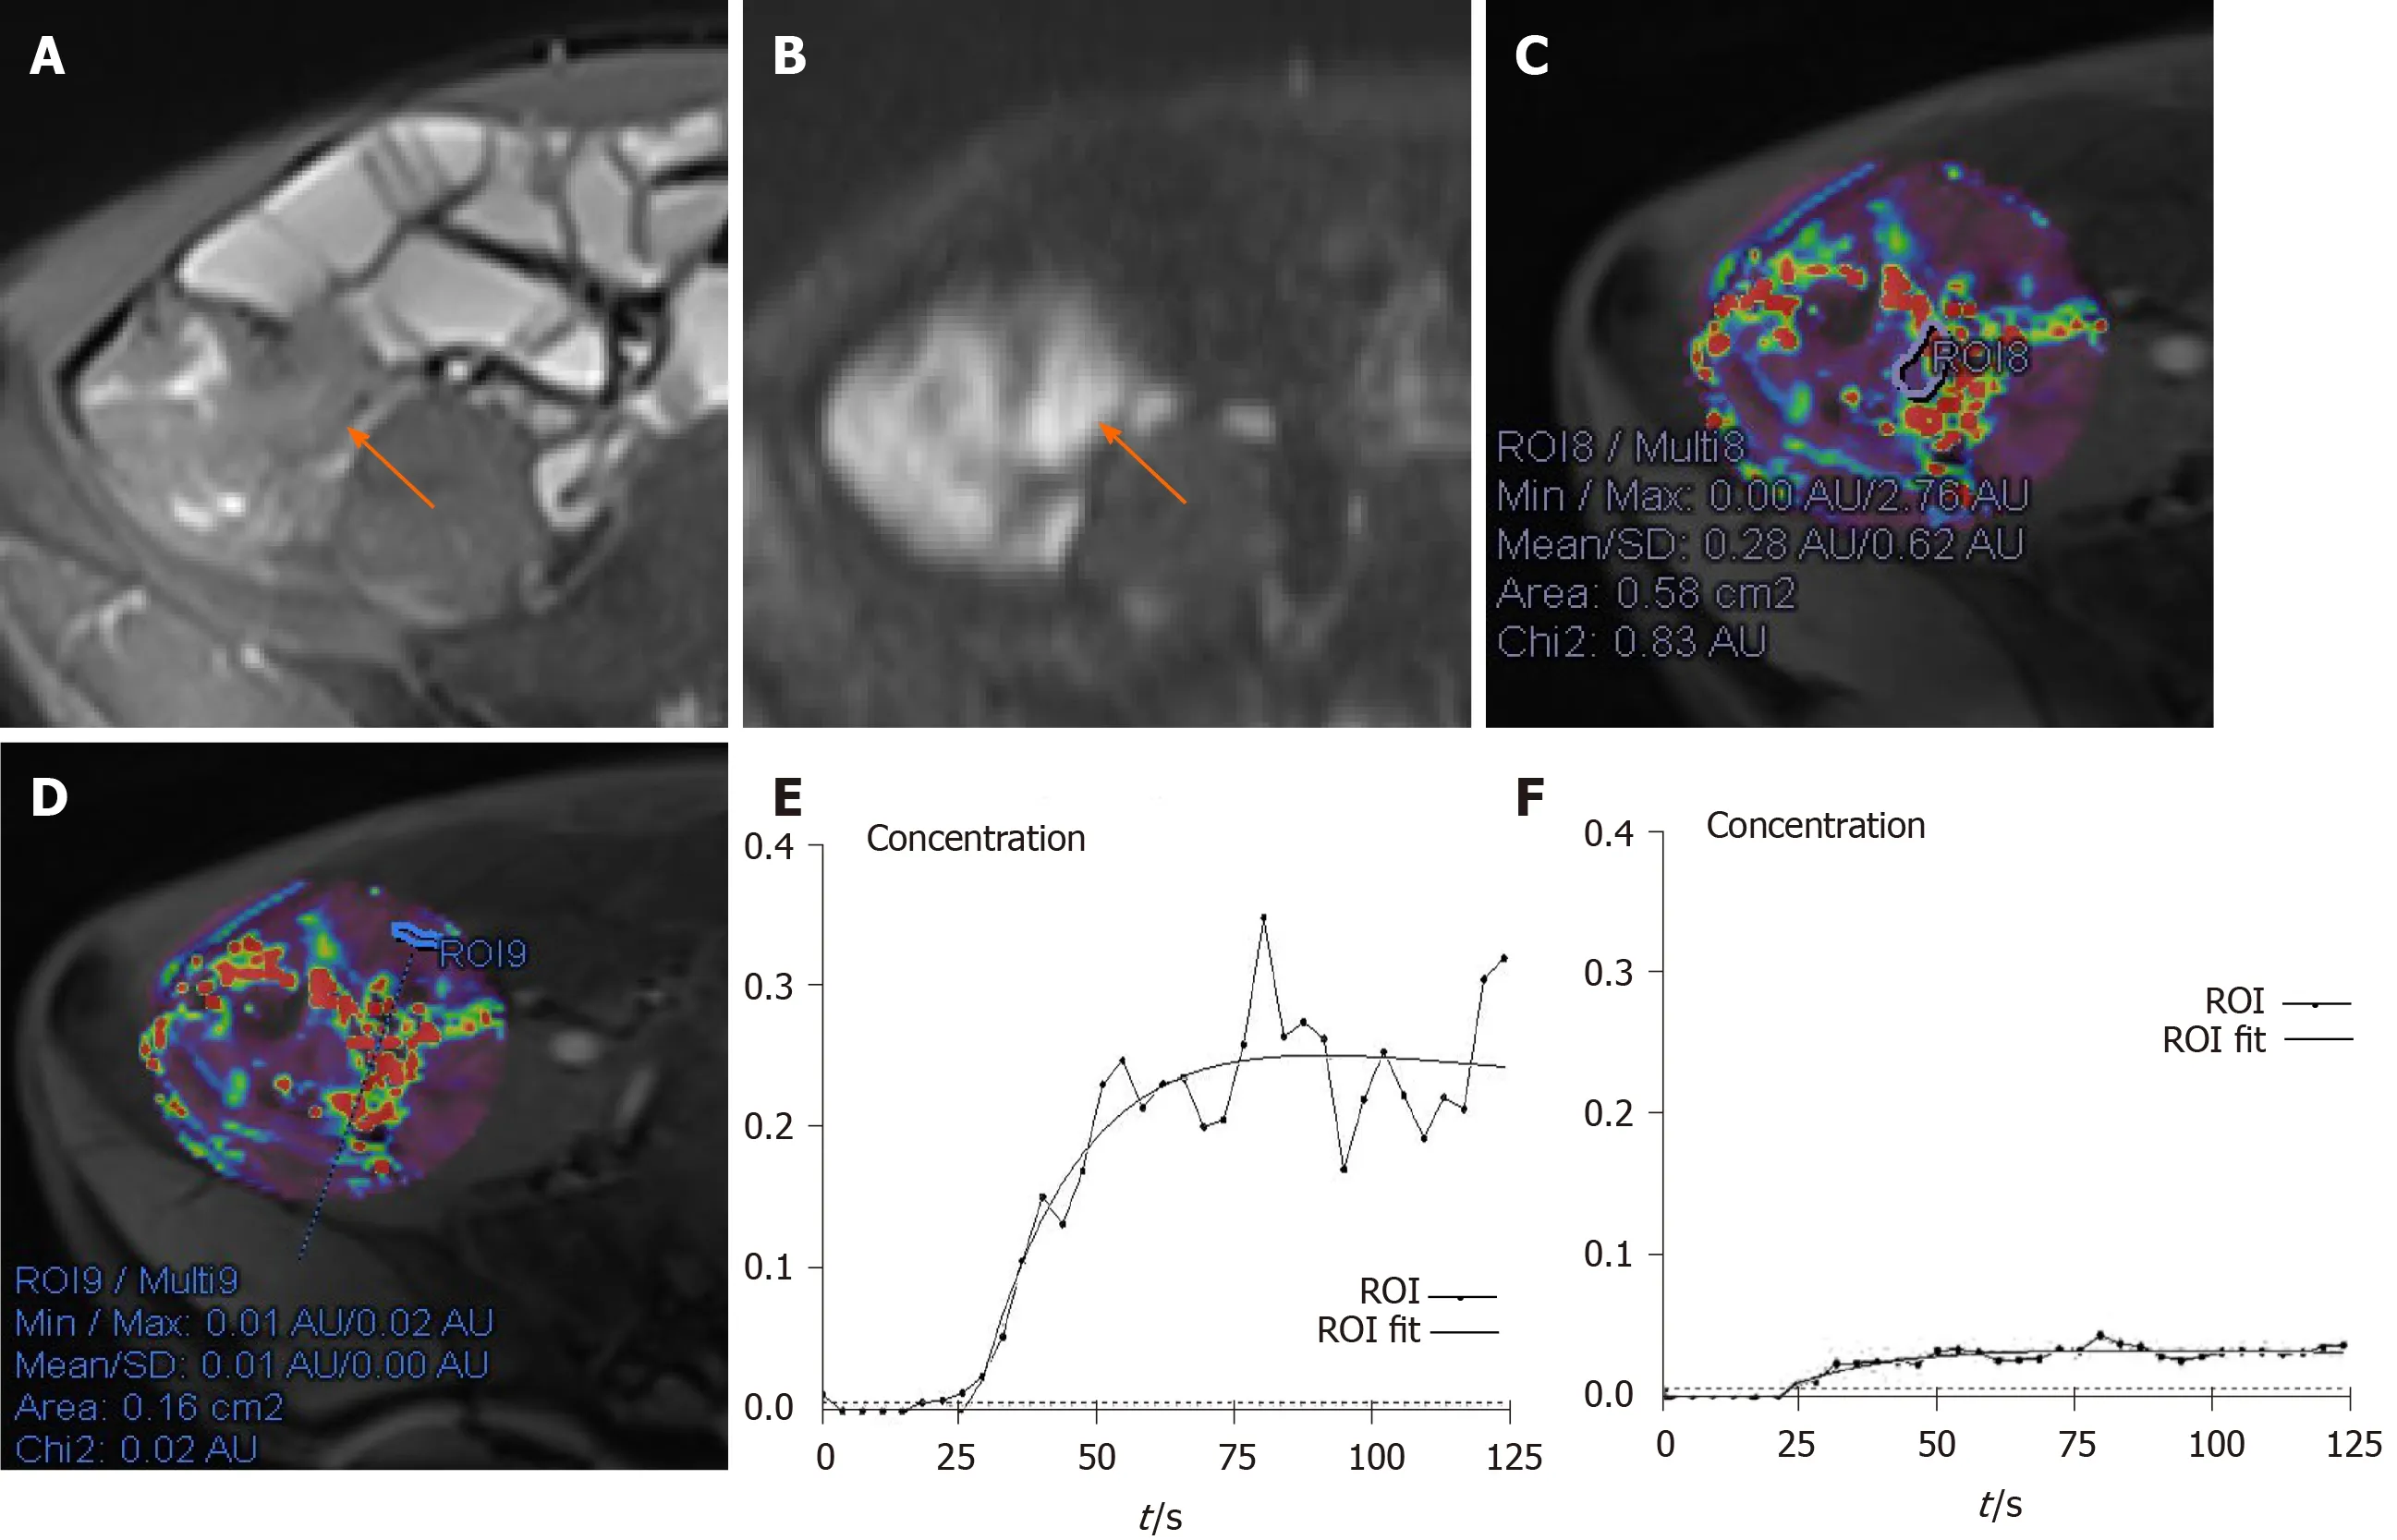
Figure 1 A 41-year-old male with moderate active Crohn’s disease in the terminal ileum and a Crohn’s Disease Activity Index of 267 and Crohn’s Disease Endoscopic Index of Severity of 12. A: Terminal ileum demonstrates wall thickening and increased signal on axial T2-weighted image; B: Terminal ileum wall has a high signal. Axial diffusion-weighted imaging image (b = 800 s/mm2) demonstrates high signal (arrow) in the same bowel segment. Region of interest (ROI) for the inflammatory bowel wall shows that apparent diffusion coefficient = 1.11×10⁻³ mm2/s; C: ROI for the inflammatory bowel wall shows that Ktrans = 0.10 min-1 (Kep = 0.87 min-1, Ve = 0.11); D: In contrast, ROI of the normal appearing ileal loop shows that Ktrans = 0.01 min-1 (Kep = 0.80 min-1, Ve = 0.02); E: The contrast concentration curve of inflammatory bowel is plotted as ROI (line with circle) and fitted with the model (line); F: The contrast concentration curve of normal loop is plotted as ROI (line with circle) and fitted with the model (line). ROI: Region of interest.
Our study has several limitations. First, motion artefacts (e.g., respiration, peristalsis) and compromised signal-to-noise ratios are inevitable. Expansion of the lumen with oral contrast and antiperistaltic agents before the examination helped reduce the motion artefacts. However, the errors due to motion in the estimation of these parameters were not investigated in this study. In addition, the ROI was manually delineated. We cannot completely exclude the possibility of a partial volume of alvine gas or perienteric tissues, especially in the normal bowel walls. However, the use of the mean parameter values reduces the influence of this partial volume effect to some degree.
CONCLUSION
In conclusion, the ITI in CD patients exhibits increased perfusion and restricted diffusion with activity progression. DCE-MRI and DWI parameters, particularly when used in combination, are promising for assessing CD activity. Such data may provide further insight into therapeutic monitoring of the disease.
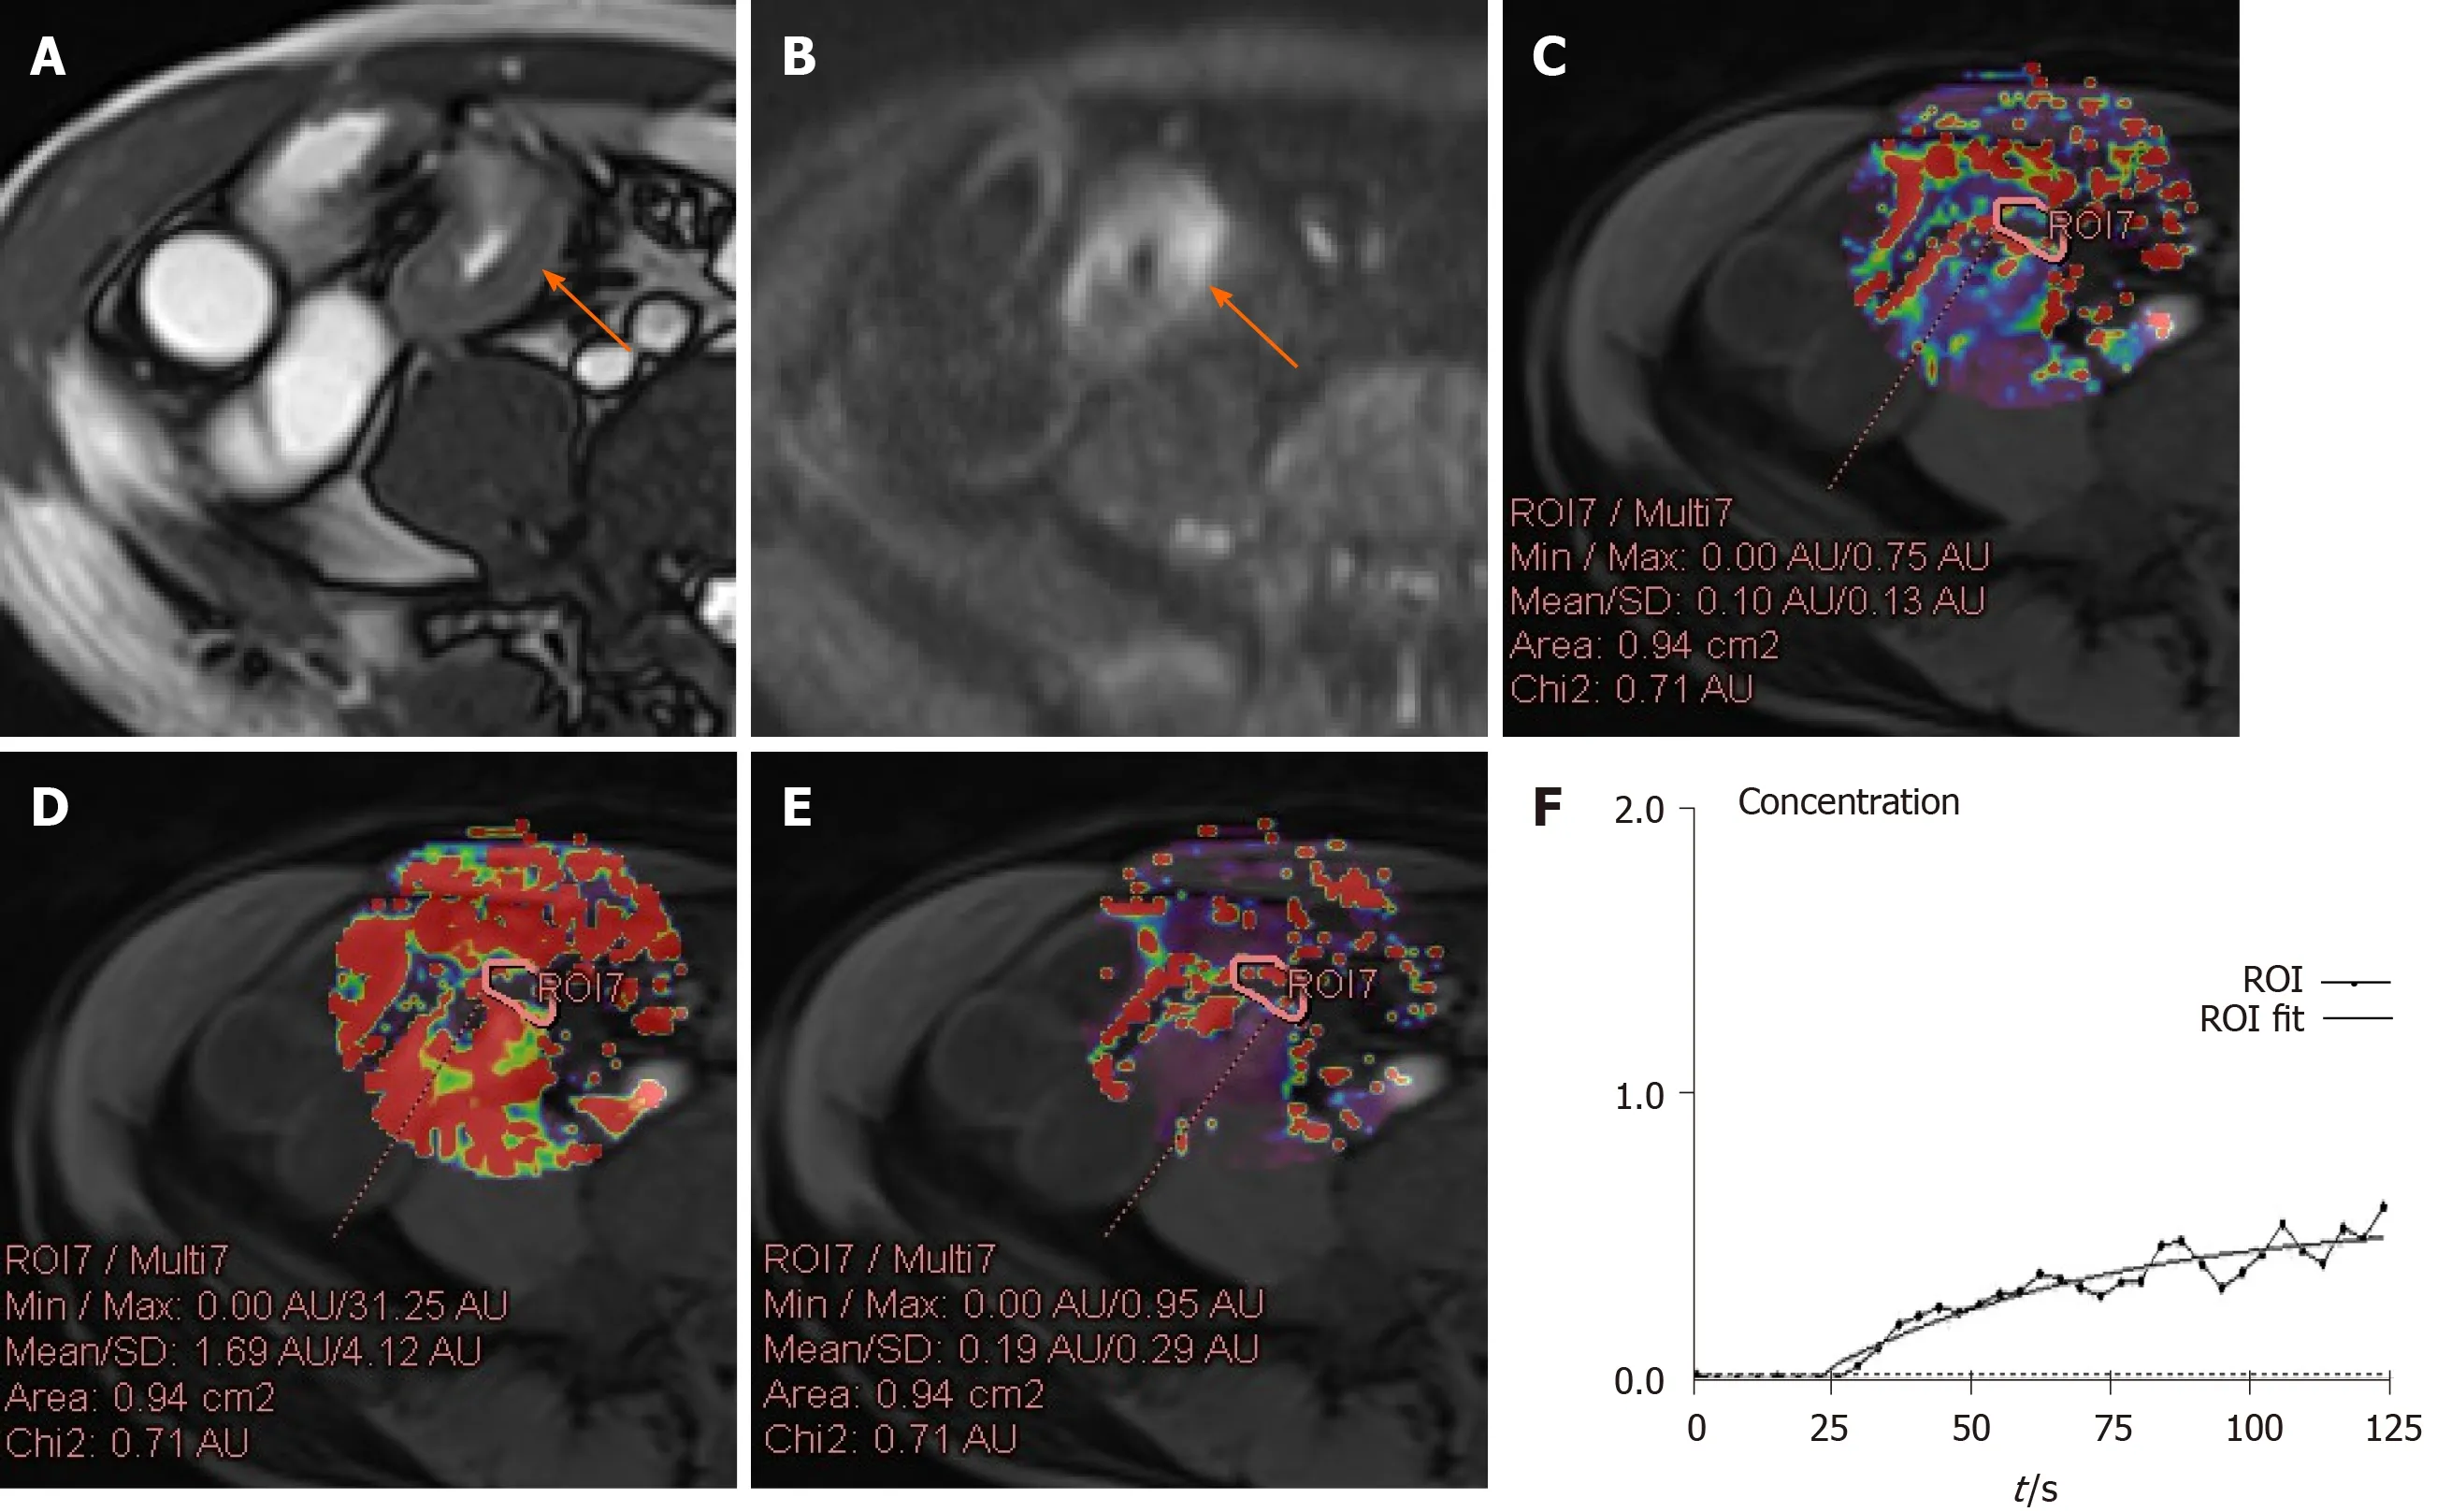
Figure 2 A 42-year-old male with remission of Crohn’s disease in the terminal ileum and a Crohn’s Disease Activity Index of 108 and Crohn’s Disease Endoscopic Index of Severity of 2. A: Axial T2-weighted image shows mural thickening and hyperintensity in the terminal ileum (arrow); B: Axial diffusion-weighted imaging image (b = 800 s/mm2) demonstrates high signal (arrow) in the same bowel segment. Regions of interest (ROI) for the inflammatory bowel wall shows that apparent diffusion coefficient = 1.89×10⁻³ mm2/s; C: Ktrans map is obtained through the relevant phase. The perfusion parameters of the ROI placed in the terminal ileum is calculated by TCM (Ktrans = 0.18 min-1); D: Kep map is obtained through the relevant phase. The Kep of the ROI placed is 0.98 min-1; E: Ve map is obtained through the relevant phase. The Ve of the ROI placed is 0.19; F: The contrast concentration curve is plotted as ROI (line with circle) and fitted with the model (line). ROI: Region of interest.

Figure 3 The Ktrans, Kep, Ve and apparent diffusion coefficient among the three groups. A: Bar charts show increasing Ktrans, between the normal ileal loop (NIL) and the inflamed terminal ileum (ITI) and pairwise comparisons of them is different (all P < 0.001); B: Kep between the NIL and the ITI is different (all P < 0.001); C: Ve between the NIL and the ITI is different (all P < 0.001); D: Apparent diffusion coefficient between the NIL and the ITI is different (all P < 0.001). Furthermore, increasing Ktrans, Kep and Ve are shown with activity of CD in remission, mild and moderate-severe CD while decreasing apparent diffusion coefficients are shown (all P < 0.001). aP indicate difference with P < 0.001. NIL: Normal ileal loop; ITI: Inflamed terminal ileum.

Figure 4 Correlations of inflamed terminal ileum with Crohn’s Disease Activity Index and Crohn’s Disease Endoscopic Index of Severity in Crohn’s disease. A and C: Scatterplots show positive correlation of Ktrans, Kep and Ve and negative correlation of apparent diffusion coefficient in inflamed terminal ileum of Crohn’s disease patients with Crohn’s Disease Activity Index score; B and D: Positive correlation of Ktrans, Kep and Ve and negative correlation of apparent diffusion coefficient in inflamed terminal ileum of Crohn’s disease patients with Crohn’s Disease Endoscopic Index of Severity score. CDAI: Crohn’s Disease Activity Index; CDEIS: Crohn’s Disease Endoscopic Index of Severity; ADC: Apparent diffusion coefficient.

Figure 5 Receiver operating characteristic curve analysis. Receiver operating characteristic curve analysis shows high accuracy of Ktrans (areas under the curve [AUC] = 0.76), Ve (AUC = 0.78), Kep (AUC = 0.68), apparent diffusion coefficient (AUC = 0.89) and Magnetic Resonance Index of Activity (AUC = 0.91) for differentiating inactive from active Crohn’s disease. Accuracy of combining the Ktrans, Kep and Ve (AUC = 0.80) is higher than the individual dynamic contrast-enhanced magnetic resonance imaging parameters. The highest AUC is observed when combining dynamic contrast-enhanced magnetic resonance imaging and diffusionweighted imaging parameters (AUC = 0.95). ROC: Receiver operating characteristic; ADC: Apparent diffusion coefficient; DCE-MRI: Dynamic contrast-enhanced magnetic resonance imaging; MaRIA: Magnetic Resonance Index of Activity.

Figure 6 Bland-Altman analysis for the intraclass and interclass coefficients. A: Bland-Altman analysis of the difference between the two observers’ average results for Ktrans; B: Bland-Altman analysis of the difference between the two observers’ average results for apparent diffusion coefficient; C: Bland-Altman analysis of the difference between the two observers’ average results for Kep. ADC: Apparent diffusion coefficient; SD: Standard deviation.
ARTICLE HIGHLIGHTS
Research motivation
The parameters of DCE-MRI, based on the two-compartment Tofts model (TCM), and apparent diffusion coefficient (ADC), based on DWI, allow for the evaluation of perfusion and permeability in bowel walls. Few studies have analyzed the diagnostic performance of the combination of DCE-MRI and DWI in staging CD activity.
Research objectives
The purpose of this study was to investigate the performance of DCE-MRI and DWI as non-invasive methods in staging CD activity with CDAI and CDEIS as references.
Research methods
Forty-eight patients with CD were analyzed retrospectively. According to the CDAI and CDEIS values, the patients were divided into the remission group (CDAI < 151, CDEIS < 3), mild group (CDAI 151-219, CDEIS 3-8), and moderate-severe group (CDAI > 219, CDEIS > 8). Ktrans, Kep, and Vewere calculated from DCE-MRI and ADC was obtained from DWI. MaRIA was calculated from magnetic resonance enterography. The parameters were compared between normal ileal loop (NIL) and inflamed terminal ileum (ITI). Correlations between these parameters, MaRIA with CDAI, CDEIS were examined. Receiver operating characteristic curve analyses were used to evaluate the performance of these parameters in staging CD activity.
Research results
In the present study, the results showed that higher Ktrans(0.07 ± 0.04vs0.01 ± 0.01), Kep(0.24 ± 0.11vs0.15 ± 0.05) and Ve(0.27 ± 0.07vs0.08 ± 0.03) but lower ADC (1.41 ± 0.26vs2.41 ± 0.30) values were displayed in the ITI than in the NIL (allP< 0.001). The parameters of DCE-MRI and MaRIA increased in CD progression, whereas the ADC decreased. The Ktrans, Kep, Veand MaRIA showed positive correlations with the CDAI (r= 0.866 for Ktrans, 0.870 for Kep, 0.858 for Ve, 0.890 for MaRIA, allP< 0.001) and CDEIS (r= 0.563 for Ktrans, 0.567 for Kep, 0.571 for Ve, 0.842 for MaRIA, allP< 0.001), while the ADC showed negative correlations with the CDAI (r= -0.857,P< 0.001) and CDEIS (r= -0.536,P< 0.001). The areas under the curve (AUC) for the individual values ranged from 0.68 to 0.91 for differentiating inactive CD (CD remission) from active CD (mild to severe CD) and MaRIA had the higher AUC of 0.91. The AUC when combining the Ktrans, Kepand Vewas 0.80, while the AUC when combining DCE-MRI parameters and ADC was the highest (AUC = 0.95).
Research conclusions
DCE-MRI and DWI are non-invasive methods with good performances in staging the activity of terminal ileum CD. When they were used in combination, the value was greater, which can supplement clinical diagnosis and monitoring.
Research perspectives
DCE-MRI and DWI are valuable tools in staging CD with CDAI and CDEIS as the references. The correlation of the DCE-MRI and DWI parameters between pathological activity status of CD, and the performance of DCE-MRI and DWI in monitoring the treatment effect of CD should be explored in the future.
猜你喜欢
农业灾害研究(2022年1期)2022-05-07
中华养生保健(2021年18期)2021-02-13
环球时报(2018-03-14)2018-03-14
克拉玛依学刊(2011年2期)2011-04-16
 World Journal of Gastroenterology2020年39期
- World Journal of Gastroenterology的其它文章
- Use of artificial intelligence in improving adenoma detection rate during colonoscopy: Might both endoscopists and pathologists be further helped
- Real-world treatment attrition rates in advanced esophagogastric cancer
- Metastatic pattern in esophageal and gastric cancer: Influenced by site and histology
- Relationships of early esophageal cancer with human papillomavirus and alcohol metabolism
- Clinical assessment and management of liver fibrosis in non-alcoholic fatty liver disease
- Enteroscopy in children and adults with inflammatory bowel disease