PIV analysis and high-speed photographic observation of cavitating flow field behind circular multi-orifice plates
Zhi-ping Guo , Xi-hun Sun , Zhi-yong Dong *
a College of Hydro-Science and Engineering, Taiyuan University of Technology, Taiyuan 030024, China
b Department of Transportation Engineering, Shanxi Conservancy Technical Institute, Yuncheng 044004, China
c College of Civil Engineering and Architecture, Zhejiang University of Technology, Hangzhou 310014, China
Abstract Based on a self-developed hydrodynamic cavitation device with different geometric parameters for circular multi-orifice plates, turbulence characteristics of cavitating flow behind multi-orifice plates, including the effects of orifice number and orifice layout on longitudinal velocity,turbulence intensity, and Reynolds stress, were measured with the particle image velocimetry (PIV) technique. Flow regimes of the cavitating flow were also observed with high-speed photography.The experimental results showed the following:(1)high-velocity multiple cavitating jets occurred behind the multi-orifice plates,and the cavitating flow fields were characterized by topological structures;(2)the longitudinal velocity at each cross-section exhibited a sawtooth-like distribution close to the multi-orifice plate,and each sawtooth indicated one jet issuing from one orifice; (3) there were similar magnitudes and forms for the longitudinal and vertical turbulence intensities at the same cross-section; (4) the variation in amplitude of Reynolds stress increased with an increase in orifice number; and (5) the cavitation clouds in the flow fields became denser with the increase in orifice number, and the clouds generated by the staggered layout of orifices were greater in number than those generated by the checkerboard-type one for the same orifice number.The experimental results can be used to analyze the mechanism of killing pathogenic microorganisms through hydrodynamic cavitation.
© 2020 Hohai University. Production and hosting by Elsevier B.V. This is an open access article under the CC BY-NC-ND license (http://creativecommons.org/licenses/by-nc-nd/4.0/).
Keywords: Cavitating flow; Circular multi-orifice plate; PIV technique; High-speed photography; Turbulence characteristics
1. Introduction
Cavitation is defined by the formation,growth,and collapse of a cavitation bubble as well as physical action and chemical reaction due to shock waves and micro-jets.Studies have been conducted in order to prevent cavitation from destroying hydraulic release structures, hydraulic machinery, and ship propellers. Recently, cavitation characteristics have been utilized to remove refractory pollutants in wastewater and to kill pathogenic microorganisms in raw water. In the treatment of refractory wastewater, the applicability of hydrodynamic cavitation reactors with circular multi-orifice plates for degradation of rhodamine B in dyeing wastewater has been examined, with results indicating that hydrodynamic cavitation is indeed much more efficient than acoustic cavitation(Sivakumar and Pandit, 2002). A combination of hydrodynamic cavitation induced by a whistle reactor with an advanced Fenton process (AFP) has been utilized for the treatment of actual industrial wastewater (Chakinala et al.,2008). Effects of various factors such as pressure, H2O2concentration, and initial concentration of the industrial wastewater samples on the extent of mineralization have been analyzed. Degradations of hydrophilic and hydrophobic pollutants by hydrodynamic cavitation due to combinations of circular, triangular, and square multi-orifice plates with Venturi tubes have been experimentally investigated, in terms of the effects of orifice size and orifice number on the degradation rates (Dong and Hu, 2013; Dong and Zhang,2015; Dong and Xiao, 2016). Also, degradation of p-nitrophenol by hydrodynamic cavitation due to square multi-orifice plates has been examined by Bing et al. (2013). In drinking water disinfection, shear stress and disruption of micro-jets due to the collapse of the cavitation bubble in bacterial cells have been examined by Joyce et al. (2003). Disruption of cavitation in bacteria cells has occurred as a result of shock waves due to the collapse of the cavitation bubble and cavitating flow turbulence caused by fluctuation of the cavitation bubble(Jyoti and Pandit,2004).Effects of different cavitation chambers and various operational parameters on the inactivation rate ofEscherichia coli(E. coli) have been experimentally studied (Arrojo et al., 2008). The effect of hydrodynamic cavitation due to various valve openings of the hydraulic pump on zooplankton in seawater has been reported.Shock waves generated from collapse of the cavitation bubble were not the only zooplankton disruption, and turbulence shearing action also contributed considerably to the disruption(Sawant et al., 2008). Operating time and nozzle pressure of the hydrodynamic cavitation device have been studied to analyze the effects on inactivation rate ofE. coliand total coliforms(Assis et al.,2013).Hydrodynamic cavitation due to circular, triangular, and square multi-orifice plates has been used to killE.coliin raw water(Zhang et al.,2016;Liu et al.,2016; Chen et al., 2016).
The researchers mentioned above focused on the effects of orifice size, orifice number, orifice layout, and initial concentration ofE. colion the killing rate. In addition, pathogenic microorganisms in raw water killed by hydrodynamic cavitation with square and triangular multi-orifice plates have been experimentally investigated(Dong and Zhao,2018a;Liu et al., 2018).E. coliand pathogenic microorganisms inactivated by Venturi-type hydrodynamic cavitation with different throat lengths have been studied(Geng et al.,2017;Dong and Qin, 2018). Experimental study of pathogenic microorganisms in raw water disinfected by hydrodynamic cavitation in Venturi tubes with varying diffusion angles has been conducted (Wang et al.,2017). Further experimental study of pathogenic microorganisms in raw water killed by hydrodynamic cavitation due to combinations of circular,square, and triangular multi-orifice plates with Venturi tubes having different geometric parameters have been conducted by Yang et al. (2018), Dong et al. (2019), and Li et al. (2019).
The studies mentioned above show that cavitating flow characteristics directly affect the degradation rate of refractory pollutants in wastewater and the killing rate of pathogenic microorganisms in raw water. Hydraulic characteristics of triangular and square multi-orifice plates were reported by Dong et al. (2013a, 2013b). Pressure characteristics of the hydrodynamic cavitation reactor due to the combination of Venturi tubes with triangular multi-orifice plates were described by Zhang et al.(2018).Turbulence characteristics of cavitating flow fields behind square multi-orifice plates were observed through the particle image velocimetry (PIV) technique (Dong and Zhao, 2018b). This study aimed at experimentally studying turbulence characteristics of cavitating flow due to circular multi-orifice plates so as to gain further understanding of the mechanisms of killing pathogenic microorganisms through hydrodynamic cavitation.
2. Experimental facility and methodology

Fig. 1. Experimental setup of circular multi-orifice plate and test apparatus.

Fig. 2. Circular multi-orifice plates.
This experimental study was carried out in a self-developed hydrodynamic cavitation device (as shown in Fig. 1) in the Hydraulics Laboratory at Zhejiang University of Technology in China.The experimental setup was a looped system,which consisted mainly of hydraulic pumps, inner and outer tanks, a working section, rotor flowmeters, pressure gauges, and a pipeline. The main pipeline was used to generate hydrodynamic cavitation,and the branch pipeline was used to regulate the flow rate. The working section mainly contained five different circular multi-orifice plates, as shown in Fig. 2. The area of total orifices remained the same for each plate.Orifice numbersn= 9, 16, 25, and 64 had corresponding orifice diameters ofd= 5.0, 3.8, 3.0, and 1.9 mm. Checkerboard-type and staggered orifice layouts were designed for 25-orifice plates and an orifice velocityUof 14.70-26.65 m/s. The other orifice layouts were all of the checkerboard type. The working section of hydrodynamic cavitation due to multiorifice plates was a square cross-section, with a height ofH= 50 mm, and a length ofL= 200 mm. The perspex viewing windows were designed at two sides with the top in the working section. The DANTEC 3D PIV system was used in the experiment.Considering that turbulent flow is a random process,500 groups of instantaneous flow fields verified by the pre-experiment were taken to analyze the time-averaged and turbulence characteristics of the flow fields. Similarly, a PIV experimental study on the flow characteristics upstream of a floating intake in nonlinear stratified ambient conditions was carried out (Gao et al., 2019). The measurement domain was 50 mm×200 mm,with an acquisition frequency of 15 Hz and a time interval of 0.02 s for instantaneous velocity.A flow field profile flashed by a laser light sheet source was located at the top centerline in the working section. Flow regimes of cavitating flows behind circular multi-orifice plates were observed with PHOTRON FASTCAM APX-RS high-speed photography, with a frame rate of 36 000 fps, and an exposure duration of 1/36 000 s. Thex-axis was along the longitudinal direction,and they-axis was along the vertical direction.Eight cross-sections,1-1 to 8-8,were taken along the longitudinal direction as shown in Fig. 3 and Table 1.
3. Particle image, velocity vector, velocity contour, and vorticity

Fig.3.Locations of cross-sections 1-1 to 8-8 behind circular multiorifice plate.
Using a nine-orifice checkerboard-type multi-orifice plate and an orifice velocity of 25.73 m/s as an example,the particle image, velocity vector, velocity contour, and vorticity of cavitating flow behind the circular multi-orifice plate observed by the DANTEC 3D PIV system are shown in Fig. 4(a)through (d). Cavitating flow behind the multi-orifice plate is characterized by topological structures. In fact, high-velocity multiple jets occurred after an incoming flow past a multiorifice plate. There existed a converging zone of multiple jets close to the multi-orifice plate. Further downstream,multiple jets mixed and combined into a core zone, and vorticity accumulated to form vortices due to interaction among cavitation bubbles. In Fig. 4(b), the green vector indicates the higher-velocity region, and the blue vector indicates the lower-velocity region.
4. Longitudinal velocity distribution
4.1. Effect of orifice number on velocity distribution
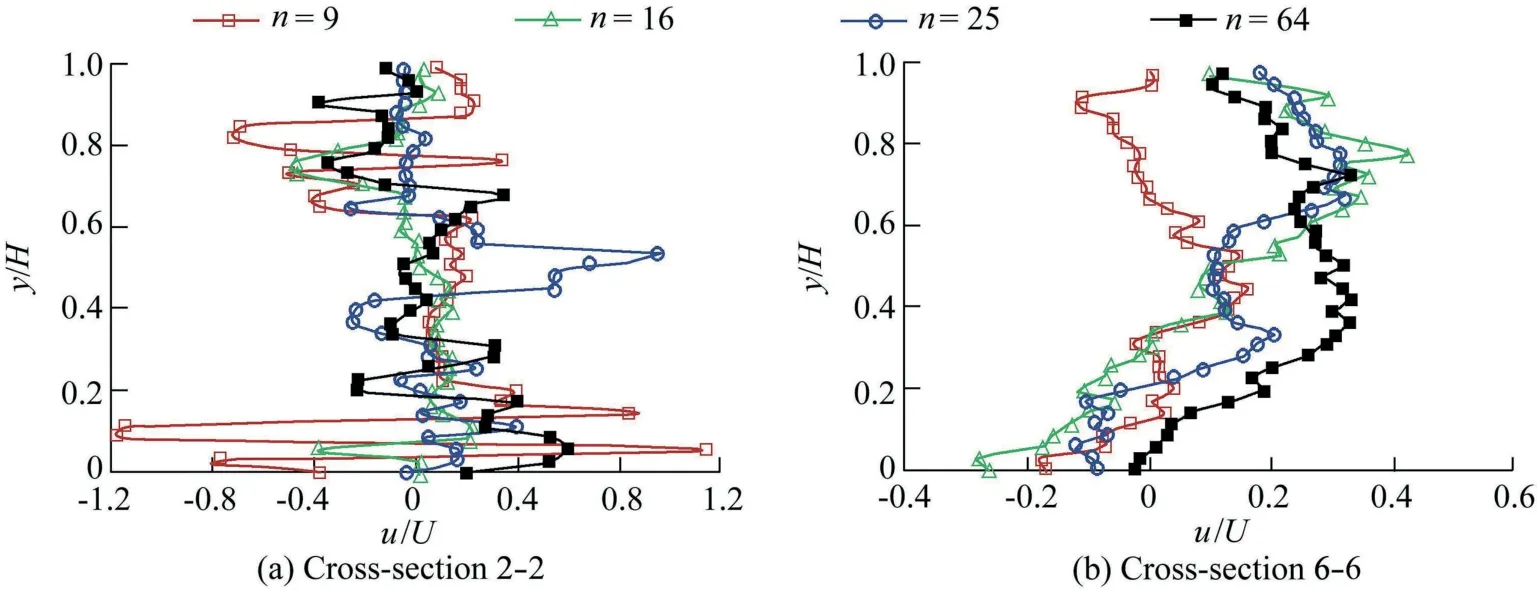
The distribution of the longitudinal velocityubehind the multi-orifice plates is shown in Fig. 5. Each cross-sectional velocity exhibits sawtooth-like distribution close to the multi-orifice plates (see Fig. 5(a)). Each sawtooth represents one jet because multiple jets occurred due to multi-orifice plates. With the increase in downstream distance from the plate, the multiple jets merged to flatten the sawtooth-like distribution due to mixing of inter-jets, and combined jets occurred. The velocity of combined jets increases with the orifice number,as shown in Fig.5(b).The increase in velocity could lower the cavitation number and increase the number of cavitation bubbles, intensifying the shearing effect, thus causing more pathogenic microorganisms and occurrence of cavitation damage, and thereby enhancing the killing rate(Zhang et al., 2016; Liu et al., 2016).
4.2. Effect of orifice layout on velocity distribution
Two multi-orifice plates with different layouts but the same orifice number, i.e., 25-orifice plates with checkerboard-type and staggered layouts, were used to analyze the effect of orifice layout on velocity distribution. The velocity of the staggered layout was overall greater than that of the checkerboard-type layout close to the multi-orifice plates, as shown in Fig. 6(a). In contrast, with an increase in distance from the plate, the velocity for the checkerboard-type layout was greater than that of the staggered layout, as shown in Fig.6(b).Multiple jets were formed by the multi-orifice plates,which could be divided into a converging zone and a combined zone. The former was close to the plates, as the staggered layout enabled multiple jets to generate intense mixing;the latter was far from the plates, as the further mixing multiple jets flattened the velocity distribution for the staggered layout. The shearing effect due to the multiple jets for the staggered layout was stronger than that of the checkerboardtype layout, which resulted in shearing destroying pathogenic microorganisms (Chen et al., 2016; Liu et al., 2018).

Table 1 Distance of each cross-section from multi-orifice plate.

Fig. 4. Particle image, velocity vector, velocity contour, and vorticity behind a circular multi-orifice plate at orifice velocity U = 25.73 m/s.
5. Turbulence intensity
The turbulence level of cavitating flow behind multi-orifice plates can be expressed by turbulence intensity. The longitudinal and vertical turbulence intensitiesTxandTy, corresponding to thexandydirections,can be respectively defined as

whereu′andv′denote the velocity fluctuations along thexandydirections, respectively.
5.1. Comparison between longitudinal and vertical turbulence intensities
A staggered 25-orifice plate and an orifice velocity ofU=27.13 m/s were used.Fig.7(a)and(b)shows that there are similar magnitudes and forms for longitudinal and vertical turbulence intensities at the same cross-section. However, the vertical turbulence intensity close to the plate is weaker than it is far from the plate, as shown in Fig. 7(a). The well-known Poisson equation of pressure fluctuation can be expressed as


Fig. 5. Effect of orifice number on velocity distribution.

Fig. 6. Effect of orifice layout on velocity distribution.
wherep′is the pressure fluctuation;ρ is the density;andare the velocity fluctuations in directionsiandj, respectively;Viis the time-averaged velocity;xiandxjdenote the coordinates in tensor form in directionsiandj,respectively;anddenotes the Reynolds stress in tensor form.
It follows from Eq.(2) that pressure fluctuation in turbulent flow arose from velocity fluctuation, because pressure fluctuation is related to turbulence intensity. This means that an increase in longitudinal or vertical turbulence intensity intensified the cavitation level of flow, which contributed to killing pathogenic microorganisms(Dong and Qin,2018;Liu et al.,2018).
5.2. Effect of orifice number on turbulence intensity
The effect of orifice number on longitudinal turbulence intensity is shown in Fig. 8. It shows that the turbulence of cavitating flow either close to the multi-orifice plate(see crosssection 2-2) or far from the plate (see cross-section 8-8) is intense, and further increases with an increase in orifice number. Formation, growth, and collapse of the cavitation bubble prompt cavitating flow to generate intense turbulence,which means that an increase in orifice number could contribute to killing more pathogenic microorganisms (Zhang et al., 2016; Chen et al., 2016; Liu et al., 2016, 2018).
5.3. Effect of orifice layout on turbulence intensity

Fig. 7. Comparison between longitudinal and vertical turbulence intensities.

Fig. 8. Effect of orifice number on turbulence intensity.
Two 25-orifice plates were used to analyze the effect of orifice layout on longitudinal turbulence intensity,as shown in Fig.9,one with a checkerboard-type layout and the other with a staggered layout. Turbulence intensity of the staggered layout close to the multi-orifice plate, i.e., within the converging zone of multiple jets, is greater than that of the checkerboard-type layout (see cross-section 2-2). Further downstream, there are similar characteristics of turbulence intensity due to formation of a combined zone of multiple jets for staggered and checkerboard-type layouts. Relatively speaking, the killing rate of pathogenic microorganisms was enhanced by the staggered layout of a multi-orifice plate(Zhang et al.,2016;Chen et al.,2016;Liu et al.,2016,2018).
6. Reynolds stress
Reynolds stress τtfor longitudinal and vertical velocity fluctuationsu′andv′of cavitating flow behind multi-orifice plates can be expressed as

Using a non-dimensional form for the equation above with orifice velocityU, we have

where η denotes the non-dimensional Reynolds stress.
6.1. Effect of orifice number on Reynolds stress
As we know,the equation of Reynolds stress can be written as

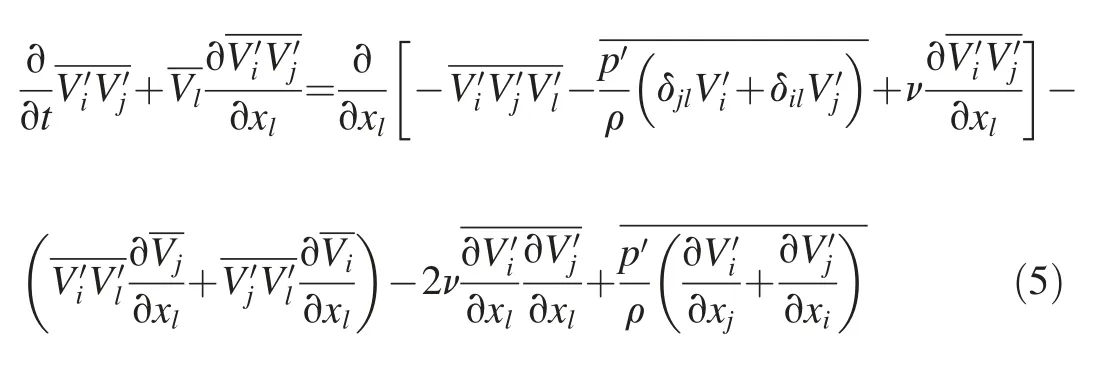
It follows that the variation in Reynolds stress depends upon the comprehensive effects of diffusion, production,dissipation, and stress-strain of turbulent flow. Fig. 10 shows the effect of orifice number on Reynolds stress. The variation in amplitude of Reynolds stress increases roughly with the increase in orifice number. The increase in orifice number could intensify the inter-jet mixing behind multi-orifice plates,thus enhancing the shearing effect due to Reynolds stress,which would contribute to increasing the killing rate of pathogenic microorganisms (Zhang et al., 2016; Chen et al.,2016; Liu et al., 2016, 2018).
6.2. Effect of orifice layout on Reynolds stress
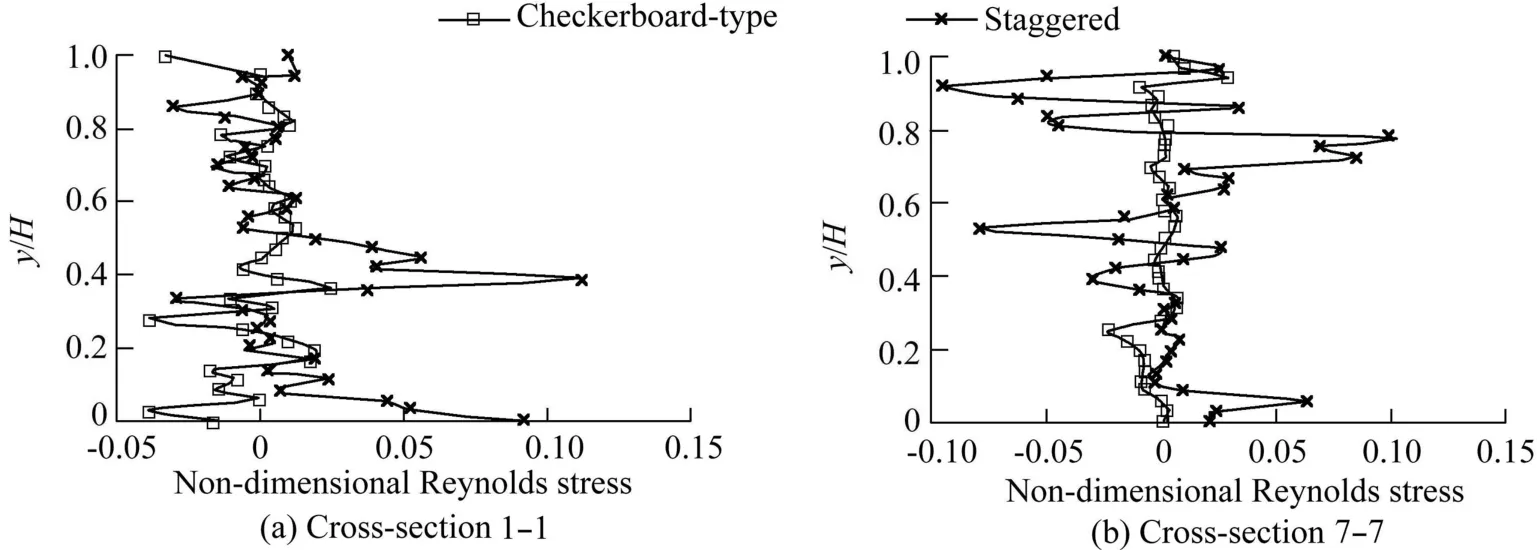
Like characteristics of turbulence intensity, the variation in amplitude of Reynolds stress for the staggered layout close to the multi-orifice plate is greater than that for the checkerboard-type one,as shown in Fig.11(a).Further downstream,the variation in the amplitude for the staggered layout is still greater than that for the checkerboard-type layout,as shown in Fig.11(b).

Fig. 9. Effect of orifice layout on turbulence intensity.
7.High-speed photographic observation of cavitating flow field
Multiple high-velocity jets are formed after flow passes through a multi-orifice plate. Because pressure in the jets is lower than the saturated vapor pressure corresponding to the local water temperature, a cavitation bubble occurs to form cavitating flow. High-speed photographic images of cavitating flows behind the different multi-orifice plates, with a frame size of 512 × 128 pixels, are shown in Fig. 12. It follows from the images that yields of cavitation bubbles were fewer at a lower velocity, and the corresponding cavitation flow field in the high-speed photographic image became dim; a large number of cavitation bubbles were generated to form cavitation clouds at a higher velocity, so the high-speed photographic images were brighter.Under the same conditions, the image in the front of the flow field was brighter, whereas the image in the rear became dimmer, as a result of the collapse of the cavitation bubbles. Cavitation clouds in the flow fields became denser with an increase in orifice number of multi-orifice plates, and the clouds resulting from the staggered layout were greater in number than those resulting from the checkerboard-type layout at the same orifice number.
8. Conclusions
(1) Multiple cavitating jets occurred behind the multiorifice plates, cavitation bubbles were rarer at lower velocity,and bubbles became denser at higher velocity, forming cavitation clouds. Due to interaction among cavitation bubbles,vorticity in the flow field accumulated in different vortices.The cavitating flow fields were characterized by topological structures.
(2) The longitudinal velocity at each cross-section exhibited a sawtooth-like distribution close to the multi-orifice plate,and each sawtooth represented one jet. The multiple jets merged to flatten the sawtooth-like distribution and formed combined jets, which gradually increased with an increase in orifice number. The velocity of the staggered layout was higher than that of the checkerboard-type layout close to the multi-orifice plate. However, with the increase in distance from the plate, the velocity of the checkerboard-type layout was higher than that of the staggered layout.
(3) There were similar magnitudes and forms for the longitudinal and vertical turbulence intensities at the same crosssection. The turbulence of cavitating flow intensified with an increase in orifice number. The characteristics of turbulence intensity for the staggered layout were similar to those for the checkerboard-type layout far from the multi-orifice plate.

Fig. 10. Effect of orifice number on Reynolds stress.

Fig. 11. Effect of orifice layout on Reynolds stress.

Fig. 12. High-speed photographic images of cavitating flows behind different multi-orifice plates (flow direction from left to right).
(4)The variation in amplitude of Reynolds stress increased with an increase in orifice number.The amplitude of Reynolds stress for the staggered layout was greater than that for the checkerboard-type layout either close to a multi-orifice plate or far from the plate.
(5)Cavitation clouds in the flow fields became denser with an increase in orifice number of multi-orifice plates. The clouds resulting from the staggered layout were greater in number than those resulting from the checkerboard-type layout at the same orifice number.
Declaration of competing interest
The authors declare no conflicts of interest.
 Water Science and Engineering2020年2期
- Water Science and Engineering的其它文章
- Hydrological response to climate change and human activities:A case studyof Taihu Basin,China
- Possibilities of urban flood reduction through distributed-scale rainwater harvesting
- Toxic response of aquatic organisms to guide application of artemisinin sustained-release granule algaecide
- Effects of water application intensity of micro-sprinkler irrigation and soil salinity on environment of coastal saline soils
- Responses of river bed evolution to flow-sediment process changes after Three Gorges Project in middle Yangtze River: A case study of Yaojian reach
- Multi-objective reservoir operation using particle swarm optimization with adaptive random inertia weights
