Responses of river bed evolution to flow-sediment process changes after Three Gorges Project in middle Yangtze River: A case study of Yaojian reach
Li-qin Zuo *, Yong-jun Lu Hui-xing Liu Fng-fng Ren Yun-yun Sun
a State Key Laboratory of Hydrology-Water Resources and Hydraulic Engineering, Nanjing Hydraulic Research Institute, Nanjing 210029, China
b Middle Changjiang River Survey Bureau of Hydrology and Water Resources, Wuhan 430010, China
Abstract The Three Gorges Project (TGP) has changed the flow-sediment process in the middle Yangtze River. For navigation purposes, there is an urgent need to study the changes of the river regime over a long-term period and the shoal-channel evolution over different seasons since the completion of the TGP. Based on analysis of the measured data and the results of a two-dimensional mathematical model, the changes of the river regime and river bed evolution in the Yaojian reach downstream of the TGP were studied.Results show that a high sediment transport flux helps to keep the main flow in the North Branch,while a low sediment transport flux helps to keep the main flow in the South Branch.Thus,the main branch will not change in the near future because of the low sediment transport load.In this study,the flow-sediment process adjusted by the TGP was restored to the conditions before the TGP,and the river bed evolution under the adjusted and non-adjusted flow-sediment conditions was calculated. After the completion of the TGP, the reservoir storage accelerated the flood recession process and decreased the erosion by 11.9% under the flow-sediment conditions in 2010, and the deposition in the flood season decreased by 56.4%.
© 2020 Hohai University. Production and hosting by Elsevier B.V. This is an open access article under the CC BY-NC-ND license (http://creativecommons.org/licenses/by-nc-nd/4.0/).
Keywords: River regime; River bed evolution; Flow-sediment process; Three Gorges Project; Yaojian reach; Middle Yangtze River; Navigation channel
1. Introduction
Reservoirs typically have the greatest impacts on rivers of all human activities. According to Graf (1999), there are about 75 000 reservoirs in the USA,with a total storage capacity equal to the sum of the runoff,and their influence on river runoff is far greater than that of climate change. There are also many reservoirs in China, which influence downstream reaches (Dai and Liu, 2013; Gleick, 2009; Yang et al., 2014; Huang et al.,2018). Thus, the effects of reservoirs have attracted much attention from scholars and engineers (Graf, 2006; Kondolf and Swanson, 1993; Lu et al., 2010; Shields et al., 2000; Yan et al.,2019).The construction of reservoirs with substantial regulating ability changes the flow-sediment processes of downstream reaches,further changing the river bed evolution.Dams therefore influence many aspects of human activities, such as navigation,flood control, water supply, and irrigation.
Sediment is usually deposited in reservoirs.As a result,the sediment concentration is below the transport capacity in downstream reaches, leading to the erosion of the river bed and banks (Baxter, 1977). To adapt to the changes of watersediment conditions, the downstream river bed and even the river patterns have to adjust. Therefore, reservoirs change the flow-sediment process and further change the river morphology, including the main stream, river regime, bend curvature, and river pattern (Kondolf and Swanson, 1993;Shields et al., 2000; Surianand Rinaldi, 2003; Wellmeyer et al., 2005). Based on the development of fluvial dynamics and numerical simulation techniques, as well as analysis of measured data,the changes in river morphology with the flowsediment conditions can be studied.
The Three Gorges Project (TGP) is one of the largest reservoirs in the world.It is located at Yichang,the starting point of the middle Yangtze River, defined here as the Yichang to Hukou reach (Fig. 1). The TGP began preliminary water storage in June 2003. It is an annual regulation reservoir (Lu et al., 2006), hardly changing the annual average discharge in the downstream reaches. Many efforts have been made to investigate flow regime and sediment load changes caused by the TGP(Chen et al.,2016;Lai et al.,2016).As the sediment is deposited in the reservoir,the sediment concentration in the downstream reaches greatly decreases (Zhang et al., 2017).According to measured data from hydrological stations from 2003 to 2016, sediment transport in the middle and lower reaches of the Yangtze River decreased by 67%-90%.
Many scholars have studied the erosion and morphological response downstream of the TGP through analysis of measured data or mathematical simulation (Fang et al., 2012;Lu et al., 2006; Xu, 2013; Zhang et al., 2017). Since the completion of the TGP, the downstream reaches have been highly eroded (Xu, 2013). Measured data show that, from October 2002 to October 2010,the total erosion volume in the middle Yangtze River was 979×106m3(Lu and Zhu,2014).The erosion first occurred in the reaches near the dam, and then developed in the downstream reaches. In the Yichang to Chenglingji reach, in the upper middle Yangtze River, the erosion was most serious, with an erosion volume of 625 × 106m3, comprising 65% of the erosion in the middle Yangtze River. According to the current study, long-term and long-distance channel erosion will occur in the downstream reaches in the near future (Xu, 2013).
However,we have a limited scientific understanding of how changes in the flow-sediment process influence the processes of channel adjustments(Lai et al.,2016).Most studies on river bed evolution have focused on final results at the inter-annual scale.Though erosion is the main trend in the middle Yangtze River,deposition also occurs in some areas or in some periods(Fang et al., 2012). Some scholars have studied the influence of the operation of the TGP on discharge and water level changes within one year (Lai et al., 2016; Wang et al., 2013).However, the response of river bed evolution to the annual distribution of the flow-sediment process adjusted by the TGP still needs further study.The most significant reduction of river discharge occurs from mid-or late September to October,after the TGP reaches full storage, producing an earlier and prolonged dry season in the middle Yangtze River. Under natural conditions, sediment is deposited at some shoals during the flood season and is eroded during the flood recession period.If the deposited sediment cannot be eroded during the flood recession period, navigation obstacles will arise. When the flow-sediment process changes, the relation between deposition during the flood season and erosion during the flood recession period will change and cause changes to the waterway conditions. Furthermore, in order to choose a suitable navigation channel in bifurcated reaches,it is necessary to identify the main branch in the future.Thus,responses of river bed evolution have to be known from both macro-and microperspectives.
The Yaojian reach was used for this case study. It is a curved and bifurcated reach in the middle Yangtze River,with serious navigation problems in history. For navigation purposes, based on analysis of the measured data and simulation through a two-dimensional (2D) mathematical model, the changes in the river regime over the long term were analyzed from the macro-perspective, and the river bed evolution over one year was quantitatively studied before and after the completion of the TGP by restoring the flow-sediment process.This study also provides benefits for river protection and utilization, e.g., flood control and water supply.
2. Materials and methods
2.1. Overview of study reach
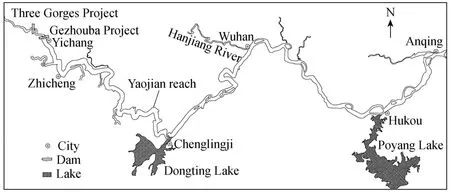
Fig. 1. Sketch of middle Yangtze River and location of Yaojian reach.
The Zhicheng to Chenglingji reach in the middle Yangtze River is called the Jingjiang River. It is characterized by its meandering and curved features and high flood risk. The Yaojian reach is a typical curved and bifurcated reach in the lower Jingjiang River(Fig.2).It is one of the worst navigation channels in the middle Yangtze River and has drawn attention from many scientists and engineers (Zuo et al., 2011). The main stream of the Yaojian reach flows along the right bank from Tashiyi and is then diverted into two streams: the South and North branches, separated by Wuguizhou Island, with the South Branch containing 90% of the flow. The branches meet at Taiheling (Fig. 2). Over history, the river bed has changed greatly, the main branch and the sub-branch have switched frequently, and the deposition and erosion in the shoal and branches have been complex.
2.2. Data collection and methods
A combined method of analysis of the measured data and simulation through a 2D mathematical model was used to study the river regime and the river bed evolution after the completion of the TGP. Measured data included hydrologic data and bathymetric data. In the Yaojian reach, a gauging station called the Jianli Station is operated by the Changjiang Water Resources Commission (CWRC). The daily discharge,water level,suspended sediment concentration,and suspended sediment discharge at the Jianli Station from 1951 to 2016 were collected from the CWRC (http://www.cjh.com.cn). The hydrologic data from the Jianli Station, including the discharge, sediment transport load, and distributions of monthly discharge and sediment concentration, were used to study the flow-sediment processes before and after the completion of the TGP. Accumulated amounts of suspended sediment transport and runoff at the Jianli Station were plotted to analyze the changes of the flow-sediment process.
The bathymetric data were obtained from the Changjiang Waterway Bureau. River regime maps of the Yaojian reach from 1968 to 2014 were obtained. Topographic maps of the Yaojian reach with a scale of 1:10 000 for 2003 to 2008,2010,and 2014 were used to analyze the river bed evolution after the completion of the TGP. Meanwhile, bathymetric data within one year before and after the completion of the TGP were obtained, including topographic maps for April, September,October, and November in 2002 (pre-TGP) and August,September, October, and November in 2007 (post-TGP), and used to analyze the differences between the river bed evolutions in different periods before and after the completion of the TGP. The topographic data were used to construct digital elevation models, and quantitative analyses were conducted.The software Surfer was used to calculate the volume of deposition and erosion from the measured data.
The river bed evolution is affected by many factors,including the boundary conditions, projects, and flowsediment conditions, and the measured bathymetry is a combined result of all factors. Most studies have used measured flow-sediment data to study the effects of the TGP. However,the natural flow-sediment process is a random process,and the measured flow-sediment data are a combined result of the operation of the TGP and random runoff processes. In this study,the measured flow-sediment process was restored to the non-adjusted scenario (pre-TGP) to determine the changes in the flow-sediment process before and after the completion of the TGP. A one-dimensional (1D) mathematical model from Yichang to Datong (middle and lower Yangtze River) was used to restore the flow-sediment process (Liu et al., 2017).The measured inflow to the reservoir was inputted as a boundary condition,and the discharge process was calculated.The 1D mathematical model is not described in more detail here, due to the limited space of this paper, but more details can be found in Liu et al. (2017). The sediment concentration was restored to different scenarios according to the relationships between the sediment transport rate and discharge in different periods.
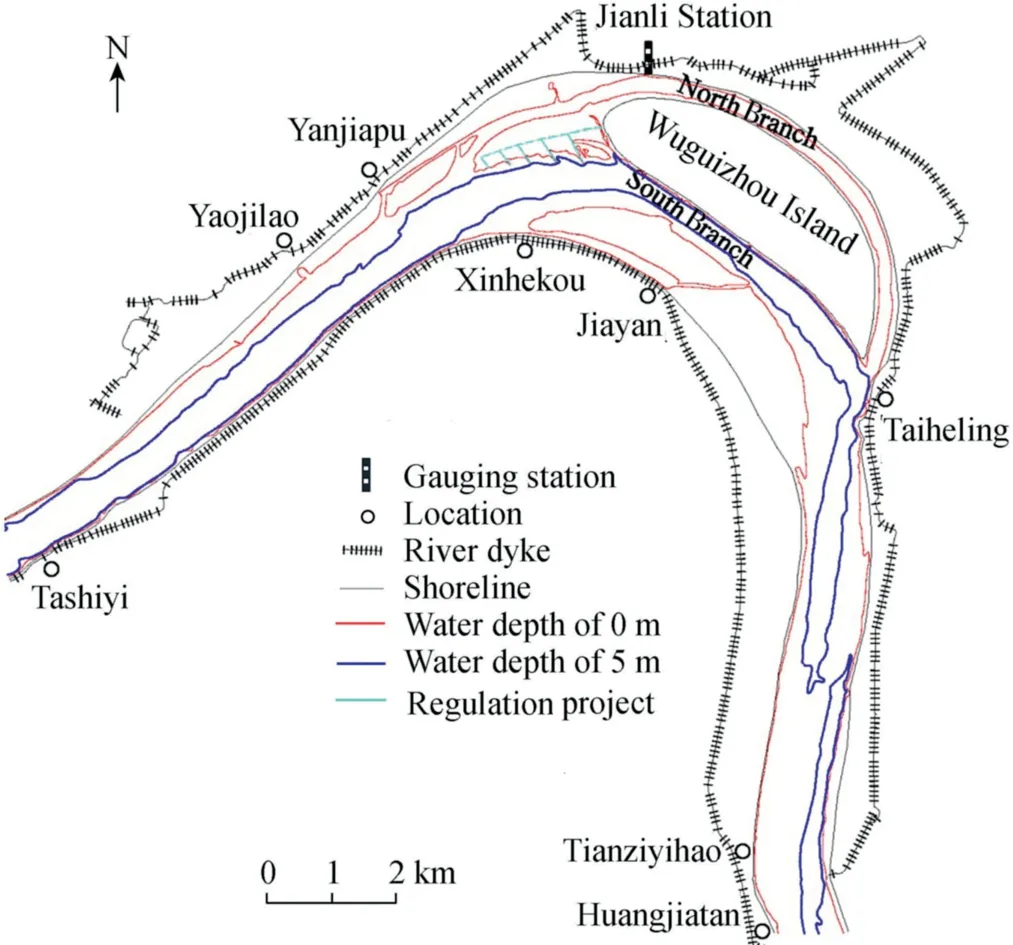
Fig. 2. Sketch of Yaojian reach in February 2014.
2.3. Two-dimensional mathematical model for sediment transport
A 2D model for flow-sediment transport was used to study the change of the river bed evolution through comparison of the erosion and deposition results under the flow-sediment conditions before and after the completion of the TGP. The 2D model was based on the boundary-fitting orthogonal curvilinear coordinate system. Details about the governing equations as well as their numerical solutions can be found in Lu et al. (2005) and Lu et al. (2010).
The computational domain covered a length of 25 km,from Tashiyi to Huangjiatan. There were 165 × 81 grid nodes in this area. After orthogonal calculation, an orthogonal curvilinear grid was obtained,with cells of 30-300 m in length and 15-30 m in width.
Hydrometric data of September 2003; January, July, and October 2006; January and July 2007; and February 2014 were collected. The corresponding discharges were 30 500 m3/s,5 280 m3/s,16 050 m3/s,10 059 m3/s,4 452 m3/s,28 900 m3/s, and 6 412 m3/s, respectively. Water surface lines were verified, and the difference between the calculated water level and measured data was less than 0.1 m. Fig. 3 shows the flow field of the computational domain in January 2006, and also indicates six measurement cross-sections (S1 through S6). Fig. 4 shows the verification of the velocity distribution at cross-sections S1 and S4, with the discharge of 5 280 m3/s. This confirms that the calculated velocities agree with the measured data.Table 1 presents a comparison between the calculated and measured diversion ratios of the North Branch at Wuguizhou Island.These results show that the ratio was relatively small, with values of only 3%-4% in the dry season and less than 10% in the middle of the flood season.Compared with the measured data, the calculated ratio has a difference of less than 1.2%.
Erosion and deposition of the river bed from January 2007 to January 2008 and from January 2010 to February 2014 were verified. Calculation of suspended load and bed material load was conducted for six groups of grain size.The diameter of the bed material load was mainly in the range of 0.125-0.355 mm,and the median diameter was about 0.20 mm. The median diameter of the suspended load was 0.15-0.18 mm in the dry season with the discharges of 4 452-10059 m3/s, and 0.006 mm in the flood season with the discharge of 16 050 m3/s.These results show that the suspended load was relatively coarse in the dry season (Fig. 5).
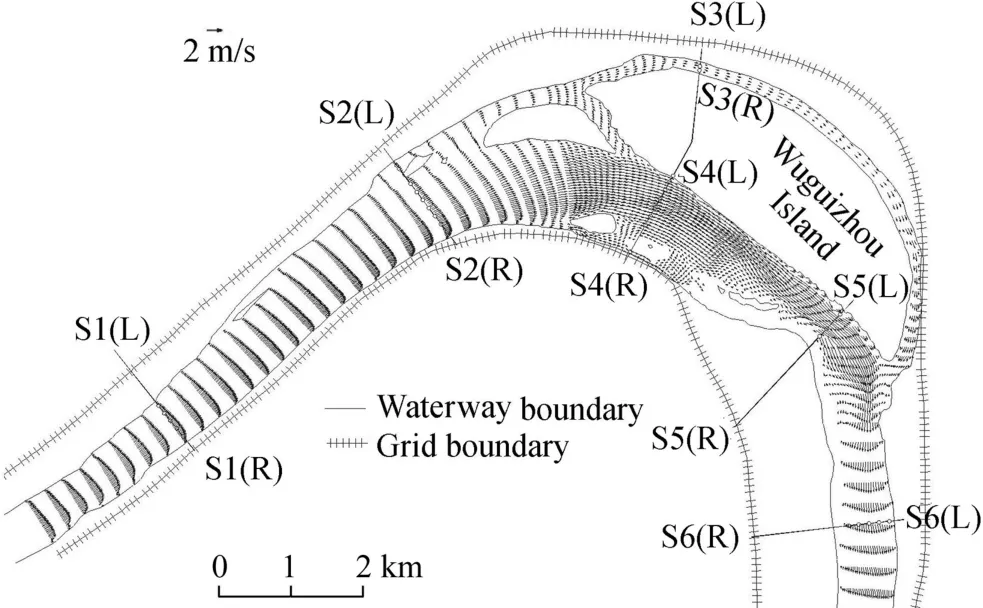
Fig. 3. Flow field of Yaojian reach with discharge of 5 280 m3/s and layout of cross-sections.
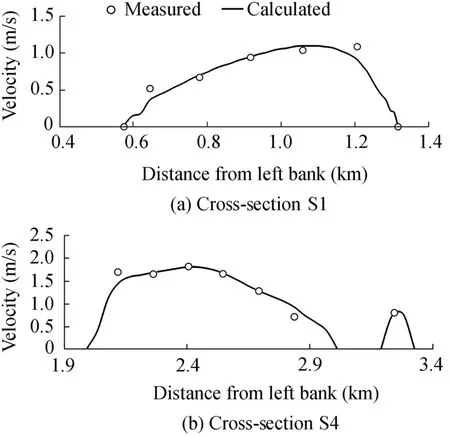
Fig. 4. Verification of velocity distribution with discharge of 5 280 m3/s.
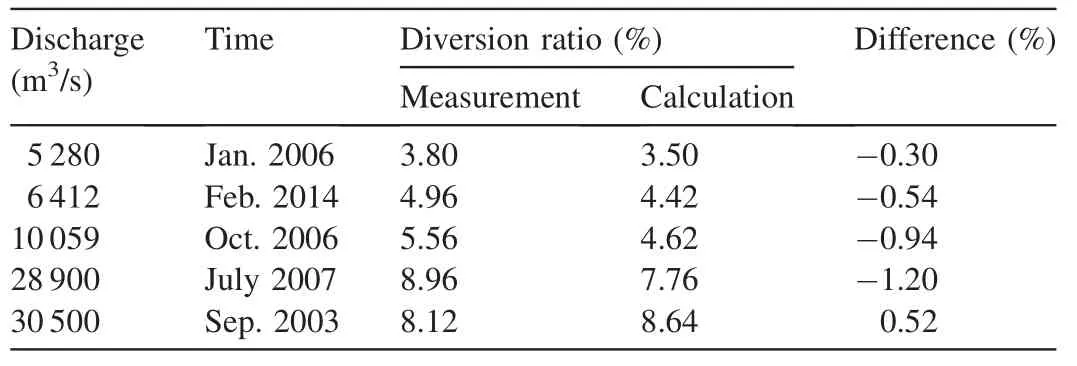
Table 1 Verification of diversion ratio of North Branch at Wuguizhou Island.
Figs. 6 and 7 show the comparison between calculated and measured distributions of erosion and deposition from January 2007 to August 2007 and from January 2007 to January 2008,respectively, whereDzis the thickness of erosion and deposition.In general,this reach was in erosion status after a year,but deposition normally occurred in shoals during the flood season and erosion occurred during the flood recession period.At the entrance of the South Branch, i.e., the Xinhekou to Jiayan reach,from January 2007 to August 2007,the measured deposition volume was 0.36 × 10⁶m3, and the calculated volume was 0.25 × 10⁶m3; while from January 2007 to January 2008, the measured erosion volume was 4.89 × 10⁶m3, and the calculated value was 2.41 × 10⁶m3.The calculated erosion value was smaller. It should be noted that, due to navigation obstacles, dredging for navigation was conducted at the entrance of the South Branch,which was not considered in the calculation.In the Xinhekou to Jiayan reach,deep trenches were eroded and deposition occurred at the middle of the reach. For the Jiayan to Taiheling reach, from January 2007 to January 2008, the measured deposition volume was 1.24 × 10⁶m3, and the calculated volume was 0.96 × 10⁶m3. It has to be mentioned that deposition and erosion data at the entrance of the South Branch from January 2007 to January 2008 were missing,as shown by a blank area in Fig. 7.
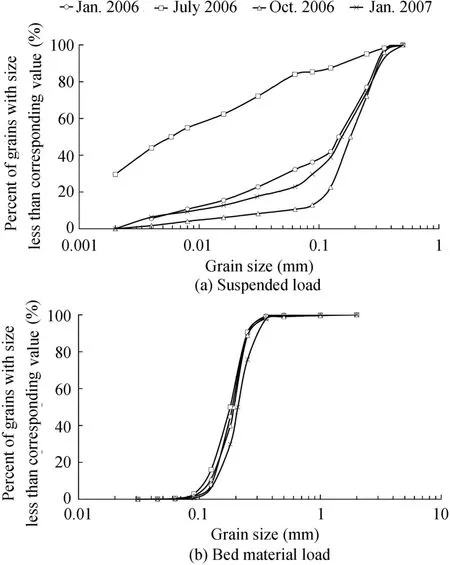
Fig. 5. Sediment size distributions for suspended load and bed material load in Yaojian reach.

Fig. 6. Comparison between calculated and measured distributions of erosion and deposition from January 2007 to August 2007.

Fig. 7. Comparison between calculated and measured distributions of erosion and deposition from January 2007 to January 2008.
From January 2010 to February 2014,the measured erosion volume was 20.88 × 10⁶m3, and the calculated value was 18.37 × 10⁶m3(Fig. 8). In 2010, regulation projects were carried out at the head of Wuguizhou Island to improve the navigation conditions. Erosion occurred in the Xinhekou Channel, which was helpful to the navigation channel. Verification of river bed deformations from January 2007 to January 2008 and from January 2010 to February 2014 indicates that both the calculated values and distributions of deposition and erosion were close to the measured results in most areas.

Fig. 8. Comparison between calculated and measured distributions of erosion and deposition from January 2010 to February 2014.
3. Results and discussion
3.1. Changes of flow-sediment flux before and after completion of TGP
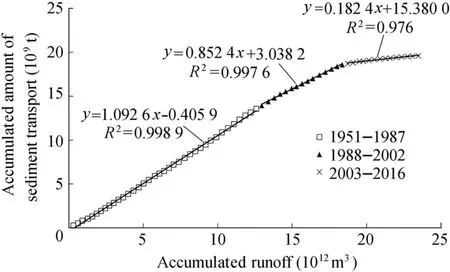
Fig. 9. Accumulated amount of suspended sediment transport versus accumulated runoff at Jianli Station.
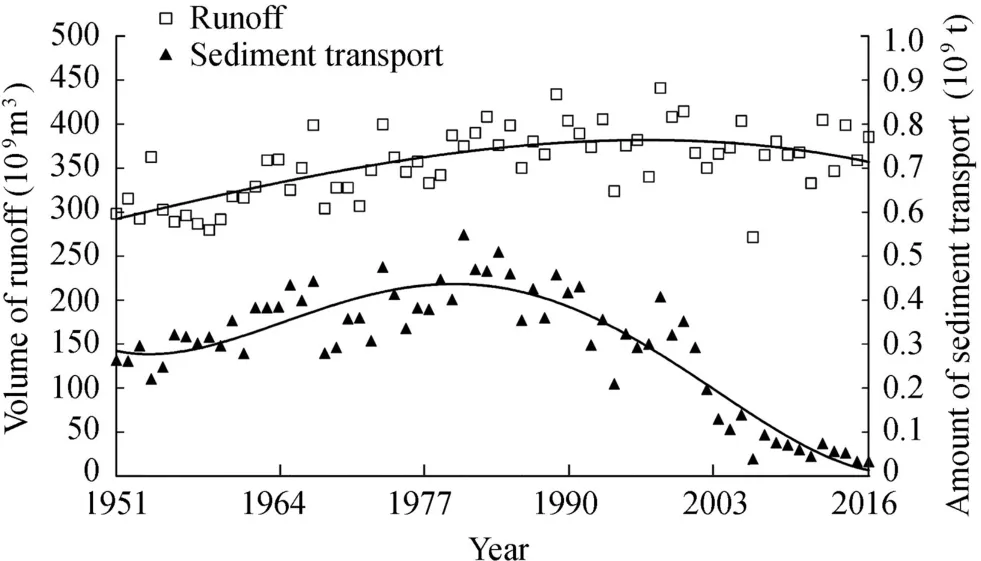
Fig. 10. Time series of runoff and suspended sediment transport at Jianli Station.
Fig. 9 shows the accumulated amounts of suspended sediment transport and runoff from 1951 to 2016 at the Jianli Station. Fig. 10 shows the time series of runoff and suspended sediment transport at the Jianli Station. The average annual runoff was 0.360×10¹²m3,the measured maximum discharge was 46 300 m3/s, and the minimum discharge was 2 650 m3/s.Three periods of 1951-1987, 1988-2002, and 2003-2016 were identified.From 1951 to 1987,the average annual volume of runoff was 0.340 × 10¹²m3, and the average annual sediment transport flux was 0.367×10⁹t.From 1988 to 2002,the average annual volume of runoff was 0.385×10¹²m3,and the average annual sediment transport flux was 0.334 × 10⁹t;compared with 1951-1987, the average annual runoff volume increased by 13%,while the average annual sediment transport flux decreased by 9%. The decrease of sediment concentration was mainly caused by the vegetation in the river basin, river cut-off projects in the lower Jingjiang River, and reservoirs in upstream reaches. Before the completion of the TGP, the average sediment concentration was 1.0 kg/m3. However, after the TGP,the value decreased sharply to 0.23 kg/m3.From 2003 to 2016, the average annual volume of runoff at the Jianli Station was 0.366×10¹²m3,and the average annual sediment transport flux was 0.072 × 10⁹t; compared with 1951-2002,the average annual runoff volume increased by 2.8%while the average annual sediment transport flux decreased by 79.8%.
Table 2 shows the changes in runoff processes at the Jianli Station. In the dry season (December to May), the mean discharge from 2003 to 2016 increased by 5%-34%compared with that before 2003, while from July to September,the mean discharge from 2003 to 2016 decreased by 11%-15%.According to the regulation mode of the TGP,from December to May,the reservoir outputs more water than the incoming flow, which increases the discharge in downstream reaches in the dry season; from May to June, the reservoir level decreases to the flood limit level for flood control; from June to September, the reservoir adjusts the flood process; and from September to November, the reservoir stores water.Therefore,the output water adjusted by the TGP in the flood season is less than the natural incoming flow, and the discharge decreases more rapidly than that before the completion of the TGP, with a decreasing ratio of about 5%-25% at the Jianli Station. Thus, after the flood season, due to the water storage in the reservoir, the flow recession process in the downstream reaches is accelerated.In summary, the flow adjustment process undertaken by theTGP at the Jianli Station shows the following patterns: the flood process is changed in the flood season, the discharge decreases rapidly during the storage period,and the discharge increases in the dry season.

Table 2 Comparison of discharge and sediment concentration at Jianli Station before and after completion of TGP.
3.2. Possibility of main branch translocation after completion of TGP
After the completion of the TGP, the issue of whether the main branch will shift is crucial to river protection and utilization.For navigation purposes,a shift of the main branch is a significant challenge, as the navigation channel has to be changed too. The TGP has changed the flow-sediment flux in the Yaojian reach,which is one of the crucial factors affecting the river regime.Thus,the relationship between the location of the main branch and flow-sediment flux over time was examined based on the measured data.
In the 1860s, the Yaojian reach was a single bend. Since 1912,its main branch and the sub-branch have been switching frequently (Table 3). Fig. 11 shows the river regimes, characterized by the distributions of bank lines, shoals, branches,etc., with the main branch located in either the North Branch or the South Branch.
Table 4 lists the flow-sediment flux during the periods for different locations of the main branch.In 1974,1975,when the main branch shifted from the South to the North Branch, the average sediment concentrations were 1.19 kg/m3and 1.14 kg/m3, respectively, higher than the average value of 1.0 kg/m3before the completion of the TGP. When the mainbranch was located in the North Branch (1912-1931,1945-1971, and 1976-1995), the sediment transport flux was relatively high, with an average annual value of 0.325×10⁹-0.402×10⁹t and an average sediment concentration of 1.01-1.07 kg/m3.

Table 3 Location of main branch of Yaojian reach and duration.
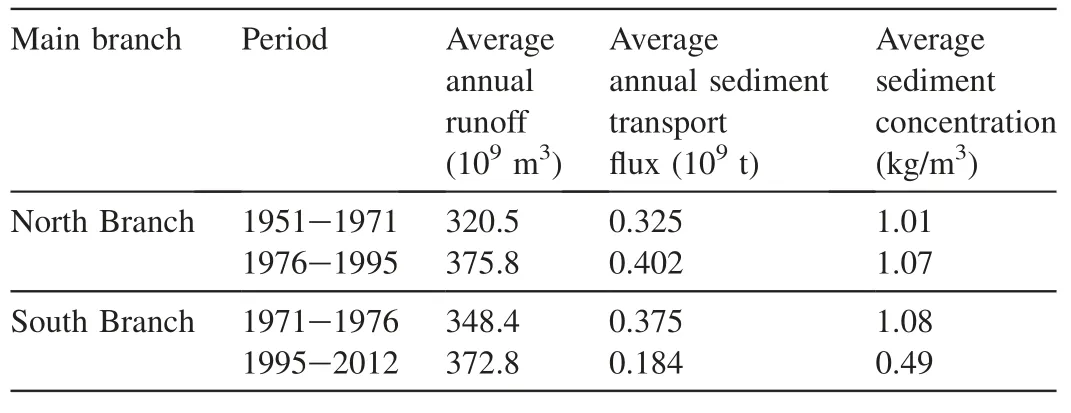
Table 4 Flow-sediment fluxes at different locations of main branch.
When the main branch shifted from the North to the South Branch in 1970 and 1994,the average sediment concentrations were only 0.89 kg/m3in 1970 and 0.65 kg/m3in 1994,respectively, lower than the average value of 1.0 kg/m3before the completion of the TGP.As a result,there was less deposition in the flood season, the strong flow dynamics broke the southern beach,and the main flow shifted to the South Branch.When the main branch was located in the South Branch, the sediment transport flux was relatively low, with an average annual sediment transport flux of 0.184 × 10⁹t and an average sediment concentration of 0.49 kg/m3from 1995 to 2012,much lower than the average value of 1.0 kg/m3.The period from 1971 to 1976 was a special period, because the South Branch was the main branch but the sediment transport flux was high. However, the main branch switched quickly to the North Branch soon after 1975's flood again,showing that a high sediment transport flux cannot keep the main flow in the South Branch.
The Yaojian reach is a curved reach. In curving reaches,flow circulation has a large influence on non-equilibrium sediment transport. When the concave bank collapses and the convex bank develops, the top of the bend moves downstream.With the bend getting more and more curved,the flow route becomes longer and more flow energy is lost.If the main stream line does not fit the river bend,a cut-bank occurs under certain conditions, and the main branch switches to the South Branch. When the flow-sediment flux is high and the South Branch experiences heavy deposition, the main branch switches to the North Branch.
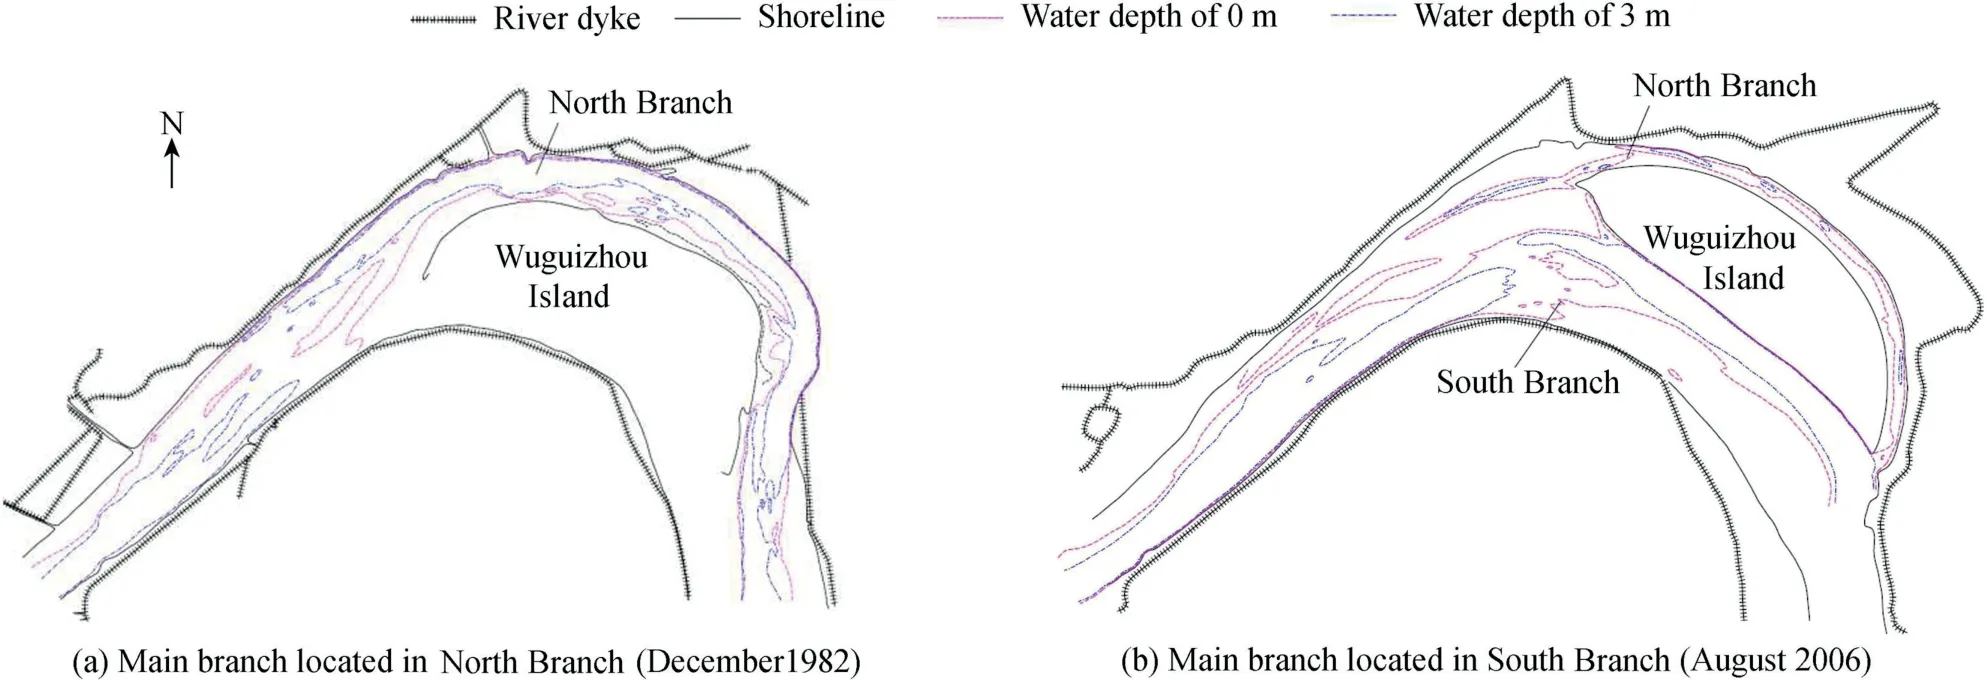
Fig. 11. River regime of Yaojian reach.
It can be concluded that a high sediment transport flux helps to keep the main flow in the North Branch. In years when the main branch shifted from the South Branch to the North Branch, the average sediment concentration was 1.14-1.19 kg/m3, which is higher than the average value of 1.0 kg/m3. A low sediment transport flux, with a sediment concentration in the range of 0.65-0.89 kg/m3,which is much lower than the average value, helps to keep the main flow in the South Branch. Of course, river regime evolution is also affected by some other factors, such as the boundary conditions and human activities.
From 1995 onward, the main flow in the Yaojian reach remained in the South Branch. From the view of sediment transport flux,the main flow would not shift to the North Branch after the completion of the TGP. The reasons are as follows:
(1) The sediment transport flux in the Yaojian reach decreased by 79.8% after the completion of the TGP. The evolution tends toward erosion and less deposition occurs in the south shoals, meaning that the blockage of the main channel will not occur in the near future.
(2) Translocation of the main branch requires strong flow dynamics that burst through the sub-branchorcut down shoals in the sub-branch.Floods were controlled by the TGP and the periods of maximum flow discharges were shortened after the completion of the TGP.For example,on August 19,2015,the incoming flood discharge from upstream of the TGP was 36000m3/sandtheoutflowdischargereleasedfromtheTGPwas only 18 800 m3/s,with a reduction ratio of nearly 50%,meaning that the maximum flow dynamics were weaker,which reduced the possibility of main branch translocation.
(3) Beyond the flow-sediment conditions, navigation regulation projects as well as bank protection,implemented in the Yaojian reach, make the river regime more stable.
It could be predicted that, before reaching a new equilibrium of erosion and deposition after the completion of the TGP, the main branch would not change from the perspective of the flow-sediment flux. Actually, from the measured bathymetry(Fig.2),the river regime remained stable from 2003 on,after the completion of the TGP.Although there was heavy erosion in the Yaojian reach, the bank line remained stable,especially after the navigation regulation projects in 2010 at the head of Wuguizhou Island.
3.3.Responses of shoal-channel evolution to changes of flow-sediment process within one year adjusted by TGP
3.3.1. Overview of river bed evolution after completion of TGP
The evolution of the Yaojian reach has been studied by Han and Yang(2003)and Zuo et al.(2011).From September 2004 to September 2005, both erosion and deposition occurred in the Yaojian reach. From September 2005 to January 2006, the Yaojian reach experienced scouring. The erosion region was mainly located at the deep trench at the inlet of the South Branch, and the northern channel at Yaojilao. At the end of 2007 and 2008, two trenches appeared at the entrance of the South Branch, and shoals in front of Wuguizhou Island were unstable.The development of the two trenches was not good for navigation, and the navigation conditions were poor,with the shallowest water depth of only 3 m. In 2010, navigation regulation projects were carried out at the head of Wuguizhou Island (see Fig. 12). Since then,under the control of the navigation projects, a stable concave trench has developed, and the river regime has become relatively stable.
3.3.2. Analysis of measured data before and after completion of TGP
To analyze the river bed evolution within one year before and after the completion of the TGP, measured bathymetry was collected in April, September, October, and November 2002(pre-TGP) and August, September, October, and November 2007(post-TGP).Theaveragedischargesin2002and2007were 11 109 m3/s and 11 570 m3/s,respectively,close to the long-term average discharge(11 400 m3/s)at the Jianli Station.Thus,these two years were used to make a comparison.
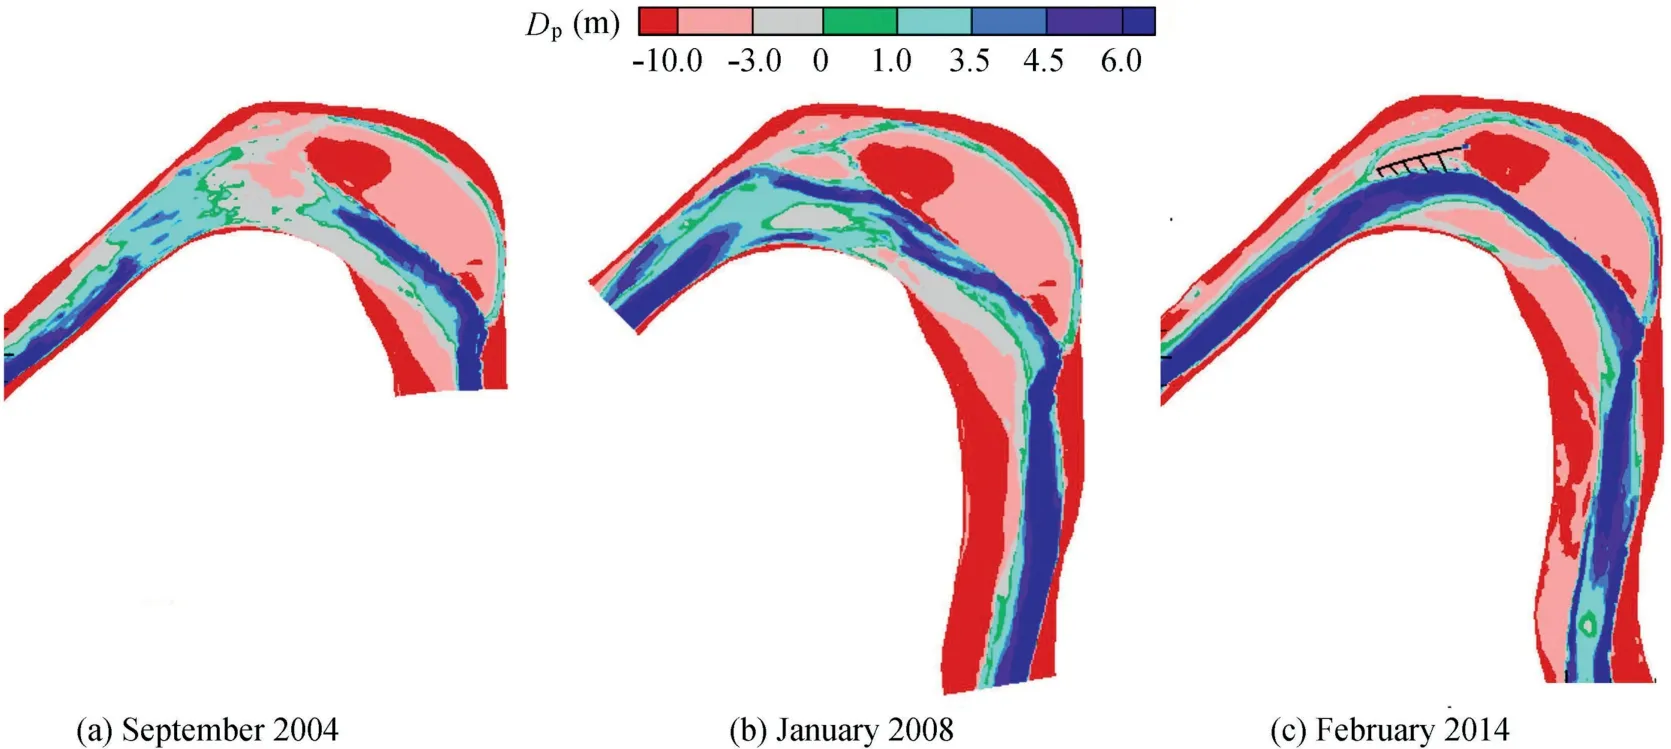
Fig. 12. Navigation depth in Yaojian reach for different years (Dp means the navigation depth).
The entrance of the South Branch is a key area in the Yaojian reach, and the shallowest area for navigation. This area was used as an example to analyze the river bed evolution.Table 5 lists the erosion and deposition volumes in the navigation channel during different periods in 2002 and 2007. It can be concluded that, from April to September 2002, deposition occurred in the flood season, and the deposition regions were the deep channel near Yaojilao, the side beach at Xinhekou, and the head of Wuguizhou Island,with a deposition volume of 4.05 × 10⁶m3and deposition thickness of above 2 m. From September to October, erosion occurred at the side beach of Xinhekou and the head of Wuguizhou Island,with an erosion volume of 0.94×10⁶m3.From October to November, there was slight erosion of 0.05 × 10⁶m3.
After the completion of the TGP, during the flood season from August 11 to September 19,2007,the deposition volume was 0.81 × 10⁶m3. Because of the decrease of sediment concentration, the deposition in 2007 was less than that in 2002.During the flood recession period from September 19 to November 25, the erosion volume was 0.49 × 10⁶m3, which was less than the deposition volume in the flood season.Thus,there were obstructions for navigation.
In short,the river bed evolution at the entrance of the South Branch of the Yaojian reach did not change after the completion of the TGP, i.e., deposition occurred in the flood season and erosion occurred in the flood recession period.The deposition volume in the flood season of 2007 was less than that of 2002,but after the flood season,the erosion during the flood recession period in 2007 was still less than that in 2002.The final result was that there was still deposition at the entrance of the South Branch, which induced a navigation obstacle. This was mainly caused by the storage of the TGP after the flood season, which accelerated the flow recession process(the flood recession period decreased by seven days in 2007). During the storage period in 2007, the average discharge decreased by 13.3%,and the flow velocity decreased by 2%-22% as well.
3.3.3. Numerical simulation of river bed evolution under flow-sediment processes adjusted and non-adjusted by TGP
Erosion during the flood recession period has significant effects on navigation water depth. A 2D model was used tostudy the erosion and deposition volume changes with and without the adjustment of the TGP.
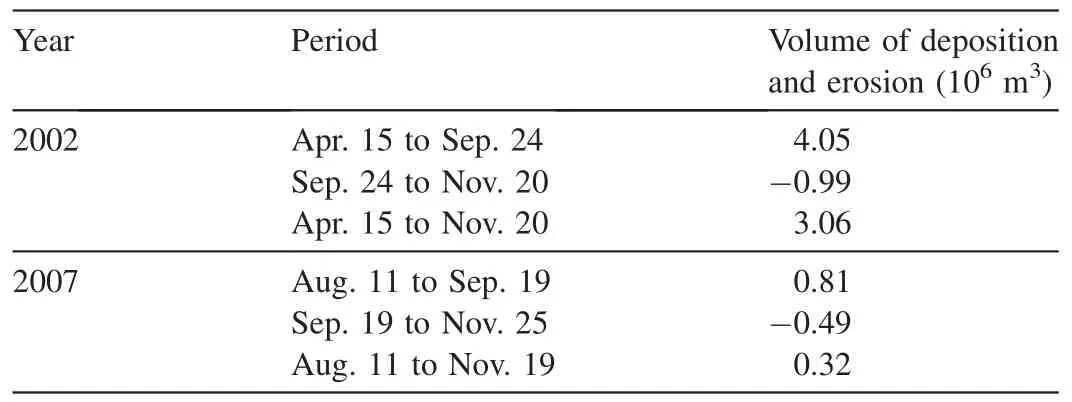
Table 5 Volumes of deposition and erosion at entrance of South Branch in 2002 and 2007.
From 2008, the goal of the storage water level of the TGP was the designed water level, which is 175 m. However, in 2008 and 2009, the maximum storage water level in front of the dam was only about 171-172 m. In 2010, the storage water level of the TGP reached 175 m for the first time. The flow-sediment process in 2010 was restored to the conditions before the completion of the TGP by a 1D model (Liu et al.,2017). Fig. 13 illustrates the measured (adjusted by the TGP) and restored (non-adjusted by the TGP) flow-sediment processes at the Jianli Station.
The calculation conditions included the following cases:the measured flow-sediment process was adjusted by the TGP(Case 1); the discharge was restored to the conditions before the completion of the TGP, and the corresponding sediment concentration was changed according to the relationship between the sediment transport rate and discharge after the completion of the TGP (Case 2), so as to study the river bed evolution only due to changes of the flow process; only the sediment concentration was restored to the conditions before the completion of the TGP (Case 3); and the discharge and sediment concentration were both restored to the conditions before the completion of the TGP (Case 4).
The reservoir began water storage on September 10, 2010,with an initial water level of 160.2 m, and the water level reached 175 m on October 26. During the storage period, the measured average discharge was 13842 m3/s, decreasing by 17% as compared with the average restored discharge, with the value of 16 200 m3/s,and the sediment concentration decreased by up to 80%.
Fig. 14 shows the relationship between the sediment transport rate and discharge in different years.It can be seen that the sediment transport rate decreased significantly after the completion of the TGP, which led the Yaojian reach to experience erosion status. However, there is an overlap area of the envelopes of sediment transport rate under the conditions before and after the completion of the TGP, especially at larger discharges, which indicates that the sediment transport rate is still high at large discharges and may have caused deposition in the shore in the flood season. The deposition volume was much smaller after the completion of the TGP because of a lower average sediment transport rate compared with that before 2003.
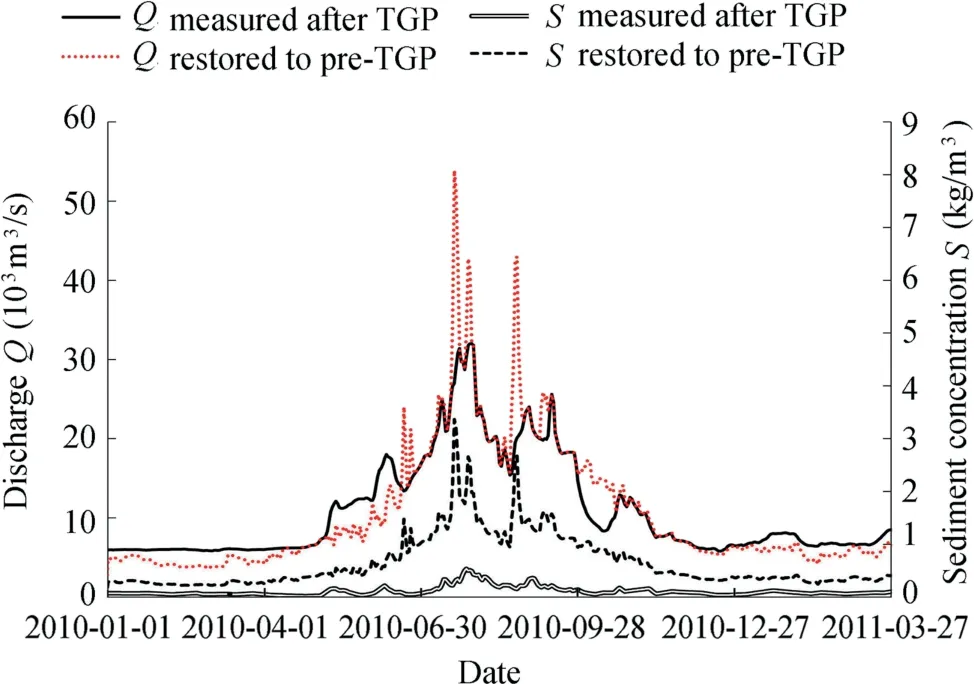
Fig. 13. Measured and restored flow-sediment processes at Jianli Station.
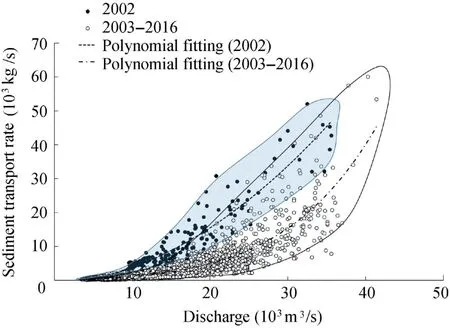
Fig.14.Relationships between measured sediment transport rate and discharge in 2002 and 2003-2016 at Jianli Station.
Fig.15 shows the daily deposition and erosion process for different cases. Table 6 lists the volumes of deposition and erosion in different periods for different cases in 2010.It can be concluded that, with the actual flow-sediment process adjusted by the TGP (Case 1), the deposition volume at the entrance of the South Branch during the flood season was 4.42 × 10⁶m3, and the erosion volume during the storage period was 3.84 × 10⁶m3, with an erosion ratio of 86.9%.The incoming sediment transport flux was 0.40 × 10⁸t during the flood season and 0.08 × 10⁸t during the water storage period. In Case 2, the deposition volume was 5.81 ×10⁶m3during the flood season, 31%higher than that in Case 1. During the storage period, the river bed was eroded, and the erosion volume at the entrance of the South Branch was 4.36 × 10⁶m3. Compared with Case 2, the erosion at the entrance of the South Branch in Case 1 was reduced by 11.9%. This means that the erosion strength during the storage period weakened after the completion of the TGP.In Case 2,the incoming sediment transport flux was 0.60 × 10⁸t during the flood season and 0.11 × 10⁸t during the storage period.
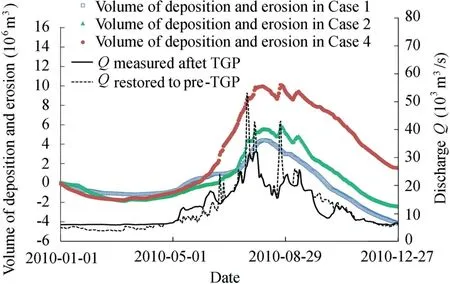
Fig. 15. Daily deposition and erosion process at entrance of South Branch in shallowest shoal area for different cases.

Table 6 Deposition and erosion volumes at entrance of South Branch under flowsediment conditions for different cases in 2010.
In Case 3, the deposition volume was 10.24 × 10⁶m3during the flood season and 3.27 × 10⁶m3during the storage period, meaning that increasing sediment concentration greatly increased deposition.In Case 4,the deposition volume was 10.14 × 10⁶m3during the flood season, and the erosion volume was 3.40×10⁶m3during the storage period,meaning that the silted sediment could not be fully eroded. The incoming sediment transport flux was 2.85 × 10⁸t during the flood season and 0.72 × 10⁸t during the storage period.
It can be concluded from Fig. 15 that, at a discharge of around 20 000 m3/s, shoal erosion occurred, confirming the fact that deposition occurred when the discharge was higher and erosion occurred when the discharge was lower. This phenomenon is related to the incoming flow-sediment conditions.
Fig.16 shows the distributions of deposition and erosion for different cases in 2010,where the dashed line is the regulation line,and the black box is the calculation area for the volume of deposition and erosion at the entrance of the South Branch.In Case 1 and Case 2, with lower sediment transport rates, more erosion occurs at the entrance of the South Branch. While in Case 3 and Case 4,with higher sediment transport rates,more deposition occurs. According to final results of river bed evolution over one year, the river bed tends to be eroded in Case 1 and Case 2 and tends to experience deposition in Case 3 and Case 4(Figs.15 and 16),mainly because of the changes of the sediment concentration adjusted by the TGP. Comparing Case 1 (post-TGP) with Case 4 (pre-TGP), the deposition in the flood season decreased by 56.4% after completion of the TGP, but the TGP caused a small change in the magnitude of the erosion after the flood season. However, there is a deposition zone in a strip shape occurring at the entrance of the South Branch in all cases, which may cause unstable navigation conditions.
Before the completion of the TGP, because of heavier deposition, the navigation depth was shallower, with the shallowest water depth being less than 2 m. After the completion of the TGP(Case 1),the shallowest water depth at the entrance of the South Branch was 2.9 m. However, two trenches developed at the entrance of the South Branch,making the navigation channel unstable. Thus, regulation projects were carried out in 2010 and have successfully improved the navigation conditions. In 2019, the shallowest water depth of the navigation channel reached 3.8 m and the navigation width reached 150 m in the dry season. In this study, the navigation projects were not included in the calculation.More details about the effects of the navigation projects can be found in Zuo et al. (2011).

Fig. 16. Distributions of deposition and erosion in Yaojian reach for different cases in 2010.
4. Conclusions
After the completion of the TGP, the flow-sediment process in the middle Yangtze River was significantly changed.Based on analysis of the measured data and simulation through a 2D mathematical model,responses of the river bed evolution and the navigation channel to flow-sediment process changes in the Yaojian reach were studied. Our conclusions are as follows:
(1) Over history, the main branch has switched frequently in the Yaojian reach. A large sediment transport flux helps to keep the main flow in the North Branch, while a small sediment transport flux helps to keep the main flow in the South Branch.The operation of the TGP reduced sediment transport and realized flood peak control, while also leading to insufficient sediment supply and flow dynamics for main branch translocation. Before reaching a new erosion-deposition equilibrium, the main branch will not change in the near future.
(2) A 2D mathematical model was used to quantify the changes of river bed evolution before and after the completion of the TGP at the entrance of the main branch. The flowsediment process of 2010 was restored to the conditions before the completion of the TGP. Under the actual flowsediment conditions in 2010, the flow recession process was accelerated and the flow discharge was decreased during the water storage period of the TGP,which reduced the erosion by 11.9%at the entrance of the South Branch.In the flood season,the deposition decreased by 56.4%.Therefore,the erosion ratio after the flood season with the TGP was higher than that without the TGP.
(3) From this study it can be concluded that the main river regime in the Yaojian reach is stable with little possibility of translocation of the main branch. Since the completion of the TGP,though the river bed has shown a general trend of erosion over a full year, the shoal-channel evolution is complex, e.g.,deposition and erosion may occur in different seasons,affecting the navigation conditions.
Declaration of competing interest
The authors declare no conflicts of interest.
 Water Science and Engineering2020年2期
- Water Science and Engineering的其它文章
- Hydrological response to climate change and human activities:A case studyof Taihu Basin,China
- Possibilities of urban flood reduction through distributed-scale rainwater harvesting
- Toxic response of aquatic organisms to guide application of artemisinin sustained-release granule algaecide
- Effects of water application intensity of micro-sprinkler irrigation and soil salinity on environment of coastal saline soils
- PIV analysis and high-speed photographic observation of cavitating flow field behind circular multi-orifice plates
- Multi-objective reservoir operation using particle swarm optimization with adaptive random inertia weights
