Modified micro-mechanics based multiscale model for progressive failure prediction of 2D twill woven composites
Meng WANG, Peiwei ZHANG, Qingguo FEI, Fei GUO
a Institute of Aerospace Machinery and Dynamics, Southeast University, Nanjing 211189, China
b Department of Engineering Mechanics, Southeast University, Nanjing 211189, China Received 30 April 2019; revised 23 June 2019; accepted 6 September 2019
KEYWORDS 2D twill woven composites;Clustering analysis;Fiber distribution patterns;Micro-mechanics failure theory;Multiscale damage model
Abstract To consider fiber random distribution at the microscale for the multiscale model based on the micro-mechanics failure(MMF)theory,clustering method is used for the extraction of amplification factors.As the clustering method is a kind of unsupervised machine learning method,the elements with similar mechanical behavior under external loading can be included in a cluster automatically at the microscale.With this modification,the fiber random distribution model can be used for multiscale damage analysis in the framework of MMF theory. To validate the modified multiscale analysis method, progressive damage analysis of a kind of 2D twill woven composites is conducted based on different microscale models.The stress values for microscale models with fiber hexagonal and random distribution patterns are compared first. Much higher stress concentration is generated in the fiber random distribution model due to the smaller inter-fiber distance especially under longitudinal shear loading.The obtained cluster distribution results exhibit the characters of the stress distribution in the two microscale models. Thereafter, tensile and compressive responses of the 2D twill woven composite are predicted with the modified multiscale analysis method and accuracy of the method is verified through comparison with published experimental results. From the simulation results, it can be found that the matrix damage initiation from the model based on the fiber random distribution model is premature compared with that from the model based on the fiber hexagonal distribution model. Besides, under tensile loading, the damage all initiates from the fill tows and propagates to the wrap tows.However,under compressive loading,the matrix damage initiates from the wrap tows in the model based on the fiber random distribution model.
1. Introduction
Two-dimensional (2D) twill woven composites as one kind of textile composites have been widely used in many engineering fields such as astronautics,automotive,civil engineering and so on due to the advantages of excellent mechanical performance and low manufacturing costs. Because of the complex microstructures including undulation of tows at the mesoscale and fiber arrangement at the microscale,it is much more challenging to accurately predict the mechanical behaviors of textile composites.
Different numerical methods have been developed to predict mechanical properties of textile composites, such as Binary Model,1FFT-based method,2generalized method of cell(GMC),3finite element method (FEM)4and so on. Among them, the finite element method is the most widely used for the progressive damage analysis and equivalent property prediction. Different numerical calculation strategies have been proposed for the FEM analysis method.Concurrent multiscale models combining the mesoscale model with microscale model were developed to analyze the damage and failure patterns at different scales simultaneously.5,6The microscale model is used to provide the constitutive relationships for the tows on the fly. However, computation cost for the multiscale method is relatively high. Hierarchical multiscale methods were also widely used to predict equivalent properties and reveal failure mechanisms of the textile composites.7-11In these studies, the analysis procedures were divided into two steps explicitly.Firstly, with the properties of constituents including elastic and strength parameters, different microscale models were adopted to predict the tows’ properties such as Huang’s model,7,8Chamis’s equations9,10and FEM methods.11,12Then with these homogenized parameters,phenomenological failure criteria and damage evolution model developed for the laminates were adopted for the damage analysis of tows. At last,multiscale progressive damage analysis of textile composites can be conducted under different loading conditions with FEM method.
Instead of providing the equivalent mechanical properties for the multiscale analysis based on the phenomenological failure criteria,another method is to provide the amplification factors13which describe the relationships between the stress states at the microscale and the higher scale.Failure criteria based on the amplification factors were developed and named as micromechanics of failure (MMF) criteria.14-16It had been shown that the MMF theory has good predictive capabilities among various failure theories in the Second World Wide Failure Exercise (WWFE-II).17,18With the MMF criteria, the damage initiation and evolution can be determined at the constituent level for a given design option, while simultaneously incorporating material and processing variability. The key point for MMF criteria is the amplification factors. To obtain the amplification factors, for simplicity, critical points in microscale representative volume element (RVE) should be chosen first. They are generally located at the fiber-matrix interface, inter-fiber and inter-matrix positions, as these positions are usually where the stress concentrates. Once one critical point for fiber/matrix satisfies its corresponding failure criteria, the constituent’s property would be degraded to simulate the damage evolution,which can be referred to the maximum damage method. As the fiber behaves brittle, another key point for the analysis is the damage evolution model for matrix. Based on the MMF criteria, combined with damage evolution models at the constituent level, static,19-21impact,22,23fatigue24and mechanical-thermal coupling25,26analyses of laminates have been conducted. With the MMF criteria and sudden degradation model for the constituents,the laminates with a hole under tensile and compressive loadings have been analyzed.19,20Besides the sudden degradation model, the damage evolution model based on Stassi’s stress was developed for the matrix damage analysis under more complex loading conditions.27,28
Multiscale method based on the MMF theory has been extended for the damage analysis of textile composites.29-31The MMF theory is used for the damage initiation judgment for the tows and an additional damage evolution model is integrated to simulate the matrix damage propagation.In Ref.31,the critical points were chosen as those used for the laminates and the damage evolution model based on fracture toughness was used for the damage assessment of matrix.In Refs.29,30,instead of choosing critical points from the microscale RVE,all elements in microscale models were adopted for the extraction of amplification factors and the evaluation of damage.The damage evolution model based on the Stassi’s stress was adopted for the damage analysis of matrix and damage homogenization method was used to calculate the overall damage for the matrix. The damage homogenization method means that the overall damage value of matrix is calculated through averaging all damage values in matrix elements. The two different methods,damage homogenization and maximum damage methods, were compared for the determination of overall matrix damage. It has been found that the responses predicted based on the damage homogenization method are more similar with the experimental results than the results predicted based on the maximum damage method. However, in these studies, only the fiber hexagonal distribution model was adopted.
It is well known that the properties of composites are highly dependent on the microstructure and properties of constituents. One important microstructure characteristic is the fiber arrangement.32,33With different fiber distribution models, different failure strengths and envelopes of laminates were predicted,34,35which presents the important influences of fiber arrangement on the strength prediction.The influences of fiber distribution on the prediction of inelastic responses of composite laminates have also been revealed and demonstrated.36-38From these analyses,it can be found that the fiber random distribution model can predict the mechanical responses more accurately than the fiber regular (square, diamond or hexagonal) distribution models. There is a newly developed selfconsistent clustering method39-41in which the multiscale analysis is divided into two stages,offline and online stages.At the offline stage, FFT method was used for elastic stress analysis.Then, the clustering42analysis was conducted to generate the cluster containing the elements having similar mechanical behavior under different loading conditions. At the online stage,the incremental Lippmann-Schwinger integral equations were solved based on the clusters to predict the composite properties.Compared with this method,the MMF based multiscale analysis method can also be regarded as a method with the two stages. To conduct the multiscale damage analysis of composites in the framework of the MMF theory, critical regions for the extraction of amplification factors can be obtained based on the concept of cluster.
In this study, it is aimed to modify the multiscale method based on the MMF theory so that the effects of fiber arrangement on the damage propagation of 2D twill woven composites can be revealed. Mesoscale model is first established with the geometrical parameters. Then the microscale models are introduced including fiber hexagonal and random distribution patterns. The fiber random distribution model is established with a newly developed numerical algorithm based on the random perturbation method. The modified multiscale progressive damage analysis method based on MMF theory is introduced next.At last,progressive damage analysis of a kind of 2D twill woven composites based on different microscale models is conducted to validate the modified multiscale analysis method. Meanwhile, the effects of fiber distribution patterns on the damage propagation of the 2D twill woven composite are evaluated.
2. Multiscale finite element modeling
As composites are heterogeneous naturally, to predict the mechanical properties at macroscale,RVEs at two scales,meso and micro scale, should be involved. The mesoscale RVE defines the internal structures of the weave and the distribution of local reinforcement,while the microscale RVE concerns the topology structure of periodic fiber arrays within the matriximpregnated fiber tows. The mesoscale and microscale RVE models are established and introduced first. Due to the lack of experimental tests, geometrical parameters and experimental data of the 2D twill woven composite in Ref. 31 are adopted in this study to validate the modified multiscale analysis method. Periodic boundary conditions (PBC) are introduced next to derive essential parameters at the microscale for the multiscale analysis and to obtain equivalent properties at the mesoscale.
2.1. Mesoscale RVE
The mesoscale RVE model of the 2D twill woven composite is established according to Refs. 4,31, in which the tow crosssection is assumed to be rhombus with a flattened region.With this simplification, a high tow volume fraction and a better mesh quality of mesoscale RVE model can be achieved.Fig. 1 shows the loading direction adopted in this study and the mesoscale RVE established to represent the 2D twill woven composite.
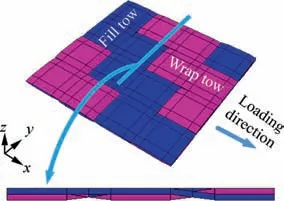
Fig. 1 Illustration for mesoscale RVE and loading direction.
The weaves are regarded to be balanced which means that the wrap tows and fill tows have the same waviness ratio and tow volume fraction.More details of the mesoscale model can be referred to Ref. 31. The geometrical parameters are shown in Fig. 2 and Table 1. Furthermore, based on the geometrical parameters, the calculated tow volume fraction and fiber volume fraction of the weave are also shown in Table 1. The model is meshed with 8 node linear brick reduced integration element (C3D8R) and the approximation global mesh size is 0.15 mm.
2.2. Microscale RVE
As mechanical properties of tows in the 2D twill woven composites are difficult to be measured through experiments, the tows are usually assumed to behave as unidirectional composites whose mechanical properties can be predicted from the microscale RVE models. Fiber hexagonal distribution model was frequently adopted for the property prediction for two reasons. The first one is that the fiber hexagonal distribution model can achieve relatively larger fiber volume fraction in the tows. The second one is that the equivalent elastic properties predicted from the fiber hexagonal distribution model are more similar with those from the fiber random distribution model.32,33
In Ref. 31, the fiber hexagonal distribution model was adopted at the microscale to predict the properties of the 2D twill woven composite. However, fiber random distribution pattern is regarded as the closest representation to real cases in composites.32In this study, both the fiber hexagonal and random distribution models are adopted to reveal the effects of fiber arrangement on predicted properties of the 2D twill woven composite. RVE model with fiber random distribution is established with the help of a modified random perturbation method developed from Refs. 38,43. The illustration for the generation of fiber random distribution model is shown in Figs.3 and 4.In the first step,the model with fiber square distribution is established with the desired fiber volume fraction(62.8%31). Then, one global crisscrossing of the positions of fibers is conducted in each iteration to accelerate the model generation process. Global crisscrossing means that each two adjacent row/column fibers are relatively moved with the same distance Δd. After the global crisscrossing, random perturbation of each fiber’s position is conducted. During the random perturbation,the moving range in the x and y direction(xf,yf)of each fiber(f)are determined through its nearest fibers which are identified in the initial fiber square distribution model. At the same time, the distance of fibers on the opposite boundaries (such as f1-f2or f3-f4) should be constant to obtain the periodicity at the boundaries. Then a new position for each fiber is chosen randomly within the range and if there is no overlapping between each two fibers, the position is accepted.After 100 iterations in this study,the model with fiber random distribution can be obtained.
The established microscale models with fiber hexagonal and random distribution are shown in Fig.5.The fiber diameter is set to 7 μm.These models are meshed with 6 node linear triangular elements(C3D6)and the approximation global mesh size is 0.3 μm. 31,160 elements are used to discretize the fiber hexagonal distribution model (19240 for the fibers and 11,920 for the matrix). For the fiber random distribution model,658,520 elements are adopted(426580 for the fibers and 231,940 for the matrix).

Fig. 2 Illustration for part of the woven composite cross section.
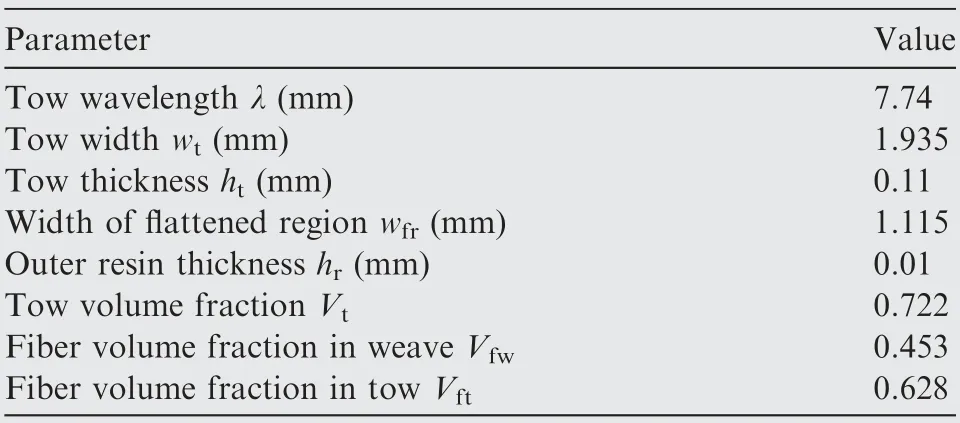
Table 1 Geometrical parameters for mesoscale RVE of the 2D twill woven composite.31
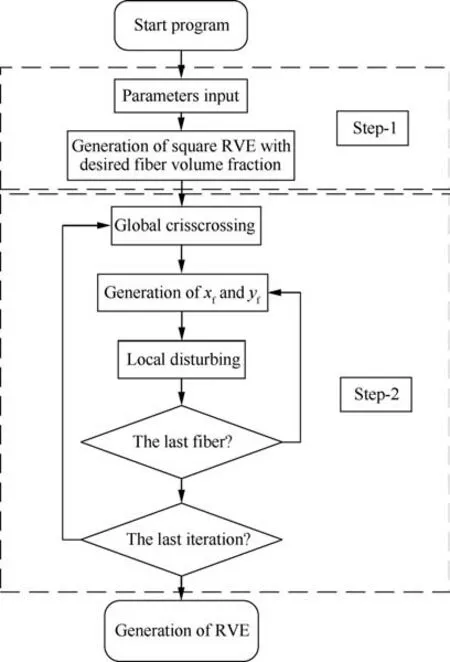
Fig. 3 Process for fiber random distribution model generation.
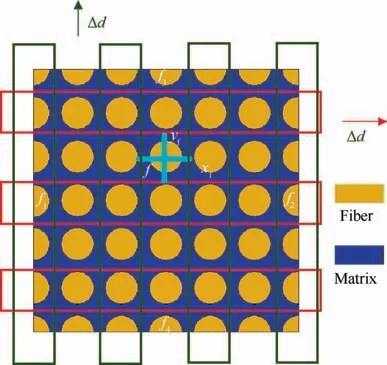
Fig. 4 Illustration for the fiber random distribution model generation.
With the established microscale models,the equivalent elastic parameters of tows can be computed with finite element analysis.10-12Under six independent mechanical loadings,equivalent stiffness matrix for each microscale model can be derived from the computation analysis. Then equivalent flexibility matrix can be computed. Based on the relationships between the flexibility matrix and engineering elastic parameters, the equivalent elastic parameters for the microscale models can be obtained.The elastic parameters of fiber and matrix are shown in Table 2.The elastic properties of the T300 carbon fiber and epoxy resin are referred to Ref. 31 and they show good consistency with the values given in Ref. 44.
Besides the finite element method, Chamis’s equations9are also one powerful method to predict the equivalent properties of laminates with constituents’ properties. Here, the Chamis’s equations are adopted to validate the elastic parameters obtained for tows. The equations for the prediction of elastic parameters are shown below.
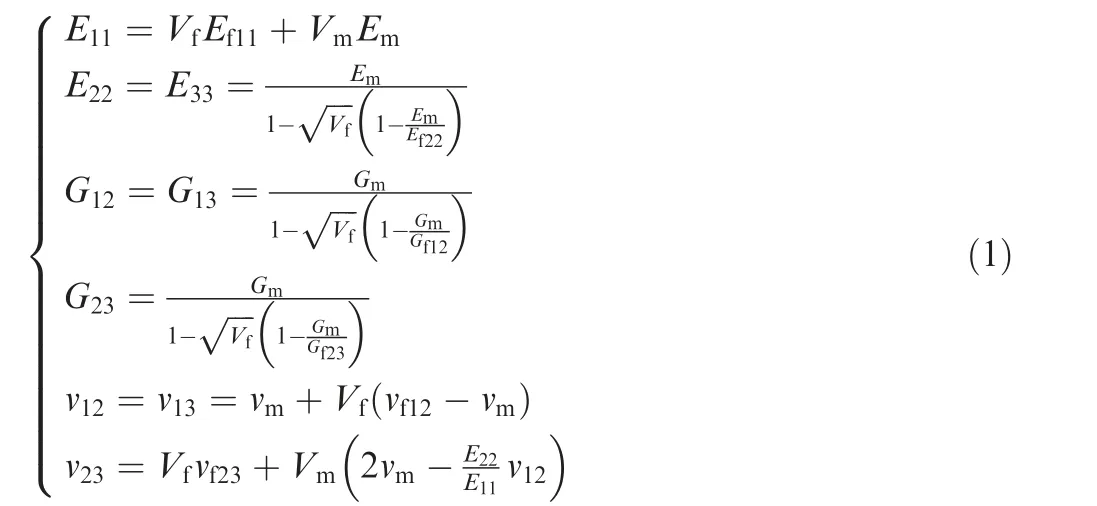
where the subscript f and m represent the fiber and matrix,respectively. Vfand Vmare fiber and matrix volume fraction,respectively.
2.3. Periodic boundary condition
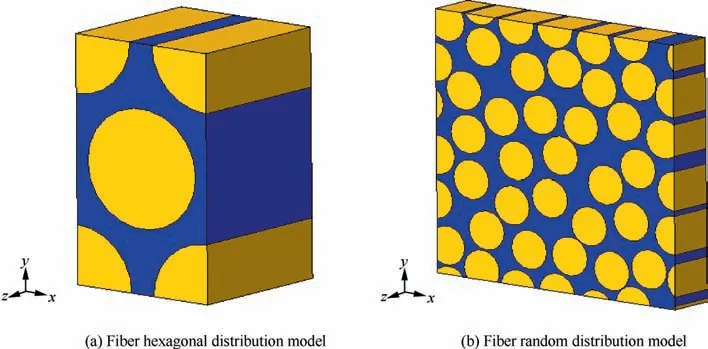
Fig. 5 Microscale models with different fiber distribution patterns.

Table 2 Elastic properties of constituents for the 2D twill woven composite.
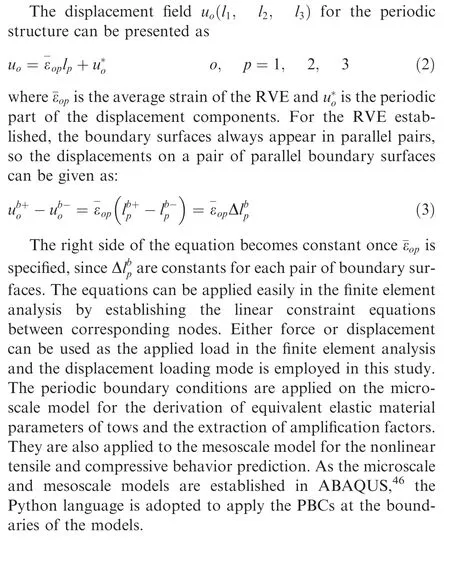
As the periodic mesh is used in the geometrical model,the periodic boundary conditions are applied. The unified displacement-difference periodic boundary conditions were developed by Xia,45which can guarantee the displacement and traction continuity conditions at the opposite boundaries of the neighboring RVEs and replicate the repeating nature of the RVE.
3. Multiscale progressive damage model
To predict the mechanical properties of composites, several steps at the microscale and mesoscale should be conducted separately. Firstly, the elastic analysis of the microscale models under six mechanical loading conditions is conducted to obtain the equivalent elastic parameters of tows. Secondly, based on the stress results, the clustering analysis should be conducted to obtain the cluster distribution and mean amplification factors in each cluster. Then, the progressive damage of the 2D twill woven composite can be analyzed with the damage models at the constituent level based on the amplification factors.The basic procedures about the modified multiscale progressive damage model are introduced next.
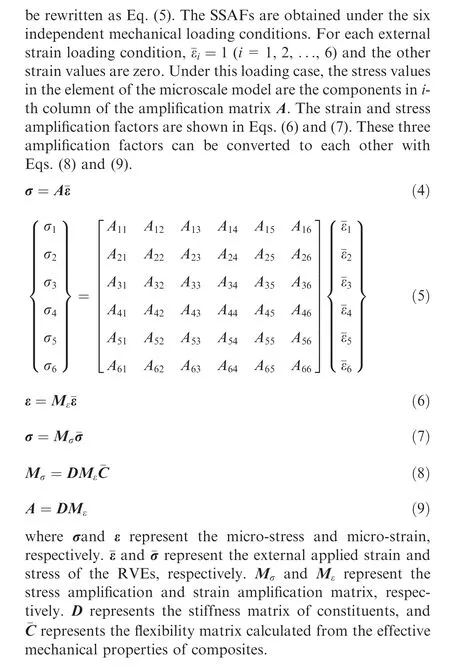
3.1. Calculation of microscopic stresses in constituents

3.2. Extraction of strain-stress amplification factors with
clustering analysis
For the fiber regular distribution models, critical points or all matrix elements were used for the extraction of amplification factors. For the fiber random distribution model, it is difficult to choose the critical points.If all microscale elements are considered during the multiscale damage analysis of mesoscale model, too many amplification matrices need to be stored and used.To consider fiber random arrangement at the microscale during the multiscale analysis based on MMF theory,an unsupervised machine learning method, clustering method, is used to obtain clusters automatically for the extraction of amplification factors. Each cluster contains the elements having similar mechanical behavior under the six independent loading conditions.42On the one hand, as the averaged stress values in the clusters are representative for stress situations of all elements, these clusters are suitable for the extraction of amplification factors. On the other hand, the number of SSAFs needed for the multiscale analysis becomes much less.The clustering analysis is also based on the stress values under the six mechanical loading conditions. To obtain the clusters,the thirty-six(6×6)stress values in the strain-stress amplification matrix are arranged as a row for each element belonging to a kind of constituent(fiber/matrix).The assembled matrix is used for the clustering analysis so that the elements with similar mechanical responses can be included in one group.The assembled stress matrix is shown below and e represents the element number in fiber/matrix.
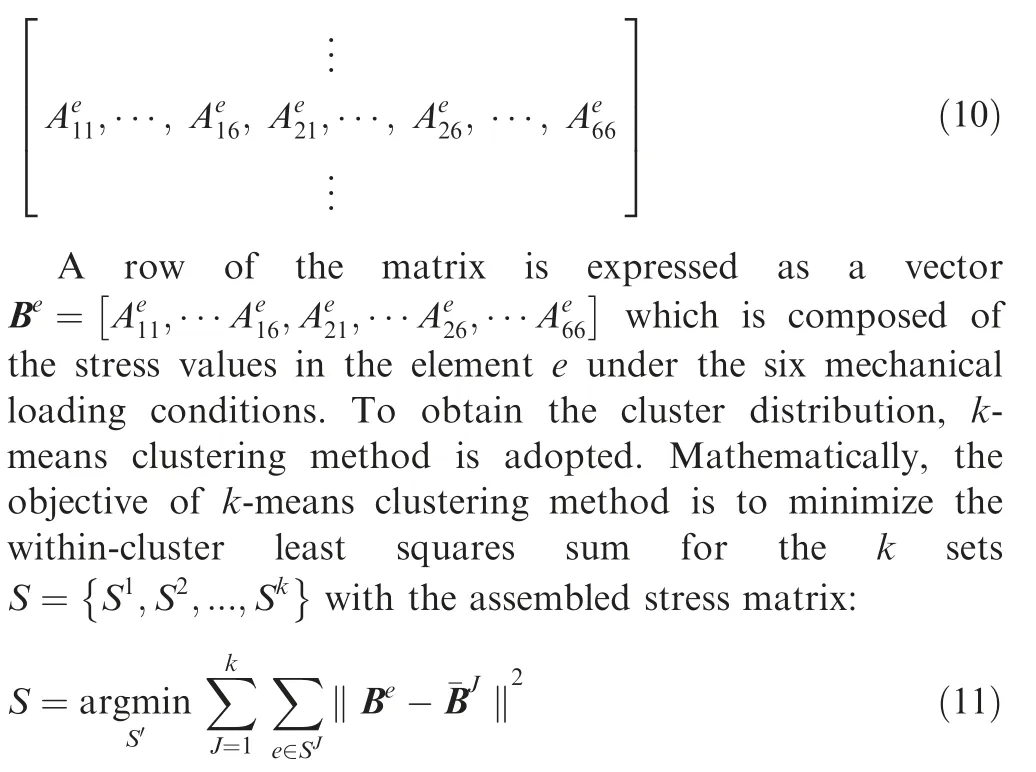
where Beis the stress values of the element e in the cluster J(J=1, 2, ... , k), ¯BJis the mean stress values of all elements within the cluster. To do the clustering analysis, the first step is the initialization step and k elements in one constituent are randomly selected. Their stress values are served as the initial mean values of the clusters. Then, the optimization process iterates between the following two steps. At the assignment step,each element is assigned to the cluster whose mean values are nearest to the element’s stress values. Next is the update step, in which the mean stress values of the elements in the new cluster are recalculated.This process needs to be repeated until the assignment of elements no longer changes. More details about the optimization process can be referred to Ref. 39.
After the cluster distribution pattern is obtained,the SSAFs of the elements in the same cluster are averaged to represent the amplification factors for the cluster. The volume fraction of a certain cluster (Vc) can also be obtained for the damage analysis in the mesoscale model. It is believed that with the increase of the number of clusters, more details at the microscale can be reserved so that more accurate results can be predicted.39
3.3. Failure criteria and damage evolution model
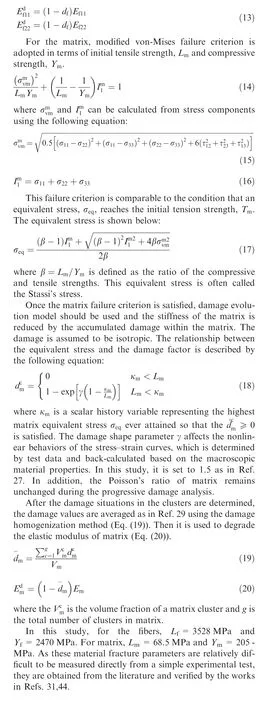
With the amplification factors,the stress values in each cluster of microscale model can be derived from the strain values in the elements of mesoscale model. With the stress values, the damage situations in the clusters can be determined with their damage initiation criteria and evolution models.For the fibers,the maximum stress failure criteria are adopted. When the stress value along the fiber direction is higher than the strength value,the fiber is failed.The damage parameter is set to 0.999,once the failure criteria are satisfied. The failure criteria are shown in Eq. (12) and the modulus of the fiber is degraded with the damage parameter as Eq. (13).

3.4. Modified multiscale numerical implementation
The modified multiscale analysis flow of the 2D twill woven composite is described briefly here (Fig. 6). The analysis is divided into two stages,offline and online stages.At the offline stage,based on the stress values calculated from the microscale model under six independent mechanical loadings,the equivalent elastic parameters and SSAFs for the tows are obtained.At the online stage, the multiscale damage analysis for the mesoscale model is conducted with the information from the microscale model. In one loading step, after multiplying the strain vector in an element (s) of the tows with the SSAFs,micro stress vector for the matrix or fiber cluster(r)is obtained at the microscale. Failure criteria of the constituents are used to judge the damage initiation of the matrix and the fiber. If the criteria are satisfied, the corresponding damage evolution model is employed to compute the damage factor for the matrix cluster or the fiber cluster.After obtaining damage factors for all clusters at the microscale,the overall damage factor of matrix is obtained through averaging the damage values considering the cluster volume fraction based on the damage homogenization method.29The damage factor calculated in each loading step is compared with the damage factor from previous loading step and the maximum of the two is chosen to ensure that the damage factor would never decrease. With the damage values, the properties of the constituents are degraded. With the micromechanical model such as the Chamis’s equations, the degraded properties of tows are obtained and used in the next analysis step.For the pure matrix(q),the damage initiation and evolution models are used directly for the behavior description. The modified MMF theory based multiscale analysis method is integrated into ABAQUS with subroutine UMAT.
4. Results and discussion
To validate the modified multiscale analysis model based on the MMF theory, the progressive damage analysis of the 2D twill woven composite is analyzed and compared with published experimental results. Firstly, elastic analysis of the microscale models is conducted under six mechanical loading conditions to obtain the equivalent elastic parameters of tows and the micro stress values. Then, the clustering analysis is conducted with the micro stress values to extract the SSAFs and volume fraction of each cluster. At last, the mesoscale model is analyzed under tensile and compressive loadings to verify the modified multiscale damage analysis method.
4.1. Microscale analysis of tows
The fiber hexagonal and random distribution models are analyzed and the predicted equivalent elastic parameters for the tows are shown in Table 3. They are also compared with the results from the Chamis’s equations. It can be found that the tensile modulus and longitudinal Poisson’s ratio of the two models are similar with each other. However, there are differences in the shear modulus and the transverse-transverse Poisson’s ratio. The shear modulus and transverse-transverse Poisson’s ratio from the fiber random distribution model are higher than those from the fiber hexagonal distribution model.In general, the results from the fiber random distribution model are more similar with those from Chamis’s equations.
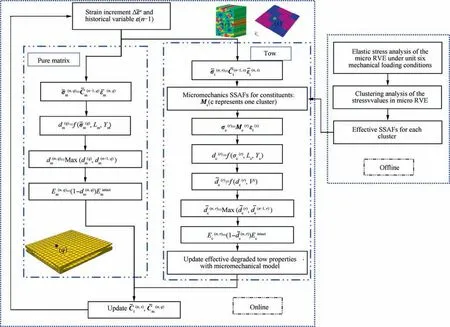
Fig. 6 Analysis flow for woven composite with the modified multiscale analysis method.
The von-Mises stress distribution patterns of the fiber hexagonal distribution model under longitudinal tensile,transverse tensile, transverse shear and longitudinal shear loadings are shown in Fig.7.It can be found that the stress concentrates between the fibers and at the fiber-matrix interfaces. The obtained cluster distribution patterns are shown in Fig.8 with different number of clusters. As the clustering method is an unsupervised machine learning method, the distribution of the clusters is discontinuous. It can also be found that the elements with stress concentration are almost in a cluster. With the increase of the number of clusters, the cluster distribution pattern becomes more and more representative of the stress distribution patterns.
The stress distribution patterns of the fiber random distribution model are shown in Fig. 9. Compared with the fiber hexagonal distribution model under longitudinal tensile loading, the stress values are almost the same. However, for the other three loading cases,the maximum stress values are much higher than those from the fiber hexagonal distribution model,which attributes to the smaller inter-fiber distance. Under transverse tensile and transverse shear loadings,the maximum stress values are about two times larger than those from the fiber hexagonal distribution model. Under longitudinal shear loading, the maximum stress is nearly four times larger. The cluster distribution patterns for the fiber random distribution model are shown in the Fig. 10 with different number of clusters. It can be found that the elements between two very close fibers are included in a cluster and the area of the cluster is very small,which demonstrates that the clustering method is useful to cluster the elements having almost the same mechanical behavior.
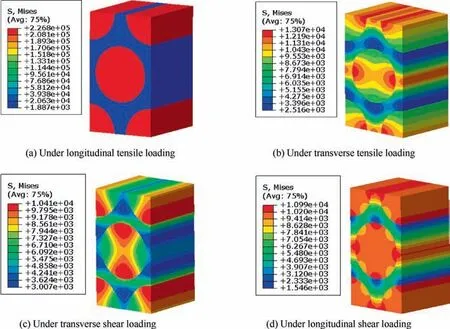
Fig. 7 Stress distribution for the fiber hexagonal distribution model.
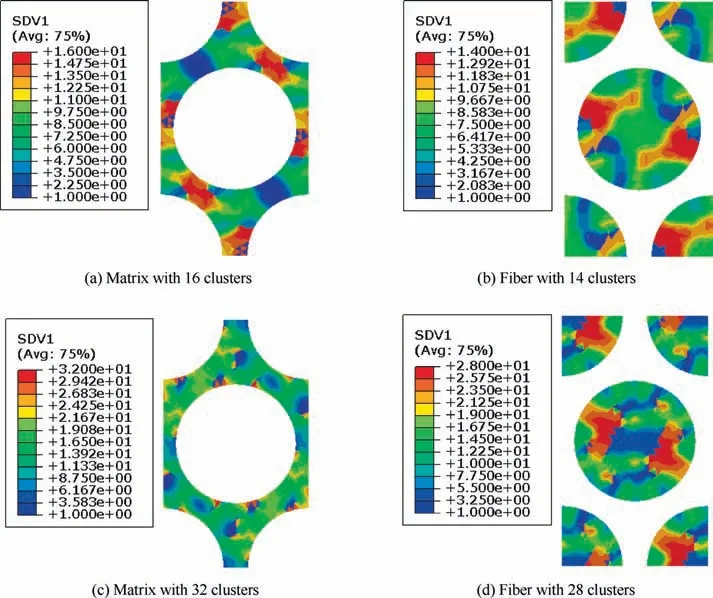
Fig. 8 Cluster distribution for the fiber hexagonal distribution model.
4.2. Mesoscale analysis under tensile loading
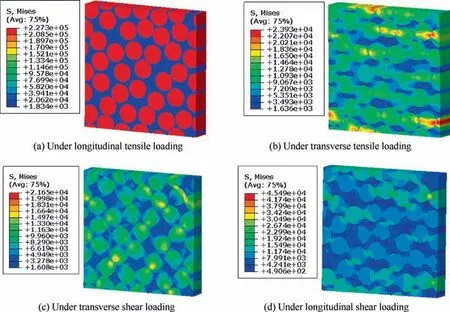
Fig. 9 Stress distribution for the fiber random distribution model.
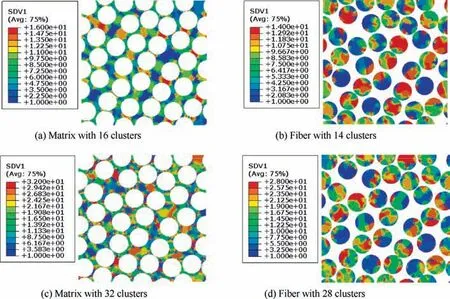
Fig. 10 Cluster distribution for the fiber random distribution model.
Compared with experimental and simulated results in Ref.31,the predicted stress-strain curves are shown in the Fig.11.The agreements demonstrate the accuracy of the modified multiscale analysis method under tensile loading. With the increase of the number of clusters, there is little change in the global responses. Besides, it can be concluded that fiber distribution patterns at the microscale also have little influence on the global tensile responses. However, there are great differences in the critical strain values for matrix damage initiation in the mesoscale models based on different fiber distribution models(Table 4). The result from the model based on fiber random distribution model is much smaller than that from the model based on fiber hexagonal distribution model. Thus, it can be concluded that the damage initiates much earlier in the model based on fiber random distribution microscale model. As the information about the local damage initiation and propagation of the composites was not obtained during the tension experiments,31this conclusion cannot be verified directly.However, in Ref. 47, the acoustic emission method was adopted to detect damage online and track the damage progression of 5-harness satin woven composite under tension.It was found that the damage initiation strain was 0.14%and the catastrophic failure strain was 1.21%(the catastrophic failure strain corresponds to the peak point in the stress-strain curve). Through comparing these critical values with those from the model based on fiber random distribution model(0.279% for damage initiation and 1.829% for catastrophic failure), it can be deduced that more accurate damage initiation and propagation information can be predicted when the fiber random arrangement is considered at the microscale.The catastrophic failure strain and tensile strength values from the mesoscale models are all very close to the experimental results.31
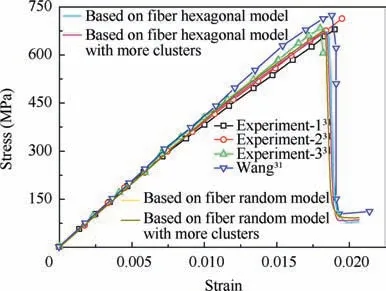
Fig. 11 Equivalent stress-strain curves predicted under tensile loading.
The main stress distribution patterns in fill and wrap tows are shown in Figs. 12-15 under tensile loading. Based on different microscale models, the stress distribution patterns at the strain 0.713%are very similar.There are slight differences in the transverse tensile stress distribution patterns of the two models.The periodicity of the stress is presented in the models.It can also be found that the crimp zones introduce remarkable bending-torsion effects and severe stress concentration.Under tensile loading along the wrap tows, the wrap tows bear the main load, as the fiber direction is the same with the loading direction. The fill tows are subjected to the transverse tensile and shear loadings.
The matrix damage distribution patterns in the wrap and fill tows at the strain 1% are shown in Figs. 16 and 17 from the mesoscale models based on different microscale models.It can be found that the maximum damage value in the fill tows is much larger than that from the wrap tows,which illustrates that under tensile loading,it is the transverse tensile and shear stresses in fill tows that result in the matrix damage initiation. With the increase of the loading, the matrix damage propagates to the wrap tows. From the matrix damage distribution patterns in the fill tows (Fig. 16), it can be found that the damage concentration regions are almost the same in the two models.However, due to the differences in the microscale models, the damage evolution curves at the critical point shown in Fig.16 are different.It can be found the damage initiation from the model based on fiber random distribution model is much earlier than that from the model based on fiber hexagonal distribution model.At the strain 1%,the maximum damage from the model based on fiber hexagonal distribution model is larger than that from the model based on fiber random distribution model. This demonstrates that the matrixdamage evolution speed for the model based on fiber random distribution model is slower.

Table 4 Critical values for damage initiation and failure.

Fig. 12 Stress distribution patterns for wrap tows from the model based on fiber hexagonal distribution model at strain 0.713%

Fig. 13 Stress distribution patterns for fill tows from the model based on fiber hexagonal distribution model at strain 0.713%

Fig. 14 Stress distribution patterns for wrap tows from the model based on fiber random distribution model at strain 0.713%.

Fig. 15 Stress distribution patterns for fill tows from the model based on fiber random distribution model at strain 0.713%.
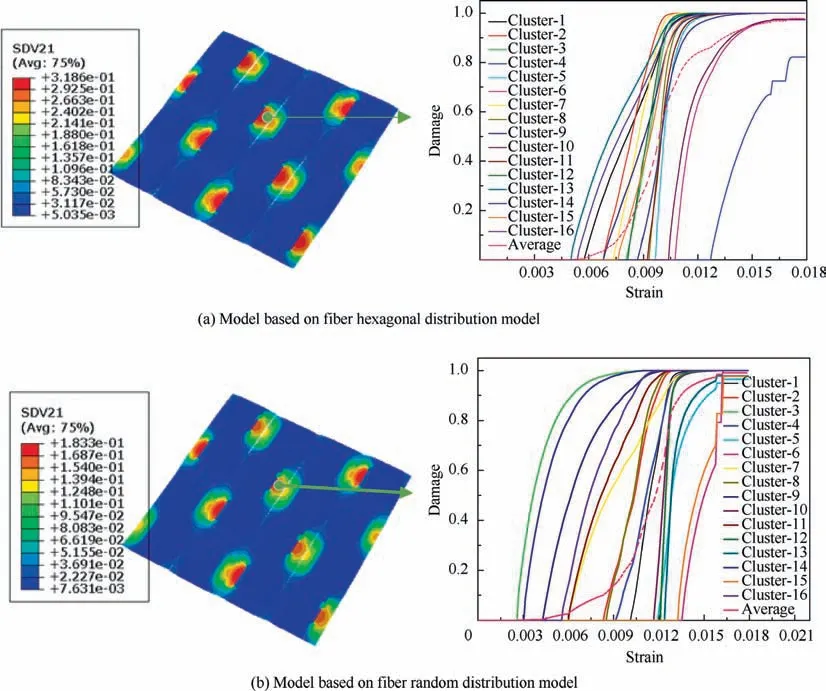
Fig. 16 Matrix damage distribution patterns in fill tows at strain 1% and the damage evolution curves.

Fig. 17 Matrix damage distribution patterns in wrap tows at strain 1%.

Fig. 18 Matrix damage distribution patterns at the catastrophic failure strain.
For the wrap tows, there is matrix damage in the model based on fiber random distribution model, but there is no matrix damage in the model based on fiber hexagonal distribution model at the strain 1%. As the fiber random distribution pattern results in larger microscale stress concentration under the same longitudinal shear loading conditions, it can be deduced that the differences in damage situations of wrap tows should attribute to the longitudinal shear stress. Matrix damage and fiber breakage distribution patterns are shown in Figs. 18 and 19 at the catastrophic failure strain. The differences in the failure patterns should result from the differences in fiber arrangement at the microscale.
4.3. Mesoscale analysis under compressive loading

Fig. 19 Fiber breakage distribution patterns at the catastrophic failure strain.
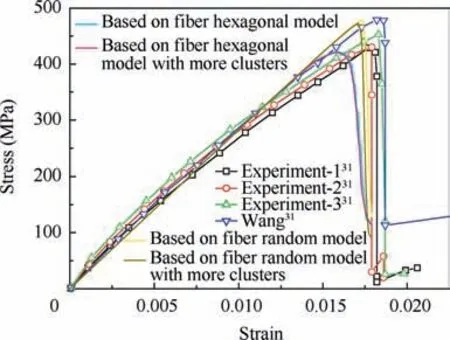
Fig. 20 Critical strain values for damage process under compressive loading.
Equivalent compressive stress-strain curves (Fig. 20) from the mesoscale models based on different fiber distribution models are compared with results from experiments and Wang.31The predicted curve tendency under compressive loading is essentially in accordance with the experimental and simulated results from Ref.31,which also demonstrates the effectiveness of the proposed multiscale modeling strategy. With the increase of the number of clusters,the responses of the models based on one kind of microscale model are almost the same.However, the failure strength and failure strain values of the models based on different microscale models are different.The critical strain and strength values for the mesoscale models are listed in Table 5. It can be found that the strain value for the matrix damage initiation from the mesoscale model based on fiber hexagonal distribution model is larger than that from the model based on fiber random distribution model. The result from the model based on fiber hexagonal distribution model is almost the same with that from the Wang.31For the catastrophic failure strain,the value from the model based on fiber random distribution model is almost the same with the experimental result and larger than that from the model based on fiber hexagonal distribution model. However, the tensile strength obtained from the model based on fiber hexagonal distribution microscale model is closer to the experimental result and smaller than that from the model based on the fiber random distribution model.
The stress distribution patterns in the wrap and fill tows are shown in the Figs. 21-24. The main stress in the wrap tows is the compressive stress along the loading direction.The longitudinal shear stress in the wrap tows is also shown in the Figs.21 and 23. For the fill tows, it is the transverse compressive and transverse shear stresses that are borne and shown in the Figs. 22 and 24. The stress values in the wrap and fill tows are almost the same for the models based on different fiber distribution models at the strain 0.886%.
The matrix damage distribution patterns in the wrap and fill tows at the strain 1.33%are shown in Figs.25 and 26 from the models based on different microscale models. For the model based on fiber hexagonal distribution model, it can be found that the maximum damage values in the wrap and twill tows are almost the same. For the model based on fiber random distribution model, the maximum damage value in the wrap tows is even larger than that in the fill tows.
The damage initiation regions for the two models are shown in Fig.27.For the model based on fiber hexagonal distribution microscale model, the matrix damage initiates from the crimp zones of fill tows, which is similar with the model under tensile loading. Then matrix damage propagates to the wrap tows and matrix pockets. However, in the mesoscalemodel based on fiber random distribution microscale model,the matrix damage initiates from the crimp zones of wrap tows. Then, it propagates to the fill tows and matrix pockets.Compared with the damage mechanisms under tensile loading,it can be deduced that it is the longitudinal shear stress that results in the damage initiation in the wrap tows of the model based on fiber random distribution model. From the damage evolution curves for the critical points (Fig. 25), it can also be found that the damage in the model based on fiber random model initiates earlier,but the average damage evolution speed is very slow.

Table 5 Critical values for damage initiation and failure.

Fig. 21 Stress distribution patterns for wrap tows from the model based on fiber hexagonal distribution model at strain 0.886%.

Fig. 22 Stress distribution patterns for fill tows from the model based on fiber hexagonal distribution model at strain 0.886%.

Fig. 23 Stress distribution patterns for wrap tows from the model based on fiber random distribution model at strain 0.886%.

Fig. 24 Stress distribution patterns for fill tows from the model based on fiber random distribution model at strain 0.886%.
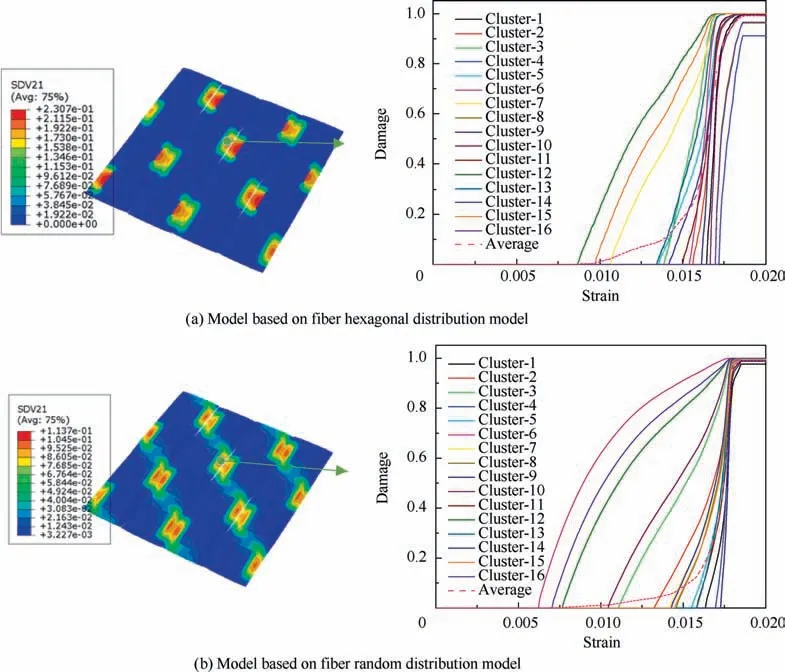
Fig. 25 Matrix damage distribution patterns in fill tows at strain 1.33% and the damage evolution curves.

Fig. 26 Matrix damage distribution patterns in wrap tows at strain 1.33%.

Fig. 27 Matrix damage initiation regions for the two models.

Fig. 28 Matrix breakage distribution patterns at the catastrophic failure strain.

Fig. 29 Fiber breakage distribution patterns at the catastrophic failure strain.
The failure patterns including matrix damage and fiber breakage at the catastrophic failure strain are shown in Figs.28 and 29,respectively.It can be found that the matrix damage is saturated at the crimp zones and the fiber breakages are in that region too. However, due to the differences in the fiber distribution at the microscale,the failure patterns of the two models are also different.
5. Conclusion
A modified multiscale framework based on micro-mechanics failure theory is developed to analyze the properties of 2D twill woven composites. The clustering method is adopted for the critical region chosen, so that the fiber random distribution model can be considered in the multiscale analysis method based on the MMF theory. The modification is implemented through ABAQUS and validated by comparing the predicted behaviors of the 2D twill woven composite with the published results. The primary conclusions are listed as follows:
(1) The offline analysis containing the elastic stress analysis and clustering analysis is conducted first for the multiscale analysis.The equivalent elastic parameters of tows are predicted from fiber hexagonal and random distribution microscale models under six mechanical loading cases. Comparing the two different microscale models,higher stress concentration appears in the fiber random distribution model due to the smaller inter-fiber distance except under the tensile loading along the fiber direction.Especially under the longitudinal shear loading, the maximum stress value is much larger than that from the fiber hexagonal distribution model. The clusters obtained from the clustering analysis illustrate the characters of stress distribution patterns.
(2) At the online analysis stage, with the SSAFs, the global responses of the 2D twill woven composite under tension and compression agree well with the experimental results. With the increase of the number of clusters,the predicted results change a little, which demonstrates the effectiveness of the modified multiscale analysis method and correctness of the chosen number of clusters.
(3) The failure mechanisms and damage evolution at mesoscale are also presented.Under tension and compression,the stress concentrates at the crimp zones in fill and wrap tows.Under tensile loading,the matrix damage all initiates from the fill tows and propagates to the wrap tows,which should attribute to the transverse tensile and transverse shear stresses. The matrix damage in the fill tows from the model based on the fiber random distribution model initiates earlier than that based on the fiber hexagonal distribution model. Under compressive loading, although the matrix damage also initiates from the fill tows in the model based on fiber hexagonal distribution model, the matrix damage initiates from the wrap tows in the model based on fiber random distribution model due to the longitudinal shear stress. It is also found that the fiber random distribution pattern contributes to the premature initiation of matrix damage in the tows,which consequently results in different damage propagation processes and failure patterns.
Acknowledgments
The authors would like to acknowledge the support of the National Natural Science Foundation of China (No.11572086), the Fundamental Research Funds for the Central Universities and the Scientific Research Innovation Program of Jiangsu Province College of China (No. KYLX16_0185),the Scientific Research Foundation of Graduate School of Southeast University of China (No.YBJJ1760) and the China Scholarship Council of China (No. 201706090076).
 CHINESE JOURNAL OF AERONAUTICS2020年7期
- CHINESE JOURNAL OF AERONAUTICS的其它文章
- An experimental method for squealer tip flow field considering relative casing motion
- A novel none once per revolution blade tip timing based blade vibration parameters identification method
- Highly efficient computation method for hazard quantification of uncontained rotor failure
- Optimal motion cueing algorithm for accelerating phase of manned spacecraft in human centrifuge
- Effective control allocation using hierarchical multi-objective optimization for multi-phase flight
- Fault-tolerant control and vibration suppression of flexible spacecraft: An interconnected system approach
