Microstructure, porosity and mechanical properties of selective laser melted AlSi10Mg
Jing CHEN, Wei HOU, Xiuzhuan WANG, Songlin CHU, Zhiyi YANG
Joint Laboratory of 3D Enable R&D Technology, AECC Aero Engine Control System Institute, Wuxi 214063, China
KEYWORDS AlSi10Mg;Mechanical property;Microstructure;Porosity;Selective laser melting
Abstract Finite element modeling (FEM), microscopy, X-ray computed tomography (CT) and mechanical property tests were used to study the microstructure, porosity and mechanical properties of an AlSi10Mg alloy produced by selective laser melting (SLM). The simulation of the melt pool and thermal history under different energy densities produced an optimized result with an energy density of 44.5 J·mm-3. The high cooling rate during the SLM process significantly refined the previous α-Al dendrites.The growth direction of the network-like Al-Si eutectic structure at different orientations confirmed the anisotropic nature of the microstructure.Furthermore,the microhardness,tensile testing and fracture analysis results proved that there were no obvious distinctions in the strength between the transverse and longitudinal directions,and that the ductility was anisotropic,possibly due to the shape and distribution of the pores.The pores measured by X-ray CT at different energy densities confirmed that the sphericity of the pores was inversely related to pores volumes. With optimized processing conditions, the porosity of the selective laser melted sample decreased leading to the improved fabricated fuel system component via SLM.
1. Introduction
In order to satisfy the increasing requirements of the aerospace industry,additive manufacturing (AM) has been widely investigated by many researchers for the production of functional components due to its high flexibility, rapid processing and its ability to form complex shapes.1-3Selective laser melting(SLM) has recently emerged as a promising AM technology that is capable of producing geometrically complex prototypes in a direct and efficient manner.4,5SLM is a solid fabrication process where the metal power is deposited layer-by-layer along a specific scanning path on a building platform based on a sliced digital model transformed from the threedimensional CAD model of the part.6This technology provides the highest geometrical flexibility and complexity for components relative to other traditional manufacturing routes7-9; it is especially suitable for the manufacture of complex fuel system components in aircraft engines. The SLM process involves numerous complex physical processes10;therefore, it is essential to analyze the process conditions and its respective effects on the microstructure, porosity and final mechanical properties of its produced parts.
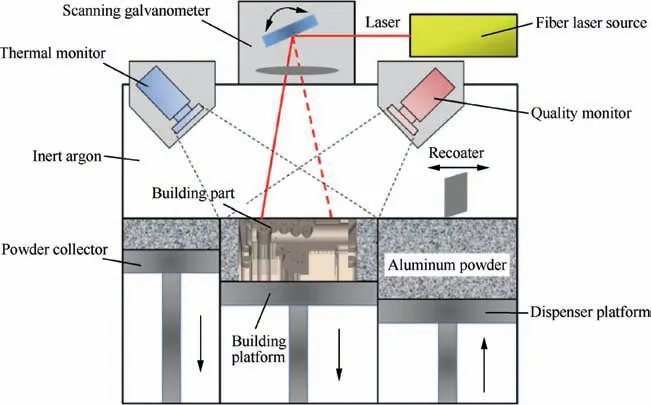
Fig. 1 Schematic diagram of a 400 W selective laser melting system equipped with a process control unit.
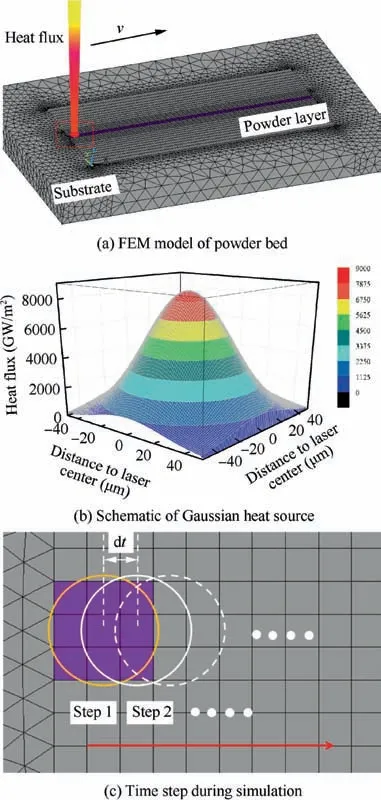
Fig. 2 Simple FEM model of single-bead melt pool simulation.
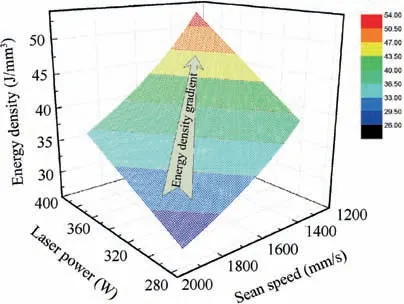
Fig. 3 Three-dimensional distribution of process parameters that shows energy density gradient during SLM.
With characteristics such as light weight, low coefficient of thermal expansion and high strength-to-weight ratio,AlSi10Mg alloys have been widely used in aerospace and automobile heat exchangers11,12as well as fuel system components.Many researchers analyzed the morphology and size of eutectic Si particles in AlSi10Mg alloys formed during solidification,13where the extremely high cooling rate during SLM not only refine grain size but also distribute the eutectic Si particles,which results in increased strength.11,14,15Others investigated the influence of microstructure anisotropy on the final properties of AlSi10Mg alloys.16-25It can be concluded that the microstructure of the AlSi10Mg material dictates its final mechanical properties.
The final mechanical properties of a fabricated part are influenced not only by its microstructure but also by its porosity,25especially when a high scanning speed, high process efficiency and low energy density are utilized during fabrication.Maskery et al.26researched the quantification and characterization of porosity in selective laser melted AlSi10Mg bulk samples using X-ray CT. Kim et al.27used three-dimensional image analysis to investigate the pore structure in selective laser melted cobalt chrome samples. However, the spatial dis-tribution, size and shape of the pores are dictated by the process parameters (such as laser power, scanning speed, and hatch spacing), which means that the pore size can be controlled by changing the process parameters. However, this work has not been thoroughly researched.

Table 1 SLM process parameters using in the thermal simulation.

Table 2 Chemical composition of the AlSi10Mg powder (wt%).
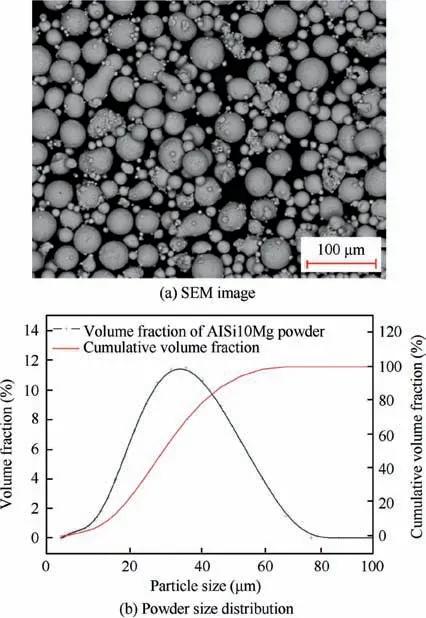
Fig. 4 Morphology and size of AlSi10Mg powder.
In this paper, process simulations were used to obtain the relationship between process parameters and melt pool characteristics during SLM. The AlSi10Mg bulk sample with optimized parameters was used to analyze the microstructure,pore features and mechanical properties. The contribution of this paper can be summarized as follows. On the one hand,the study of the microstructure and mechanical properties of the AlSi10Mg samples prove that finite element modeling can provide an efficient and precise method for process optimization.On the other hand,the pore characteristic is investigated as a function of different parameters and control the porosity of the selective laser melted AlSi10Mg. This understanding can serve as an effective process control approach for AM of fuel system components in aircraft engines.
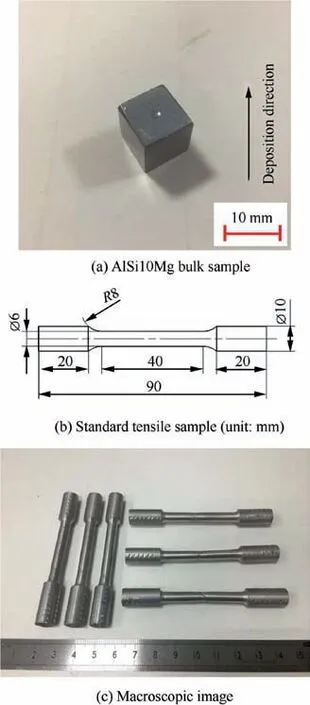
Fig. 5 Samples to be tested.
2. Experimental procedures
2.1. Experimental system
The SLM process in this paper was conducted using an EOS M290 SLM machine. A schematic view of the SLM system equipped with process control units was shown in Fig. 1. The thermal monitor was a FLIR A615 infrared thermal imager measured the temperature distribution during the SLM progress.The quality monitor was a CCD camera which captures the fabrication quality.The building platform had dimensions of 250 mm×250 mm×325 mm and was heated to 200°C.The aluminum powder on the powder bed was melted by a Nd: YAG fiber laser with a 400 W maximum beam power.The process environment during SLM was in an inert argon atmosphere. The pressure of the process chamber was set to 0.45 mbar,and its oxygen content was controlled under 0.1%.
2.2. Process simulation for parameter optimization
The thermal modeling was used to calculate the temperature field of the melt pool at different energy densities during SLM;the modeling results are used to establish optimized process parameters prior to the SLM experiments.
The thermal equilibrium equation for three-dimensional heat transfer within a material with isotropic thermal properties can be described by density ρ,specific heat C and thermal conductivity λ as28:

where ρ is the material density (kg·m-3), c is the specific heat capacity(J·(kg·°C)-1),T is the temperature(°C),t is the interaction time of powder and heat source (s), Q(x, y, z, t) is the heat generation per unit volume(W·m-3),and λ is the thermal conductivity (W·(m·°C)-1).
The basic theory of thermal modeling had been reported by many researchers and detailed in literature.28-31The finite element model (FEM) of a single-bead powder bed is shown in Fig. 2(a). A Gaussian heat source is loaded on the powder bed with the laser spot at 100 μm, which is illustrated in Fig. 2(b). Fig. 2(c) shows the loading step dt for the calculation.
Fig. 3 shows the three-dimensional distribution of the process parameters. The laser heat input uses the volume energy density function VED,32which is given as:

where P and v are the laser power and scan speed,respectively;h is the hatch spacing;and t is the layer thickness.It should be noted that the hatch spacing h (190 μm) and layer thickness t(30 μm)were regarded as constant values in a single-bead simulation and were derived from a previous study.33Thus, only laser power P and scan speed v are variables in Eq. (2). As shown in Fig. 3, the VED ranged from 26 J·mm-3to 54 J·mm-3(the energy density gradient is marked by arrow).To investigate the influence of the energy density on the thermal behavior of the melt pool, four groups of parameters at intervals of approximately 10 J·mm-3were selected along the arrow direction, as shown in Table 1.
2.3. Materials and sample fabrication
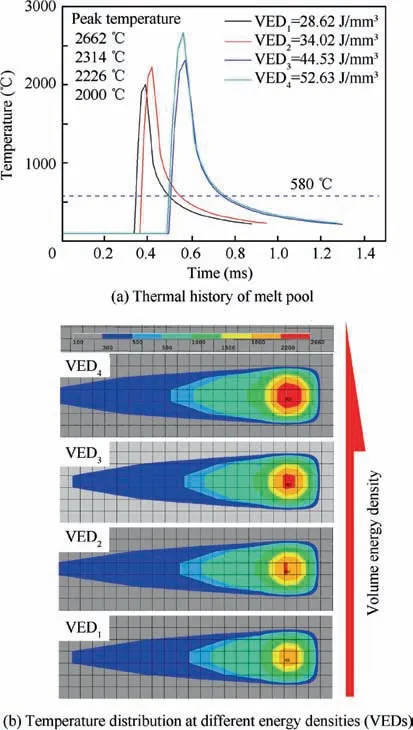
Fig. 6 Thermal simulation results of melt pool in SLM process.
The starting material for this study was a gas-atomized spherical AlSi10Mg powder.The chemical composition of the powder was shown in Table 2, and the SEM image in Fig. 4(a)reveals the micromorphology of the powder. The powder size distribution parameters of D10, D50 and D90 were 17.6,33.9 μm and 57.4 μm, respectively, as shown in Fig. 4(b).The SLM process parameters used for the samples were optimized and discussed in the following section. Prior to the experiment, the aluminum alloy substrate was heated to 100°C for a preheating treatment to reduce the residual stress and thermal deformation,34ensuring the stability of the fabrication process.
In the experiments, a 10 mm×10 mm×10 mm bulk AlSi10Mg sample and three groups of standard tensile test samples are fabricated, as shown in Fig. 5(a) and (c). After that, the deposited samples are annealed at 300°C for 2 h to eliminate residual stress. The tensile test samples were machined according to GB/T 228.1-2010, and are shown in Fig. 5(b).
2.4. Microstructure characterization and mechanical test
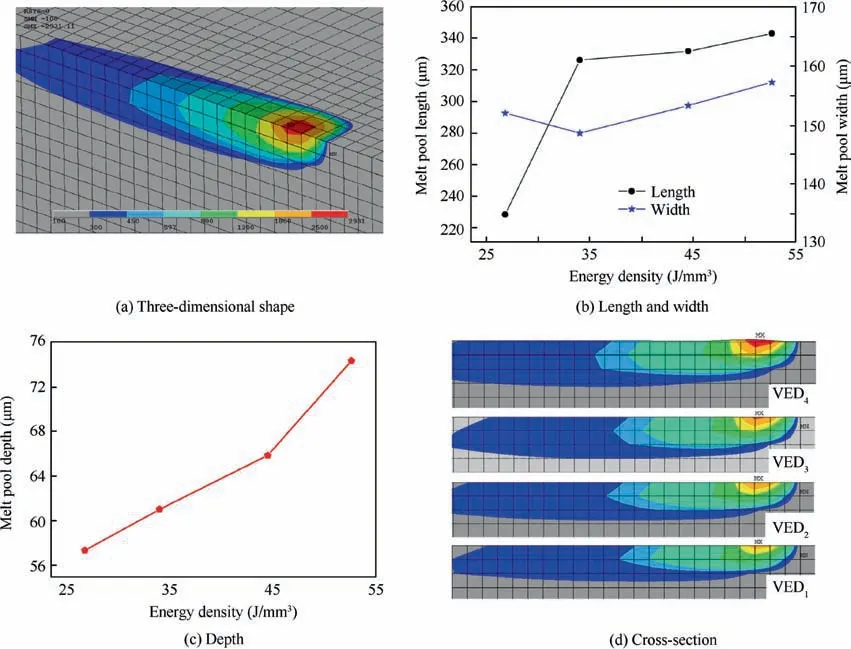
Fig. 7 Simulation results show melt pool morphology under different energy densities (VED).
The AlSi10Mg sample was polished and etched for 10 s with Keller’s reagent (HF:HCl:HNO3:H2O=1:1.5:2.5:95) to reveal its grain boundaries. An Axio Vert.A1 research-grade instrument was used for optical microscopy (OM), and a SIGMA HV Zeiss instrument was used for scanning electron microscopy (SEM) analyses. The hardness values were determined from an average of ten indentations per sample using an EMV-4500LR Vickers indenter. The room temperature tensile test of the AlSi10Mg samples was conducted using a WDW-50 electronic universal testing machine, and the test was carried out using three groups of tensile samples in the transverse and longitudinal directions. The separation rate used in the experiment was 2 mm/min. The fracture morphology of the samples was imaged using the SEM.
2.5. X-ray computed tomography
X-ray CT measurements were performed with a Zeiss Metrotom 1500 X-ray microscope (XRM). The source was an Xray tube with a variable accelerating voltage of 30-160 kV in this work,an accelerating voltage of 155 kV was used.During imaging,the AlSi10Mg sample was positioned at a distance of 15 mm from the X-ray source and 155 mm from the detector.The images presented here were then reconstructed from the radiographs by filtered back-projection. The pixel size was 400 μm×400 μm,and the theoretical maximum spatial resolution for this apparatus was 3.5 μm. However, the resolution is difficult to accurately define and is influenced by several factors, including beam hardening, the center of rotation, and penumbral blurring (due to the finite X-ray source size). The sample was rotated around its z-axis in 1800 steps, and each orientation exposed for 2 s.
3. Results and discussion
3.1. Process parameter optimization
To determine the effect of laser power and scan speed on the melt pool character during SLM, simulations with different VEDs,as shown in Eq.(2),were conducted using the proposed model. The thermal history results with different VEDs are shown in Fig. 6(a). Maximum temperatures for the models with different scan speeds and laser powers were obtained.The peak temperature increased with increasing VED, and when the VED was 52.63 J·mm-3, the peak temperature in the melt pool reached 2662°C, which could lead to excessive evaporation of the liquid metal. Fig. 6(b) shows the temperature distribution as the VED increased.It should be noted that the melt pool could be overheated when the VED reached 52.63 J·mm-3or could experience a lack of heating when the VED reached 28.62 J·mm-3and 34.02 J·mm-3. Thus,VED=44.53 J·mm-3can provide a relatively uniform thermal distribution in the melt pool.
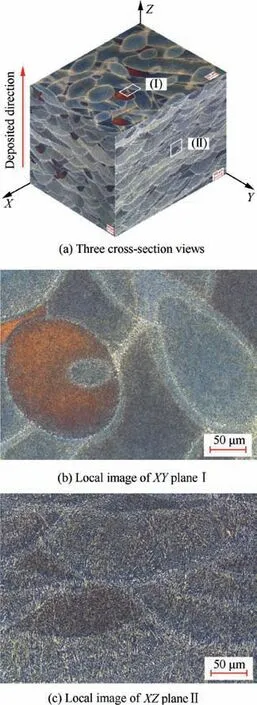
Fig. 8 Three cross-section views of SLM bulk sample.
Fig. 7 shows the influence of scanning speed and laser power on the length, width and depth of the melt pool during SLM of the AlSi10Mg powder.The length,width and depth of the melt pool are dependent on the VED and measured based on the pixel count with a pixel size of 1 μm. Fig. 7(b) shows that the length of the melt pool increased nearly linearly with the increasing of VED,while it had no significant effect on the width of the melt pool.This phenomenon occurred mainly due to the scanning speed being extremely high(≥1300 mm/s),and the temperature gradient along the length direction is less than that along the width direction in the melt pool. Furthermore,the depth of the melt pool in Fig. 7(c) shows a strong linear relationship with energy density,which is similar to the results described by Guo et al.30It can also be seen that as the energy density increased to 52.63 J·mm-3, the depth of the melt pool substantially increased reaching ~75 μm (which is double the layer thickness of 30 μm). As a result, a relatively stable melt pool was obtained when the VED reached 44.53 J·mm-3,which was taken as an optimized parameter in this study.
3.2. Microstructure
The microstructure of the bulk sample fabricated using the optimized parameters are investigated subsequently. In Fig. 8(a), three cross-section views of the bulk sample are shown.Upon etching, the long scan vectors are revealed in the top(Fig. 8(b)) and side views (Fig. 8(c)), and the cross-sections of the melt pools are visible in the top view. The profile of the melt pools at different directions can be seen due to the raster scanning of the laser during the forming process,where the scanning direction is 67° per layer. Due to the half-cylindrical shape of the melt pool and the partial re-melting of the previously deposited layers, the cross-sections of the melt pools from the different layers can be seen in the top view.It should be pointed out that due to variations in the depth and shape of the melt pools,they are not always continuous(Fig.8(b)).The size of the melt pools can be determined using the crosssections of the top melt pools in the front view. Based on the pixel count, the melt pool width (based on the measured half-width) is 150±15 μm.
Analysis of the growth of the Al-Si eutectic structure in laser solid forming (LSF) confirmed that under high cooling rates,the Al-Si eutectic structure nucleated in the liquid phase between the dendrites independently then grew in a coupled manner.34-36Contrary to the LSF process,the continuous precipitation of Si particles between the liquid of primary α-Al dendrites is finer during SLM. Fig. 9(a)shows the growth orientation of Al-Si eutectic in the cross-section of the bulk sample, imaged using a scanning electron microscopy (SEM). The effect of a high cooling rate on the microstructure reveals that the cellular-dendritic Al-Si eutectic structure is very fine and has a size of smaller than 1 μm,as shown in Fig.9(b).The gray cellular features are primary Al and are decorated with white fibrous Si particles. The white dashed lines in Fig. 9(a)represent the melt pool boundary, while the arrows indicate the general growth orientation. The typical epitaxial growth is evident in Fig. 9, while the growth direction of the Al-Si eutectic structure remained along the normal line of the melt-pool boundary.
Across the melt pool, three different zones can be distinguished, as indicated in Fig. 10(a) (1)-(3). The different zones included fine and coarse cellular structures inside the melt pool and a heat-affected zone (HAZ) around the melt pool. In the former the Si phase precipitated between adjacent α-Al dendrites and appeared to form a fine network structure.The fineness of the Al-Si network is not constant,and a transition from fine cells (cell size of 0.5-1 μm) to coarse cells (cell size of 1-2 μm) can be observed at ~5 μm from the melt pool border(Fig. 10(b) (2)). Outside the melt pool, the fine intercellular network is broken due to the coarsening of the silicon phase.This is caused by the increase in the diffusion rate of the Si phase in the HAZ,which is formed by the heat input in previously deposited layers (Fig. 10(b) (3)).
3.3. Mechanical properties
To study the relationship between the microstructure and mechanical properties of the optimized sample,we first obtain the Vickers hardness of the sample along the transverse and longitudinal directions, with the results shown in Fig. 11.Fig. 11(a)-(c) show that the microhardness test is conducted with ten testing points at intervals of 200 μm along the transverse and longitudinal directions. The Vickers hardness value in the transverse direction is approximately 100 HV,while the value in the longitudinal direction decreased to 90 HV. These observations provided obvious evidence that the microhardness was anisotropic in the selective laser melted AlSi10Mg alloy. Due to the fine dispersion of Si in the Al phase, the Vickers hardness of the as-fabricated AlSi10Mg selective laser melted parts is very high, namely, 114±3 HV.24However,in this paper,a low annealing heat treatment (300°C) was carried out, which caused the microhardness of the sample to decrease to 90-100 HV along different building orientations.
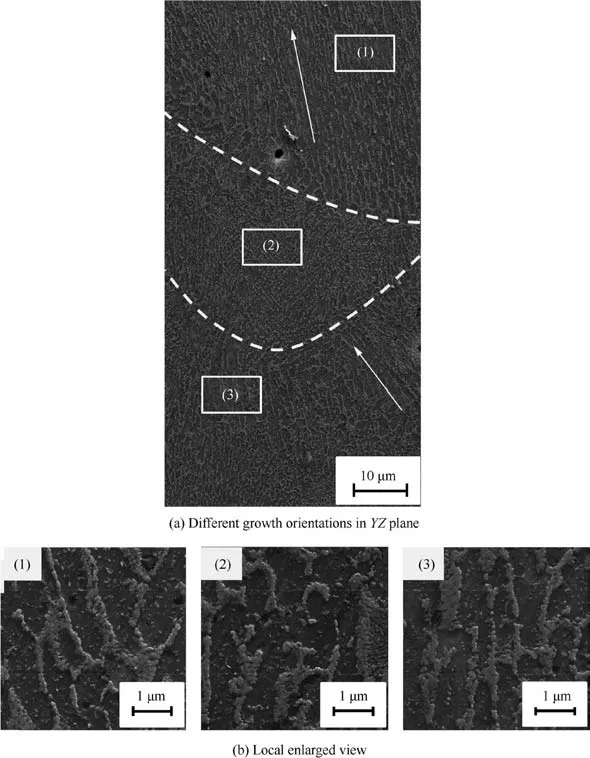
Fig. 9 Microstructures of AlSi10Mg SLM bulk sample in YZ plane by SEM, white dashed line shows the boundary of melt pool, and white arrows present growth direction of dendrites.
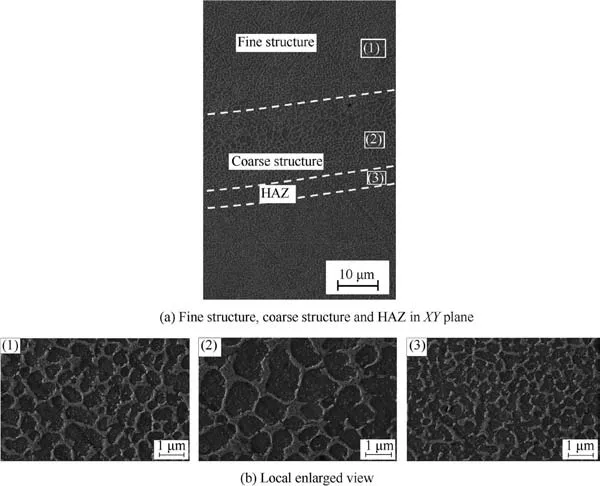
Fig. 10 Microstructures of AlSi10Mg SLM bulk sample in XY plane by SEM.
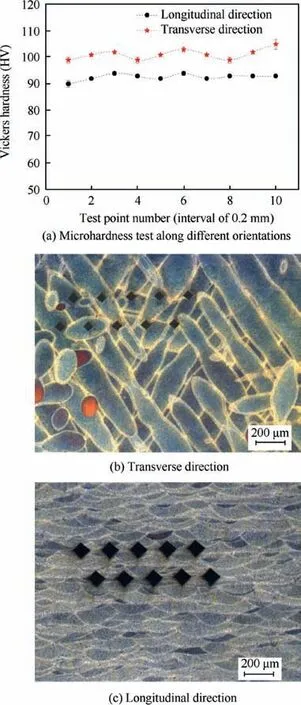
Fig. 11 Microhardness test of SLM sample.
The engineering stress-strain curves in Fig.12(a)show that the strength (yield stress-YS and ultimate tensile stress-UTS)of the samples in the transverse and longitudinal directions are approximately similar. However, there is an impact of the orientation on the measured ductility, as the ductility is higher in the longitudinal direction relative to the transverse direction, which contradicts the results reported in previous DED studies.37,38Therefore, we hypothesize that the ductility in transverse samples is limited by the presence of lack-offusion porosity, which will be described in the following section.
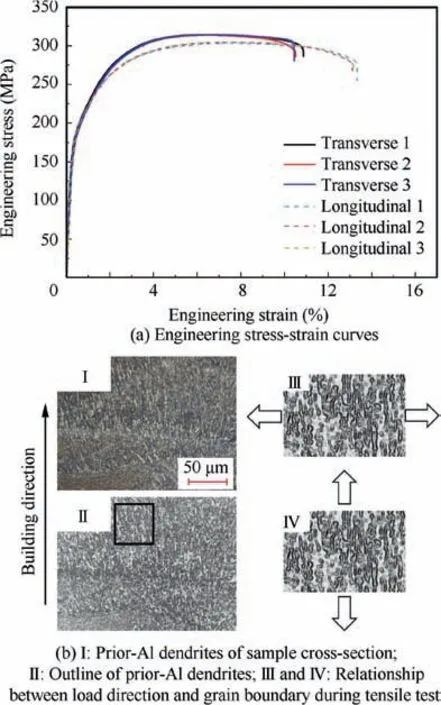
Fig. 12 Engineering stress-strain curve of representative samples.
Another possible mechanism for the anisotropy in the ductility is directly related to the anisotropic microstructure of the parts produced by AM, as shown schematically in Fig. 12(b),where the stress is applied along the transverse direction, and only a small amount of prior Al dendrite boundaries were subjected to tension. Conversely, a large amount of the prior Al dendrite boundaries are loaded in tension when the stress is applied in the longitudinal direction, causing the entire length of the grain boundaries to be subjected to tension.
The high strength of the selective laser melted AlSi10Mg samples after annealing treatment in this paper can be attributed to grain refinement. The effect of the grain size on the mechanical properties can be understood by the semiempirical Hall-Petch relationship,18which is detailed in Eq. (3):

where σ is the strength of the material, σ0is the resistance stress for dislocation movement,k is the Hall-Petch coefficient,and d is the grain size. Grain size refinement leads to a reduction of the distance between Si particles, which can contribute to the strength improvement because the refinement of the grain size can not only increase the amount of grain boundary, but creating a large quantity of Al-Si interface at the same time, which can effectively reduce the movements of dislocations.
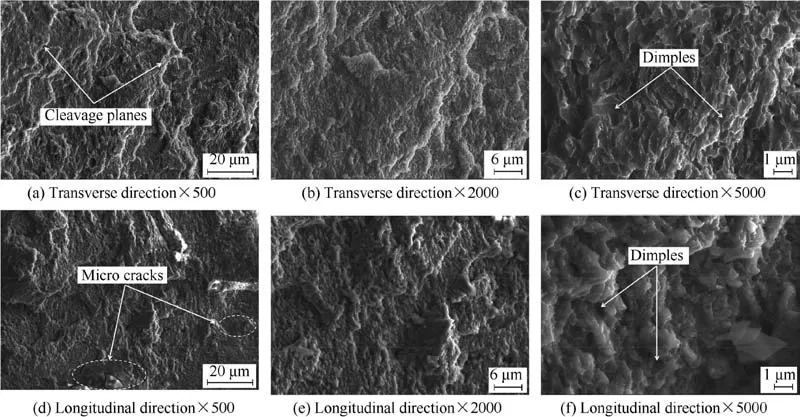
Fig. 13 SEM images of the fracture surface of the SLM AlSi10Mg samples.
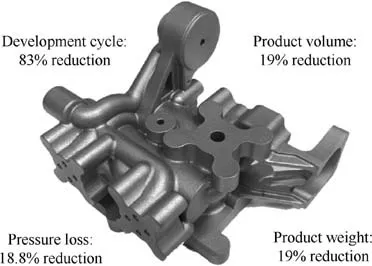
Fig. 14 Typical fuel system component fabricated by SLM.
Fig. 13 shows the fracture surfaces of the AlSi10Mg samples in different building directions. The fracture surface of the sample in the transverse direction is illustrated in Fig.13(a)-(c).The‘‘river pattern-like”stepped cleavage planes(marked by white arrows in Fig. 13(a)) show a typical brittle fracture, which is consistent with the low ductility shown in Fig. 12. However, the dimples in Fig. 13(c) appear extremely shallow, indicating that there is not substantial plastic deformation when the stress is loaded.Relative to those of the transverse direction, the fracture surfaces in the longitudinal direction have deeper dimples with a size of ~1 μm (marked by white arrows in Fig.13(f)),which indicates a fracture model based on microvoids. In addition, microcracks are evident in Fig. 13(d) (marked by white arrows), indicating that stress is concentrated at the interface of the α-Al/Si. Fig. 14 shows the typical fuel and actuation system components fabricated by SLM under the previously obtained optimized parameters.
3.4. Pore character analysis
As shown in Fig. 9, pores are common in the selective laser melted bulk sample. However, pores produced by the SLM process can become a critical defect and significantly decrease the mechanical properties of the sample.39Thus, the effect of process parameters on the pore characteristics was investigated and with the goal of controlling the porosity of the selective laser melted sample. The location and shape of the typical pores in the SLM bulk sample fabricated with the optimized parameters are shown in Fig. 15(a) and (b), respectively.Fig.15 shows the X-ray CT 2-D cross-section of the SLM bulk sample, where a microscopic, discontinuous distribution of pores along the deposited direction is evident. However, the diameter of individual pores exceeded 150 μm which indicates that even if the VED is quite high, the porosity of the SLM sample can be significantly affected by the scanning speed. In addition, the shape of the pores is far from spherical, as can be seen in Fig.15.As a consequence,high stress concentrations will likely forms around these pores when the sample is mechanically loaded normal to the plane of the pores or parallel to the build direction, as shown in Fig. 12.
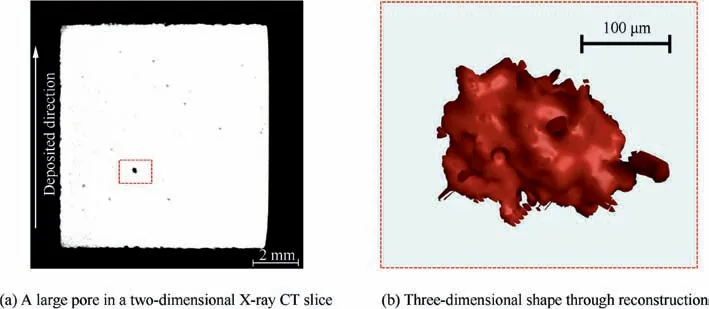
Fig. 15 Typical pore in selective laser melted bulk sample.
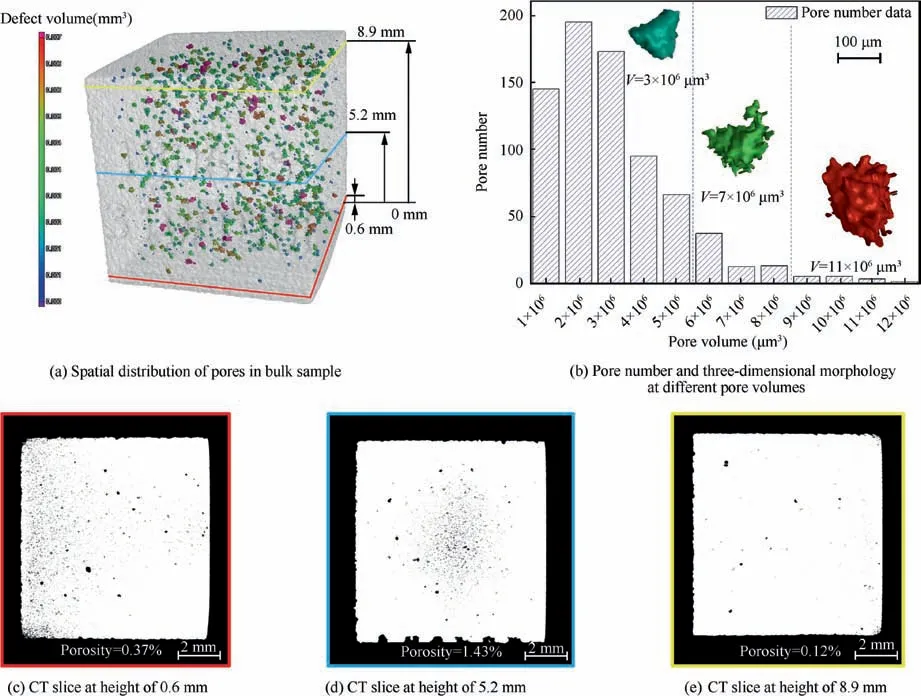
Fig. 16 Spatial distribution of pores through reconstruction in selective laser melted bulk sample built by optimized parameters.
The three-dimensional spatial distribution and shape of the typical pores through reconstruction in the selective laser melted bulk sample built by optimized parameters are shown in Fig.16(a).In order to analyze the pore distribution at different build heights, we extract three X-ray CT slices along the building direction, which have distances of 0.6, 5.2 mm and 8.9 mm from the samples bottom.The true spatial distribution of the pores confirms that the porosity is still a significant phenomenon despite the VED reaching high values. The relationship between the pore volume and pore number in the sample in Fig.16(b)confirms that the vast majority of the pore volume are less than 5.5×106μm3; there are pores with volumes between 5.5×106μm3and 8.5×106μm3. However, only a few of the pore volumes exceed 8.5×106μm3. In addition,the shape of the pores tends to become spherical as the pore volume decreased, while the large pores have an obvious anisotropy. This means that the small, nearly spherical pores distributed in a diffused way can significant release stress concentrations, as shown in Fig. 16(c)-€, which can improve the mechanical properties of the selective laser melted parts.
The energy density can significantly affect the value of the global porosity.26Based on the results of the thermal simulation and pore spatial distribution mentioned above, we better understand the influence of the volume laser energy density VED on the pore distribution characteristics.
Fig. 17(a) shows three bulk samples with a volume energy density VED1=28.6 J·mm-3, VED2=34.1 J·mm-3and VED3=44.5 J·mm-3. The scanning speed used in this paper is quite high (>1000 mm/s) because we suspect that under a relatively high laser power(>300 W),the high scanning speed can simultaneously improve the process efficiency and produce dense areas. Fig. 17(b)-(d) shows that the sphericity of the pores can be expressed as a function of the pore diameter under different VEDs. It is interesting to note that samples 1, 2 and 3 possessed different energy density inputs, while the pore diameter distributions under 150 μm are quite similar.In addition,when the pore diameter is ~100 μm,the sphericity is distributed between 0.5 and 0.7.However,the sphericity distribution mentioned above tends to be significantly different when the pore diameter exceeds 200 μm. Thus, it can be hypothesized that pores with diameters lower than 150 μm are determined by the hatching space (190 μm), which is not accounted for during process optimization. Pores with diameters exceeding 200 μm could be affected by VED.
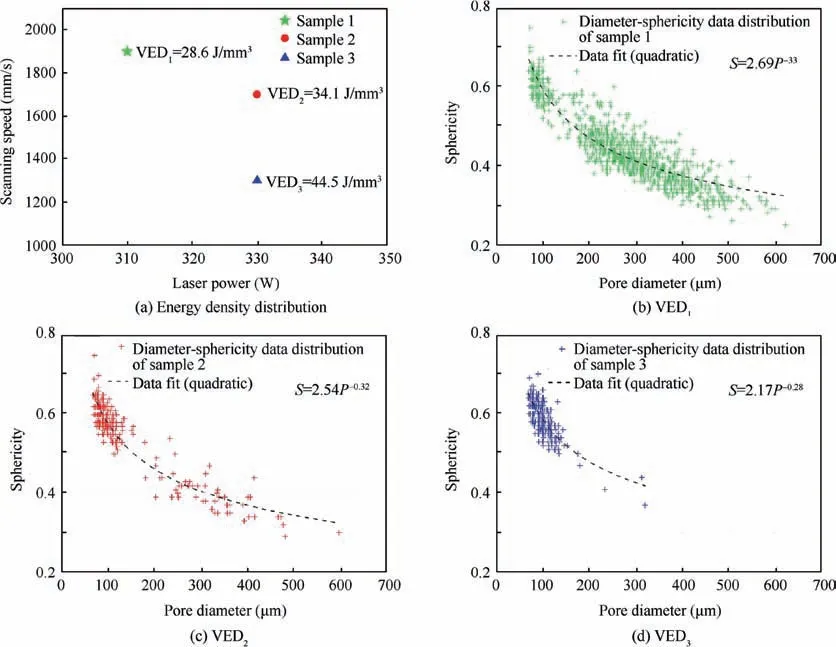
Fig. 17 Energy density distribution based on the thermal simulation results and pore sphericity under different energy densities.
4. Conclusions
The relationship between the process parameters, microstructure, porosity and final mechanical properties of a selective laser melted AlSi10Mg sample is investigated in this work.Based on the presented results and discussion, the following conclusions can be drawn:
(1) The SLM process simulation by finite element modeling provided a rapid and precise approach for parameter optimization prior to the experiment. A subsequent study of the microstructure with optimized parameters proves that an extremely fine microstructure can be obtained by the nucleation of a fine Al-Si eutectic structure between the primary α-Al dendrites.
(2) The microhardness test reveals that the hardness value in the transverse (100 HV) direction is higher than the longitudinal (90 HV) direction. The engineering strainstress curve at different orientations also shows anisotropy in the strength and ductility, which is possibly due to the orientation between the tensile stress and crystal growth direction. The fracture morphology further verifies that the anisotropy of mechanical properties depends on the anisotropy of the microstructure of AlSi10Mg sample.
(3) The pore sphericity at different energy densities shows that the VED significantly influence the large pores(diameters exceeding 150 μm), while it is not sensitive to pores with diameters smaller than 150 μm. The location, shape and magnitude of the pores by optimizing the VED can be controlled to improve the fabrication of fuel system components by SLM in order to meet the high quality requirements for aircraft engines.
Acknowledgements
The authors would like to appreciate the financial support from the National Key Research and Development Program of China (No. 2018YFB1106400).
 CHINESE JOURNAL OF AERONAUTICS2020年7期
- CHINESE JOURNAL OF AERONAUTICS的其它文章
- An experimental method for squealer tip flow field considering relative casing motion
- A novel none once per revolution blade tip timing based blade vibration parameters identification method
- Highly efficient computation method for hazard quantification of uncontained rotor failure
- Optimal motion cueing algorithm for accelerating phase of manned spacecraft in human centrifuge
- Effective control allocation using hierarchical multi-objective optimization for multi-phase flight
- Fault-tolerant control and vibration suppression of flexible spacecraft: An interconnected system approach
