Aero-optical effects simulation technique for starlight transmission in boundary layer under high-speed conditions
Bo YANG, Zichen FAN, He YU
School of Astronautics, Beihang University, Beijing 100083, China
KEYWORDS Aero-optical effect;Boundary layer;Celestial navigation for highspeed aircraft;Coherent structure;Starlight transmission
Abstract Aero-optical effects for starlight transmission in the high-speed flow field will reduce the accuracy of the star sensor on an aircraft. Numerical simulations for aero-optical effects usually require plenty of calculations, which cause difficulties when designing a celestial navigation system for a high-speed aircraft. In this study, an Aero-Optical Simulator For Starlight Transmission(AOSST)in the boundary layer is developed.It effectively reduces the computational burden compared to that of the widely used CFD simulation,and it achieves satisfactory accuracy.In this simulator,gas ellipsoids satisfying certain design rules are used to simulate coherent density structures in boundary layers. Design rules for the gas ellipsoids are found from published experimental and high-fidelity CFD simulation results. The generated wavefront distortion by AOSST is anchored with the scale law for aero-optical distortion in the boundary layer by determining some control parameters,which enables the simulator to output reliable results over a wide range of flight states.Four numerical examples are provided to verify the performance of AOSST. The results demonstrate that AOSST is able to simulate the directional dependence of aero-optical distortions in boundary layers, the variation trend of distorted wavefront shapes with Reynolds number, and the grayscale distribution on the disturbed star map.
1. Introduction
Celestial navigation is a type of autonomous navigation method with high precision, in which the star sensor receives starlight passively and does not send signals to the outside.As a result,it has good concealment.The inertial-celestial integrated navigation is an autonomous navigation scheme widely used in low-speed aircraft and most spacecraft.1In recent years, applications of the celestial navigation are being extended to high-speed,supersonic,and hypersonic vehicles.2,3However, aircraft operating in the atmosphere are subject to atmospheric optical and aero-optical effects when receiving starlight. The effects of the atmosphere on starlight transmission have been extensively studied over the past few decades,and most of the effects on astronomical observations can be compensated by adaptive optics.4Under high-speed conditions,the aero-optical effect is a non-negligible factor affecting the imaging quality of an optical sensor,including image blurring, deviation, and jitter. These effects will reduce the accuracy of star centroid acquisition in celestial navigation,5which increases the error and failure probability of star identification. Aero-optical effects are caused by fluctuations of refractive index in the flow field. A parallel beam passing through an inhomogeneous refractive index field will produce a phase difference on the wavefront, called wavefront distortion, which will reduce the energy concentration on the image plane.In an aircraft,turbulence near the optical window is the main cause of aero-optical effects.6
In the past few decades, the research background of aerooptical effects has mainly included infrared seeker imaging,7airborne laser communication8and airborne directed energy weapons.9In recent years,the aero-optical problem in celestial navigation has attracted attention with the development of supersonic vehicles and the increasing demand for a highprecision autonomous navigation method.3The research purposes on aero-optics in celestial navigation are similar to those in infrared seeker imaging, both of which aim to correct or restore images for high-precision measurements.
Some reviews of recent theoretical and experimental studies of aero-optical effects can be found in Refs.6,10,11.An important goal in studying aero-optical effects is to estimate the energy concentration on the image plane. The Mare´chal approximation can estimate the Strehl Ratio (SR) of light intensity (far field) using the root mean square of the Optical Path Difference(OPDrms),which is a widely verified theoretical formulation.11,12Another important theoretical achievement is the linking equation given by Sutton,13which relates the statistical properties of a turbulent medium to those of aero-optical aberrations. Gordeyev et al. developed a model (scaling law)for aero-optical distortions in boundary layers based on the linking equation,14which can predict the time-averaged OPDrmswhen the Mach number is less than 5.8.11Earlier Wyckham and Smits had proposed a similar prediction model.15The directional dependence of optical distortions is a feature of boundary layers,appearing as the OPDrmsvarying with the elevation angle of beam. The anisotropic behavior of the boundary layer can explain this phenomenon, since the density correlation length along the downstream direction is longer than that along the upstream direction.14,16-18
An important step in studying aero-optical problems in celestial navigation is to obtain the distorted wavefront of the incident starlight. Wavefronts obtained through flight and wind tunnel experiments are very close to those in the real environments, but only a few researchers can afford the high experimental cost. Therefore, the scheme, in which the flow field is calculated by a CFD simulation and the distorted wavefront is calculated by the ray tracing method, is widely adopted. But only the Large Eddy Simulation (LES) that meets the grid resolution requirements can obtain accurate results.19The widely used Reynolds-Averaged Navier-Stokes(RANS) equations simulation, which usually has insufficient grid resolution and employs the ensemble average method,cannot be used to derive unsteady distorted wavefronts.6
LES is an expensive simulation method, which requires plenty of computing resources and time. In the design process for the star sensor on a high-speed aircraft, research requirements for a large number of flight states will greatly increase the complexity of the work.It is necessary to develop a numerical simulation method that requires less computation and achieves satisfactory accuracy.Trolinger et al.proposed a simulation technique for aero-optical effects based on the random phase screen method.20,21Randomly distributed gas spheres are used to simulate vortex structures in turbulent layers,which can supplement the small-scale vortex structure that the CFD grid cannot resolve. The size and density of the gas spheres conform to some design rules that are determined from the experiments and experience.Due to the small computation requirement, this aero-optical simulation technique can generate plenty of distorted wavefronts in a short time, providing engineers with a convenient method to design and test the performance of optical instruments.
Motivated by the random phase screen method of Trolinger et al.,20,21we develop an Aero-Optical Simulator for Starlight Transmission (AOSST), which can simulate aero-optical effects caused by Turbulent Boundary Layers (TBLs) near the optical window. Our simulator can generate distorted wavefronts according to the input flight states in short time. It provides a quick simulation approach to design the celestial navigation system on a high-speed aircraft and has the following features:
(1) Gas ellipsoids with specific tilt angle and oblateness are used to simulate density coherent structures in TBL,which enable AOSST to simulate the directional dependence of aero-optical distortions. The density field generated by gas ellipsoids is shown in Fig. 1.
(2) Design rules for gas ellipsoids in AOSST satisfy the general distribution laws of coherent structures determined from published experimental and high-fidelity CFD simulation results,which guarantees the reasonability and reliability of simulation results. The OPDrmsgenerated by AOSST is anchored with the Boundary Layer aerooptical effects Prediction Model(BLPM)14by determining some control parameters. The control parameters change adaptively with the input Mach number and Reynolds number, which enable AOSST to simulate a wide range of starlight reception condition. In addition, the control parameters are attached to specific physical meanings,which can help engineers understand the aero-optical effects from the perspective of coherent structures.
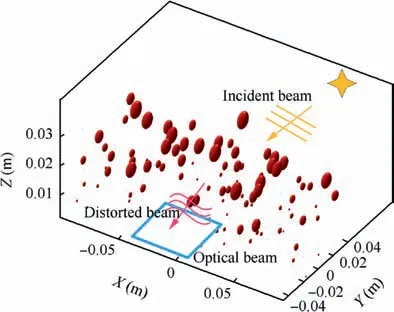
Fig. 1 Starlight transmits in density field generated by gas ellipsoids.
Although the AOSST is motivated by Trolinger et al.,20,21the design method of our simulator is quite different. The method of Trolinger et al. is based on an idea of supplementing/aiding CFD directly, in which the density field generated by gas spheres is superimposed into the density field calculated by CFD. Under this idea, as explained in Refs. 20,21, the gas sphere is equivalent to the sub-grid model in CFD. Therefore,it is a part of a complete CFD simulation. Specifically, in the method of Trolinger et al.,20,21a CFD simulation is first conducted under the given flow condition to obtain a ‘‘background density field”. Then the density fields with high spatial resolution are generated by using the gas sphere model.The model can generate many different density fields, because the density values and position distributions of gas spheres are probabilistic models. Finally, the density fields with high spatial resolution are superimposed into the‘‘background density field”to obtain a complete density field which is used to calculate the distorted wavefront in aero-optical simulation. However, the method of this paper is based on an idea of supplementing/aiding CFD indirectly to generate unsteady density fields quickly, in which the density field generated by gas ellipsoids is used as the complete density field in aerooptical simulation. This means that our simulator runs independently after the design is completed, and there is no need to cooperate with CFD simulation every time the simulator is run. Although CFD results are not used in our method, it does not mean that CFD can be replaced by our method. In this study, the distribution rules and design parameters of gas ellipsoids come from the CFD results. We conclude the prior knowledge for simulator design from published experimental and high-fidelity CFD results on aero-optical effects.In addition, the purpose of using the density field generated by gas ellipsoids as the complete density field in aero-optical simulation, not like the method of Trolinger et al.,20,21is to reduce the number of design variables, which can help anchor AOSST with BLPM by determining the control parameters.
In general, the common purpose of both the method in this paper and the method of Trolinger et al.20,21is to reduce the computational burden of aero-optical simulation, and the approach of constructing random phase screen with artificial vortex structure is adopted. The difference lies in the way how the density field is generated by the artificial vortex structure and how the density field calculated by CFD coordinates with each other.
The remainder of the paper is organized as follows:In Section 2, the design rules for gas ellipsoids are all given. In Section 3, methods to determine the control parameters are presented. Four numerical examples to verify the accuracy of AOSST are provided in Section 4 accompanied by the results and discussion. Finally, the conclusion is drawn in Section 5.
2. Design rules for gas ellipsoids in AOSST
The gas ellipsoid is the approximation of the vortex structure that exhibits anisotropic behavior in TBL, whose properties are critical to the accuracy of AOSST and are the core of the simulator design. Therefore, in order to obtain accurate simulation results,design rules for gas ellipsoids should conform to actual distribution laws and characteristics of vortex structures in TBL, including the three-dimensional position, size, tilt angle, oblateness, and the density difference of the gas ellipsoid. All the design rules are presented in this section, and the control parameters in these rules are determined in Section 3.
Initially we define the flow field space simulated in AOSST.Since the incident starlight is mainly affected by the flow near the surface of the optical window, the simulation space of AOSST is set as a three-dimensional space covering the optical window.The size of the optical window is 50 mm×50 mm,representing the aperture size of the star sensor. The size of the simulation space for the density field (Fig. 2) is 200 mm(X)×100 mm(Y)×30 mm(Z), where 200 mm×100 mm represents the length and width. 30 mm represents the thickness of the simulated boundary layer,which takes a fixed value in all flight states in order to reduce the number of variables in the design process.The optical window of a high-speed aircraft is usually a conformal window (not a concave window) in order to reduce aerodynamic drag and aerodynamic heat. The TBL on the surface of the conformal window is similar to that of the flat-plate; therefore, results about flat-plate boundary layers in the literature are referred to in the design process of AOSST.The OXYZ in Fig.2 is defined as the flow coordinate system.Origin O is at the geometric center of the upper surface of the optical window. The positive direction of the X-axis is the flow direction and the Y-axis is the span direction. The Z-axis is perpendicular to the surface of the optical window and points to the outside of the aircraft, representing the height from the wall. The flow coordinate system is used to design all rules and control parameters in AOSST, as well as to calculate the Optical Path Length (OPL) of the incident starlight.
2.1. Position of gas ellipsoid
The outer region of the boundary layer is active from an optical standpoint and is the dominant contributor to the wavefront distortion.16,22The Optical Path Difference (OPD) has only a little reduction after removing the small-scale turbulence structures in the density field,16,18which indicates that wavefront distortions are predominantly caused by largescale coherent structures in TBL. Therefore, one ought to focus on large-scale structures in the outer region when designing rules for gas ellipsoids. We use an increasing function to describe the relation between the distribution of gas ellipsoids and the height from the wall. The function assigns more gas ellipsoids to the outer region that contributes more to wavefront distortions.Finally,the position rule for the gas ellipsoid is designed to be a probability distribution about the height from the wall.
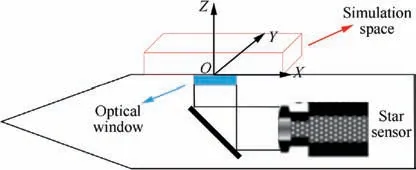
Fig. 2 Flow field simulation space of AOSST.
Rule 1 The distribution of gas ellipsoids at different heights from the wall is described by the following discrete Gaussian distribution:

where zn=z/δ is the height of the ellipsoid center normalized by the thickness of TBL, namely the normalized height, and δ is the thickness of TBL.P( zn)indicates the probability of placing an ellipsoid at the height of zn.zn0denotes the height where the probability of placing gas ellipsoids is at a maximum.Results from different studies have shown that structures at the height of approximately 0.8δ contribute most to optical distortions,16,23so we take=0.8δ. σ is the standard deviation of the position distribution used to control the concentration of gas ellipsoids along the Z-axis of the flow coordinate system. And σ is one of the variables that affect the shape of the distorted wavefront generated by AOSST. Here we take it as a fixed value of 0.5δ and use the size of the gas ellipsoid to adjust the shape of the distorted wavefront(see Section 2.2).K is the normalization coefficient that satisfies

where knumdenotes the total number of gas ellipsoids placed in the simulation space shown in Fig. 2. It is one of the control parameters of AOSST and will be discussed in Section 3.1.
As for the X and Y positions of gas ellipsoids,to the best of our knowledge, few results about their distribution rules have been published, so we assume a uniform distribution in AOSST.
2.2. Size of gas ellipsoid
In AOSST the major axis length of the gas ellipsoid(representing the size of the gas ellipsoid)is used to represent the density correlation length of the coherent structure in TBL,and we use Λ to denote both of them.The value of Λ is an unimodal function of the height from the wall zn, and the peak value is the minimum value of Λ. Along the direction where zndecreases(towards the wall), Λ has a much bigger gradient than the direction where znincreases (away from the wall).16,23We use a quadratic function whose vertex is near the wall to approximate the foregoing relation between Λ and zn. The quadratic function is designed to fit the increasing speed of Λ in the direction away from the wall, which results in an underestimate of the structure size near the wall.But the position distribution described in Section 2.1 has shown that the outer region makes the major contribution to the wavefront distortion and most gas ellipsoids are placed there; thus, the size error of the gas ellipsoid in the near wall region is negligible.
Rule 2 The major axis length of the gas ellipsoid Λ is described by a quadratic function given by

where znmindenotes the normalized height where the smallest gas ellipsoid is placed, namely the height for the vertex of the quadratic function. We take it as 0.05δ according to Ref.16.Λminis the minimum value of Λ.The range of the minimum density correlation length in TBL is approximately 0.05δ ~0.1δ,16,20,23so we take Λmin=0.05δ.klenis the control parameter for the size of the gas ellipsoid.Since Λ are found to decrease with increasing Reynolds number,16klenis designed as a function of Reynolds number and will be discussed in Section 3.2.
2.3. Tilt angle and oblateness of gas ellipsoid
The angle of the coherent structure in TBL has been confirmed in both the experiments and CFD simulations,14,22,24but directly identifying structure angles from graphs is still a hard task. Since the OPDrmscorresponding to different elevation angles of the beam can indirectly describe structure angles,we use the measurement results of OPDrmsto design the tilt angle and oblateness of the gas ellipsoid in AOSST. As a result,the tilt angle and oblateness that we obtain only guarantee that the gas ellipsoid has similar optical properties with the actual turbulence structure. The structure angle of the actual turbulent structure(such as the tilt angle of the hairpin vortex)may be different with the ellipsoid angle,but it is not the focus of the simulator.
An ellipse with a major axis length a and a minor axis length b is rotated around its major axis to obtain a rotation ellipsoid, and then the ellipsoid is rotated around the Y-axis of the flow coordinate system by an angle of θ,which is shown in Fig. 3. As a result, the light passing through the rotated ellipsoid at different elevation angles will lead to different space distances (Euclidean distance).
The ratio of OPDrmsγ(OPDrmsof the light with incident angle γ) to OPDrms90(OPDrmsof the vertical incidence light)in TBL satisfies

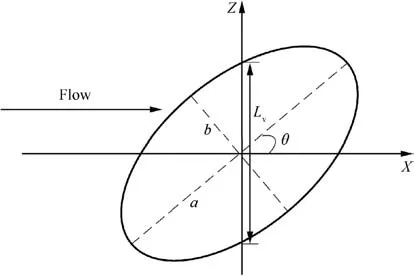
Fig. 3 Projection of a gas ellipsoid in X-Z plane of flow coordinate system.

Eq. (3) describes the directional dependence of optical distortions in TBL.The light incident from the downstream direction distorts more severely than that with the same angle from the upstream direction, because the light incident from the downstream direction has a larger OPL.
Since Eq. (3) describes the directional dependence of the entire TBL, we use an equivalent method to obtain the tilt angle and oblateness of each gas ellipsoid. The entire density field is regarded as only one gas ellipsoid shown in Fig. 3.Therefore, the beams along the major and minor axes have the maximum and minimum distortions, respectively. Since the density is uniform in a gas ellipsoid (see Section 2.4), the OPL can be replaced by the Euclidean distance, and then Eq. (2) can be written as

where Lvis defined in Fig. 3 and it is a function of θ.
Eq.(4)and θ can be solved according to the geometric relationship in Fig. 3. Then we get the equivalent tilt angle θ=24.17°, which is close to the measured value obtained by LES simulation in Ref. 24, and the equivalent oblateness of the gas ellipsoid is α=(a-b)/a=0.447. Since we expect AOSST to simulate the directional dependence described in Eq. (3), all the gas ellipsoids placed in the simulation space are designed with the same tilt angle and oblateness.
Rule 3 The tilt angle θ of all the gas ellipsoids is 24.17°and the oblateness α of all the gas ellipsoids is 0.447.
Since the span-wise coherent structure is isotropic,24the rotation angle of the gas ellipsoid around the Z-axis in the flow coordinate system is zero.
2.4. Density of gas ellipsoid
Although the density usually varies continuously in the actual turbulent coherent structure, densities inside and outside the gas ellipsoid are set to constant values in AOSST in order to simplify the design process. But this simplification leads to a sudden change of density at the ellipsoid surface. When the starlight passes through a density field generated by such gas ellipsoids,we will obtain an instantaneous wavefront snapshot(instantaneous OPD).The sudden rising peaks or sudden sinking valleys on the snapshot make it hard to simulate the real distorted wavefront with only one snapshot.We average a certain number of snapshots to solve this problem.A detailed discussion is presented in Section 3.4.
One of the design objectives of AOSST is to anchor the generated OPDrmswith BLPM, and the rule for density has the most direct impact on the anchoring relation. Since BLPM depends on the Mach number, the effect of the Mach number is considered in the density rule.A Mach number influence factor is defined as F(Ma,z) and given by

where Ma is the Mach number. κ denotes the ratio of specific heat. f(z /δ)=Uz/δ/U∞is the average velocity profile. Uz/δis the average velocity at the height of z/δ and the expression of Uz/δis referred to in Ref. 25. Here we use the logarithmic law c1ln(z /δ)+c2to describe the average velocity of the whole simulation space in AOSST. U∞denotes the freestream velocity.Eq. (5)refers to the expression of the root mean square of density fluctuation in boundary layers ρrms(see Ref.14),which takes the part related to Mach number Ma and height from the wall z/δ.
Since large-scale coherent structures in TBL are the major contributors to wavefront distortions,and it is well known that wavefront distortions are caused directly by density fluctuations,we assume that the density difference between the inside and outside of the gas ellipsoid increases with Λ,which means that Λ in Eq. (1) is designed as a variable in the density rule.
Rule 4 The density inside the gas ellipsoid is given by

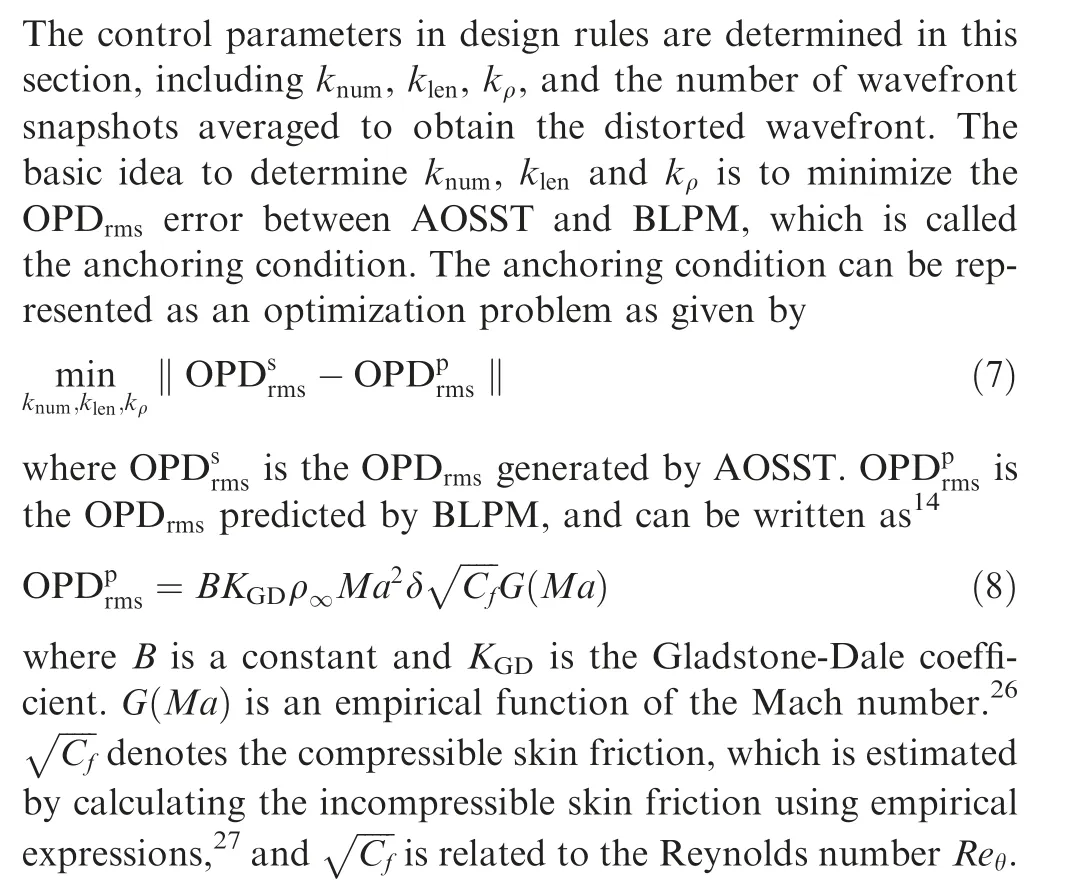
3. Determination of control parameters in AOSST
3.1. Control parameter for number of gas ellipsoid knum
The total number of gas ellipsoids knumaffects the distorted wavefront shape generated by AOSST. Specifically speaking,peaks and valleys on the distorted wavefront increase with knumwhen the other variables are fixed.The value of knumultimately depends on experience;the typical numbers provided in Ref. 20 are hundreds to thousands. knumis set to 1000 in the simulation space of AOSST. In the actual operation process,in order to reflect random variations of turbulence,the number of gas ellipsoids corresponding to each wavefront snapshot varies between 0.9knumand 1.1knum.
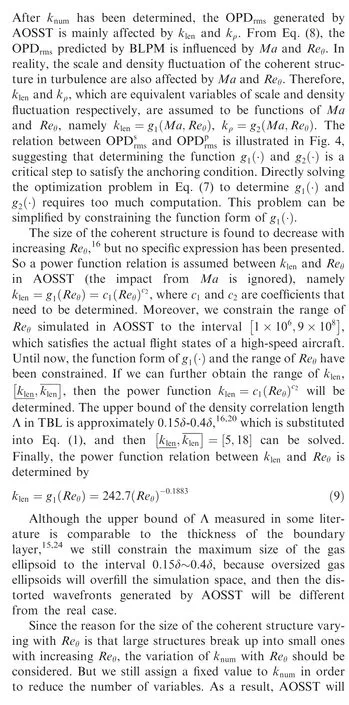
3.2. Relation between size control parameter klen and Reynolds number Reθ

3.3. Control parameter for density of gas ellipsoid kρ
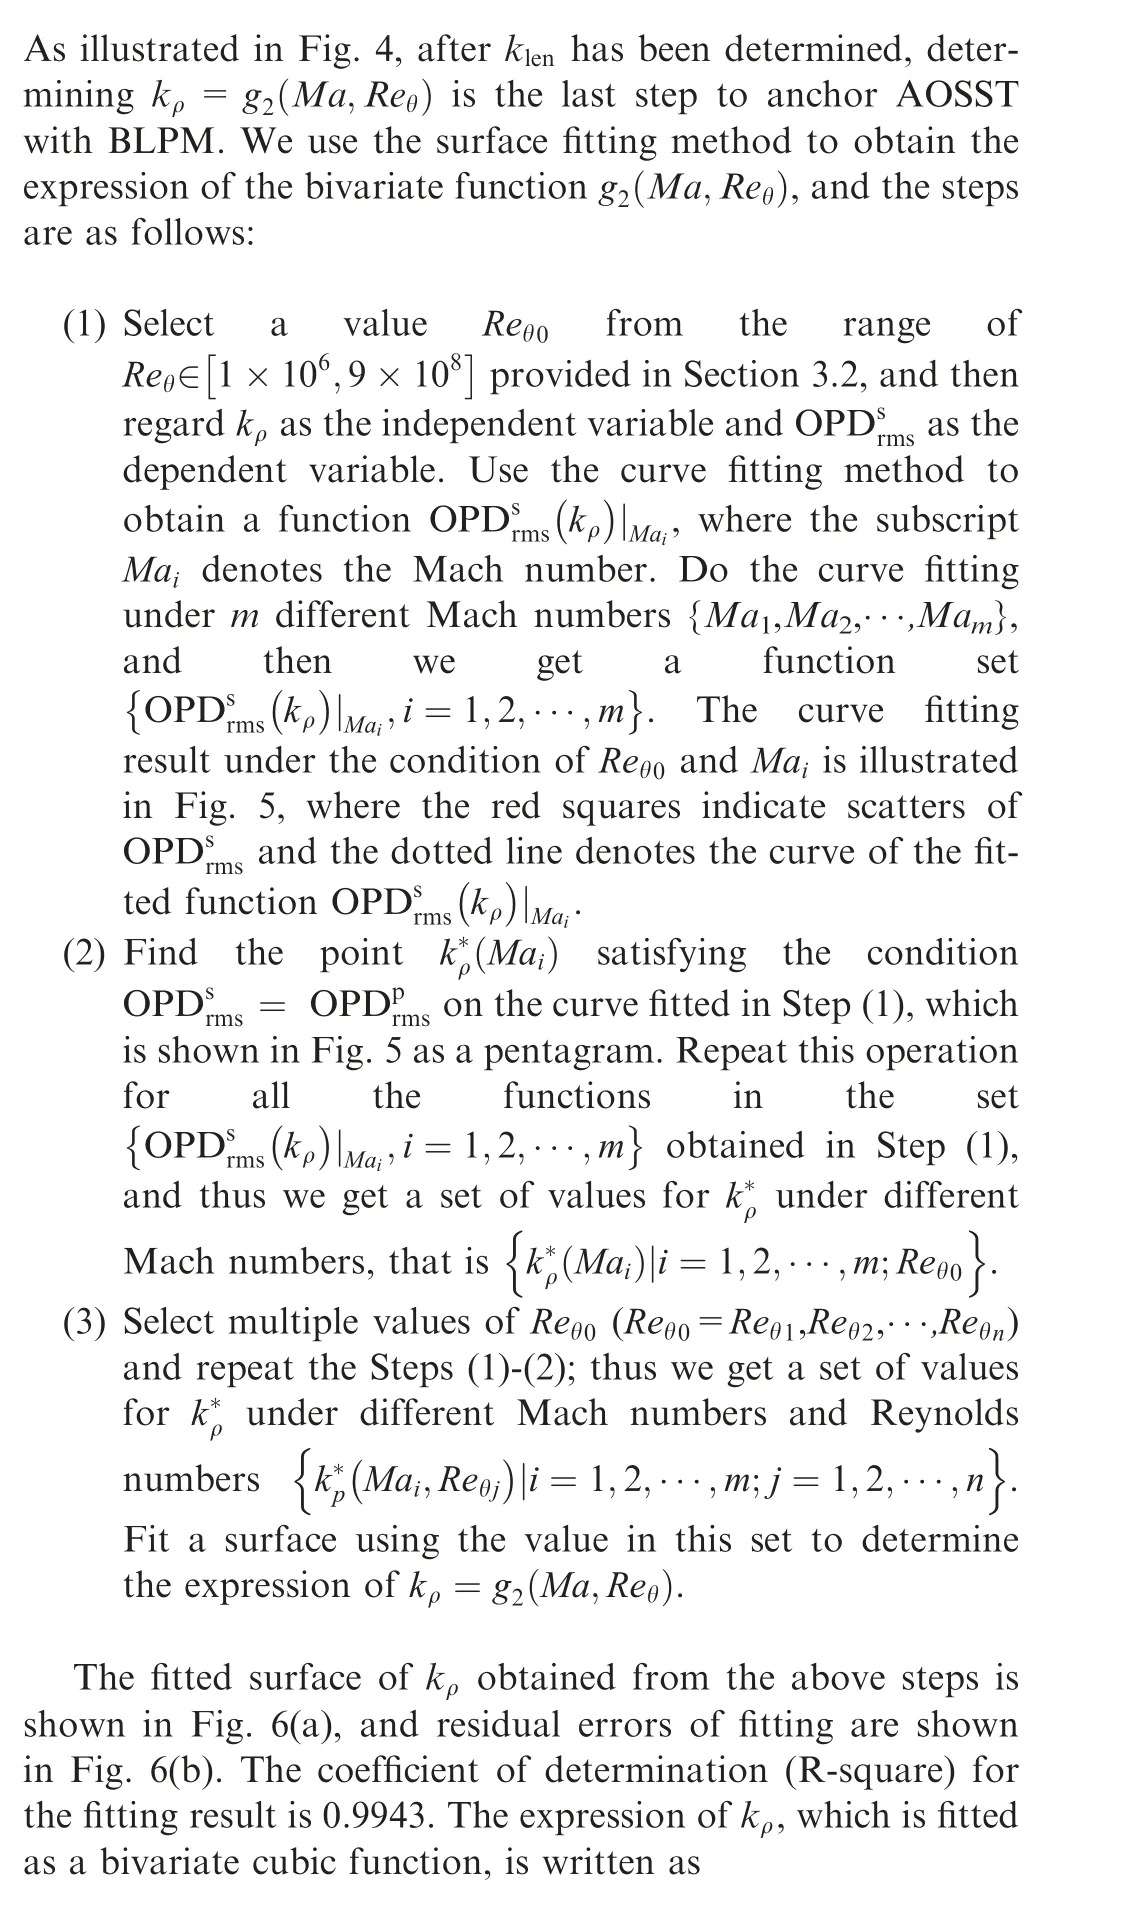

Fig. 4 Relation between OPDsrms and OPDprms.
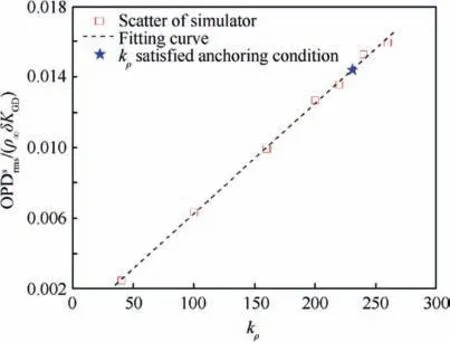
Fig.5 Determine kρ by curve fitting method under the condition of Reθ0 and Mai.

It should be noted that Eq. (10) is obtained under a fixed ρ∞(the atmosphere density at the height of 5 km). However,according to the density rule (Eq. (6)), ρ∞impacts the density field generated by AOSST. Eq. (6) can be written in the two forms given by

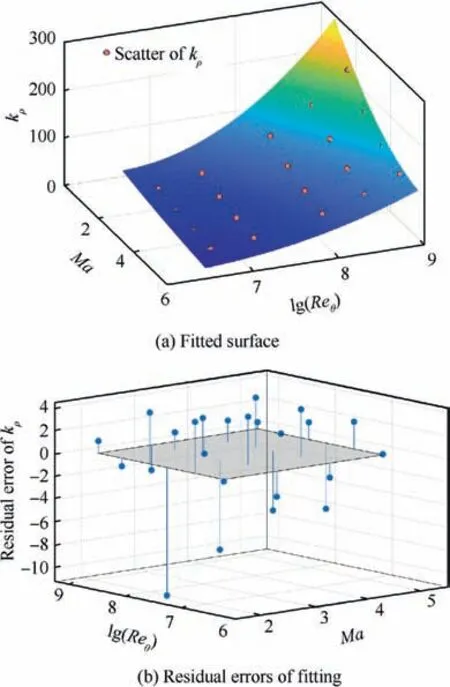
Fig. 6 Surface fitting results.
which indicate that the density difference of the gas ellipsoid ρ′=ρin-ρ∞is related to both ρ∞and kρ, and the ratio of the density is only related to kρ.But we cannot directly decide through Eq.(11)whether kρis affected by ρ∞.A Monte Carlo simulation is presented in Section 4.2 to verify the applicability of kρin Eq. (10) to different ρ∞.
3.4. Number of snapshots averaged in star sensor imaging simulation
Since the density rule in Eq. (6) will cause a sudden change in density at the ellipsoid surface,it is difficult to simulate the real distorted wavefront with only one frame of an instantaneous snapshot. Averaging a certain number of snapshots is used to solve this problem in Ref. 20, and we follow this method in AOSST. So the only problem is to determine the specific number of snapshots used in the averaging operation, which is indicated as N.
N is equivalent to the exposure time of the imaging device,which is a tunable parameter for star sensors.The short exposure can capture the transient optical characteristics of a flow field, and it is suitable for pulsed beams. However, influences on the beam caused by the stable structure in a flow field can be obtained through long exposure imaging. Stars observed in celestial navigation are weak light sources, which require the star sensor to have longer exposure time. As a result, the energy distribution on the image plane is mainly affected by stable structures in the flow field. Therefore, we use N to simulate the long exposure characteristics of the star sensor in AOSST.Two factors are considered to determine N.One is the variation of averaged snapshots with increasing N.The generated distorted wavefront is considered to be stable when the variation is close to zero. The other factor is the amount of calculation, necessary to minimize N.

4. Simulation results and analysis
In this section, we provide four examples to verify the performance of AOSST: the simulation for different incident angles of starlight; the simulation for different flight heights(freestream densities); the simulation for different Reynolds numbers; the simulation for energy distribution on the image plane. In AOSST, the parallel beam with a wavelength of λ=550 nm is used to simulate the incident starlight.
The code for AOSST includes a module to generate the density field of the gas ellipsoid and a module for optical calculation.The module for density field generation can generate density fields composed of gas ellipsoids in a three-dimensional grid space according to the input flight height, Mach number and Reynolds number. The optical calculation module calculates the OPL by integrating the density along the optical path according to the incident angle of starlight. Then the light intensity distribution on the image plane can be derived from OPL.
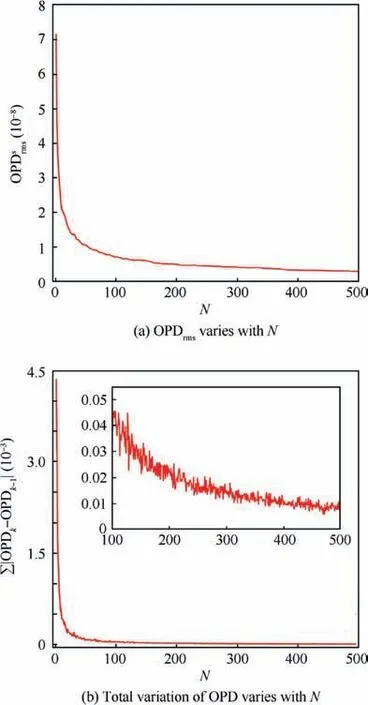
Fig. 7 Distorted wavefront generated by averaging snapshots varies with N.
4.1. Influence of starlight incident angle
The design for tilt angle and oblateness of the gas ellipsoid is aimed to simulate the directional dependence of wavefront distortions in TBL.In this example,the incident angle of starlight γ is defined as the angle between the starlight vector (from the navigation star to the star sensor) and the direction vector of freestream. The OPDrmsgenerated by AOSST is compared with results in Refs. 16,22, as shown in Fig. 8, where the vertical coordinates (representing OPDrms) are normalized by the OPDrmsof γ=90°.
As shown in Fig. 8, OPDrmsfrom AOSST is very close to the results in the literature when γ >90°, but the error increases when γ gradually decreases from 90°. The maximum relative error at γ=30°is about 16%.There are two reasons:On the one hand, the shape of the coherent structure in TBL does not completely conform to an ellipsoid.In fact,it is more similar to the shape of a hairpin or a horseshoe, but an ellipsoid is more convenient to be analytically considered and modeled.On the other hand,the density field is designed to have a sudden change on the ellipsoid surface,which is different from actual case but easy to realize. Although the averaging operation in Section 3.4 is used to reduce the influence of the density sudden change,the influence cannot be eliminated completely.
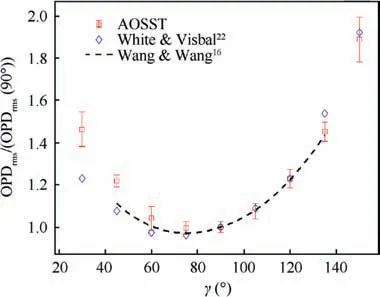
Fig. 8 Normalized OPDrms varies with the incident angle of starlight γ.
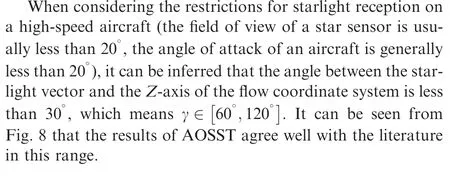
4.2. Monte Carlo simulation for different flight heights
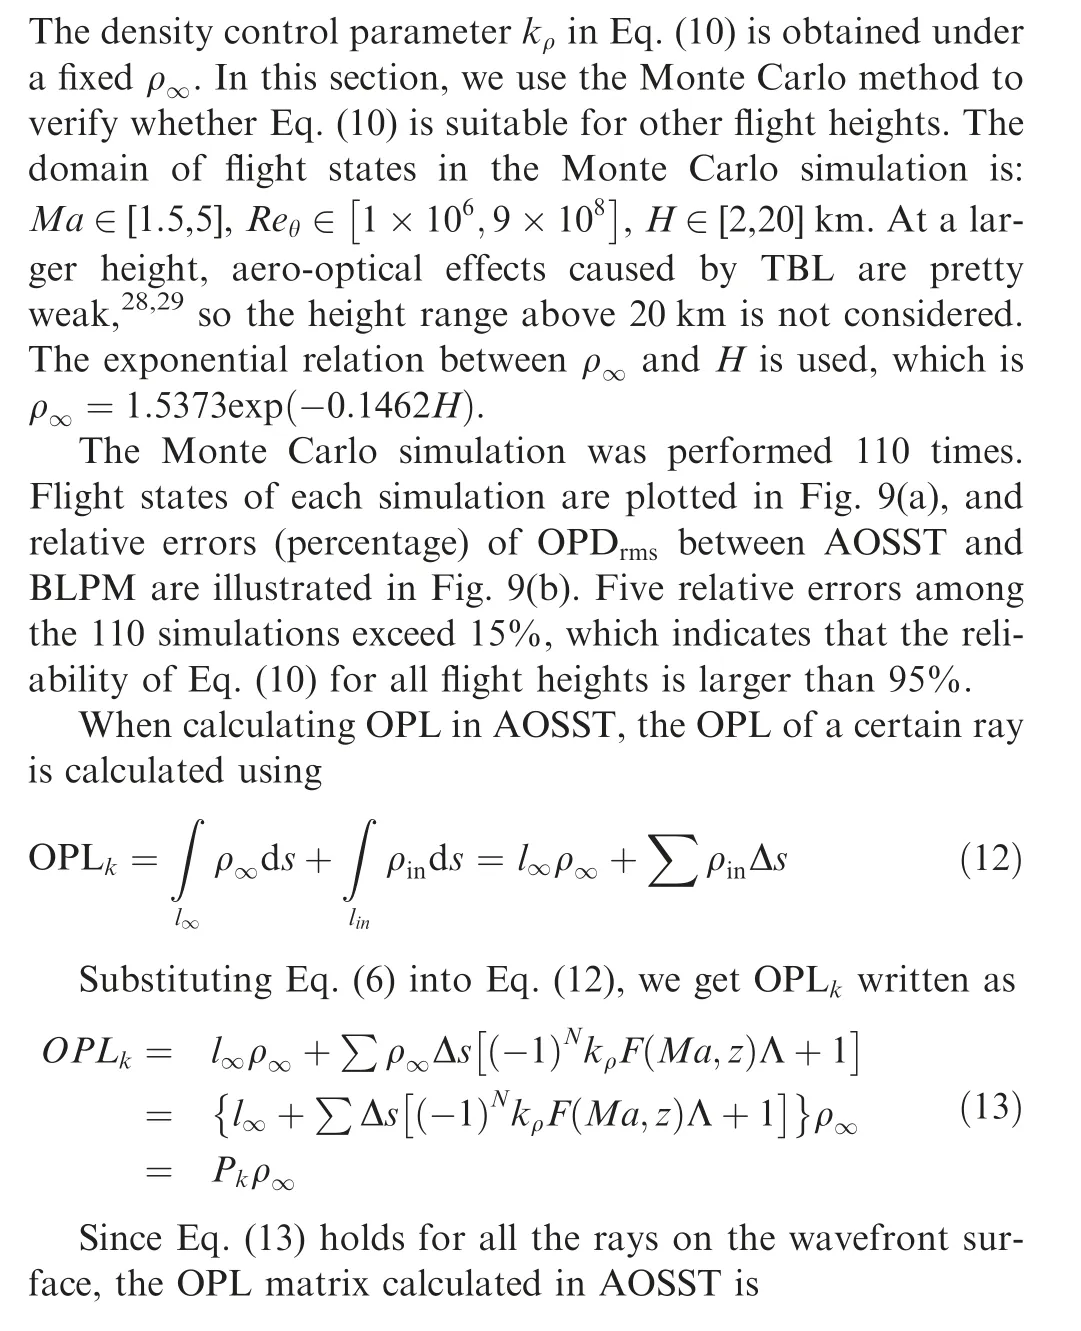
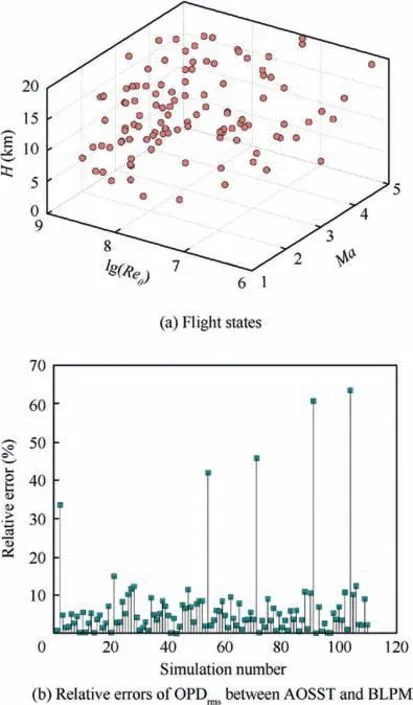
Fig. 9 Results of 110 Monte Carlo simulations.
4.3. Influences of Reynolds number on the shape of distorted wavefront
The shape of the wavefront generated by AOSST depends on the size of the gas ellipsoid, and it can be found from Eq. (1)and Eq. (9) that the size of the gas ellipsoid is determined by Reθ. Thus, Reθis the factor directly affecting the shape of the wavefront in AOSST. When flight states are Ma=3,H=20 km and Reθis 1×10⁶and 9×10⁸, respectively, we can illustrate the surfaces of distorted wavefronts and their projections in Fig. 10. It can be found that the degree of fragmentation for Reθ=1×10⁶is much less than that for Reθ=9×10⁸, which is consistent with the variation trend of wavefront shape with Reθin Ref. 16. But the wavefront surface, which is under the low Reynold number, is not smooth enough compared to that in Ref. 16, which is many small peaks/valleys superimposed on the large peaks/valleys(Fig. 10(a)). As mentioned in Section 3.2, the fixed number of gas ellipsoids (knum) is one of the reasons leading to this result.The other reason is due to averaged snapshots.Because the position distributions of gas ellipsoids among snapshots are different, when the averaging operation is performed, differences of position distribution will appear as many peaks/-valleys on the wavefront surface. To sum up, inherent errors produced by the simplification and approximation in the design process of AOSST lead to a limitation of the simulator that the generated wavefront has a larger degree of fragmentation under the small Reynolds number condition.
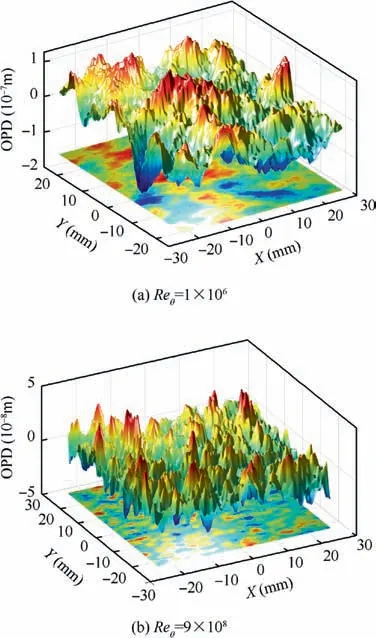
Fig. 10 Distorted wavefront surfaces and their projections generated by AOSST under low and high Reynolds numbers.
The density field around a cone-shaped warhead with concave window is shown in Fig. 11(a). The calculation is performed based on LES under the condition of Ma=3,H=20 km.Limited by computing resources,the grid number is about 1.25 million, which does not meet the grid resolution requirements for the aero-optical simulation in Ref.19.Fig.11(b)illustrates the distorted wavefront surface and its projection of an incident beam passing through the boundary layer in the center of the concave window. It can be seen that due to the insufficient grid resolution,most of the high frequency components on the wavefront are missing and only the low frequency components are obtained. Under the same condition, the distorted wavefronts generated by AOSST in Fig. 10 have both low frequency and high frequency components. Therefore, in the case of insufficient computing resources, instead of performing low-precision CFD calculations, AOSST is used,which has advantages in both calculation time and fidelity(the calculation time to generate one distorted wavefront is about 2100 s when AOSST code is running on an Intel i5 8400 desktop).
4.4. Light intensity distribution on image plane
4.4.1. Influences of gas ellipsoid size on light intensity distribution
Wavefront distortions are predominantly caused by large-scale coherent structures in TBL.16,18In this section,we use AOSST to verify this conclusion by changing the size of the gas ellipsoid and then calculating the light intensity distribution on the image plane.
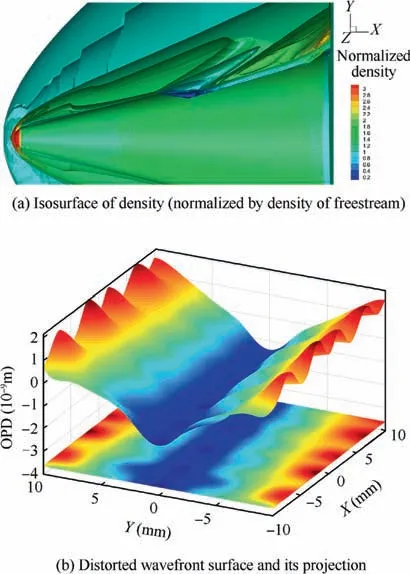
Fig. 11 Results of LES for a cone-shaped warhead.
Under the condition of Ma=5, H=5 km,Reθ=1.45×10⁸,a certain number of small-scale gas ellipsoids(20% of knum) are added into AOSST. Their sizes all take the value corresponding to zn=0.3δ in Eq.(1).The light intensity distribution on the image plane (represented by the Point Spread Function(PSF))of the original flow field(the flow field where no gas ellipsoid is added) is shown in Fig. 12(a). The PSF error between the original flow field and the flow field changed by adding small-scale gas ellipsoids is shown in Fig.12(b).The PSF error in Fig.12(b)is two orders of magnitude smaller than the original PSF in Fig. 12(a), which indicates that small-scale structures have little effect on imaging.In contrast, when the added small-scale gas ellipsoids are replaced by large ones, whose sizes all take as the value corresponding to zn= 0.7δ in Eq. (1), then the PSF error between the original flow field and the changed flow field is shown in Fig.12(c).The PSF error in Fig.12(c)is close to the magnitude of the original PSF in Fig. 12(a), indicating that large-scale structures are main factor affecting imaging.
The results above provide the inspiration for rules design and improvement of AOSST: focusing on large-scale structures can reduce complexity while ensuring satisfactory performance. From another perspective, the conclusion that largescale structure dominates optical properties in TBL is the reason why we can establish the simulator by designing only a few rules and determining some parameters to reduce computation requirements.
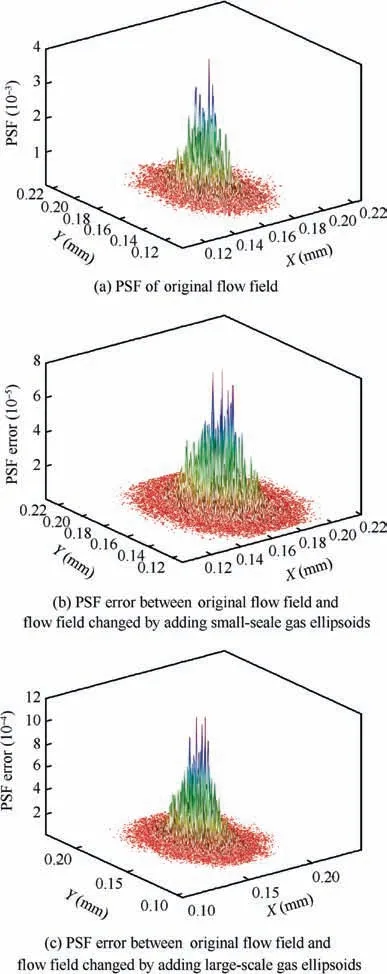
Fig. 12 PSF varies with the size of gas ellipsoid in flow field.
4.4.2. Star map simulation
In the angle measurement process of celestial navigation, the star sensor first converts the light intensity on the image plane to grayscale on the star map, and then image processing techniques are used to acquire the centroid coordinates of each star. Finally the centroid coordinates are used to calculate angles of navigation stars relative to the star sensor.In this section,we use the distorted wavefront generated by AOSST and optical parameters of the star sensor to simulate the star map under high-speed conditions. The Strehl Ratio (SR) is then computed from the grayscale distribution of the simulated star map, which is compared with the theoretical value calculated by the Mare´chal approximation.
Optical parameters of the star sensor are listed in Table 1,where the defocus distance is an error of focal length added manually to ensure sub-pixel precision for centroid acquisition. To determine the defocus distance, we must guarantee that the energy concentration on an image of parallel beam is about 90% in the range of 3×3 pixels.
Given Ma=5, H=5 km, Reθ=3.17×10⁸, we can see that Fig. 13 shows the star map of vertical incident starlight,from which we find that starlight energy spreads to the range of 4×4 pixels.The distribution range for the undisturbed parallel beam is 3×3 pixels.
We can use the Mare´chal approximation to estimate farfield SR through OPDrmsaccording to

Substitute OPDrmspredicted by BLPM into Eq. (15), and the theoretical value of SR can be obtained. The SR corresponding to three different flight states are listed in Table 2,where SRpis the theoretical value of SR calculated by Eq.(15) and SRsis the SR obtained through the star map generated by AOSST (in order to compare with the theoretical values,the SRsin Table 2 are obtained when the defocus distance of the star sensor is set to zero).
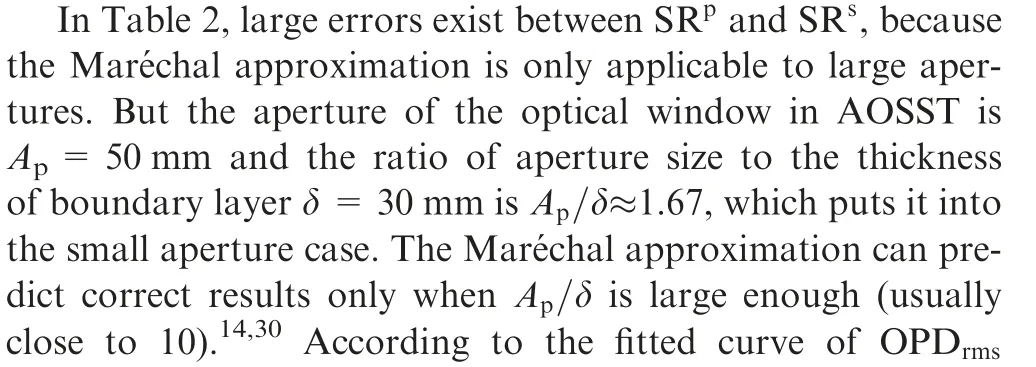
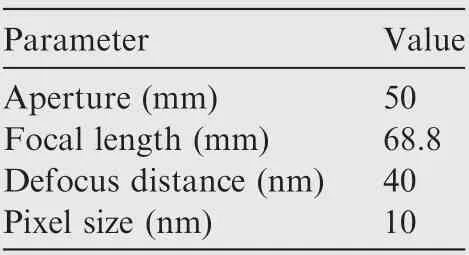
Table 1 Optical parameters of star sensor.
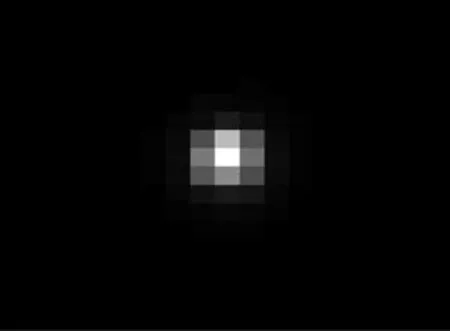
Fig. 13 Star map of a vertical incident starlight.
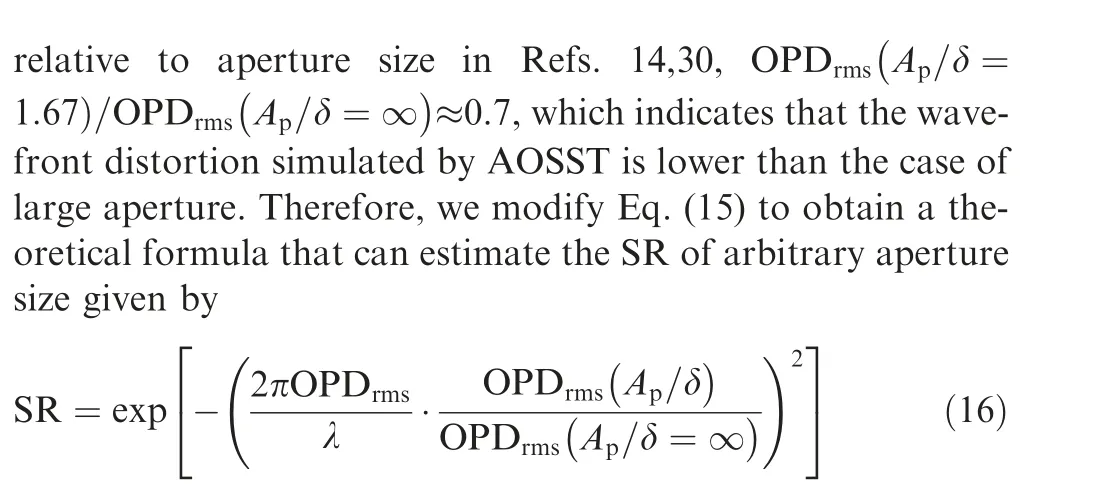
Eq. (16) is used to modify SRpin Table 2 and the theoretical estimation of SR matching the aperture size in AOSST is listed in the last column as SRpm. It can be seen that SRpmis close toSRs, indicating that the grayscale distributions on the simulated star map agree with the actual situation.
4.5. Effects of size of simulation domain and size of optical window
4.5.1. Size of simulation domain
In this paper,the simulation domain for the density field of the boundary layer represents the space size of the actual flow field, so the size can be changed according to users’ requirements. For the design process of the simulator, the change of simulation domain volume will affect the design of simulator parameters. The parameter directly affected is the number of gas ellipsoids knum.The value of knumin this paper is an empirical value suitable for the simulation domain size of 200 mm(X)×100 mm(Y)×30 mm(Z).If the volume of the simulation domain is changed, a new knumshould be determined according to the new volume. The principle to determine knumis to ensure a certain space fill factor.Users can multiply the empirical value for knumgiven in this paper by a scaling coefficient related to the volume ratio of the simulation domain. When knumis changed, the new size control parameters klenand density control parameters kρshould be redetermined according to the steps given in Sections 3.2 and 3.3. In general, the size of the simulation domain can be changed according to users’requirements and the space size of the actual flow field. After the domain size has been changed, the simulator parameters need to be recalibrated according to the parameter determination method given in Section 3. Then the AOSST can be reanchored with the BLPM.
Specifically,the ratio of the size along flow direction(X)to the size along span direction (Y) is not restricted. Because the X and Y coordinates of the gas ellipsoids in the simulator are uniformly distributed(see Section 2.1),that is,at the same wallheight(Z direction),the density for the gas ellipsoid number in X and Y directions are same,and it is not affected by the ratio of length to width in the simulation domain. Therefore, any length and width larger than the size of the optical window is allowed. From a computational standpoint, the length and width values are not likely to be too large, as this increases the number of ellipsoids placed and thus the running time of the code.

Table 2 SR corresponding to three different flight states.
The Z direction of the simulation domain represents the thickness of the turbulent boundary layer δ.In the actual flow field, the thickness of the boundary layer is defined as the height from the wall surface to the position where the tangential velocity along the wall surface reaches 99% of the freestream velocity. And δ is related to the flow conditions. For the supersonic flat-plate boundary layer, δ is typically from a dozen to a few tens of millimeters.26,27In this paper, δ for the simulated flow field is set to a fixed value of 30 mm in order to reduce the number of design parameters. The selection of this fixed value will not affect the accuracy of distorted wavefront generated by AOSST as long as it is in the range of a dozen to a few tens of millimeters. Because design rules for gas ellipsoids in Section 2 are based on parametric method,the position distribution and the size of gas ellipsoids change with δ.But when δ is changed,all the simulator control parameters need to be recalibrated according to the parameter determination method given in Section 3.
4.5.2. Size of optical window
In this paper,the optical window size represents the lens size of the imaging instrument.The lens diameter of the star sensor is generally 30-50 mm, so we take the optical window size as 50 mm×50 mm.
The ratio of the optical window size (circular or square aperture) to the thickness of the boundary layer δ will affect the OPDrmsof the sampled distorted wavefront. In Section 4.4.2, we have analyzed the effects of aperture size and given a formula to calculate the SR of an image under different aperture sizes. Here in a more general case, where the length and width of the optical window are set at any value, we will discuss the ratio of length to width for the optical window and its effect on the distorted wavefront sampled in the window.
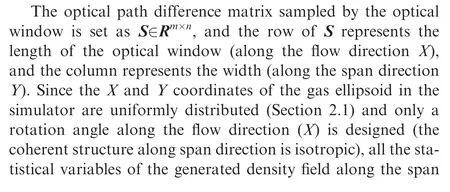
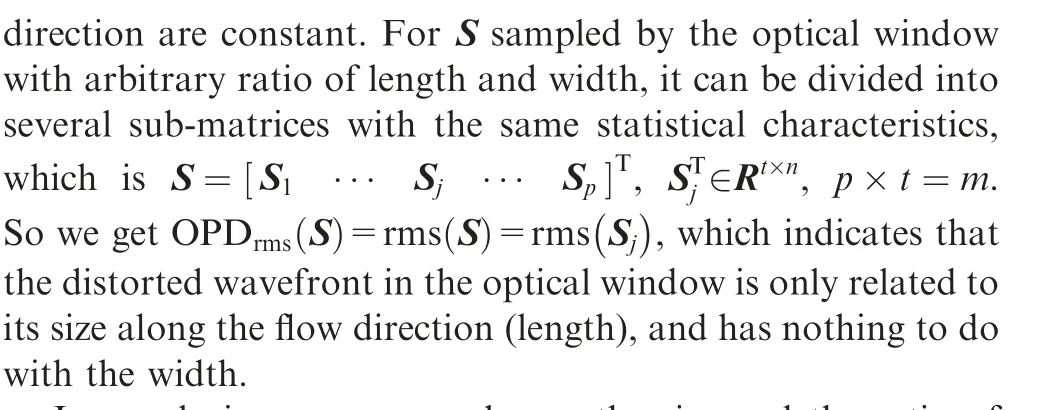
In conclusion, users can change the size and the ratio of length to width of the optical window in AOSST without redesigning the parameters of the simulator. The change of the size along the flow direction will affect the statistical characteristics of the distorted wavefront sampled in the optical window, while the change along span direction has no impact on the results.
5. Conclusions
The celestial navigation system on a high-speed aircraft suffers aero-optical effects.In this study,in order to reduce computation requirements for aero-optical simulation,an Aero-Optical Simulator for Starlight Transmission (AOSST) is developed based on the random phase screen method. It can simulate aero-optical effects caused by Turbulent Boundary Layers(TBLs) near the optical window.
AOSST has two significant features: (A) gas ellipsoids are used to simulate coherent structures in the density field, and the directional dependence of aero-optical distortions in TBL can be simulated in this way; (B) the OPDrmsgenerated by AOSST is anchored with BLPM, which enables our simulator to output reliable results over a wide range of flight states. The design rules for the gas ellipsoid satisfy general distribution laws of the coherent structure that are from published experimental and high-fidelity CFD simulation results.The control parameters of the simulator are determined by minimizing the OPDrmserror between AOSST and BLPM. The Monte Carlo method is used to study the applicability of AOSST to different flight states;both the simulation results and a further theoretical analysis indicate that AOSST is suitable for typical flight states of a highspeed aircraft (the domain of the flight state consists of height,Mach number,and Reynolds number).By adding different scales of gas ellipsoids in the density field generated by AOSST,we conclude that large-scale structures contribute more than small ones for optical distortions.The size of the optical window in AOSST is a small aperture, so the SR computed through the simulated star map is not consistent with the theoretical value for a large aperture. The Mare´chal approximation is then modified to estimate the SR of arbitrary aperture size,and the modified theoretical estimation of SR agrees well with the SR measured from the simulated star map.
AOSST is a numerical simulation technique that can be used when there are insufficient computing resources. It can approximate aero-optical effects of the starlight received in a high-speed aircraft, which will help engineers design and improve the celestial navigation system working in highspeed conditions. The optical window of a high-speed aircraft needs jet cooling when subject to aerodynamic heating,so further research will focus on the simulator design for starlight transmission in the shear layer.
Acknowledgements This work was supported by the National Defense Pre-Research Foundation of China (No. JCKY2016601C005)and the Science and Technology on Space Intelligent Control Laboratory of China (No. ZDSYS-2018-03).
We thank LetPub(www.letpub.com)for its linguistic assistance during the preparation of this manuscript.
 CHINESE JOURNAL OF AERONAUTICS2020年7期
- CHINESE JOURNAL OF AERONAUTICS的其它文章
- An experimental method for squealer tip flow field considering relative casing motion
- A novel none once per revolution blade tip timing based blade vibration parameters identification method
- Highly efficient computation method for hazard quantification of uncontained rotor failure
- Optimal motion cueing algorithm for accelerating phase of manned spacecraft in human centrifuge
- Effective control allocation using hierarchical multi-objective optimization for multi-phase flight
- Fault-tolerant control and vibration suppression of flexible spacecraft: An interconnected system approach
