Oxygen concentration variation in ullage influenced by dissolved oxygen evolution
Shiyu FENG, Choyue LI,*, Xiotin PENG, To WEN, Yn YAN,Rongjie JIANG, Weihu LIU
a Key Laboratory of Aircraft Environment Control and Life Support of MIIT, College of Aerospace Engineering, Nanjing University of Aeronautics and Astronautics, Nanjing 210016, China
b Department of Building Services Engineering, Hong Kong Polytechnic University, Hong Kong, China
c College of Mechanical and Electrical Engineering, Xi’an Polytechnic University, Xi’an 710000, China
KEYWORDS Computational Fluid Dynamics (CFD);Dissolved oxygen evolution;Mass transfer;Stimulation;Time constant;Volume of fluid
Abstract To determine the oxygen concentration variation in ullage that results from dissolved oxygen evolution in an inert aircraft fuel tank, the CFD method with a mass transfer source is applied in the present study. An experimental system is also designed to evaluate the accuracy of the CFD simulations.The dissolved oxygen evolution is simulated under different conditions of fuel load and initial oxygen concentration in ullage of an inert fuel tank with stimulations of heating and pressure decrease.The increase in the oxygen concentration in ullage ranges from 0.82%to 5.92%upon stimulation of heating and from 0.735% to 12.36% upon stimulation of a pressure decrease for an inert ullage in the simulations. The heating accelerates the release of the dissolved oxygen from the fuel by increasing the mass transfer rate in the mass transfer source and decreasing the pressure,thereby accelerating the dissolved oxygen evolution by increasing the concentration difference between the gas and the fuel. The time constant that represents the oxygen evolution rate is independent of the initial oxygen concentration in ullage of an inert tank but depends closely on the fuel load, temperature and pressure. The time constant can be fitted using a polynomial equation relating the fuel load to temperature in the heating stimulation with an accuracy of 4.77%.Upon stimulation of a pressure decrease, the time constant can be expressed in terms of the fuel load and the pressure, with an accuracy of 5.02%.
1. Introduction
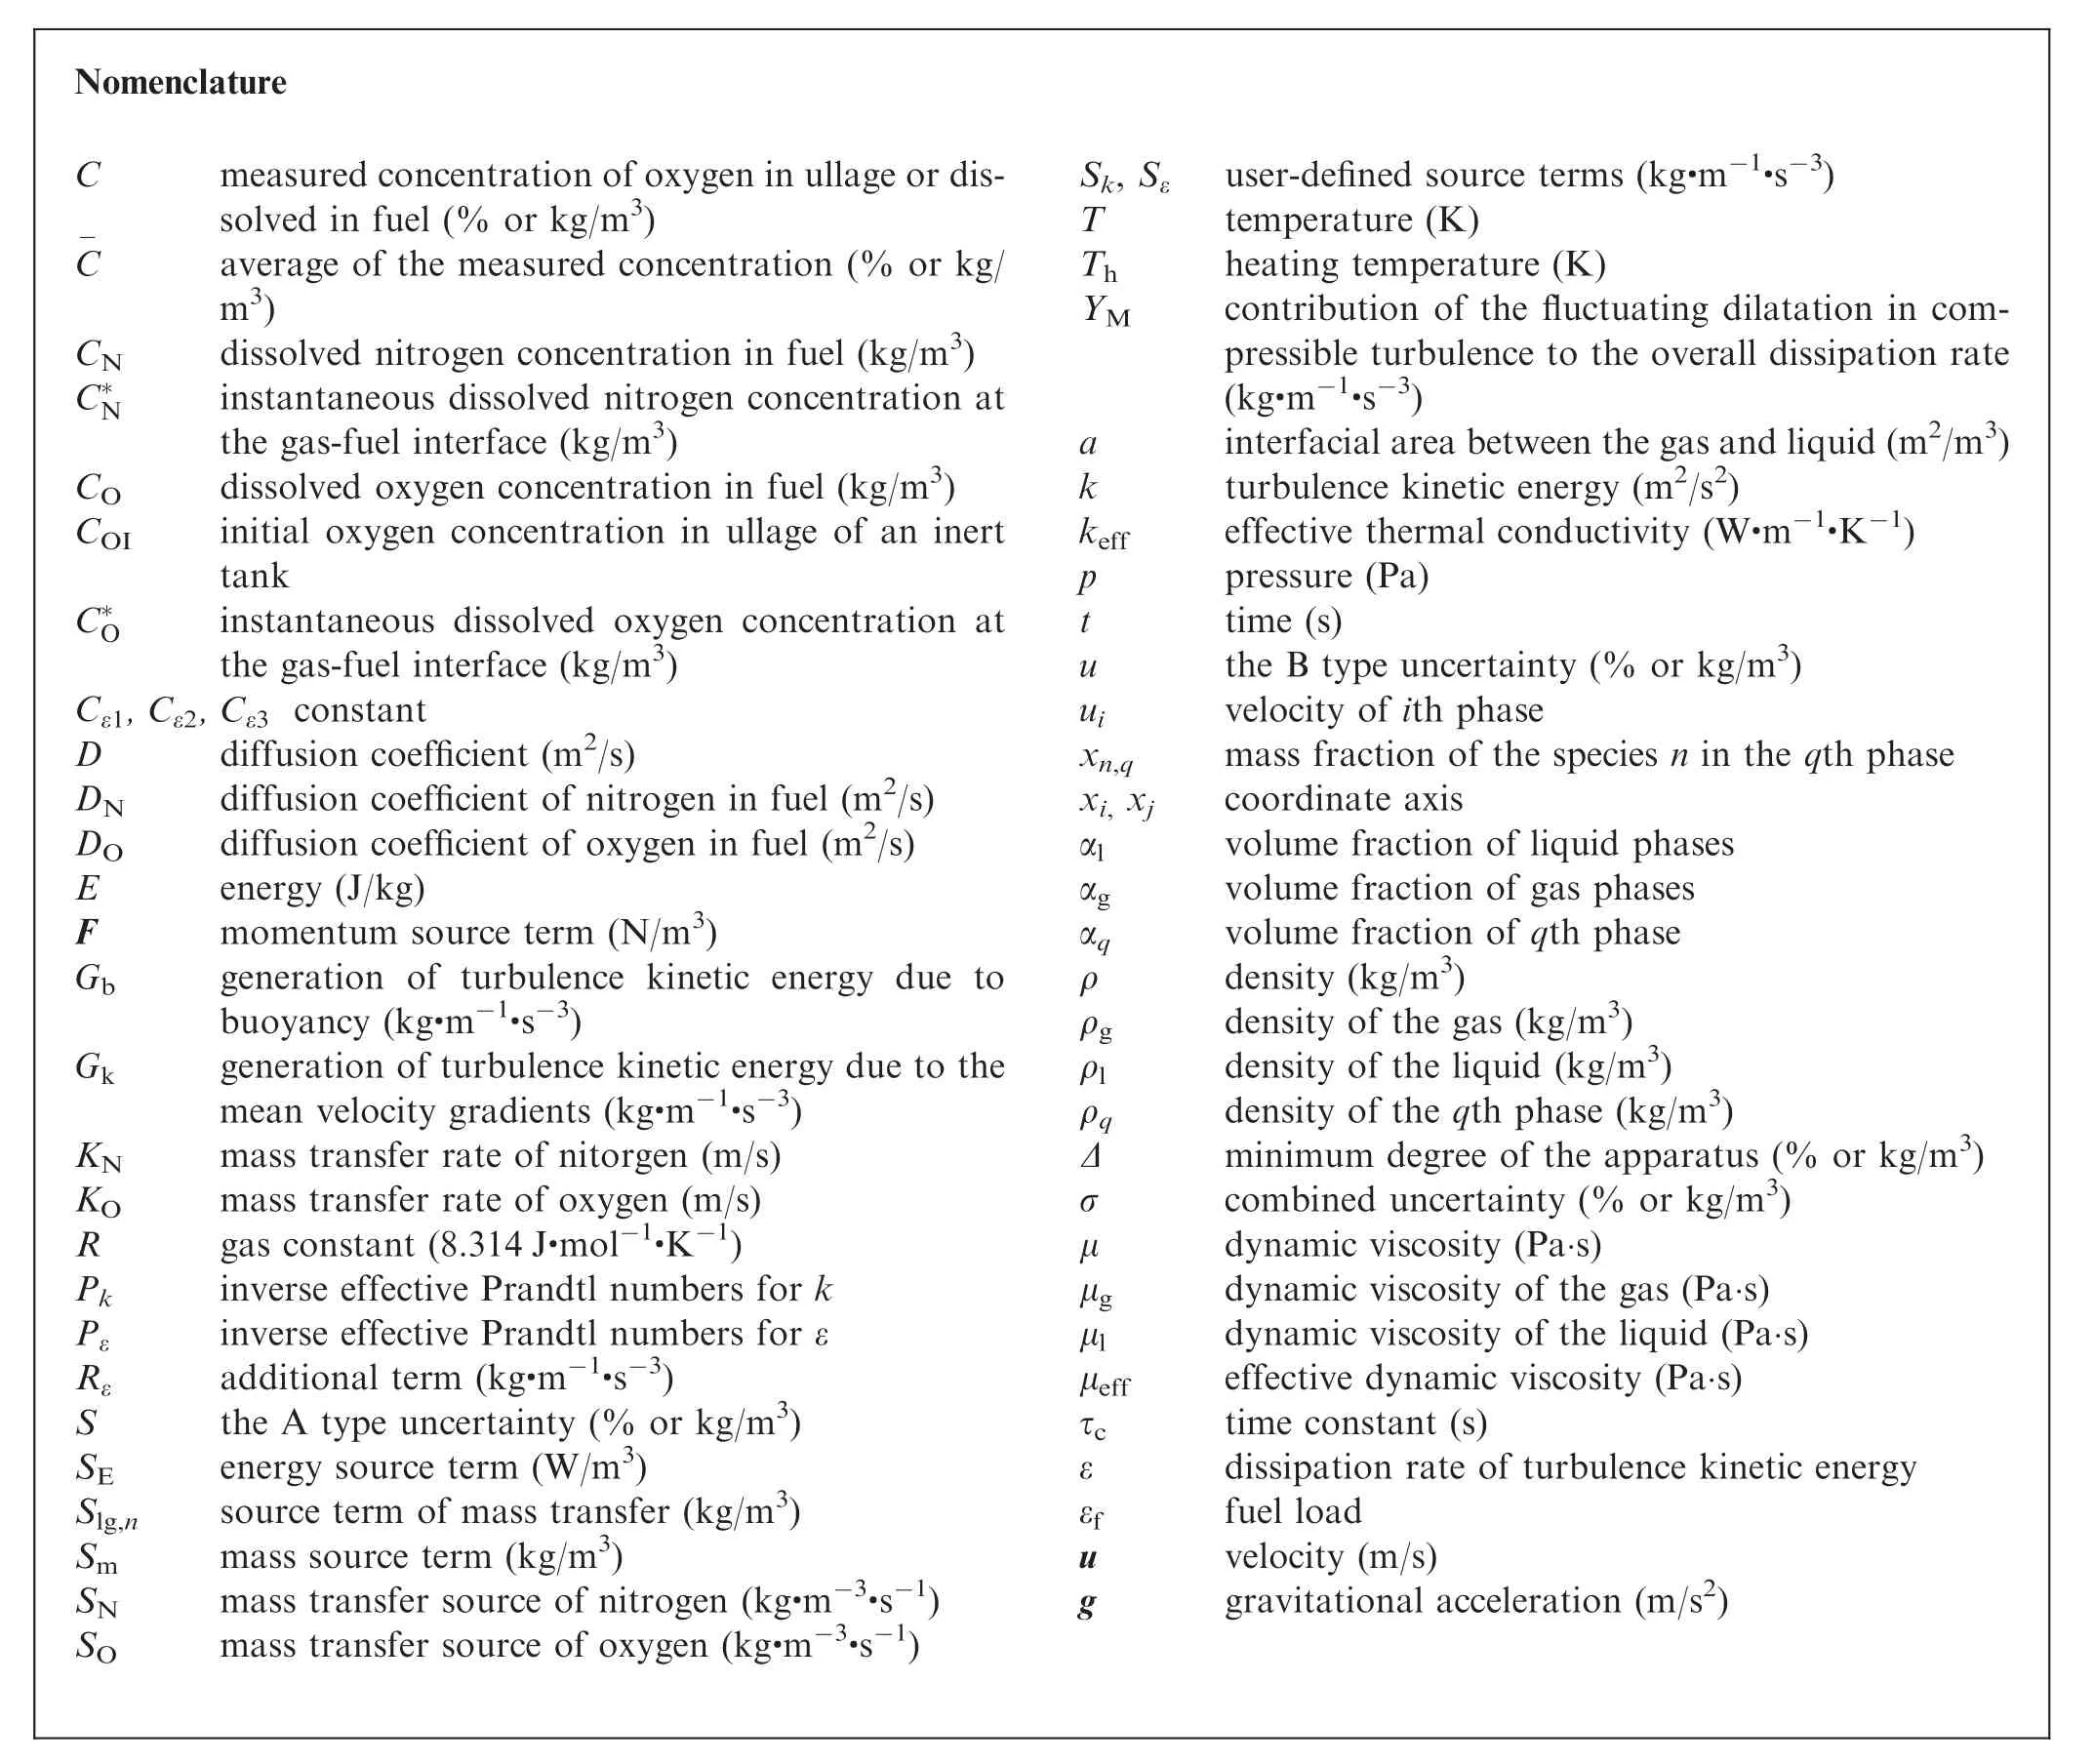
Nomenclature C measured concentration of oxygen in ullage or dissolved in fuel (% or kg/m3)C- average of the measured concentration (% or kg/m3)CN dissolved nitrogen concentration in fuel (kg/m3)C*N instantaneous dissolved nitrogen concentration at the gas-fuel interface (kg/m3)CO dissolved oxygen concentration in fuel (kg/m3)COI initial oxygen concentration in ullage of an inert tank C*O instantaneous dissolved oxygen concentration at the gas-fuel interface (kg/m3)Cε1, Cε2, Cε3 constant D diffusion coefficient (m2/s)DN diffusion coefficient of nitrogen in fuel (m2/s)DO diffusion coefficient of oxygen in fuel (m2/s)E energy (J/kg)F momentum source term (N/m3)Gb generation of turbulence kinetic energy due to buoyancy (kg·m-1·s-3)Gk generation of turbulence kinetic energy due to the mean velocity gradients (kg·m-1·s-3)KN mass transfer rate of nitorgen (m/s)KO mass transfer rate of oxygen (m/s)R gas constant (8.314 J·mol-1·K-1)Pk inverse effective Prandtl numbers for k Pε inverse effective Prandtl numbers for ε Rε additional term (kg·m-1·s-3)S the A type uncertainty (% or kg/m3)SE energy source term (W/m3)Slg,n source term of mass transfer (kg/m3)Sm mass source term (kg/m3)SN mass transfer source of nitrogen (kg·m-3·s-1)SO mass transfer source of oxygen (kg·m-3·s-1)Sk, Sε user-defined source terms (kg·m-1·s-3)T temperature (K)Th heating temperature (K)YM contribution of the fluctuating dilatation in compressible turbulence to the overall dissipation rate(kg·m-1·s-3)a interfacial area between the gas and liquid(m2/m3)k turbulence kinetic energy (m2/s2)keff effective thermal conductivity (W·m-1·K-1)p pressure (Pa)t time (s)u the B type uncertainty (% or kg/m3)ui velocity of ith phase xn,q mass fraction of the species n in the qth phase xi, xj coordinate axis αl volume fraction of liquid phases αg volume fraction of gas phases αq volume fraction of qth phase ρ density (kg/m3)ρg density of the gas (kg/m3)ρl density of the liquid (kg/m3)ρq density of the qth phase (kg/m3)Δ minimum degree of the apparatus (% or kg/m3)σ combined uncertainty (% or kg/m3)μ dynamic viscosity (Pa·s)μg dynamic viscosity of the gas (Pa·s)μl dynamic viscosity of the liquid (Pa·s)μeff effective dynamic viscosity (Pa·s)τc time constant (s)ε dissipation rate of turbulence kinetic energy εf fuel load u velocity (m/s)g gravitational acceleration (m/s2)
The safety of the aircraft fuel tank has been significantly emphasized since TWA flight 800 exploded due to a fire in its empty center tank in 1996.1Flammability reduction of the fuel tank system is valuable for preventing fuel tank explosion.2A series of studies were conducted by the Federal Aviation Administration,and it was found that the mixture of the fuel vapor and oxygen can be considered noncombustible and the fuel tank can be considered safe when the ullage oxygen volume fraction is below the Limiting Oxygen Concentration (LOC).3-5The LOC can be set as 12% for commercial transport aircraft and 9%for military aircraft.6,7The fuel tank inerting system has been determined to be practical for reducing the ullage oxygen concentration. In recent years, the Onboard Inert Gas Generation System (OBIGGS) has been applied as the most promising and reasonably cost-effective inerting system, generating Nitrogen Enriched Air (NEA) to replace the oxygen in ullage to reduce the oxygen concentration below the LOC to achieve fire retardation and suppression.8,9
In recent decades, numerous studies of the OBIGGS have been conducted. Cavage and Bowman1modeled the ullage oxygen concentration distribution of a scale replica model of a Boeing 747 center wing fuel tank. Pei and Shi10analyzed the impact of projectile hits on the aircraft fuel tank inerting system and demonstrated that the fuel load is the main factor influencing the oxygen concentration. Burns and Cavage11designed a series of experiments and calculations to determine the quantity, purities and flow rates of the NEA for aircraft fuel tank inerting.
Unfortunately, in those studies, the authors focus on the oxygen concentration in ullage without considering the effect of the dissolved oxygen of the fuel load.During flight,the temperature and pressure of the aircraft tank change with the altitude, and the fuel may act as a heat sink in the environmental control system, thereby resulting in a temperature increase.Thus, the dissolved oxygen may be released from the fuel into the adjacent inert ullage to increase the oxygen concentration.12Harris and Ratcliffe13used dimensional modeling to predict the fuel outgassing behavior and the oxygen concentration change during the flight envelope.It was found that when the ullage pressure decreases from 800 mbar(1 mbar=100 Pa) to 200 mbar, the ullage oxygen concentration will increase from 21% to 26% due to the release of dissolved oxygen from the Jet-A fuel. Cavage14evaluated the potential increase in ullage oxygen concentration upon stimulation and found that the maximum increase in the oxygen concentration in ullage was 7% for an 80%-fuel-load tank for which up to 6% of the gas in ullage was inert. Therefore,determining how the oxygen concentration of the aircraft fuel tank varies according to the dissolved oxygen evolution under various conditions is important for improving the design of the OBIGGS and future on-demand inert systems,which will control the properties of the NEA according to the ullage oxygen concentration to decrease the aircraft compensatory loss.
The flammability of the aircraft fuel tank is determined by the Fuel Tank Flammability Assessment Method (FTFAM),and a slight oxygen concentration change may result in a large deviation of the flammability.The FTFAM uses Monte Carlo statistical methods to generate flammability data,in which the most important parameter is the time constant that represents the oxygen evolution rate.5Although the time constant is specified by the Federal Aviation Administration for some flights,the effects of the fuel load and the rate of climb on the time constant are not considered. In addition, the evolution rate of the dissolved oxygen is closely related to the properties of the fuel because there are substantial differences in the solubility and diffusion coefficients among different fuels,such as Jet A fuel (America and Europe) and RP3 jet fuel (China). However, the effect of the dissolved oxygen evolution on the adjacent ullage is typically studied experimentally, which has the disadvantages of long experiment time and high cost; moreover, it is not possible to consider all the influence factors in the limited experiments.14Therefore,the Computational Fluid Dynamics (CFD) method provides an effective alternative approach for assessing the performance of the dissolved oxygen evolution under multiple conditions.
In recent years,the CFD method has been applied widely in the fields of energy and chemical engineering.According to the previous literature,15-18the CFD method is a precise and efficient for investigating the heat and mass transfer between two phases of fluid. However, studies using the CFD method to investigate the effect of the dissolved oxygen evolution from the jet fuel on the oxygen concentration change in ullage are relatively scarce.
The present paper studies the dissolved oxygen evolution of an inert aircraft fuel tank under different temperature,pressure and fuel load conditions (Fig. 1) using the Volume Of Fluid(VOF)model in the CFD software.The oxygen concentration variation in ullage and the time constant that represents the oxygen evolution rate between the gas and liquid were investigated.An experimental apparatus was also constructed to verify the CFD simulation.
2. Mathematical model of CFD
2.1. Governing equations for two-phase flow behavior
The VOF model performs better for concurrent stratified flow and is mainly used to track the interface between two or more immiscible fluids by solving the phase continuity equation.19,20Therefore, the VOF model is suitable for studying the dissolved oxygen evolution through the interface between the fuel and gas in the aircraft fuel tank. The governing equations are expressed as follows:
(1) Mass conservation equation19

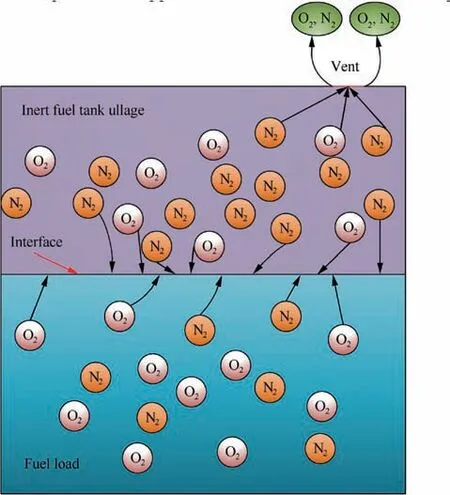
Fig. 1 Schematic diagram of dissolved oxygen evolution in an inert aircraft fuel tank.
(2) Energy conservation equation19

(3) Momentum conservation equation19

(4) Turbulence equation
The Renormalized Group (RNG) k-ε turbulence model is used to describe the internal flow, and the turbulence kinetic energy k and its rate of dissipation ε can be expressed as19
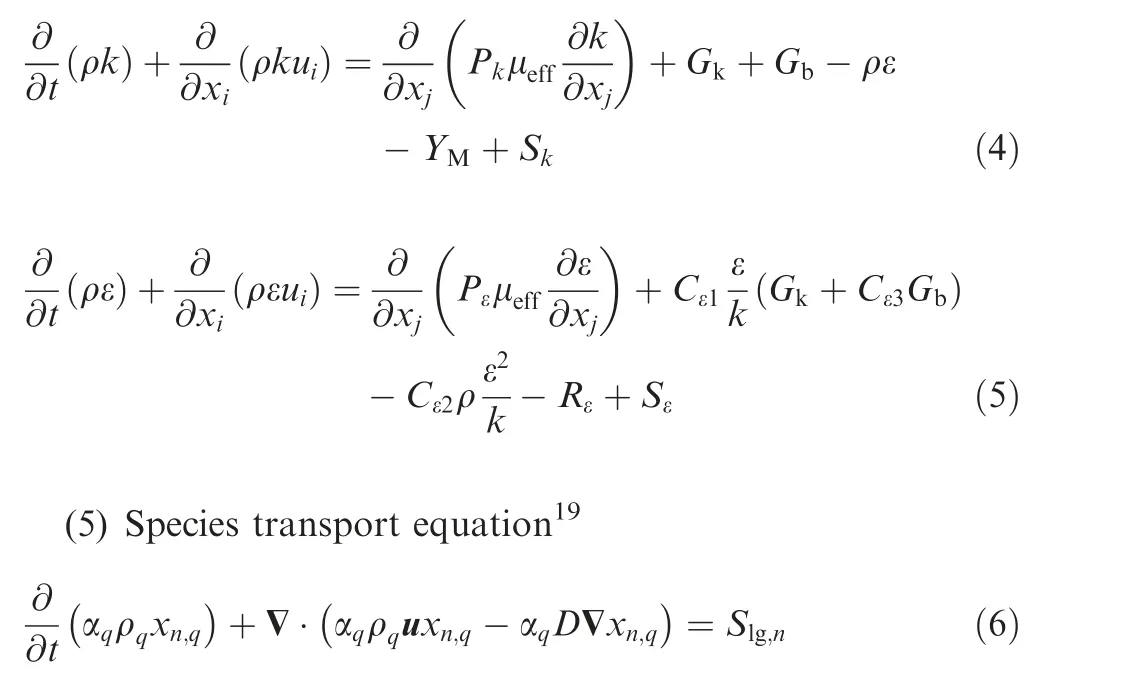
(6) Volume fraction continuity equation
The VOF method is adopted to obtain the position of the phase interface by calculating the volume fraction αqof the qth phase in the cell, and there are three possible conditions for αq: (A) αq=0, there is no qth phase in the cell; (B)αq=1, the cell is completely filled with the qth phase; (C)0 <αq<1, there exists an interface between the qth phase and another phase or more fluid in the cell. Then, the free interface can be tracked by solving the phase volume fraction continuity equation:

In the gas and liquid two-phase fluid system,the properties of the mixture,for example,the density and viscosity in the cell can be expressed as

2.2. Mass transfer source
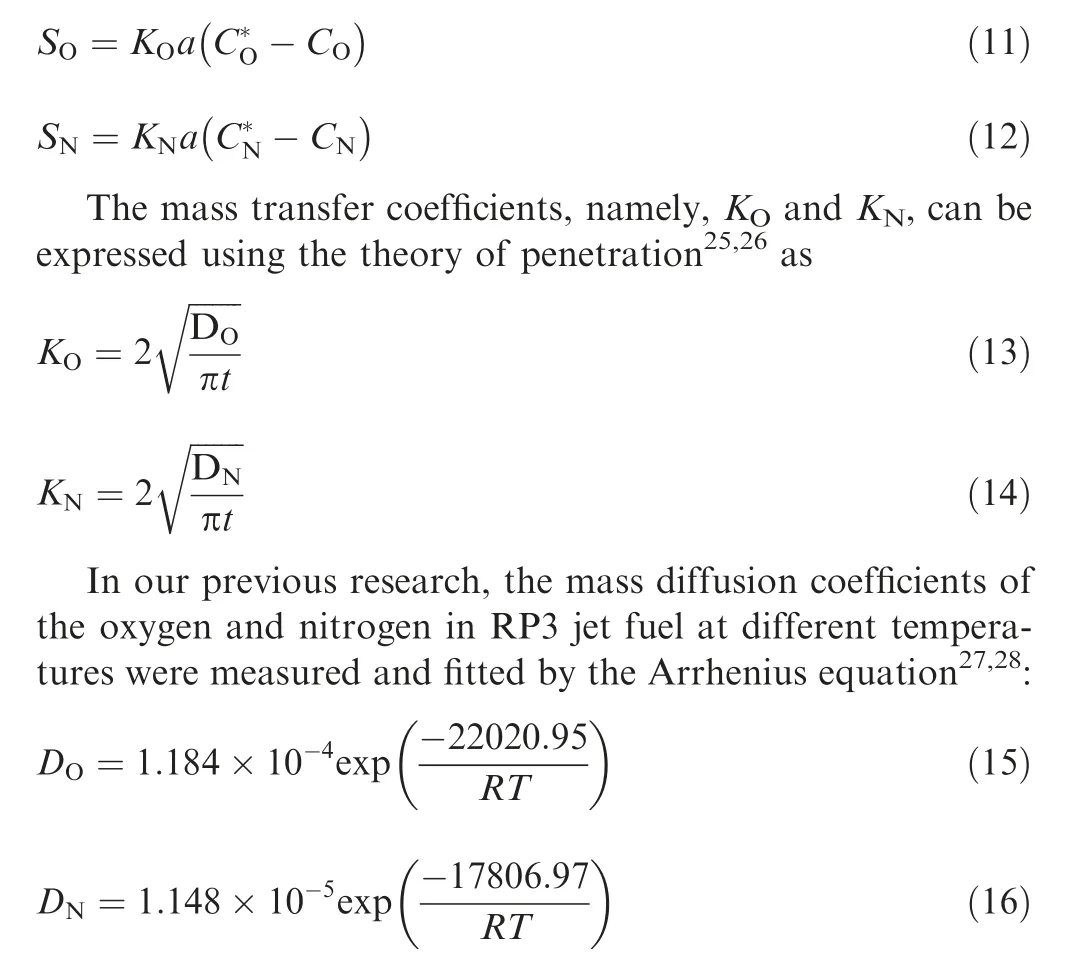
In an inert aircraft fuel tank,the concentration of the dissolved oxygen or nitrogen at the gas-liquid interface can be calculated according to the oxygen or nitrogen partial pressure in ullage with the law of Ostwald coefficient.21Then, the mass transfer occurs at the interface between the gas and the liquid until the concentrations reach equilibrium and the mass transfer source must be loaded at the interphase to realize the dissolved gas evolution using the User Defined Function (UDF).22In the process of mass transfer, the changes in the temperature and pressure of the fuel tank will affect the mass transfer rate and increase the concentration discrepancy between the ullage and the dissolved oxygen and nitrogen.23,24For the fuel tank system, the oxygen and nitrogen mass transfer between the ullage and fuel can be expressed as
3. Simulation details
In this work, two-dimensional fuel tank models are applied to simulate the variation in the oxygen concentration in ullage over the dissolved oxygen evolution. A sketch of the aircraft fuel tank is presented in Fig. 1. The length and width of the tank are both 200 mm. On the top of the tank, there is a 10 mm vent with a one-way valve that allows gas to escape only if there is a pressure difference between the fuel tank ullage and the ambient.The commercial CFD software Fluent 18.0 is used to simulate the gas evolution on structural grids.The boundary condition of the fuel tank wall is set as a ‘‘noslip wall”,and the vent on the tank top is set as‘‘pressure out”.In the solution methods, Pressure-Implicit with Splitting of Operators (PISO) is applied to the pressure-velocity coupling with the widely recommended PRESTO! method of pressure spatial discretization.29To reduce the computational burden,First-order upwind is used in the turbulent equation.30The ullage gas can be assumed to be composed of only oxygen and nitrogen, and it can be assumed that only oxygen and nitrogen are dissolved in the RP3 jet fuel in the tank.
To accurately simulate the gas evolution, three grids of the fluid domain (with grid sizes of 40000, 25000, and 10000) are proposed to verify the independence of the mesh. In the simulation, the surrounding walls are heated at a constant temperature of 323 K for an 80%-fuel-load tank with an initial temperature of 300 K whose ullage is 6%inert by volume fraction. The simulation results of the oxygen concentration in ullage and the dissolved oxygen in the fuel are presented in Figs. 2 and 3. Clearly, a grid size of 25000 is sufficiently fine for calculating the dissolved oxygen evolution with less computational time. Therefore, the grid with 25000 elements is adopted for additional study in this paper.
4. Experimental validation of simulation
An experimental system is designed to evaluate the CFD simulation by measuring the oxygen concentration in ullage and the dissolved oxygen concentration in the fuel under the stimulation of heating the surrounding wall or decreasing the ambient pressure. A diagram of the experimental apparatus is shown in Fig.4 and a photograph of the experimental apparatus is shown in Fig. 5.
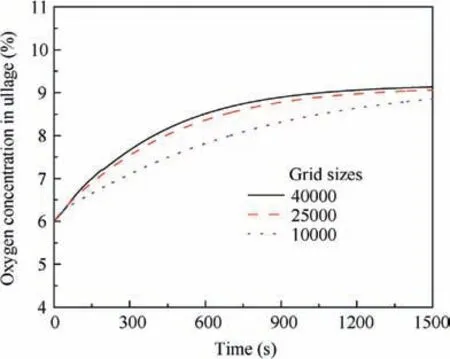
Fig. 2 Oxygen concentration in ullage for three types of grids.
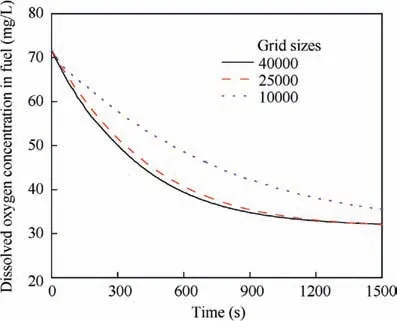
Fig. 3 Dissolved oxygen concentration in fuel for three types of grids.
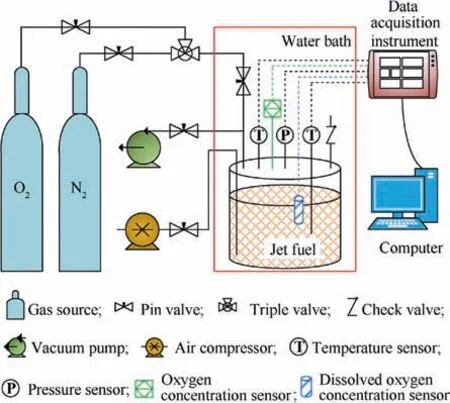
Fig. 4 Diagram of experimental apparatus.
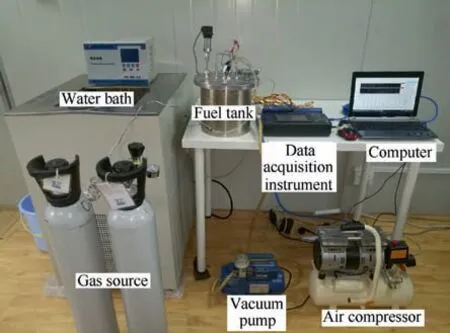
Fig. 5 Photograph of experimental apparatus.
The cylindrical fuel tank is made of stainless steel and has a diameter of 200 mm and a height of 200 mm. The purities of the gas sources of O2and N2in the experiment exceed 99%.The RP3 jet fuel, which is used widely in China,was provided by the Aviation Industry Corporation of China. By adjusting the valve at the outlet of the gas cylinder, the mixture of O2and N2is driven to the ullage to decrease the oxygen concentration to create an inerted environment at the beginning of the experiment. A vacuum pump is used to decrease the pressure of the fuel tank to replicate the pressure effect on the dissolved oxygen evolution and a water bath is used to replicate the effect of heating in the experiment. An air compressor is employed to saturate the RP3 jet fuel with air before and after the experiment by scrubbing the fuel using the compressed air.The temperatures of the gas and fuel are measured using two Type K thermocouples, which have an accuracy of 0.1 K. A pressure sensor is used to measure the ullage pressure during the experiment within full-scale 0.1% precision. A Maxell KE-25 oxygen sensor and a Maxell KDS-25B dissolved oxygen sensor were provided by FIGARO. The two sensors are galvanic-cell-type analyzers with the advantages of stable signal output and long operating life, and their precisions have been verified to be within 5% in our previous study.31All the data signals are collected by the data acquisition instrument and stored in the computer for future analysis.
Two experimental cases were considered in the verification of the CFD simulation and each was repeated three times to obtain reliable data.In Case I,the effect of heating on the oxygen evolution was modeled.The RP3 jet fuel was injected into the tank until the tank was 70% full by volume and saturated with air at an external temperature of 300 K. Then, the ullage was inerted to an initial oxygen concentration of 6% (by volume),and the tank was placed in a water bath with a constant temperature of 323 K.Case II models the effect of the pressure on the oxygen evolution.This case also has a fuel load of 70%,an external temperature of 300 K and an initial oxygen concentration of 6% in the ullage same. Then, the vacuum pump was turned on to decrease the ullage pressure of the tank.
The oxygen concentrations in ullage and the fuel were recorded and compared with the CFD results, as shown in Figs.6 and 7.In the direct measurement of the oxygen concentration in ullage and dissolved oxygen concentration, the A type uncertainty could be expressed as
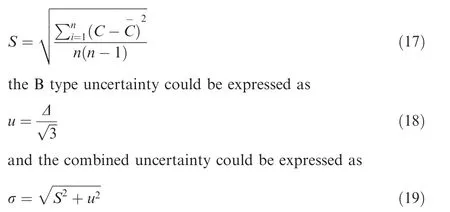
In the experiment Case Ⅰ, the maximum combined uncertainty of the oxygen concentration in ullage is 0.44%, and 1.76 mg/L for the dissolved oxygen concentration. In the experiment Case Ⅱ, the maximum combined uncertainty of the oxygen concentration in ullage is 0.59%, and 2.26 mg/L for the dissolved oxygen concentration.
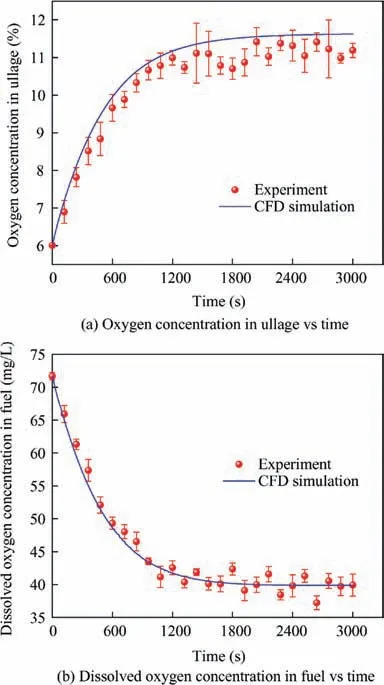
Fig.6 Comparison between experiment and CFD simulation of oxygen concentrations under stimulation of heating.
In Case Ⅰ, the maximum relative differences of the oxygen concentration in ullage and the dissolved oxygen concentration between the experiment and simulation are 7.48%and 7.14%,respectively. In Case Ⅱ, the maximum relative differences of the oxygen concentration in ullage and the dissolved oxygen concentration between the experiment and simulation are 6.01% and 4.36%, respectively. Therefore, the CFD simulation results agree well with the experimental results and the CFD method can be applied to predict the oxygen concentration variation in ullage of the aircraft fuel tank.
5. Results and discussion
5.1. Influence of stimulation of heating
As introduced above,the mass transfer coefficients and the solubilities of the oxygen and nitrogen are closely related to the temperature. To determine the effect of heating on the dissolved oxygen evolution,the fuel tank is heated at various temperatures under various fuel loads and initial oxygen concentrations. In the simulation, the heating temperature This set at 303, 323 and 343 K; the fuel load εfis set at 30%,50% and 70%; and the initial oxygen concentration in ullage of an inert tank COIis set at 6%, 9% and 12%.
As shown in Fig.8,the oxygen concentration in ullage versus time, which is determined by the dissolved oxygen evolution, is presented. The results demonstrate that the higher the heating temperature is, the greater the increase of the oxygen concentration in ullage at the same fuel load and initial oxygen concentration. The distributions of the dissolved oxygen concentration for three cases at a specified time for a fuel load of 70% and an initial oxygen concentration of 6% are shown in Fig. 9. The trend in Fig. 9 can be explained as follows: the increase in the heating temperature accelerates the process of dissolved oxygen evolution, which is due to the increase of the mass transfer rate with temperature.
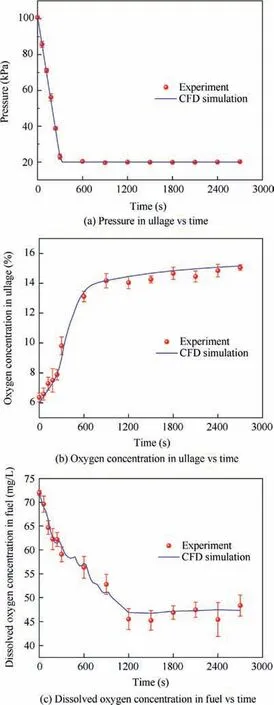
Fig.7 Comparison between experiment and CFD simulation of pressure and oxygen concentration under stimulation of a pressure decrease.
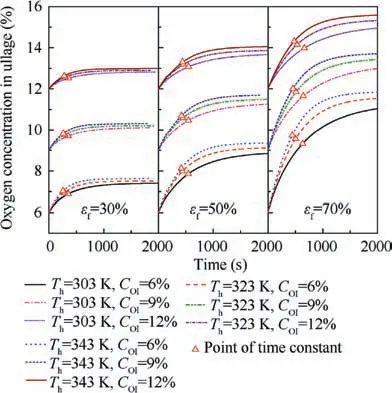
Fig. 8 Oxygen concentrations in ullage due to heating under various conditions.
The variations in the oxygen concentration in ullage for all cases are also obtained, as shown in Fig. 10.The heating temperature has a smaller effect on the oxygen concentration variation than the fuel load and the initial oxygen concentration in ullage. The oxygen concentration variation increases with the increase in the fuel load and the decrease in the initial oxygen concentration. The magnitude of the oxygen concentration change in ullage ranged from 0.82% (temperature 303 K, fuel load 30%, and inert to 12%) to 5.92% (temperature 343 K,fuel load 70%, and inert to 6%). Consider, for example, the commercial transport aircraft: when the fuel load is 70% and the tank is inerted to 9%, the oxygen concentration in ullage likely exceeds the LOC, thereby rendering the fuel tank flammable.
The oxygen evolution rates from the fuel to a tank’s ullage can be expressed using the time constant that corresponds to the time at which 63.2%of the total oxygen evolution has been completed.13The values of the time constant at various points during the heating process are also presented in Fig.8.The initial oxygen concentration has little effect on the time constant and the effect can be considered identical in simulations at various initial oxygen concentrations.The values of the time constant are extracted and plotted in Fig. 11. The time constant decreases with the increase of heating temperature and the decrease of fuel load. The time constant ranges from 646 s(temperature 303 K and fuel load 70%) to 266 s (temperature 343 K and fuel load 30%). The time constant varies with the temperature and the fuel load can be expressed using a polynomial such as Eq.(20)with the help of Nonlinear Curve Fitting software 1stOpt with the method of Levenberg-Marquardt and Universal Global Optimization, which yields a coefficient of determination R2value of 0.999 and a maximum relative difference of 4.77%.

5.2. Influence of stimulation of a pressure decrease
During the climbing and cruising of the aircraft, the decrease in ullage pressure causes an increase in the pressure discrepancy between the ullage and the dissolved gas,and the oxygen will be released from the fuel into the adjacent ullage,resulting in an increase in the oxygen concentration in ullage. To determine the effect of the dissolved oxygen evolution that results from the pressure discrepancy on the oxygen concentration change in ullage, simulations under various pressures, fuel loads and initial oxygen concentrations have been conducted.
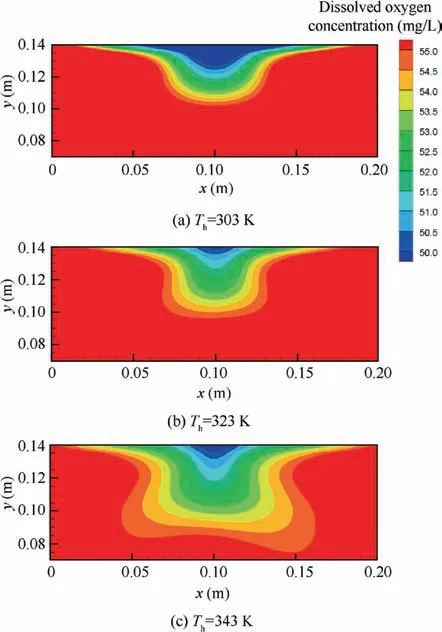
Fig. 9 Distributions of dissolved oxygen concentration at a specified time under stimulation of heating.
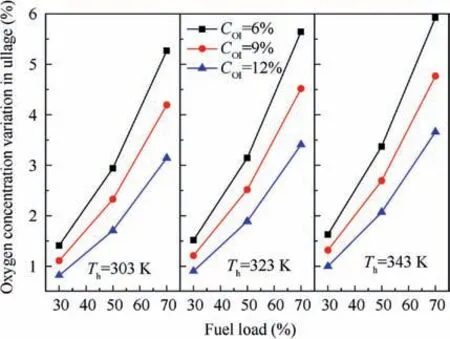
Fig. 10 Oxygen concentration variations in ullage at various temperatures.
In the simulations, the pressure is assumed to be constant and set as 80 kPa, 50 kPa and 20 kPa. The fuel load and the initial oxygen concentration in ullage are set to the same values as in the heating stimulation discussed above. In Fig. 12, the simulation results on the oxygen concentration in ullage are presented. According to the figure, the lower the pressure is,the greater the increase in the oxygen concentration in ullage at the same fuel load and initial oxygen concentration. The dissolved oxygen concentrations in the fuel for three cases under a fuel load of 70% and an initial oxygen concentration of 6% are also presented in Fig. 13.The lower the pressure is,the more dissolved oxygen is released from the fuel. It is most likely that the concentration difference increases between the gas and the fuel at lower pressure.
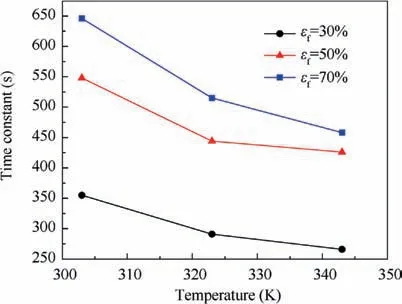
Fig. 11 Time constant values of dissolved oxygen evolution at different temperatures and fuel loads.
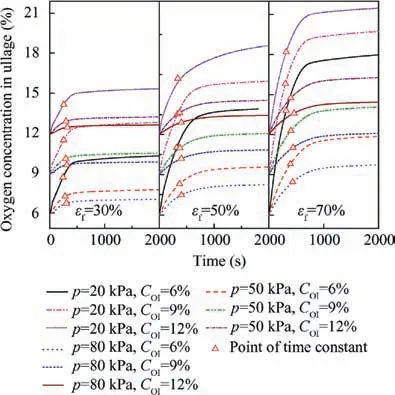
Fig. 12 Oxygen concentrations in ullage under pressure decreases and various conditions.
The oxygen concentration variations in ullage for various cases are plotted in Fig. 14. This figure illustrates that the initial oxygen concentration has a small effect on the variation of the oxygen concentration in ullage compared with the pressure and the fuel load.The maximum variation is 12.36%(pressure 20 kPa, fuel load 70%, and inert to 6%) and the minimum is 0.735% (pressure 80 kPa, fuel load 30%, and inert to 12%).
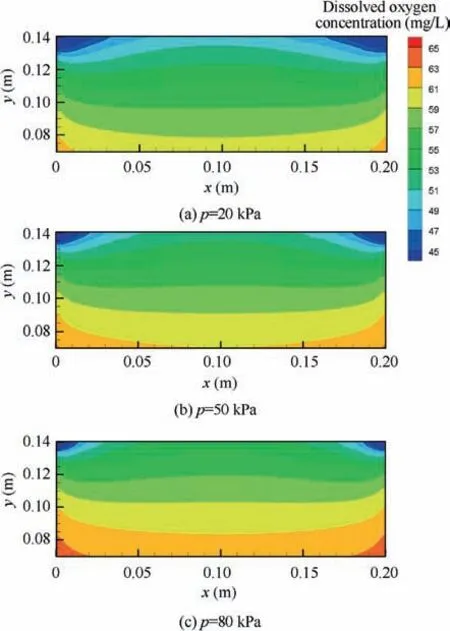
Fig. 13 Distributions of dissolved oxygen concentration at a specified time under stimulation of pressure decrease.
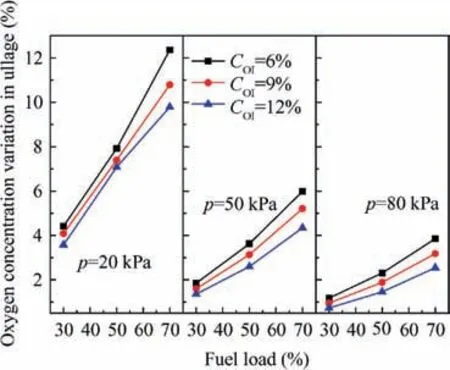
Fig. 14 Oxygen concentration variations in ullage at various pressures.
The time constant of the dissolved oxygen evolution is plotted in Fig.15 and the effect of the initial oxygen concentration in ullage can be neglected when calculating the time constant.The time constant increases with the pressure and fuel load,and ranges from 251 s at a fuel load of 30% and a pressure of 20 kPa to 444 s at a fuel load of 70% and a pressure of 80 kPa. The time constant can be expressed as a polynomial,as in Eq. (21) with the help of Nonlinear Curve Fitting software 1stOpt with the method of Levenberg-Marquardt and Universal Global Optimization, which yields an R2value of 0.997 and a maximum relative difference of 5.02% (Fig. 15).

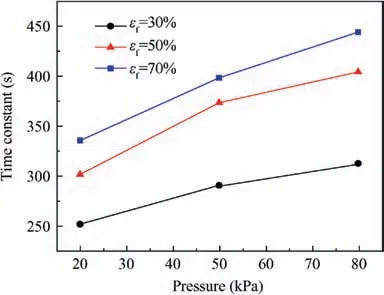
Fig. 15 Time constant values of dissolved oxygen evolution at various pressures and fuel loads.
6. Conclusions
(1) The CFD method is applied to predict the oxygen concentration variation in ullage of an inert aircraft fuel tank from the dissolved oxygen evolution. An experiment is conducted to evaluate the accuracy of the simulation. The oxygen concentration in ullage will increase with the stimulations of heating and pressure decrease.
(2) The increase in the oxygen concentration in ullage can reach 5.92% with heating stimulation at a temperature of 343 K, a fuel load of 70% and an initial oxygen concentration of 6%. With the stimulation of a pressure decrease, the change in the oxygen concentration could reach 12.36% at a pressure of 20 kPa, a fuel load of 70% and an initial oxygen concentration of 6%.
(3) The greater evolution of dissolved oxygen under various temperatures could be explained by the increase in the mass transfer rate due to the higher temperature and the lower pressure that results from the larger increase in the oxygen concentration in ullage, which causes a larger concentration difference between the fuel and the gas.
(4) The time constant of the dissolved oxygen evolution is independent of the initial oxygen concentration of an inert fuel tank but closely related to the temperature,pressure and fuel load. Under the stimulations of heating and pressure decrease, the time constant can be expressed as a polynomial equation. The maximum relative differences between the fitted values and the simulation results for the heating and pressure are 4.77%and 5.02%, respectively.
(5) In this paper, the rule of dissolved oxygen evolution is studied with mass and heat transfer model that is more accurate to predict the oxygen concentration variation in ullage of the fuel tank. The fitted polynomial expressions could accurately represent the function of time constant with temperature, pressure and fuel load.Therefore, the prediction model of time constant could be used to the study of fuel tank inerting system in the future.
Acknowledgements
This study was financially supported by NSFC-Civil Aviation Joint Research Fund, China (No. U1933121), Scientific Research Program Funded by Shaanxi Provincial Education Department, China (No. 19JK0374), the Postgraduate Research&Practice Innovation Program of Jiangsu Province,China (No. KYCX19_0198), the Fundamental Research Funds for the Central Universities and Priority Academic Program Development of Jiangsu Higher Education Institutions.
 CHINESE JOURNAL OF AERONAUTICS2020年7期
- CHINESE JOURNAL OF AERONAUTICS的其它文章
- An experimental method for squealer tip flow field considering relative casing motion
- A novel none once per revolution blade tip timing based blade vibration parameters identification method
- Highly efficient computation method for hazard quantification of uncontained rotor failure
- Optimal motion cueing algorithm for accelerating phase of manned spacecraft in human centrifuge
- Effective control allocation using hierarchical multi-objective optimization for multi-phase flight
- Fault-tolerant control and vibration suppression of flexible spacecraft: An interconnected system approach
