Experimental investigation of boundary layer transition over a delta wing at Mach number 6
Haibo NIU, Shihe YI, Xiaolin LIU, Xiaoge LU, Dundian GANG
College of Aerospace Science and Engineering, National University of Defense Technology, Changsha 410073, China
KEYWORDS Boundary layer;Crossflow;Delta wings;Hypersonic;Stanton number;Temperature-sensitive paint;Transition
Abstract An experimental study on the boundary layer transition over a delta wing was carried out at Mach number 6 in a quiet wind tunnel. The Nano-tracer-based Planar Laser Scattering(NPLS)and Temperature-Sensitive Paints(TSP)techniques were used to measure the fine flow field structure and the wall Stanton number of the delta wing.The influence of factors such as the angle of attack and the Reynolds number was studied.The following results were obtained.The boundary layer transition between the leading edge and the centerline was dominated by the crossflow instability.At the location of the initial appearance of the traveling crossflow waves,the Stanton number began to rise. The Stanton number reached a maximum when the crossflow waves were broken up to turbulence. Increasing the angle of attack increased the spanwise pressure gradient at the windward side of the delta wing,thereby increasing the crossflow instability and advancing the boundary layer transition front. However, increasing the angle of attack caused the transition front to move backward at the leeward side. In addition, the sensitivity of the boundary layer transition to the Reynolds number varied with the angle of attack and the region.
1. Introduction
The laminar-turbulent boundary layer transition is a nonlinear complex flow phenomenon in physics that is affected by multiple coupling factors.The boundary layer transition is marked by significant changes in the frictional resistance and heat flux,which significantly impacts the design of hypersonic vehicles.With increasing Mach numbers, aerodynamic heating issues become increasingly serious. After the boundary layer transition,the wall heat flux can increase three-to eight-fold, which requires increased aircraft heat protection.1,2Therefore, it is especially important to understand the process and mechanism of the boundary layer transition.3
Several modes have been identified for the linear phase of the hypersonic boundary layer transition: the main modes are the second mode,the Go¨rtler instability,and the crossflow instability. Mack pointed out that the second mode is a longitudinally radiated acoustic disturbance wave that is reflected between the local sound velocity line and the wall surface to produce a ‘‘rope structure” in the boundary layer.4,5In recent years, using the flow visualization technique, Liu et al.6and Zhang et al.7have clearly observed the rope-like disturbance wave and researched its development.The Go¨rtler instability is caused by centrifugal forces and only develops in the presence of curved walls.8-10The crossflow instability is a typical threedimensional flow phenomenon. A pressure gradient induces a velocity that is called the crossflow component, which is perpendicular to the inviscid streamlines. The crossflow component produces a three-dimensional boundary layer velocity profile11-13that causes an instability in the boundary layer.14Real aircraft are three-dimensional. Therefore, studying the crossflow instability has more practical significance.
The crossflow instability can be divided into steady crossflow vortices and traveling crossflow waves.14,15In the nonlinear phase, a secondary crossflow instability occurs.10In lownoise environments, the steady crossflow vortices dominate,and the initial disturbance is introduced by roughness near the attachment line. In high-noise environments, traveling crossflow waves dominate, and the initial disturbance is introduced by vortices in the freestream. Moyes et al.16,17showed that the secondary cross-flow instability caused the boundary layer to eventually rupture into turbulence.
Juliano et al.18,19studied the boundary layer transition over an elliptical cone in the BAM6QT wind tunnel. There were traveling waves between the long and short axes of the elliptical cone. Borg et al.20,21obtained the heat flux distribution over the elliptical cone surface and found that when the wind tunnel was in the quiet state, the steady crossflow vortices caused heat strips to appear on the surface of the elliptical cone; however, when the wind tunnel was in the noise mode,the boundary layer transition had a smooth front, which may have been caused by traveling crossflow waves. The authors used high-frequency pulsating pressure testing technology to obtain a signal for the traveling crossflow waves with a peak frequency of 30-50 kHz.
The delta wing configuration is one of the basic shapes used in a hypersonic vehicle and can be modeled as a deformed elliptical cone. Vaganov et al.22used the TSP technique to measure the location of the boundary layer transition for a delta wing and illustrated the influence of factors such as the nosetip shape and the swept angle. However, the authors did not investigate the mechanism of the boundary layer transition and the influence of variable parameters have not been explained. Brazhko et al.23studied the aerodynamic heat of a delta wing using temperature-sensitive paints technology at a Mach number of 7.5.The surface heat flux data and the location of the boundary layer transition to the turbulent state were obtained. The effects of the angle of attack and the Reynolds number on the location of the transition were also found.
In the present study, we investigated a flat-plate delta wing with an R3.5 mm blunt nosetip and an R3.5 mm leading edge.The NPLS technique was used to determine the fine flow structure of the boundary layer in a typical state, and the mechanism of the boundary layer transition was analyzed. In addition, the effects of the Reynolds number and the angle of attack on the boundary layer transition of the delta wing were analyzed in detail.
2. NUDT Mach number 6 quiet tunnel
The equipment used in this study consisted of the hypersonic quiet wind tunnel at the National University of Defense Technology (NUDT), as shown in Fig. 1. The Mach number of the nozzle outlet was 6, the diameter of the nozzle outlet was 300 mm, and the optical window of the test chamber was ∅250 mm. The following specifications correspond to the maximum capacity that could be realized in the wind tunnel.The highest total temperature was 600 K,the highest total pressure was 3 MPa,and the highest freestream unit Reynolds number was 3.45×10⁷m-1.24The total temperature that was used in this study was 425 K,which was a satisfactory anticondensation temperature.
The main components of the wind tunnel system were a high-pressure air source,a heater,a settling chamber,a nozzle,a test chamber, and a vacuum system. Several measures were undertaken to reduce the noise level of the wind tunnel:multi-layer damping nets were placed in the settling chamber,a suction design was adopted for the nozzle throat, and the nozzle was mirror-finished.
3. Geometry
Fig. 2 is a schematic of the model that was used in this study.The geometrical shape was a flat plate delta wing,with a length of 500 mm, a width of 250 mm, and a thickness of 7 mm. The bluntness of the nosetip and leading edge was R3.5 mm. The origin O of the coordinate system was located at the head of the model,where the x-axis lay along the freestream direction,the y-axis lay in the span direction,and the z-axis was perpendicular to the spanwise plane. The model material was bakelite, which was chosen for its good thermal insulation and heat resistance. That is, this material met the experimental requirements for the temperature-sensitive paints technology while not deforming under the high total temperature of the hypersonic flow.
4. Temperature-sensitive paints instrumentation
4.1. Characteristics of temperature-sensitive paints technology
The Temperature-Sensitive Paints(TSP)were obtained by dissolving a temperature-sensitive fluorescent molecular powder into an alcoholic solution of PolyVinyl Butyral (PVB). The paint was shaken rigorously before use to prevent deposition.The TSP were sprayed on the model using a spray gun with a∅0.2 mm outlet. The coating was approximately 20 μm thick,which was consistent with the coating thickness that was used for the static calibration. To enhance the signal-to-noise ratio,a white base coating was first sprayed onto the model. To cover the color of the model, the base coating was required to be as thin as possible so as to not affect the heat transfer characteristics of the model.The base coating was 5 μm thick,as measured by a film thickness meter.
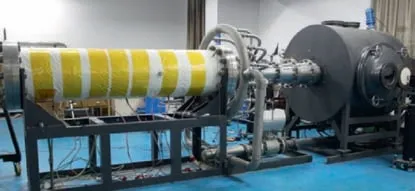
Fig. 1 Hypersonic quiet wind tunnel.
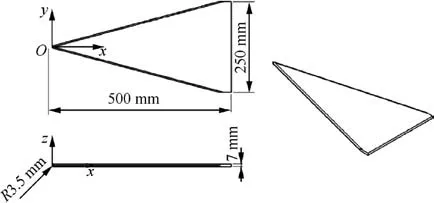
Fig. 2 Schematic of delta wing model.
The static calibration of the TSP was carried out in an incubator. The coating thickness of the sampling plate was 20 μm.A K-type thermocouple was fixed behind the calibration plate to measure the local temperature accurately. The calibration temperature range was 5-80°C (278-353 K), and the data were collected in 5°C increments. The calibration curve is shown in Fig.3,where the linearity of the fitted curve was very good. The obtained calibration equation is

where I is the light intensity when the wind tunnel run,T is the temperature on the model surface, Irefand Trefis the reference light intensity and reference temperature respectively. And by combining the calibration curve with the noise level of TSP,the temperature resolution of TSP was on the order of 0.5°C.
4.2. Other hardware for TSP system
The hardware that was used with the TSP system included light sources, a filter, a camera, etc. Two UltraViolet Light-Emitting Diode arrays (UVLEDs) with wavelengths of 365 nm were used to excite the TSP for a total power of 80 W. A 460 nm high-pass filter was used to remove the short-wavelength light from the UVLEDs, so that only temperature-dependent long-wavelength light entered the camera.
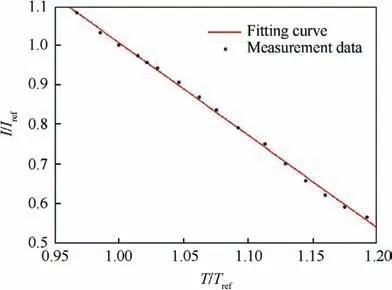
Fig. 3 Calibration curve of TSP (Tref=303.15 K).25
The camera was a 14-bit CCD with an image size of 2048×2456 pixels. A spatial resolution of 97.08 μm per pixel was used for the TSP image in this study.The camera exposure time was 1 ms, and the frame rate was 10 Hz. 10 light-on and 10 light-off images were collected before the wind tunnel run,and the wind-on images were acquired while the wind tunnel was running. The following formula was used to calculate the light intensity ratio:

5. NPLS technique
5.1. NPLS system and operating principle
The Nano-tracer-based Planar Laser Scattering (NPLS) technique is a noncontact fine flow field testing technology with a high spatial and temporal resolution and a high signal-tonoise ratio. This technique can be used to clearly determine the flow field structure of a boundary layer and has been applied in supersonic and hypersonic boundary layer transition research.26,27As shown in Fig. 4, the NPLS system consisted of a nanoparticle generator, a Nd:YAG laser, a crossframe CCD camera,and a synchronous controller.The NPLS operated as follows: the nanoparticle generator produced nanometer-sized particles that were uniformly mixed with the experimental gas in the pipeline and the settling chamber.Then,the mixing gas was passed through the nozzle to achieve uniform spreading of the particles. In the test section, under the action of the synchronous controller, the laser light and the CCD camera worked in tandem to image the flow field structure in the laser layer sheet plane. The imaging time was determined by the exit time of the laser light of 6 ns. The flow field was considered to be ‘‘frozen” during this time, and the NPLS image was transient.28
5.2. Experimental layout of NPLS system
The NPLS technique was used to obtain the spanwise fine flow field structure of the boundary layer. The experimental layout is shown in Fig.5.The laser sheet was parallel to the surface of the model, and the camera was positioned above the model to collect the light that was scattered by the particles in the laser sheet plane. The light was placed at three different heights from the model surface in this study: 0.5 mm, 1 mm, and 2 mm. Following previous research,29the image grayscale was used as a measure of the local density so that the flow field structures can be analyzed.
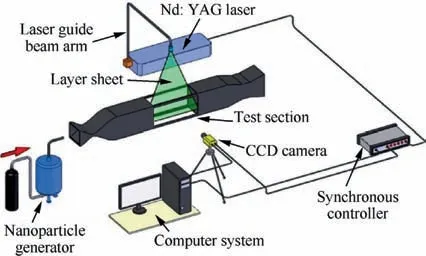
Fig. 4 Schematic of NPLS system.
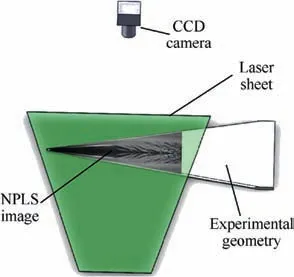
Fig. 5 NPLS experimental layout.
6. Data analysis methodology
6.1. Calculation method for heat flux and Stanton number
The TSP technique was used to obtain the temperature change of the model surface. The heat flux and the Stanton number were calculated from the temperature history of the surface.The general Cook-Felderman formula30was used to calculate the heat flux in this study:

where qw(t)is the heat flux at time t,and ΔTw(t)is the temperature change of the TSP coating. The terms Tw(t) and Tindenote the temperature of the TSP coating at time t and before the operation of the wind tunnel, respectively. The terms k, ρ,and c denote the heat transfer coefficient, the density, and the specific heat capacity, respectively.
Eq. (3) was discretized as follows to facilitate the calculation of qw(t):

where q is the wall heat flux, cpis the specific heat capacity of air, and ρeand ueare the fluid density and the velocity at the edge of the boundary layer, respectively. The terms Tawand Tware the adiabatic wall temperature and the wall temperature, respectively. The terms T0and Teare the total temperature of the freestream and the static temperature at the edge of the boundary layer, respectively. To facilitate the calculation of the Stanton number, we used the adiabatic wall temperature calculation method for laminar flow. The total temperature recovery coefficientγwas calculated as follows:

where Pr is the Prandtl number and is approximately 0.715 for air.31
The heat flux was calculated by assuming that the space was a one-dimensional semi-infinite plane, that is, the direction of heat transfer was assumed to lie in an infinite plane.A material with a low heat transfer rate was used to reduce measurement error. The model material that was used in this study was bakelite, which has a heat transfer coefficient of k=0.19 W/(m·K).
6.2. Transition threshold
The Stanton number exhibits typical behavior in a boundary layer transition: at the laminar stage, as the boundary layer thickens along the flow direction, the shear in the boundary layer decreases so that the Stanton number decreases slowly.With the onset of the boundary layer transition, the Stanton number rises sharply until the boundary layer becomes completely turbulent. Then, the Stanton number decreases slowly again. Fig. 6 shows the typical Stanton number distribution along a delta wing.We can see from the figure that the Stanton number decreases along the flow direction between the centerline and leading edge, after which the Stanton number rises sharply to a maximum before slowly dropping again. Therefore, the boundary layer transition started at x=100 mm and was completed near x=120 mm.
The lowest point along the Stanton number profile was defined as the onset of the boundary layer transition, and the location of the maximum Stanton number was defined as the end of the transition. To quantitatively determine the location of the boundary layer transition,the Stanton number profile of the desired location was taken. Stanton number profiles at three positions were taken in this paper. In the freestream direction, the Stanton number profiles at the centerline and the most upward position of the transition front, which were called centerline and peakline (Fig. 7(a) and (b), were extracted. That is, the Stanton number profile was obtained at y=0 mm and y=-20 mm (see Fig. 6). In the spanwise direction, the Stanton number profile was taken at x=200 mm(Fig.7(c)).This Stanton number profile is shown in Fig. 7. The two curves along the flow direction were averaged using 12 pixels in the spanwise direction and were smoothed over a window with a 6 pixel width. The spanwise Stanton number profile was averaged using 12 pixels along the flow direction and was smoothed over a window with a 6 pixel width. In Fig. 7, the red squares indicate the beginning of the transition, and the red circles indicate the end of the transition. It can be seen that only the onset of the transition occurred at the centerline over the measurement range. The onset and end of the transition occurred at the peakline. In the spanwise direction,the distance for the onset of the transition was defined as the distance between the initial position of the transition and the leading edge of the delta wing. The distance for the end of the transition in the spanwise direction was similarly defined.
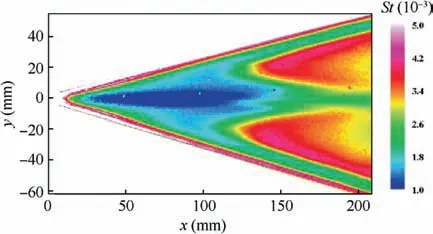
Fig. 6 Typical Stanton number distribution of delta wing(α=10°, Re∞=1.78×10⁷ m-1).
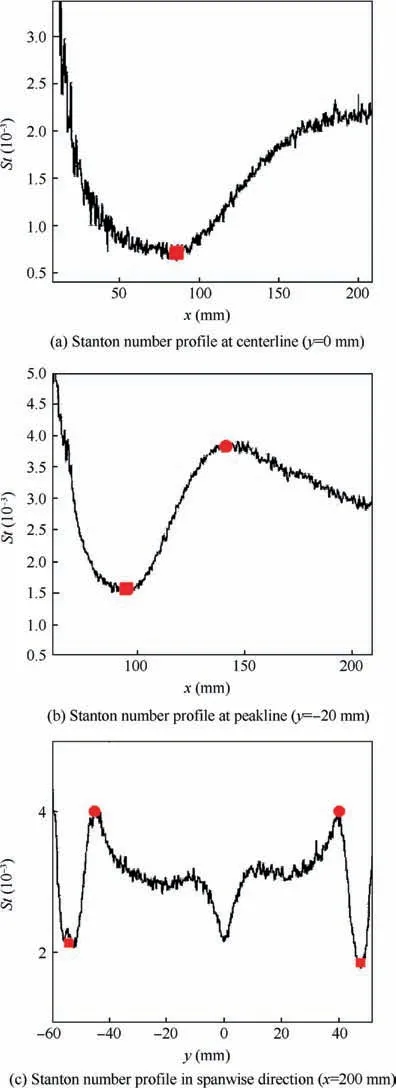
Fig. 7 Stanton number profile at different positions.
7. Results and discussion
7.1. Typical boundary layer transition analysis
Fig. 8 shows the Stanton number distribution over the delta wing at an angle of attack α=0° and Re∞=1.44×10⁷m-1. The Stanton number rose sharply from x=150 mm to a peak at x=180 mm, indicating that the upward most position of the onset and end of the boundary layer transition occurred at x=150 mm and x=180 mm, respectively. In addition, a high-heat strip near the centerline can be observed in Fig. 8, which may be related to the vortex along the freestream direction.
Fig. 9 shows the flow field visualization results that were obtained using the NPLS technique. The laser sheets were located in planes corresponding to z=0.5 mm, 1 mm, and 2 mm. For better viewing, the NPLS results were symmetric about the center plane of the delta wing. In Fig. 9(a) and(b), the laser sheet cut into the interior of the laminar boundary layer. The density within the laminar boundary layer was low, that is, few particles entered the boundary layer, so that most of this region appeared black. The bright structures appearing in Fig. 9(a) and (b) are the vortex structures of the boundary layer.The vortex structure was a signature when the boundary layer was in transition or at the turbulence stage.In Fig. 9(c), the gray value was high for most of the region because the laser sheet was outside the laminar boundary layer. The dark area near the head was due to the influence of the nosetip, which thickened the boundary layer. The dark structures in the downstream area formed because the transition or the turbulence structure brought low density fluid of the ground floor of the boundary layer to the position where the laser sheet was located.
We compared the structures at different z-coordinates. At z=0.5 mm, fractured structures were found from x=180 mm, and relatively regular large vortices were not observable. At z=1 mm, large eddy structures that were roughly parallel to each other were found from x=150 mm and may have corresponded to traveling crossflow waves.The angle between the vortices and the freestream direction was approximately 14-20°.The vortices broke into small structures downstream, indicating that the boundary layer was completely turbulent. At z=2 mm, the upper edge of the large vortices was observable. These large vortices subsequently broke up into small vortices, showing that the boundary layer had become completely turbulent.
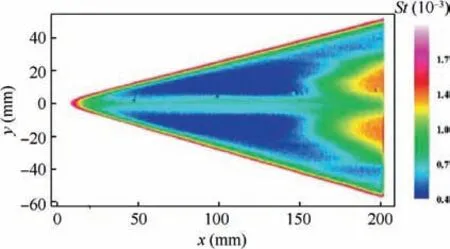
Fig. 8 Stanton number distribution at 0° angle of attack and Re∞=1.44×10⁷ m-1.
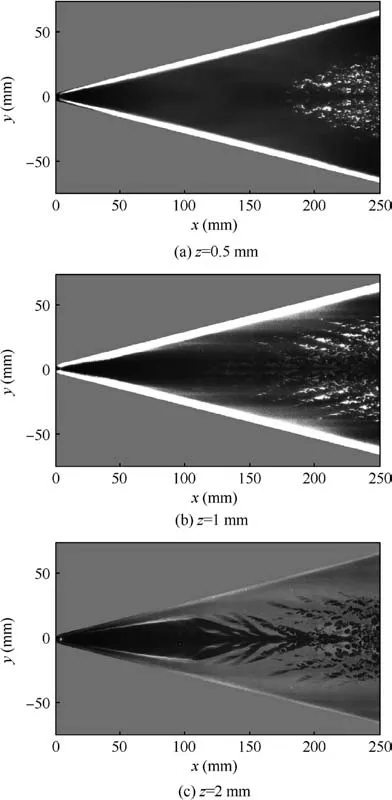
Fig. 9 NPLS images at different z-coordinates.
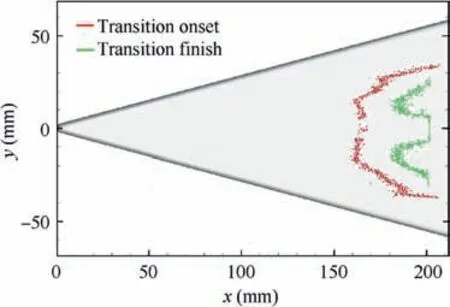
Fig. 10 Location of boundary layer transition obtained by TSP image.
The location of the boundary layer transition that was obtained using the Stanton number distribution is shown in Fig. 10, where the red and green lines denote the onset and completion of the transition. The transition location that was obtained using the TSP image was compared with the boundary layer structures that were obtained using the NPLS image.For z=0.5 mm, the fractured structure appeared from x=180 mm; at x=200 mm, the y-coordinates of the structures ranged from -20 to 20 mm, which was consistent with the location of the completion of the transition that was obtained using the TSP image. From the NPLS image at z=1 mm, we found that the boundary layer transition near the leading edge may have been caused by traveling crossflow waves. The front of the crossflow wave structures corresponded to the onset of the transition in Fig.10.In the NPLS image at z=2 mm, a black centerline region was observed before x=200 mm, which may have been caused by the vortex that was generated from the nosetip, corresponding to the high-heat strip in the TSP image.For x >180 mm,the boundary layer between the centerline and the leading edge had completely transitioned into turbulence,and the width of the black region near the centerline decreased in the downstream location, reflecting the interaction between the vortex and the turbulence boundary layer. This interaction fractured the vortex and drove the centerline boundary layer turbulence.
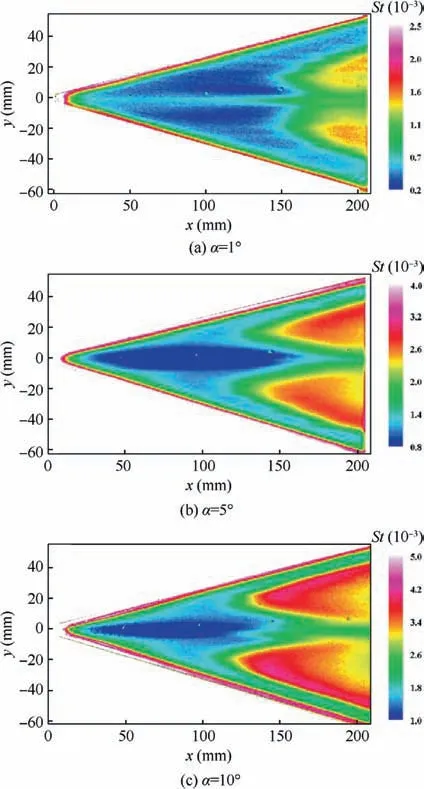
Fig. 11 Stanton number distribution at windward side at Re∞=1.78×10⁷ m-1.
7.2. Effect of angle of attack at windward side
Fig. 11 shows the Stanton number distribution at the windward side of the delta wing at different angles of attack (1°,5°, and 10°) and Re∞=1.78×10⁷m-1. The transition front at the 5°and 10°angles of attack were lung-shaped,unlike that at the 1°angle of attack.In addition,at the 1°angle of attack,there was a high-heat strip near the centerline, whereas there were low heat zones at the 5° and 10° angles of attack. These results illustrate that the flow structure and the centerline transition mechanism changed with the angle of attack.
As can be seen in Fig. 11, in the downstream zone of the delta wing, the transition front near the leading edge of the model is parallel to the leading edge.This phenomenon is similar to that observed for the swept wing boundary layer transition.Combined with the NPLS image of the upper section,the dominant mode near the leading edge was the crossflow instability. Moreover, the transition front was smooth because the wind tunnel was operating in noise mode, and the traveling crossflow waves dominated.
We analyzed the boundary layer transition of the windward side for the delta wing at the 5° and 10° angles of attack. As seen in Fig. 11, the most upstream position of the transition front moved forward as the angle of attack increased. The transition position of the centerline also moved forward,which may have been caused by the crossflow instability converging to the centerline, thereby inducing the boundary layer transition.
The Stanton number profile at the centerline is shown in Fig.12(a).Square blocks mark the onset of the boundary layer transition, and circles mark the completion. The transition locations at different coordinates are summarized in Table 1.For the 5° and 10° angles of attack, the onset occurred at x=110 mm and 86 mm, respectively. Thus, the onset of the boundary layer transition was advanced by approximately 22%.
The Stanton number profile along the freestream direction was extracted at the farthest upstream position of the transition front,as shown in Fig.12(b).The Stanton number profile exhibited the traditional trend for the boundary layer transition,that is,as the x-coordinate increased,the Stanton number slowly decreased and then rose sharply to a maximum, at which point the boundary layer became completely turbulent.The overall Stanton number increased with the angle of attack,indicating that the higher the angle of attack, the stronger the aerodynamic heat that the windward side of the flight vehicle was subjected to, which is an important reason for investigating the windward side in studying the boundary layer transition for hypersonic vehicles. The transition onset at the peakline for the 5° and 10° angles of attack occurred at 115 and 110 mm, respectively. The onset of the boundary layer transition advanced by 8.4%,which was small compared with the centerline position of 22%. Therefore, the onset of the transition at the farthest upstream position was not sensitive to the boundary layer transition of the centerline when the angle of attack changed.
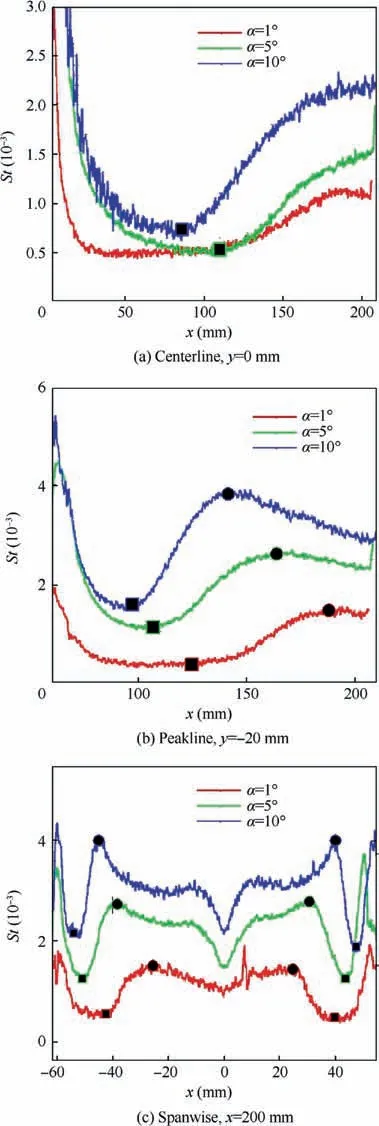
Fig. 12 Windward Stanton number profiles at Re∞=1.78×10⁷ m-1.
To analyze the influence of the angle of attack on the crossflow instability, the spanwise Stanton number profile was extracted at x=200 mm,as shown in Fig.12(c).It can be seen that for angles of attack of 5°and 10°,the y-distances between the onset of the transition and the leading edge of the delta wing were 9.94 and 6.58 mm,respectively.The transition onset distance was advanced by 33.8%over the 5-10°.These results were obtained because increasing the angle of attack increased the wall pressure on the windward side overall, thereby increasing the pressure gradient,enhancing the crossflow instability,and advancing the boundary layer transition.Moreover,the transition was completed at 22.58 and 15.03 mm,respectively.That is,the completion was advanced by 33.45%.Therefore,for the boundary layer transition dominated by the crossflow instability at the windward side of the delta wing,the angle of attack similarly affected the locations of the onset and completion of the transition.

Table 1 Summary of locations of boundary layer transition at Re∞=1.78×10⁷ m-1.
7.3. Effect of angle of attack at leeward side
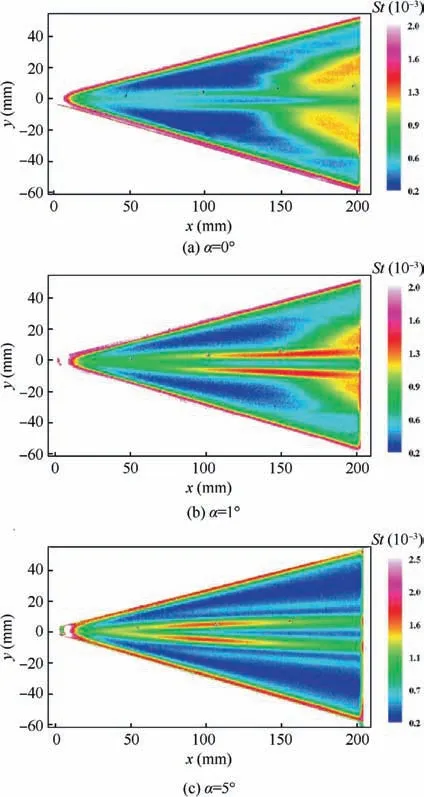
Fig. 13 Stanton number distribution at leeward side at Re∞=1.78×10⁷ m-1.
Fig.13 shows the Stanton number distribution for the leeward side of the delta wing at different angles of attack (0°, 1°, and 5°)and Re∞=1.78×10⁷m-1.The boundary layer transition occurred at the 0°and 1°angles of attack and did not occur for the 5° angle of attack. In addition, high-heat strips were observed near the centerline for all three angles of attack,which was consistent with a report by Rao and Hitehead32and was caused by the vortex structure at the leeward side.
By comparing the location of the boundary layer transition caused by the crossflow instability at the 0° and 1° angles of attack, it can be seen that the transition front moved farther away from the leading edge of the delta wing at the 1° angle of attack than at the 0° angle of attack. That is, increasing the angle of attack delayed the boundary layer transition caused by the crossflow instability at the leeward side, which was opposite to the dynamics at the windward side.The overall static pressure of the model surface may have decreased as the angle of attack increased, thereby decreasing the pressure gradient, reducing the crossflow instability, and delaying the boundary layer transition.
From the Stanton number profile at the centerline in Fig. 14, it can be seen that the boundary layer transition occurred for angles of attack of 0° and 1°. The onset of the transition occurred at 139 mm and 153 mm, respectively. The transition at the centerline was slightly advanced at the 0°angle of attack because of the different factors leading to the transition at the 0° and 1° angles of attack. From Fig. 13, it can be seen that at the 0° angle of attack, the boundary layer transition front near the centerline was blurred, and the direction inclined from both sides to the centerline, indicating that the boundary layer transition at the centerline was mainly induced by the transitional or turbulent boundary layer on both sides. However, at the 1° angle of attack, the boundary layer between the two heat strips was similar to a quasi-twodimensional process, so that the transition locations of the 0°and 1° angles of attack were not comparable. Comparing the angles of attack of 1° and 5° showed that the boundary layer transition at the centerline at the leeward side was affected by the angle of attack.At the 5°angle of attack,the centerline Stanton number first rose to a peak and then fell. The peak value was caused by the vortex from the nosetip, and the monotonic decrease in the Stanton number indicates that the boundary layer transition did not occur at the 5° angle of attack. In summary, we found that increasing the angle of attack caused the centerline of the boundary layer transition at the leeward side to recede.
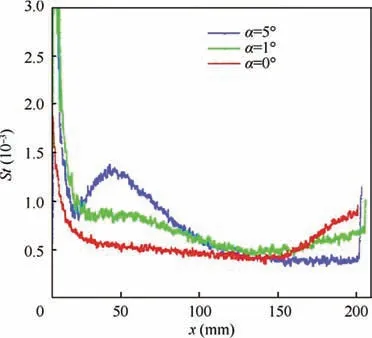
Fig. 14 Centerline Stanton number profiles at leeward side at Re∞=1.78×10⁷ m-1.
7.4. Effect of freestream Reynolds number at 0° angle of attack
Fig. 15 shows the Stanton number distribution of the delta wing at a 0° angle of attack and different Reynolds numbers.It can be seen that there was a high-heat strip near the centerline for all of the different Reynolds numbers that may have been caused by the head-induced streamwise vortex. At the four lowest Reynolds numbers, there was only one heat strip.At Re∞=1.78×10⁷m-1, a low-heat region was observed along the flow direction, upstream of the centerline, between two high-heat strips.Then,the Stanton number increased,possibly due to a boundary layer transition. The boundary layer transition was observed at the two highest Reynolds numbers(Fig. 15(d) and (e)).
As shown in Fig.16(a),we extracted the Stanton number at the centerline to determine the boundary layer transition. The Stanton number at the four smallest Reynolds numbers did not exhibit the typical change in the Stanton number at the boundary layer transition. Instead, the Stanton number changed very little or rose slowly along the x-coordinate, which may have been caused by the streamwise vortex.At a Reynolds number of 1.78×10⁷m-1, a change in the Stanton number was observed, indicating that the boundary layer transition occurred at the centerline but that the flow did not become completely turbulent. The onset occurred at approximately x=155 mm. Moreover, the transition front near the centerline merged with the transition regions on both sides. Thus,the boundary layer transition may have been induced by the transition on both sides.
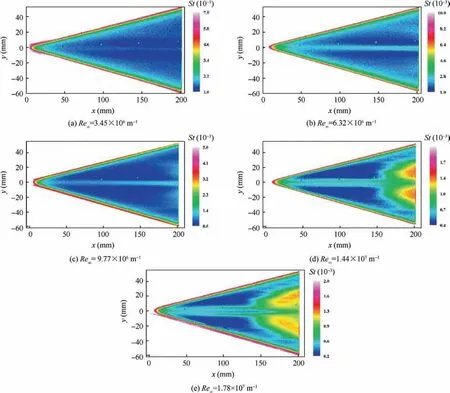
Fig. 15 Stanton number distribution at windward side for α=0°.
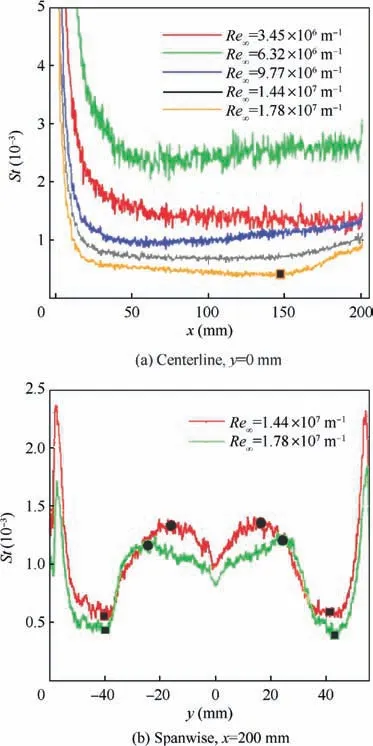
Fig. 16 Stanton number profile at different locations.
Fig. 16(b) shows the spanwise Stanton number profile at x=200 mm.The red and green lines correspond to Reynolds numbers of 1.44×10⁷m-1and 1.78×10⁷m-1, respectively.The onset and completion of the boundary layer transition are marked by filled black squares and filled black circles,respectively. The onset of the transition from the leading edge occurred at 14.50 and 14.74 mm for the two Reynolds numbers, respectively. Thus, there was very little difference in the onset location between the two cases.However,the completion occurred at y=31.25 and 39.22 mm, respectively, indicating that the completion was advanced by 20.3% as the Reynolds number increased from 1.44×10⁷m-1to 1.78×10⁷m-1.Increasing the Reynolds number had little effect on the transition onset but had a significant effect on the location of the completion, where the boundary layer broke down, and the flow became fully turbulent.
We extracted the onset of the boundary layer transition at the two Reynolds numbers of 1.44×10⁷m-1and 1.78×10⁷m-1, as shown in Fig. 17. For these two Reynolds numbers,similar locations were observed for the boundary layer transition that was caused by the crossflow instability; however,there was a large difference in the most upward position of the transition front. The transition onset occurred at approximately x=150 mm at a Reynolds number of 1.44×10⁷m-1and 130 mm at a Reynolds number of 1.78×10⁷m-1,i.e.,the front was advanced by approximately 13.3%by the increase in the Reynolds number. Thus, the most upward position of the boundary layer transition front, which was influenced by the nosetip,was more sensitive to the Reynolds number than when the transition was induced by the crossflow instability.
7.5. Effect of freestream Reynolds number at windward side at 5° angle of attack
Fig. 18 shows the Stanton number distribution at the windward side of the delta wing for a 5°angle of attack and different Reynolds numbers. From Fig. 18, we can see that the transition front has similar shapes but different locations at different Reynolds numbers. Therefore, it can be inferred that the dominant factors of the boundary layer transition at different locations are similarly sensitive to the Reynolds number.There was a low-heat region near the centerline, which may have been due to the crossflow effect that caused the lowdensity fluid in the boundary layer to flow from the sides to the center and thickened the boundary layer. This region was elliptical in shape, with a minor axis of approximately 9 mm that was not affected by the Reynolds number. However, the length of the major axis was significantly affected by the Reynolds number.
Except for a Reynolds number of 4.02×10⁶m-1, the boundary layer transition was observed under all other Reynolds numbers. The transition fronts resembled lung lobes.The onset moved upstream as the Reynolds number was increased.In addition,the boundary transition near the centerline exhibited a backward trend with respect to the transition that was induced by the crossflow. The angle of inclination for the transition front near the centerline ranged approximately from 9° to 13°, which was similar to the direction of propagation of the crossflow waves, as obtained from the NPLS image in Fig. 9. Therefore, the boundary layer transition near the centerline was induced by the crossflowdominated transition on both sides.
The onset of the boundary layer transition that was extracted from Fig. 18 is shown in Fig. 19. The most upward position of the transition front, the transition position at the centerline and the transition distance from the leading edge along the y-coordinate are shown in Table 2. Comparing the transition position at Reynolds numbers of 1.30×10⁷m-1and 1.76×10⁷m-1yields xtr-peaklinevalues of 125 and 110 mm, respectively, that is, the transition was advanced by 12%. For the centerline transition, the xtr-centerlinevalues were approximately 175 and 200 mm, respectively, and the transition advanced by 12.5%. Therefore, it can be quantitatively concluded that the sensitivity of the boundary layer transition at the most upward position and the centerline was similar.Thus, the centerline transition was induced by the sides, and the crossflow wave angles were almost similar at different Reynolds numbers. We analyzed the distance of the transition from the leading edge of the delta wing to obtain the characteristics of the transition that was induced by the crossflow instability. For Reynolds numbers from 1.30×10⁷to 1.76×10⁷m-1,the transition position was advanced by 50%,which indicates that the crossflow instability at the windward side of the delta wing was significantly affected by the Reynolds number.
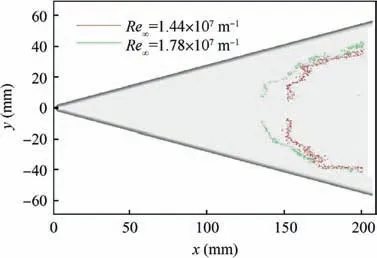
Fig. 17 Onset of boundary layer transition at α=0°.
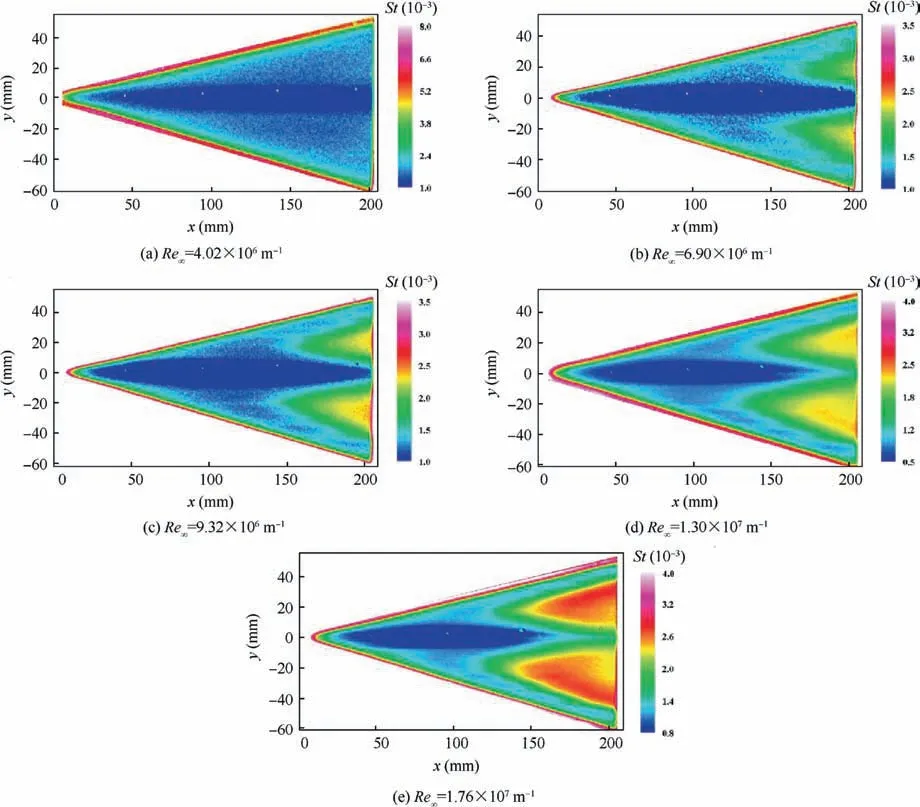
Fig. 18 Stanton number distribution at windward side at α=5°.
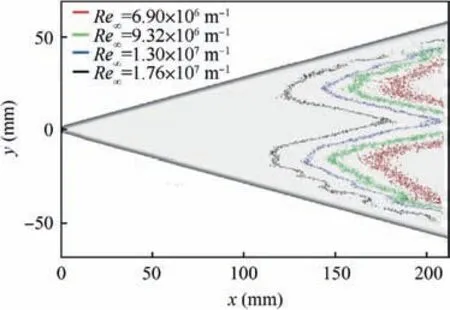
Fig. 19 Boundary layer transition onset at windward side at α=5°.

Table 2 Summary of onset of boundary layer transition at windward side at α=5°.
7.6.Effect of freestream Reynolds number at leeward side and 1°angle of attack
Fig. 20 shows the Stanton number distribution at the leeward side at a 1° angle of attack and different Reynolds numbers.When the unit Reynolds number was 9.49×10⁶m-1, an increase in the Stanton number distribution was observed from x=170 mm, which was presumed to be the onset of the boundary layer transition. At Re=1.23×10⁷m-1,1.49×107m-1, and 1.80×10⁷m-1, a significant increase in the Stanton number was observed, which was a clear indication of the boundary layer transition. The transition front had a triangular shape that was approximately the same for all of the Reynolds numbers.
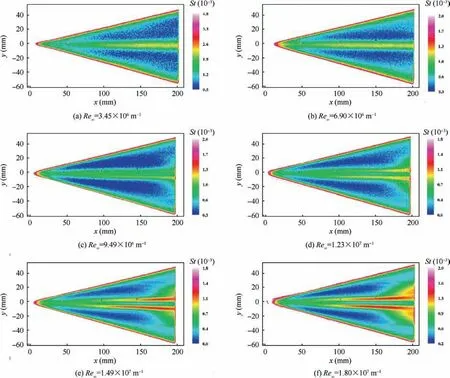
Fig. 20 Stanton number distribution at leeward side at α=1°.
As shown in Fig. 20, high-heat strips were observed near the centerline of the delta wing and may have been caused by the streamwise vortex at the leeward side of the delta wing.As the Reynolds number increased, the number of heat strips changed from one to two, and the distance between the strips increased,indicating that the intensity of the streamwise vortex increased with the Reynolds number. At the unit Reynolds numbers of 9.49×10⁶m-1, 1.23×10⁷m-1and 1.49×10⁷m-1, the boundary layers on both sides began to transition;however, the edges of the high-heat strips remained relatively sharp. At a Reynolds number of 1.80×10⁷m-1, the edge of the downstream heat strips began to be blur, possibly because of the interaction between the turbulent boundary layer and the streamwise vortex, causing the vortex to break.
Fig. 21 shows the onset of the boundary layer transition at the leeward side of the delta wing at three high Reynolds numbers. As the Reynolds number increased, the transition front was advanced,and the shapes of the transition front were similar. The sensitivities of the crossflow dominant transition and the transition affected by the nosetip to the Reynolds number were approximately the same.
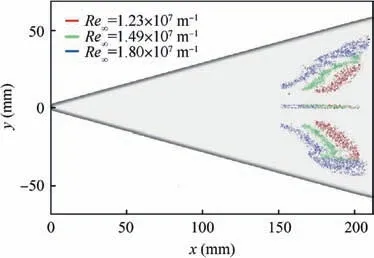
Fig. 21 Onset of boundary layer transition at leeward side at α=1°.
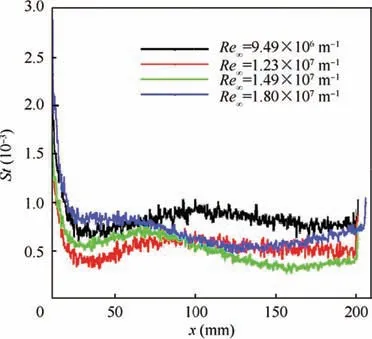
Fig. 22 Centerline Stanton number profiles at leeward side at α=1°.
For the boundary layer at the centerline,it can be seen from Fig.20 that the behavior of the centerline boundary layer at a Reynolds number of 3.45×10⁶m-1was dominated by the streamwise vortex, rather than the boundary layer transition.For higher Reynolds numbers, the region between the two high-heat strips could be considered as a quasi-twodimensional boundary layer flow. Therefore, we selected the centerline Stanton number profile at the four highest Reynolds numbers to analyze the centerline transition, as shown in Fig. 22. At Reynolds numbers of 9.49×10⁶m-1and 1.23×10⁷m-1, there was a peak along the streamwise direction. Examining the TSP image led us to conclude that this peak was caused by the streamwise vortex. The Stanton number decreased after the first peak,indicating that the boundary layer was laminar at the two Reynolds numbers. At the Reynolds numbers of 1.49×10⁷m-1and 1.80×10⁷m-1, the Stanton number decreased after an initial peak and then rose again, which was attributed to the boundary layer transition.The transition onset occurred at 163 mm and 129 mm for Reynolds numbers of 9.49×10⁶m-1and 1.23×10⁷m-1, respectively, showing that the transition front was advanced by 20.8%.
8. Conclusions
(1) The boundary layer transition between the leading edge and the centerline was dominated by the crossflow instability.The Stanton number began to rise where the traveling crossflow waves began to appear. The Stanton number reached its peak where the traveling crossflow waves broke up and the boundary layer became completely turbulent.
(2) As the angle of attack increased, the boundary layer transition at the windward side moved upstream. When the angle of attack increased from 5° to 10°, the windward boundary layer transition that was dominated by the crossflow instability advanced by approximately 33% in the y-direction: the increase in the angle of attack may have caused this advance by increasing the spanwise pressure gradient, thereby making the crossflow instability dominant. In addition, the centerline transition on the windward side was induced by the boundary layer on both sides.
(3) There were mainly two types of flow behavior at the leeward side:streamwise vortex and boundary layer transition. The boundary layer transition front was approximately triangular. As the angle of attack increased,the transition position receded.The boundary layer that developed in a region sandwiched by two vortices was nearly two-dimensional, and the transition location receded as the angle of attack increased.
(4) For a 0° angle of attack, increasing the Reynolds number had little effect on the spanwise position of the crossflow-dominated boundary layer transition; however, the farthest upstream position of the transition front was significantly affected by the Reynolds number.The transition behavior of the centerline was mainly induced by the boundary layer transition on both sides.
(5) At the windward side and a 5°angle of attack,the front of the boundary layer transition resembled a lung lobe.The centerline boundary layer transition and the farthest upstream position of the transition exhibited similar sensitivities to the Reynolds number,whereas the crossflow instability was more sensitive to the Reynolds number.
(6) At the leeward side at a 1°angle of attack,the boundary layer transition moved forward as the unit Reynolds number increased. The transition fronts at different Reynolds numbers were similarly shaped. Therefore,the sensitivity of the transition dominated by crossflow instability and the most upstream position of the transition front were similar for different Reynolds numbers.
Acknowledgments
This work was supported by the National Key Technology Research and Development Program of China (No.2016YFA0401200), the National Project for Research and Development of Major Scientific Instruments of China (No.11527802), and the National Natural Science Foundation of China (Nos. 91752102 and 11832018).
 CHINESE JOURNAL OF AERONAUTICS2020年7期
- CHINESE JOURNAL OF AERONAUTICS的其它文章
- An experimental method for squealer tip flow field considering relative casing motion
- A novel none once per revolution blade tip timing based blade vibration parameters identification method
- Highly efficient computation method for hazard quantification of uncontained rotor failure
- Optimal motion cueing algorithm for accelerating phase of manned spacecraft in human centrifuge
- Effective control allocation using hierarchical multi-objective optimization for multi-phase flight
- Fault-tolerant control and vibration suppression of flexible spacecraft: An interconnected system approach
