Numerical study of a supercritical airfoil/wing with variable-camber technology
Wei NIU, Yufei ZHANG, Hixin CHEN,*, Mio ZHANG
a School of Aerospace Engineering, Tsinghua University, Beijing 100084, China
b Shanghai Aircraft Design and Research Institute, Shanghai 201210, China
KEYWORDS Aerodynamic optimization;CST method;Drag decomposition;Supercritical airfoil/wing;Variable-camber technology
Abstract Variable-camber technology is considered an effective way to adaptively improve the aerodynamic performance of aircraft under various flight conditions. This paper studies the aerodynamic characteristics of the trailing-edge variable-camber technology by means of Computational Fluid Dynamics (CFD) and a drag decomposition method. Trailing-edge variable-camber technology can be simply realized by the continuous deflection of the flaps and ailerons of a wing.A supercritical airfoil is used to study the two-dimensional effect of variable-camber technology,and a wide-body airplane model is used to validate the three-dimensional improvement in the wing’s airfoil made by variable-camber technology. An optimization strategy for airfoil that incorporates variable-camber technology is proposed. The optimization results demonstrate that the proposed method can obtain better results than the traditional segregated shape optimization.
1. Introduction
The aviation market has grown rapidly in recent years. The considerable economic benefits of the aviation market lead to strong competition among airplane manufacturers and airline companies. Aircraft manufacturers must continually improve the performance of airplanes to maintain their competitiveness.1
The aerodynamic performance of an aircraft mainly relies on the wing.2Supercritical wings have been studied and used for nearly fifty years, and their technology is quite mature. It is hard to improve the performance of a traditional supercritical wing without new technology. For safety and airworthiness reasons, the civil airplanes of the near future will still use the tube-and-wing layout. Thus, technologies that can be used under traditional layouts are required to improve the aerodynamic performance of current aircraft. The variablecamber wing is such a type of technology.3
The traditional supercritical wing has a fixed shape in highspeed flight phases. In a typical flight profile, the flight condition changes drastically. The speed, altitude, and atmospheric pressure are different in the climb and cruise phases. Even in the cruise phase, aircraft weight changes considerably as fuel is consumed.4The wing design methods develope rapidly these years.5,6However, the traditional wing cannot ensure optimal performance in every flight condition with one fixed wing shape. Consequently, the design process of a traditional wing must take multiple flight conditions into consideration7and pursue a compromise design between different requirements.Variable-camber technology has the ability to change the camber of the wing in high-speed flight phases, which means that the wing could have different aerodynamic shapes to ensure good performance under different flight conditions.8
Many research investigations have been undertaken to study the mechanisms and applications of variable-camber technology.9Boeing and Airbus developed variable-camber devices for their newest aircraft, the Boeing 78710and the A350,11respectively. Their technologies enable the wing to change its camber by deflecting its high-lift devices,i.e.,its flaps and spoilers, in high-speed flight phases. The Boeing 787 Dreamliner,which first flew in 2009, used extra actuating mechanisms to change the trailing-edge camber device with little weight cost.10The Airbus A350 XWB-900 airplane uses leading- and trailing-edge actuating mechanisms to change the camber of the wing.11Yokozeki et al.12utilized flexible material to manufacture a variable-camber airfoil. A wind tunnel test was conducted to analyze the aerodynamic characteristics of the airfoil. Hetrick et al.13used a variable-camber device to create a strongly favorable pressure gradient to expand the laminar region and reduce drag. Rodriguez et al.4optimized the twist angle and the trailing-edge camber of a wing separately and synchronously. The results show that joint optimization is better than separate optimization. Lyu and Martins14used a trailingedge variable-camber wing to reduce flow separation on the upper wing surface, expand the buffet onset boundary and increase the performance of an aircraft with high lift coefficient.Liu et al.15optimized a variable-camber strategy under multitask profiles and found that comprehensive aerodynamic performance was improved with variable-camber technology.Molinari et al.16,Vos et al.17,18and Sun et al.19also performed application research on variable-camber technology.Lu et al.optimized the aerodynamic geometry and the structure the of varisblecamber wing.20The above studies mainly focused on the effectiveness and applications of variable-camber technology. To gain a deeper understanding of this technology, more research is needed on the drag reduction mechanism and the design strategy.
This paper focuses on the drag reduction mechanism and design strategy of variable-camber technology. A supercritical airfoil with a trailing-edge variable-camber device was chosen for the study. Computational Fluid Dynamics (CFD) and a drag decomposition method are used to study the aerodynamic characteristics of the variable-camber airfoil. A threedimensional study is conducted to verify the conclusions from two-dimensional research. The variable-camber technology is then applied to aerodynamic optimization to study the optimization strategy of the variable-camber wing.
2. Numerical method
2.1. CFD method
In this paper, the flow field is calculated by the in-house code NSAWET.21,22NSAWET is a finite-volume structured code based on Reynolds-Averaged Navier-Stokes (RANS) equations and Large Eddy Simulation (LES).23In this paper, we use the Monotonic Upwind Scheme for Conservation Laws(MUSCL) scheme for reconstruction, Roe’s scheme for space discretization, and the Lower-Upper Symmetric Gauss-Seidel(LU-SGS)method for time advancing.24The k-ω Shear Stress Transport (SST) model is used for turbulence closure.
There is a large amount of experimental data concerning the NACA0012 airfoil.25In this paper, this airfoil is used as a validation case of the present CFD code.The flow condition of the validation case is Mach number Ma=0.7, lift coefficient CL=0.5, and Reynolds number Re=9×10⁶. The topology of the calculation grid is shown in Fig.1(a).Five sets of grids with different cell numbers (3.5×10⁴, 6.5×104,12.9×104, 25.0×10⁴and 49.5×10⁴) are adopted to validate the accuracy of NSAWET and the convergence of grids.Fig.1(b) shows the pressure coefficient Cpdistributions from the numerical simulations and the experiment. The results of the five grid sets are in good agreement with the experimental data.Table 1 shows the drag coefficient CDof the different grid sets.The drag coefficient monotonically decreases as the number of nodes increases. The difference in the drag coefficient for the 25.0×10⁴and 49.5×10⁴grid cells is less than 0.00002,which means that the grid convergence is well achieved.
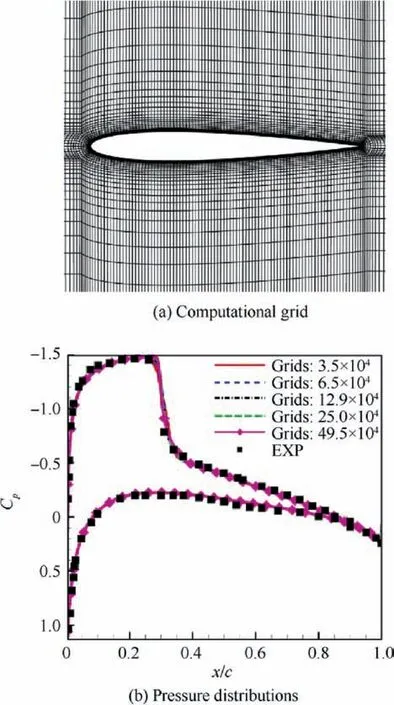
Fig. 1 Computational grid and pressure distributions.

Table 1 Drag coefficients for different grids.
2.2. Drag decomposition method
The aerodynamic drag of an airplane consists of the friction drag, the form drag, the wave drag and the induced drag.The traditional CFD method obtains the friction drag and the pressure drag through integration of the wall shear and integration of the pressure on the aircraft surface,respectively.The form drag,wave drag and induced drag are all included in the pressure drag,which means that it is hard to distinguish the variation in different drag components. There are different drag reduction methods for the different drag components.Consequently, an algorithm that can quantitatively calculate drag components is useful in the aerodynamic design of civil airplanes.
The far-field drag decomposition method26,27is employed to analyze the change in drag components. This method is based on the conservation of momentum and energy28. The following section briefly introduces the drag decomposition method. Let Sfarbe a far field surface that contains the flow field and the solid wall Snear. If there is no momentum source or sink in the flow field, the drag force acting on the far-field surface can be written as

where p refers to local pressure; p∞is the freestream pressure;nxrefers to the orientation vector of the x-axis, which is also the direction of the oncoming air; τ is the viscous force; n is the unit normal vector pointing outside Sfar; ρ is the density of air; V is the velocity of air; u is the component of velocity in the x-direction.
There are several ways to simplify Eq.(1).First,the viscous stress τ decreases quickly in the downstream flow field.Second,the value of∫∫(ρ-ρ∞)nxdS is very close to zero for twodimensional flow if the surface Sfaris sufficiently far. For three-dimensional flow, the integral of the ‘‘p” part of the expression represents the drag caused by the vortex, i.e., the induced drag. Third, the velocity u can be rewritten as a function of entropy and enthalpy.In this paper,we study an airfoil and wing without a powerplant.Thus the integral of the velocity item equals the entropy drag, which includes the viscous drag and the wave drag.
Entropy drag consists of viscous drag and wave drag. The equation of entropy drag is shown in :

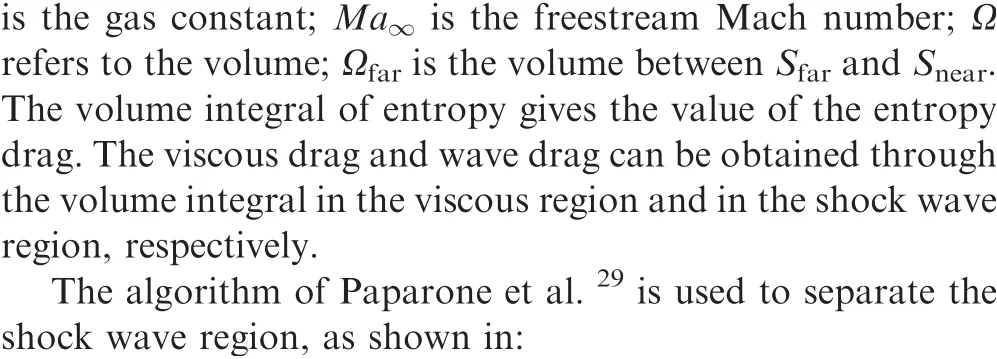

The variable a is the local sound speed.
The method of Lanzetta et al.30is chosen to separate the viscous region. It uses the dissipation of turbulent kinetic energy as the screening variable, as shown in :

The variable ρε is the dissipation of turbulent kinetic energy.
The region where fwave>0.99 is considered to be the shock wave region,and fviscous>-12 is dealt with in viscous region,as shown in Fig. 2.
For three-dimensional flow, the induced drag comes from the surface integration of the pressure part of Eq. (1). A simplified equation for the induced drag calculation is shown in:

where v and w refer to the component of velocity in the ydirection and z-direction, respectively. It assumes that the kinetic energy of the wingtip vortex comes from the induced drag. Sdownrefers to the surface that is behind the aircraft and perpendicular to the incoming flow.Due to the dissipation of the wingtip vortex, Sdownshould be close to the aircraft.
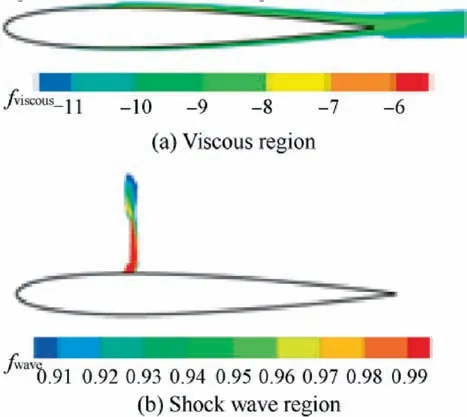
Fig. 2 Different drag regions at Re=9×10⁶, Ma=0.7,CL=0.5.
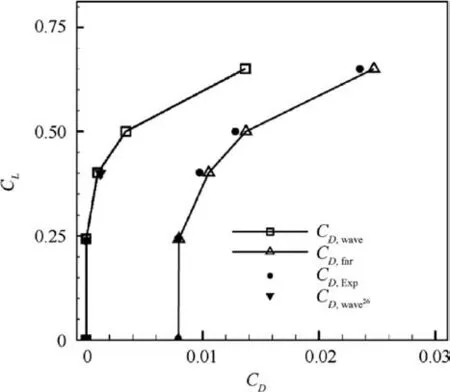
Fig. 3 Lift-to-drag polar curves of NACA0012 airfoil.
In this paper, the NACA0012 airfoil is chosen to validate the far-field drag decomposition method. Some data from the research of Paparone et al.29are used for comparison.The flow conditions for NACA0012 are the freestream Mach number Ma∞=0.7, the Reynolds number Re=9×10⁶and the lift coefficient CLfrom 0.00 to 0.65.
Fig. 3 shows the lift-to-drag polar curves of the NACA0012; CD,waveand CD,farrefer to the wave drag and the total drag respectively. The results show that the drag decomposition method has good agreement with the reference value29and the experimental data.
3. Aerodynamic research for variable-camber technology
Airfoil is a basic element of a wing. To study the drag reduction mechanism of variable-camber technology, a twodimensional airfoil flow is first studied in this section to simplify the interference from the different flow structures of a real wing.Then a wide-body airplane model is used to test the drag reduction effect of the variable-camber technology in threedimensional flow.
3.1. Parameterization method
Flaps are commonly used on commercial airplanes to increase lift in taking-off and landing. Boeing787 and A350 airplanes utilize the flaps to adjust the wing camber during the cruise phases10,11to improve the flight performance, as shown in Fig.4.In this paper,the trailing-edge variable-camber technology adopts the same strategy to minimize the modification of the wing configuration and make the technique easier to put into commercial operation.
In the variable-camber device of a Boeing 787,extra servomotors are added to the high lift devices to perform both upward and downward deflection. In this paper, the trailingedge variable-camber wing adjusts the trailing-edge camber by deflecting the flaps or ailerons,as shown in Fig.5(a).When the flaps are deflected, the spoilers are rotated synchronously to attach themselves to the flaps to ensure the chordwise continuity of the upper surface. The mechanisms that are similar to spoilers are applied to the lower surface to keep the continuity of these regions, as shown in Fig. 5(b). The deflection of ailerons creates no gap, as shown in Fig. 5(c). In the present study, the trailing-edge deflection angle is limited within[-1°, 1°], where the clockwise deflection is defined as positive.
In the present study, the supercritical airfoil is parameterized by the Class-Shape Transformation (CST) method.31The CST method is composed of a shape function S(x/c)and a class function(x /c), as shown in

where x and Y(x/c) refer to the X and Y values of the profile curve. The constant c is the chord length of the airfoil. The class functionx/c ), as shown in Eq. (7), determines the geometric category. For an airfoil with a blunt leading edge and a sharp trailing edge, N1, and N2are set to 0.5 and 1.0,respectively. The shape function S(x /c) is a combination of multiple Bernstein polynomials Bi(x /c), as shown in Eq. (8).The weight variables of the Bernstein polynomials biare the design variables.31n in Eq. (8) is the order of the shape function. Sixth-order Bernstein polynomials with 14 design variables are able to describe the airfoil geometry. In Fig. 6(a),the curve generated by the sixth-order CST method is in good agreement with the data points of the RAE2822 airfoil:

The geometry of a supercritical wing is controlled by seven airfoil profiles, as shown in Fig. 6(b). The third-order spline interpolation method is used to generate the wing surface based on the control profiles.
3.2. Effect of variable-camber technology on a supercritical airfoil
A supercritical airfoil named Airfoil_1 is used to study the effect of variable-camber technology. The geometry of Airfoil_1 is shown in Fig. 7. Some information about Airfoil_1 is presented in Table 2. The trailing-edge variable-camber region starts from x/c=0.7 on the airfoil.
Fig. 8 shows the pressure distributions of Airfoil_1 under different flight conditions. When the Mach number is higher than the critical Mach number, the pressure distributions of the airfoil have two patterns: a pressure plateau and a weak shock wave. This demonstrates that the airfoil is a typical supercritical airfoil.
The drag decomposition method is used to calculate the drag components of Airfoil_1 under different lift coefficients,as shown in Table 3.As CLincreases,the wave drag and form drag increase quickly, while the friction drag changes slightly.The increase in wave drag is consistent with the enhancement of shock wave strength, as shown in Fig. 8(b). The increment of form drag is not negligible.
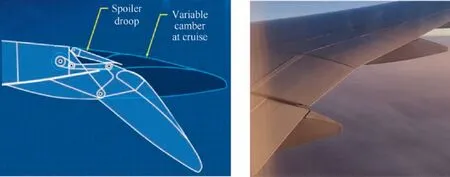
Fig. 4 Variable-camber wing of a Boeing 78710.
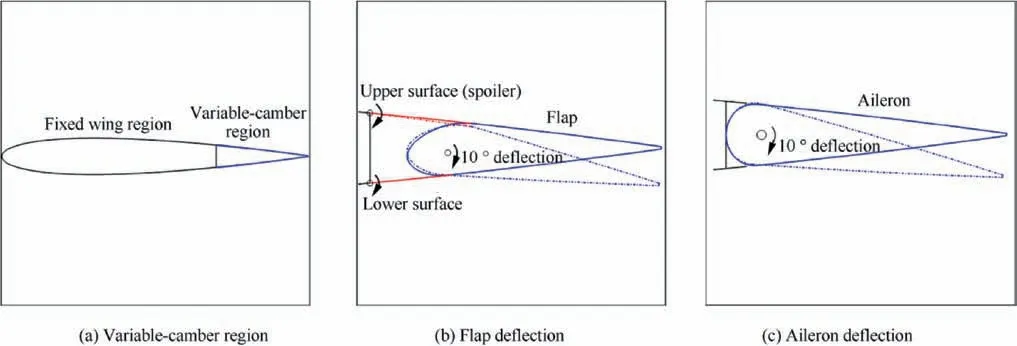
Fig. 5 Deflection mechanism of variable-camber wing.
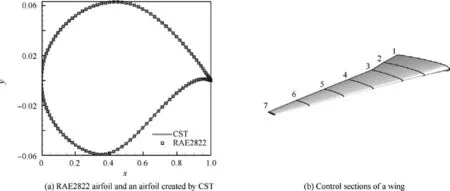
Fig. 6 Validation of CST method and geometry of supercritical wing.
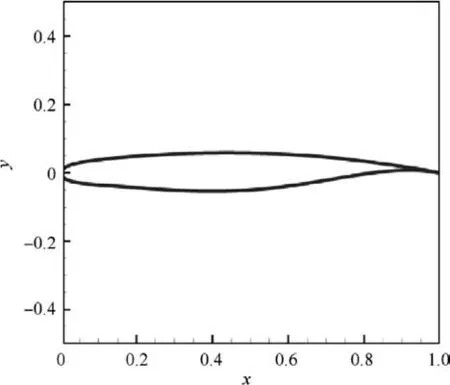
Fig. 7 Geometry of Airfoil_1.
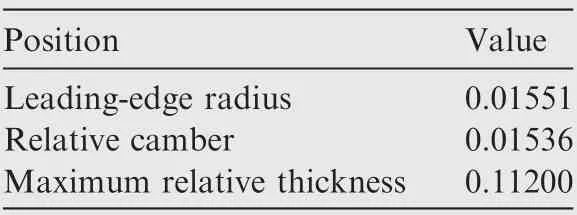
Table 2 Geometric information of Airfoil_1.
Due to the change in weight of a long-range commercial airplane and the change in wind speed, the Mach number and lift coefficient of the cruise phase vary within a certain interval.The variable-camber technology is studied with different Mach numbers and different lift coefficients. The flight Reynolds number considered in this section is Re=9×10⁶.The deflection angle varies within [-1.0°, 1.0°] with a step of 0.1°. The computation results are shown in Fig. 9. The dashdot line is the original L/D curve of Airfoil_1.Each dashed line is the L/D curve of Airfoil_1 with a specific trailing-edge deflection angle. The solid line is the envelope curve, referring to the highest lift-drag ratio achieved by different trailing-edge deflection angles in different flight conditions,which is also the best performance that can be obtained through variablecamber technology.
The lift coefficient in flight is not constant because of the consumption of fuel, the change of altitude or other reasons.The variation of the lift coefficient may cause airplanes to deviate from the optimal flight condition and may cause performance loss of aircraft. The lift-drag ratio in Fig. 9(a) varies with the lift coefficient at Mach number 0.74.The baseline airfoil has maximal L/D with CL=0.72. As the lift coefficient increases, Airfoil_1 has to positively deflect the trailing edge to improve the L/D. Each flap deflection angle achieves maximal L/D within a specific CLinterval, which means that the variable-camber technology is effective in compensating for the performance loss caused by the variation in the lift coefficient.
The cruising altitude, the change in wind speed and other phenomena may cause the speed of the airplanes to be higher or lower than the designed cruise speed.The curves in Fig.9(b)show the L/D of the original Airfoil_1 and of the variablecamber airfoils at CL=0.81 with different Mach numbers.In contrast with the scenarios in Fig. 9(a), Airfoil_1 with a 1.0° deflection angle always has the largest lift-drag ratio within the Mach number range [0.70, 0.76]. Fig. 9(c) shows the L/D curves of original Airfoil_1 and of the variablecamber airfoils at a lower lift coefficient of 0.72.The envelope curve of the best L/D consists of two different flap deflection angles (0.2° and 1.0°). Compared to the results in Fig. 9(a),the deflection of the trailing edge has less impact on the aerodynamic performance when the Mach number changes. In summary, the trailing-edge variable-camber technology is more effective when CLdeviates from the optimal flight condition.
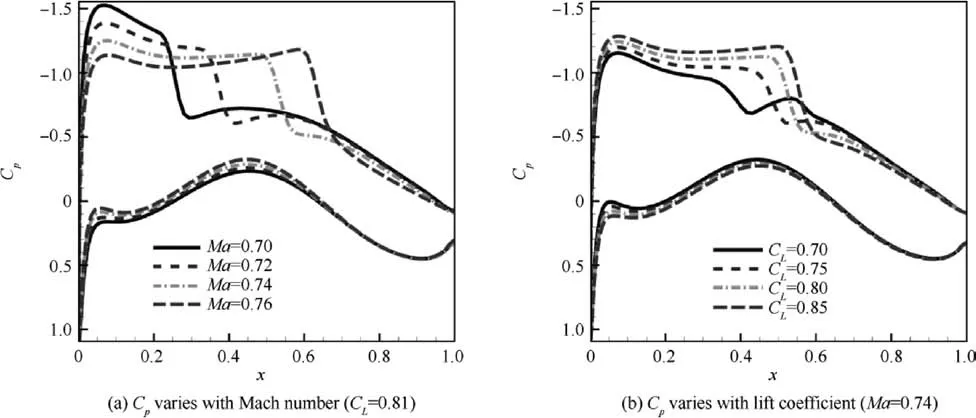
Fig. 8 Pressure distributions of Airfoil_1.

Table 3 Drag decomposition of Airfoil_1.

Fig. 9 Lift-drag ratio of airfoil with different flap deflection angles.
The effect of a variable camber is further studied under different lift coefficients.Airfoil_1 is analyzed under four lift coefficients(CL=0.70,CL=0.75,CL=0.80,and CL=0.85),as shown in Fig. 10. The abscissa is the deflection angle of the flap. The variable-camber airfoils change the AOAs to keep CLthe same as in the original Airfoil_1.Airfoil_1 has different optimal deflection angles under different flight conditions.The higher the lift coefficient is, the larger the optimal deflection angle is. The pressure distributions of the original Airfoil_1 and of the best variable-camber airfoils with different flap deflection angles are shown in Fig. 11. The solid curves are Cpof the original airfoil, while the dashed curves refer to Cpof the variable-camber airfoil. The different flap deflection angles of the optimal airfoils and the drag components calculated by the drag decomposition method are listed in Table 4.
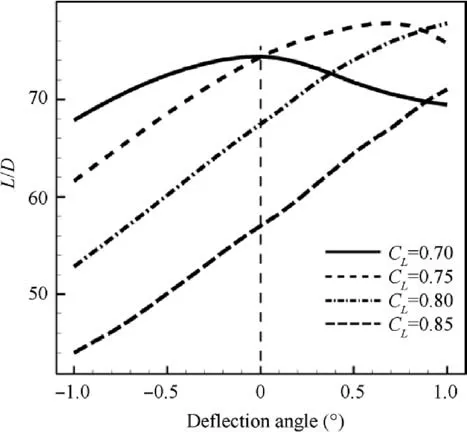
Fig. 10 L/D of Airfoil_1 with variable-camber method for different values of CL.
Under the condition CL=0.70, the original Airfoil_1 is optimal among all the variable-camber geometries. The pressure distribution in Fig. 11(a) shows that Airfoil_1 has a very weak shock wave. The drag decomposition results in Table 4 show that Airfoil_1 only has a wave drag coefficient of only 0.00006 in this flight condition.
Under the condition CL=0.75,the original Airfoil_1 has a weak shock wave, and the variable-camber technology completely eliminates the shock wave,as shown in Fig.11(b).Drag decomposition results show that the optimal variable-camber airfoil has a 0.00039 drag reduction in the wave coefficient and a 0.0001 reduction in the form drag.
Under the conditions CL=0.80 and CL=0.85, the original Airfoil_1 has a strong shock wave, and the trailing-edge variable-camber method weakens the shock wave. In the former condition, the reductions in the wave drag coefficient and the form drag coefficient are 0.0012 and 0.00046, respectively. In the latter condition, Airfoil_1 has reductions of 0.00235 and 0.0009 in the wave drag coefficient and the form drag coefficient, respectively.
An interesting phenomenon in Table 4 is that the form drag is reduced synchronously with the reduction in wave drag.The form drag reduction may be induced by the change in the boundary layer. A strong shock wave on the airfoil thickens the boundary layer and increases the form drag. When the shock wave is weakened by the variable-camber method, the displacement thickness of the boundary layer after the shock wave is thinned. Consequently, the form drag is also reduced.The viscous sensor fwaveprovides a way to analyze the change in form drag, as shown in Fig. 12. The viscous drag source is caused by the airfoil boundary layer.The CL=0.85 condition shown in Table 4 is chosen as an example. The viscous region of the original Airfoil_1 is obviously thickened after x/c=0.6,which is the location of the shock wave. However, the viscous region of Airfoil_1 with a 1.0° trailing-edge deflection is much thinner.
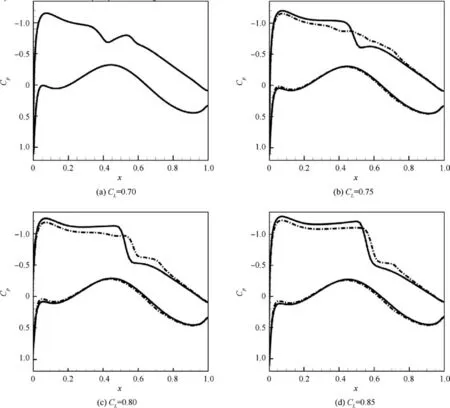
Fig. 11 Pressure distributions of variable-camber airfoil under different CL.
From the change in drag components, it is clear that the trailing-edge variable-camber technology improves the airfoilperformance mainly by reducing the wave drag. Thus, the variable-camber technology might be effective in flight conditions with strong shock waves.
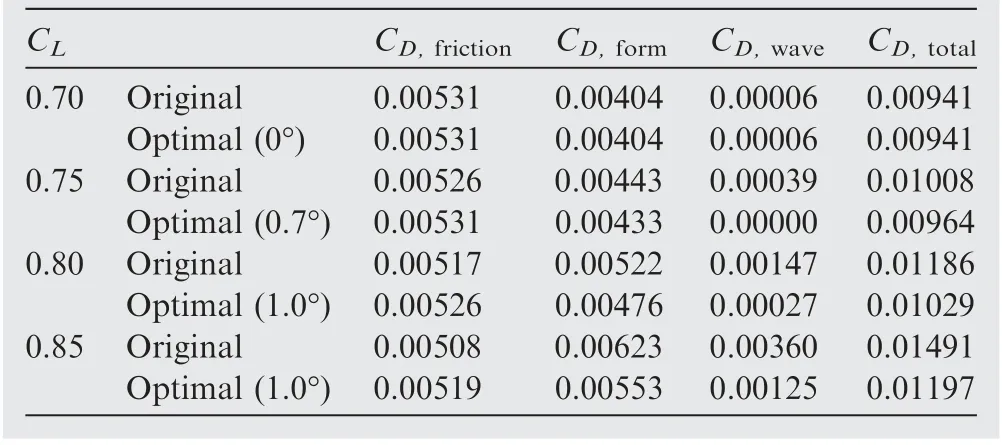
Table 4 Drag decomposition of original Airfoil_1 and optimal variable-camber geometry.
Fig.13 shows the variation of the drag components relative to the trailing-edge deflection angle under four different lift coefficients at Ma=0.74,Re=9×10⁶.The variation in friction drag coefficient CD,frictionis insignificant when compared to other components, as shown in Fig. (a). In Fig. 13(b), the form drag coefficient CD,formchanges considerably; however the variation is less than that of the wave drag coefficient CD,wave, as shown in Fig. 13(c). The results further confirm that the trailing-edge variable-camber technology improves performance by weakening the shock wave when only the two-dimensional effects are considered.
3.3. Variable-camber technology applied to three-dimensional wing
The above study of supercritical airfoil reveals the twodimensional drag reduction mechanism of the trailing-edge variable-camber technology. In this section, variable-camber technology is applied to a realistic wing to validate the drag reduction mechanism.
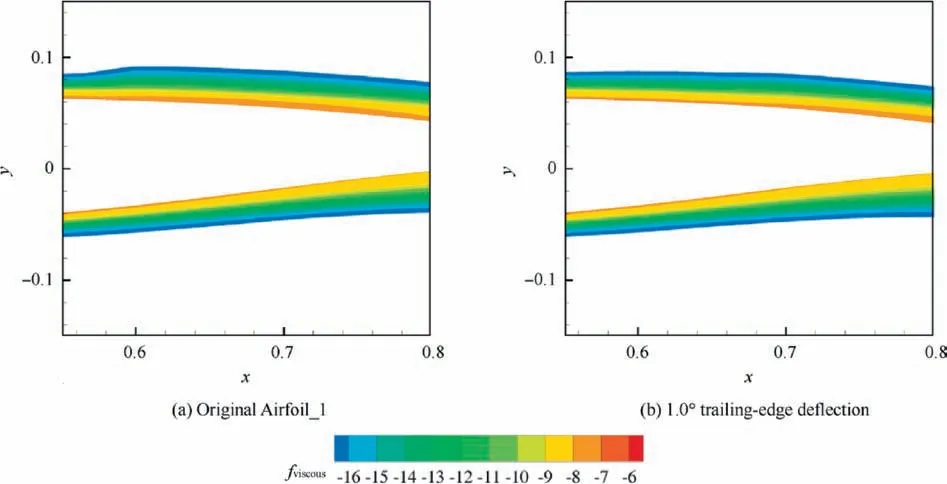
Fig. 12 Viscous region of Airfoil_1.
A wide-body airplane model is used for research,as shown in Fig. 14(a). The fuselage length is 63.3 m, the half-span is 30.6 m, and the average aerodynamic chord length is 8.1 m.The variable-camber region of the wing is split into three parts:the inner flap,the outer flap and the aileron.The inner flap has a constant chord length of 2.0 m.The lengths of the outer flap and the aileron equal 30%of the local chord length,as shown in Fig. 14(b).The spanwise lengths of the inner flap, the outer flap and the aileron are 6.1 m, 12.3 m and 9.2 m, respectively.
Similarity between the two-dimensional airfoil and the three-dimensional wing is required.To make the model of airfoil and wing models comparable, the geometries of the outer wing part are similar to the airfoil profile. The wing geometry is controlled by seven profiles,as shown in Section 3.1.Because of the interference of the wing and body, the airfoils of the inner part of the wing (Sections 1, 2,and 3)must be different.The sections of the middle and outer parts of the wing (Sections 4, 5, 6, and 7) are controlled by the same airfoil, Airfoil_1, with a thickness scaling factor cos Λ. The scaling factor is given by the cosine law of a swept wing,32where Λ is the sweep angle. Zhao et al.32successfully predicted the pressure distribution and drag coefficient of the outboard part of a supercritical wing by two-dimensional calculations. In their study, the cosine law is used for transforming the flight conditions, as shown in:

The transformation results based on the 1/2 chord sweep angle match the three-dimensional results well.32Thus in the present study, the 1/2 chord sweep angle of the wing, 29.4°,is used. Airfoil_1 under Re=9×10⁶, Ma∞=0.74 and CL=0.81 is selected as a comparison example. The corresponding three-dimensional flight conditions are Re=9×10⁶, Ma=0.85, and CL=0.50.

Fig. 13 Drag component of Airfoil_1.
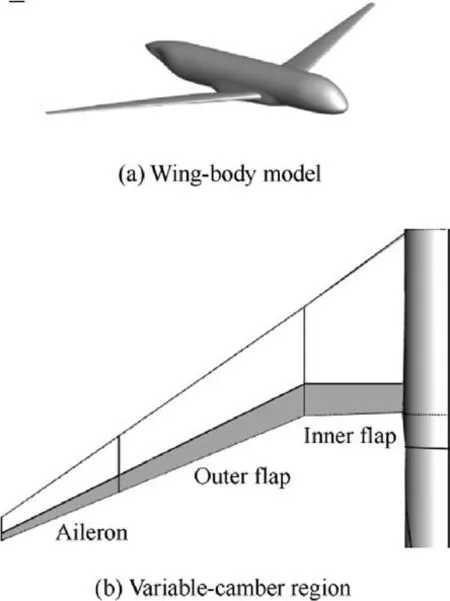
Fig.14 Wide-body airplane model and variable-camber regions.
The calculation grid of the wing-body model has 11.3×10⁶nodes.The surface grid is shown in Fig.15.The spanwise local lift coefficient distribution and the pressure distribution of the wing-body are shown in Fig. 16(a) and (b), respectively. The 23%, 46%, 69%, and 91% in Fig. 16(b) refer to the spanwise location of the four pressure distribution (0% and 100% refer to the wing root and wing tip, respetively). According to the cosine law, the local lift coefficient of the comparable profile of the wing should be 0.61. Fig. 16(a) marks the location of the comparable profile by a vertical dashed line. The selected profile is located at 60% of the half-span of the wing.
In the present study,the three parts of the variable-camber region can change the camber independently, as shown in Fig. 14(b). Elastic material is assumed to be used between the spanwise junctions to maintain the continuity of the wing when adjacent parts have different deflection angles.
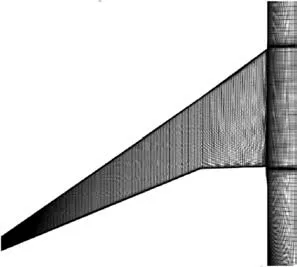
Fig. 15 Surface grid of wide-body airplane model.
The 60% half spanwise section located at the outer flap region. This region has the same deflection angle as Airfoil_1 in order to make the result comparable to the twodimensional computation. However, the deflection of outer flap will influence the spanwise load distribution and change the local CL.Consequently, the inner flap and aileron are also deflected to keep the spanwise local lift coefficient distribution unchanged.
The outer flap deflects 0.35°, which is consistent with the deflection of Airfoil_1.The inner flap and aileron deflect simultaneously to keep the spanwise lift coefficient distribution unchanged. Based on a simple optimization, the suitable deflection angles of the inner flap and the aileron are 0.50°and 0.35°, respectively. The pressure distribution of the wing surface is shown in Fig. 17. The pressure distributions of the two-dimensional airfoil and the 60% half-span of the threedimensional wing are shown in Fig. 18.
The solid curves are the pressure distributions for the original airfoil/wing, and the dashed curves are the results of the variable-camber method. Under similar flight conditions and the same deflection angle,the pressure distribution of the wing section is similar to that of the two-dimensional airfoil. With the variable-camber technology, the aft loading is increased,and the shock wave is weakened after the trailing edge is deflected to a favorable angle.
The drag decomposition results of the wing are shown in Table 5.The variable-camber method has a 0.00035 reduction in total CD,increasing the L/D from 22.92 to 23.30.The results also show that the drag reduction is mainly caused by the weakening of the shock wave, which is similar to the twodimensional situation.
The result demonstrates that the mechanism for drag reduction in the two-dimensional study is effective for threedimensional wings, which illustrates the fact that the design and optimization of variable-camber airfoil are useful for the design of variable-camber wings.
4. Variable-camber technology with aerodynamic optimization
4.1. Single-point optimization with variable camber
In Section 3.2, the variable-camber technology improved the performance of Airfoil_1 in different flight conditions. Consequently,it may be helpful to add the variable-camber technology to the optimization process of an airfoil.
Single-point optimization is an effective way to improve the performance of an airfoil at the design point. However, the poor performance of off-design points makes single-point optimization impractical. In this section, the ability of variablecamber technology to improve the off-design point performance of a single-point optimized airfoil is tested.
The optimization process is shown in Fig. 19. The singlepoint optimization has two steps. The first step optimizes the lift-drag ratio of the original airfoil under the design condition.The input variables for this step are the fourteen CST variables(seven for the upper surface and seven for the lower surface).The second step calculates the highest lift-drag ratio with the variable-camber method in design and off-design conditions.The only input variable in this step is the trailing-edge deflection angle.
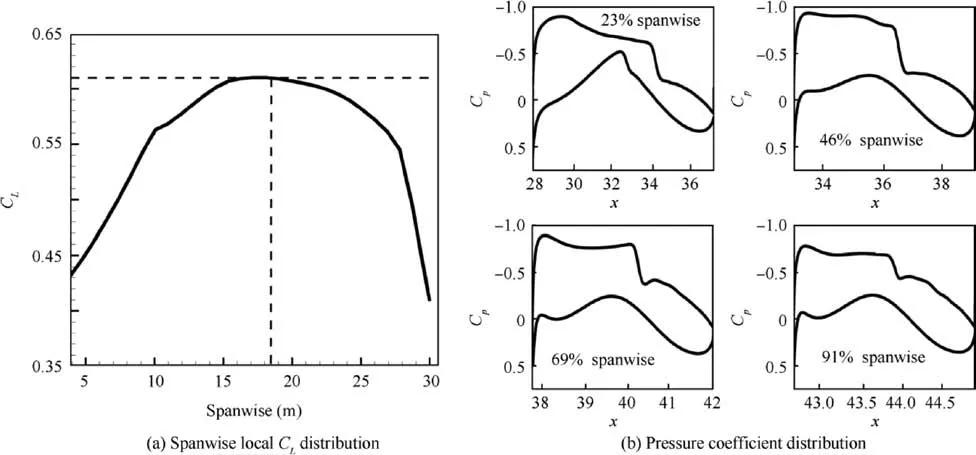
Fig. 16 Spanwise lift coefficient and pressure distributions under cruise condition.
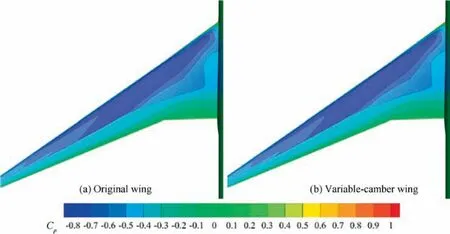
Fig. 17 Pressure distribution of three-dimensional wing.
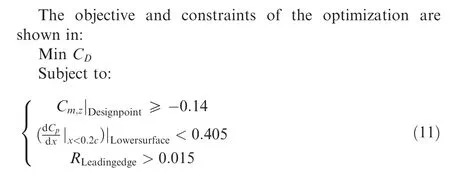
where Cm,zrepresents the pitching moment coefficient at the reference location x/c=0.25;dCp/dx|x<0.2cis used to limit the front loading of airfoil on the lower surface. RLeadingedgerepresents the leading-edge radius, which prevents the airfoil from having poor low-speed performance.
The lift coefficient CLis kept constant in the optimization process. An airfoil with high Cm,zwill increase the trim drag when installed to a wing.The term dCp/dx is used to constrain the front loading of the airfoil.A wing with strong front loading may have poor performance with small angle of attack,which might threaten the flight safety of the airplane in some extreme flight conditions. The values of the constraints come from the corresponding values of the input airfoil.
Two single-point optimizations are conducted in this paper.The incoming flow conditions are Re=9×10⁶, Ma=0.74.The two optimizations have different lift coefficients, 0.72 and 0.82. A differential evolution algorithm is adopted for the optimization.33The algorithm utilizes techniques such as the elite strategy technique and the response surface technique to accelerate the convergence of optimization.In the iteration,each generation has 32 individuals, and the optimization converges in 10 generations.The optimization histories are shown in Fig.20.The optimal results obtained from the optimizations of CL=0.72 and CL=0.82 are called Opt_1 and Opt_2,respectively.
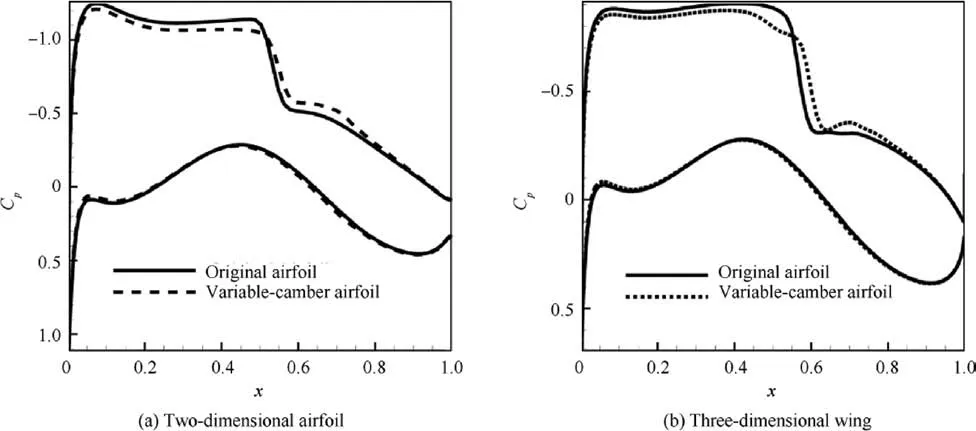
Fig. 18 Pressure distributions with/without variable-camber method.
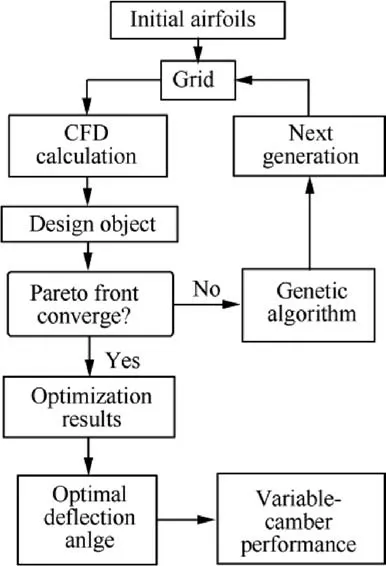
Fig. 19 Flowchart of single-point optimization.
The lift-drag ratios of Opt_1 and Opt_2 are shown in Table 6. Opt_1 has optimal performance at CL=0.72, and thus variable-camber technology is inconspicuous in the design point. When CL=0.82, the lift-drag ratio of Opt_1 is increased from 67.87 to 73.21 by deflecting the trailing edge by 0.4°. Opt_2 has good performance at CL=0.82. With a trailing-edge deflection angle of -1.0°, the lift-drag ratio at CL=0.72 is increased from 61.39 to 68.87.
With the variable-camber technology, the lift-drag ratio of Opt_1 and Opt_2 are both improved. However, both designs do not fully exceed Airfoil_1 under both flow conditions even with the trailing-edge deflection. Airfoil_1 is extracted from a practical supercritical wing. Thus, the results show that single-point optimization is not practical for engineering, even with variable-camber technology. In the following section, a multipoint optimization is carried out.
4.2. Single-point optimization with variable camber
The easiest way to utilize variable-camber technology is to add extra actuators to an existing wing. Multipoint aerodynamic optimization can ensure good performance of the baseline wing,and the variable-camber technology can further improve the lift-drag ratio of the wing under different flight conditions.In this section,two different multipoint optimization strategies are studied. The first one, called conventional optimization,optimizes the baseline airfoil geometry, and adds the variable-camber technology after optimization. The second,called integrated optimization, optimizes the airfoil shapeand the variable-camber method synchronously.The flowchart of the first optimization strategy is the same as that in Section 4.1,as shown in Fig.19.The second optimization strategy is briefly introduced here.

Table 5 Drag decomposition results of original wing and variable-camber wing.
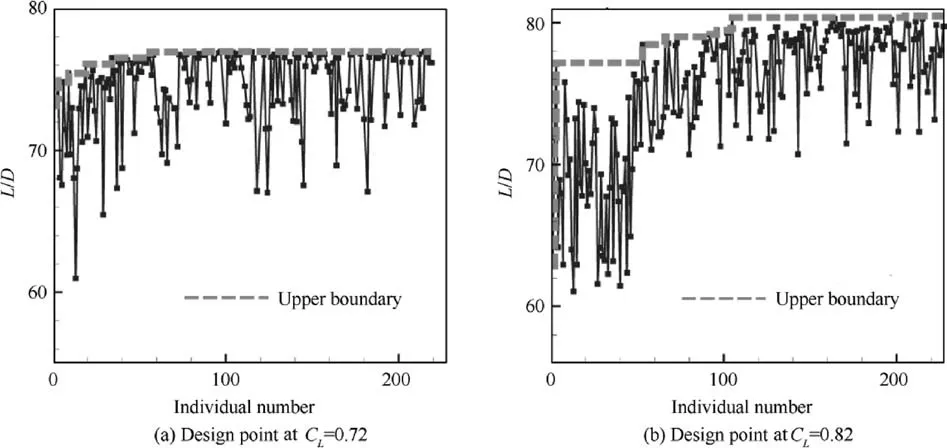
Fig. 20 Optimization history.
The performance of the variable-camber airfoil is influenced by the original airfoil. The decoupled optimization of the airfoil geometry and the variable-camber method may not be able to take full advantage of the variable-camber technology. The integrated optimization method combines the variable-camber technology and conventional aerodynamic optimization, aiming to find the airfoil with the highest variable-camber performance at multiple design points. The 14 CST parameters are used to parameterize the airfoils.Each airfoil geometry has the best flap defection angle to achieve the highest lift-drag ratio in a specific flight condition,as shown in Fig.10;consequently,the flap deflection angle is dependent on the 14 CST parameters and flight conditions,which means that it cannot be optimized together with the CST variables. In the present optimization, a two-step computation strategy is applied to each candidate design in the optimization process.The first step is to compute the performance of the baseline airfoil and find the optimal flap deflection angle for each candidate design through a gradient optimizer. The second step is to evaluate the next generation based on the best variablecamber performance of airfoils.
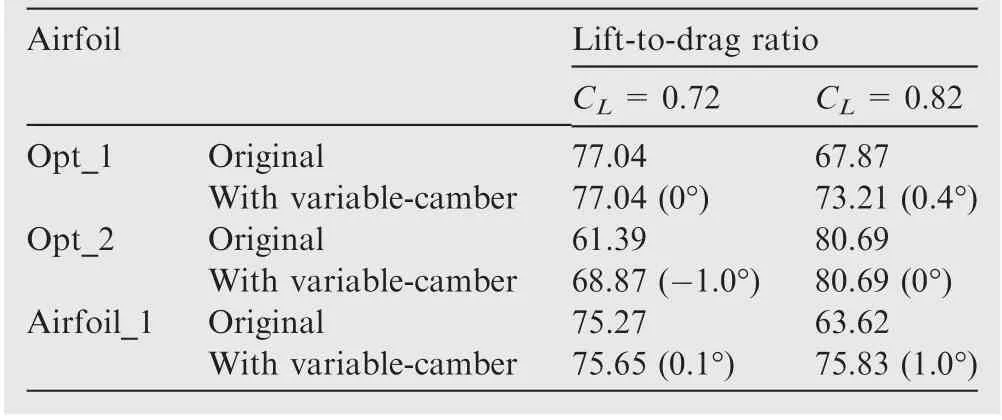
Table 6 Lift-to-drag ratio of optimized airfoil.
The flowchart of the integrated optimization is shown in Fig.21.A sub-iteration cycle(the left side)is added to the process to find the optimal flap deflection angle. The deflection angle is the input variable of the gradient optimizer. The gradient optimizer runs until the optimal deflection angle and the corresponding variable-camber performance are found.Fig.22 shows an example of the gradient optimizer to find the optimal flap deflection angle.The airfoil is Opt_2 from Section 4.1.The gradient optimizer needs two or three CFD computations to obtain the lowest drag coefficient with variable-camber technology. For the differential evolution algorithm, fourteen CST variables are the input variables. The differential evolution algorithm is applied to find the airfoils with the highest performance with the variable-camber method. The optimization constraints are the same as those in Section 4.1.
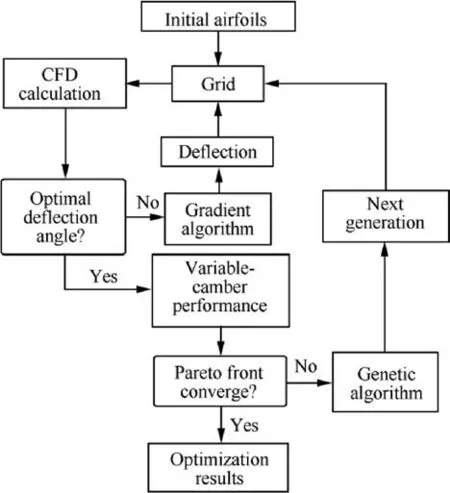
Fig. 21 Flowchart of integrated optimization.
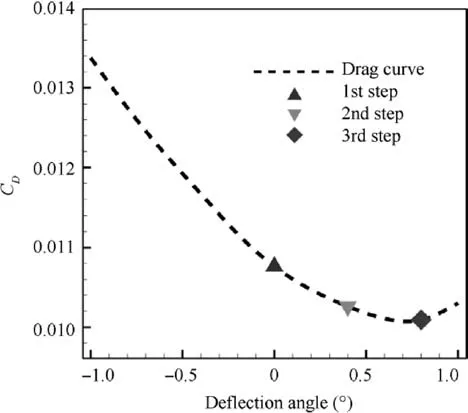
Fig. 22 Test example for gradient optimizer of flap deflection angle.
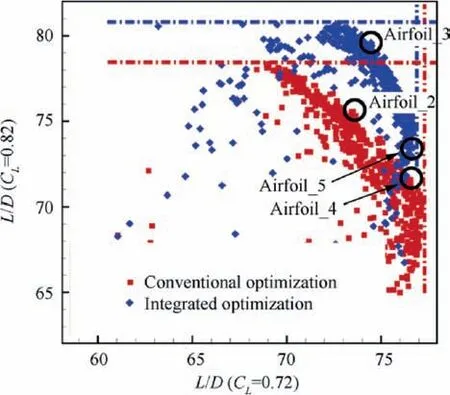
Fig. 23 Optimization results.
Conventional and integrated multipoint optimization processes are applied to airfoil optimization. The design conditions are Ma=0.74, Re=9×10⁶, and CL=0.72 or 0.82.The airplane weight may change considerably, especially during a long-range flight, due to the consumption of fuel; consequently, CL=0.82 and CL=0.72 are considered as two different cruise conditions, similar to the begin-of-flight and end-of-flight phases. The objective of conventional optimization is to maximize the lift-drag ratios of the two flight conditions, while the integrated optimization attempts to maximize the variable-camber lift-drag ratio. Both optimizations have 14 input variables(14 CST parameters).The design candidates of the two optimization strategies are shown in Fig. 23. Both optimizations have an obvious Pareto front,which means that the optimizations have converged.The blue points are the airfoils of the integrated optimization, and the red points are the airfoils of the conventional optimization. The results of the integrated optimization have better performance at CL=0.82 than the conventional optimization. This demonstrates that integrated optimization has the ability to take better advantage of the variable-camber technology on the multipoint design.Considering the time cost and optimization effect, integrated optimization of a variable-camber wing should be used in the design process of a commercial aircraft.
Two groups of optimization results are selected for analyzing the difference between conventional optimization and integrated optimization. The first group consists of Airfoil_2 and Airfoil_3, both of which have high lift-drag ratios at CL=0.82. The second group consists of Airfoil_4 and Airfoil_5, both of which have high lift-drag ratios at CL=0.72.Airfoil_2 and Airfoil_4 are from the conventional optimization,and Airfoil_3 and Airfoil_5 are from the integrated optimization. The geometries of the airfoils are shown in Fig. 24.The drag coefficients of the four airfoils are shown in Table 7.
Comparing the performance of the airfoils without the variable-camber method,we can see that Airfoil_2 has a higher lift-drag ratio than Airfoil_3 at both design points. After the application of the trailing-edge variable-camber method, the performance of Airfoil_3 has improved considerably.The best deflection angles of Airfoil_3 are -0.6° and 0.6° under CL=0.72 and CL=0.82, respectively. Airfoil_2 has less improvement than Airfoil_3 under CL=0.72, with a trailing-edge deflection angle of -0.4 deg. At CL=0.82, Airfoil_2 itself without flap deflection is the best airfoil geometry.
In the second group,the performance of Airfoil_4 and Airfoil_5 is similar to that of the first group. Airfoil_5 benefits more from the trailing-edge variable-camber method than Airfoil_4; consequently, Airfoil_5 has higher lift-drag ratio than Airfoil_4 after the application of the variable-camber method.

Table 7 Drag coefficients of optimized airfoils.
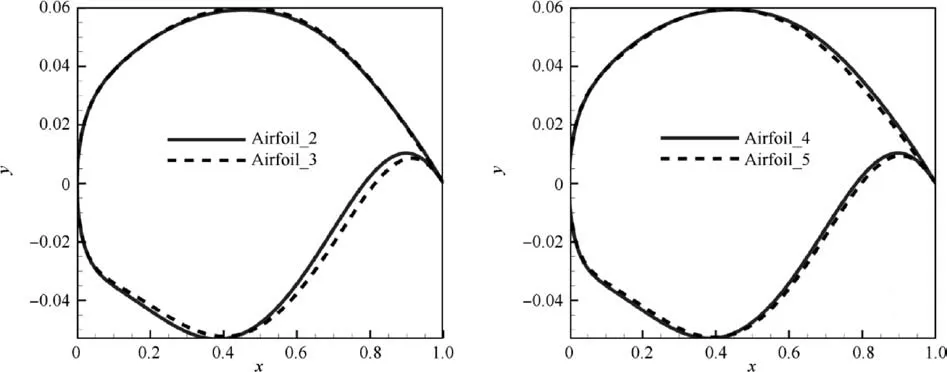
Fig. 24 Geometry of optimized airfoils.
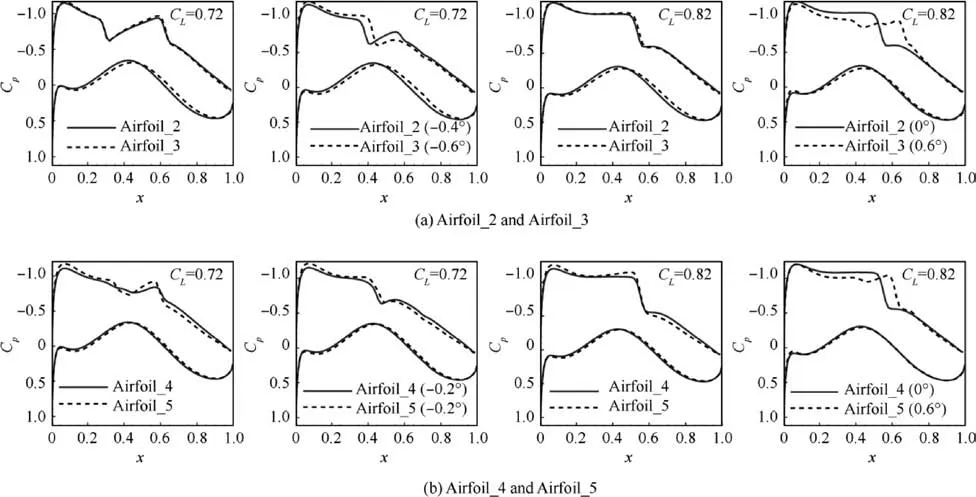
Fig. 25 Pressure distributions of optimized airfoils.

Table 8 Constraint variables of optimized airfoils (original geometry).
The pressure distributions of the airfoils are shown in Fig.25.Both Airfoil_2 and Airfoil_3 have double shock waves at CL=0.72.After deflecting the trailing-edge flap,the double shock waves of Airfoil_2 and Airfoil_3 are converted into single shock wave and the shock wave strength is also weakened.When CL=0.82, both Airfoil_2 and Airfoil_3 have similar single shock waves.Only Airfoil_3 is able to weaken the shock wave by deflecting the trailing edge to 0.6°. The original Airfoil_2 (with 0° trailing edge deflection) has the highest performance among all the variable-camber configuration of Airfoil_2.
Airfoil_4 and Airfoil_5 without flap deflection already have good performance at CL=0.72,and thus the variable-camber method has a limited effect on drag reduction.The drag reductions resulting from the application of the variable-camber method for Airfoil_4 and Airfoil_5 are less than those for Airfoil_2 and Airfoil_3. However, the shock waves of Airfoil_4 and Airfoil_5 at CL=0.82 are strong. Airfoil_5 has a considerable improvement by 0.6°flap deflection as its shock wave is obviously weakened, while Airfoil_4 is unable to benefit from the variable-camber method under this flight condition. The Airfoil_4 with 0° trailing edge deflection is better than other variable-camber configuration of Airfoil_2.
Table 8 lists the variables that are considered to be optimization constraints.The pitching moment coefficient,the pressure gradient on the lower surface when x/c <0.2 and the leadingedge radius are checked as constraints in the optimizations.The airfoils from the conventional optimization,Airfoil_2 and Airfoil_4,have already reached the boundaries of the pitching moment coefficient,which means that the camber near the trailing edge may already be large.In contrast,the airfoils from integrated optimization, Airfoil_3 and Airfoil_5, have a certain distance from the constraint boundaries.The phenomenon can explain why Airfoil_3 and Airfoil_5 can benefit from variablecamber technology by deflecting the flap downward at CL=0.82.The results further demonstrate that the integrated optimization can make better use of trailing-edge variablecamber technology than conventional optimization.
5. Conclusions
The aerodynamic characteristics of variable-camber technology are studied using CFD and the drag decomposition method in this paper.The following conclusions can be drawn:
(1) The two-dimensional study shows that variable-camber technology can effectively improve flight efficiency in a wide range of CLby reducing wave drag and form drag.The reduction of wave drag plays an important role when the shock wave is strong.
(2) The three-dimensional study shows that trailing-edge variable-camber technology is effective for a realistic wing. The research also demonstrates that the variablecamber wing has similar characteristics to those of two-dimensional airfoil for the reduction of wave drag.
(3) Single-point and multipoint optimizations are carried out on a supercritical airfoil. The results show that the integrated optimization combining variable-camber technology with geometric optimization has better performance than separated optimization. The aerodynamic performance of airfoils obtained from different optimizations is also compared. The results show that the time cost of integrated optimization is acceptable,which means that it can be applied in the design of commercial aircraft in the future.
Acknowledgements
This work was supported by the National Natural Science Foundation of China (Nos. 11872230 and 91852108).
 CHINESE JOURNAL OF AERONAUTICS2020年7期
- CHINESE JOURNAL OF AERONAUTICS的其它文章
- An experimental method for squealer tip flow field considering relative casing motion
- A novel none once per revolution blade tip timing based blade vibration parameters identification method
- Highly efficient computation method for hazard quantification of uncontained rotor failure
- Optimal motion cueing algorithm for accelerating phase of manned spacecraft in human centrifuge
- Effective control allocation using hierarchical multi-objective optimization for multi-phase flight
- Fault-tolerant control and vibration suppression of flexible spacecraft: An interconnected system approach
