Aerodynamics of ducted re-entry vehicles
C. ANBU SERENE RAJ, M. NARASIMHAVARADHAN, N. VAISHNAVI,S. ARUNVINTHAN, A. AL ARJANI, S. NADARAJA PILLAI,*
a Turbulence & Flow Control Lab, School of Mechanical Engineering, SASTRA Deemed University, Tamil Nadu 613401, India
b College of Engineering, Prince Sattam Bin Abdelaziz University (PSAU), Alkharj 11942, Saudi Arabia
KEYWORDS Aerocapture;Annular area ratio (AAR);Ballistic coefficient;CFD;Re-entry
Abstract Ballistic parameter plays a major role in determining the re-entry trajectory. Lower ballistic coefficient offers an optimal re-entry, wherein the vehicle decelerates higher up in the atmosphere thereby decreasing the imposed aerothermal loads. The current computational study proposes an add-on, to the existing Orion-based re-entry vehicle: a duct circumventing the capsule from the shoulder to the base,to improve the aerocapture ability of the re-entry vehicle.The design cases are categorised based on a non-dimensional parameter termed the Annular Area Ratio(AAR). Dragand ballistic coefficient of the Ducted Re-entry Vehicles (DRVs) at various Mach numbers are evaluated and compared with those of the baseline model. The results show that the proposed design increases the drag for all the AARs considered in the subsonic regime.In the supersonic regime,ducted models of higher AAR are more promising with the increase in Mach number.DRVs also exhibit lower ballistic coefficients than their baseline counterparts.
1. Introduction
Atmospheric re-entry is a challenge for manned interplanetary missions. Making a feasible re-entry is of utmost importance since the re-entry method and the trajectory determine the gloads and the temperatures experienced by the crew. The reentry into the earth’s atmosphere occurs at very high velocities corresponding to flight Mach numbers of 30 or even more.The highest was Mach number 36 attained by the Apollo 6 return vehicle. These hypersonic flight conditions are associated with several difficult aerodynamic problems.Subsequently,the successful manned entries of the Mercury, Gemini, and Apollo vehicles were striking testimonials to the success of the hypersonic research. The Apollo-derived Orion Crew Exploration Vehicle (CEV), part of NASA’s now-cancelled Constellation Program, has become the reference design for the new Multi-Purpose Crew Vehicle(MPCV).It will serve as the exploration vehicle for all near-term human space missions, providing emergency abort capability, sustaining the crew during space travel and providing safe re-entry from deep space. It has the largest heat-shield of its kind.1The versatile capabilities of the Orion CEV have created a lot of interest in researchers to study the aerodynamics of re-entry,to optimizeand develop better design modifications to the existing design,and to create exotic materials etc. Several experimental and computationaltests were conducted across the world in dedicated research facilities, like the one by Bibb et al.2wherein wind tunnel and computational studies were performed to develop the static aerodynamic database for the Orion CEV. Murphy et al.3also performed similar wind tunnel tests on the longitudinal aerodynamics of the CEV.Berry et al.1used five different facilities to experimentally validate the computational predictions of the aero-thermodynamic effects on the Orion CEV during re-entry.Hixson4studied the performance of different descent,landing and recovery systems in Orion CEV such as parachutes,horizontal solid rocket motors,airbags after jettisoning of heat shield etc. Aerothermal testing of Orion was computationally performed by Hollis et al.5to simulate the aero heating environment of the Orion capsule by approximating the module as a smooth body, for various Mach numbers and Reynolds numbers. However, Murman et al.6extended the study by considering wall roughness over the Orion module in the subsonic regime and the results were experimentally validated against the wind tunnel results. Sebastian and Tolson7experimentally investigated the aerodynamic coefficients and stability derivatives for the Orion CEV.
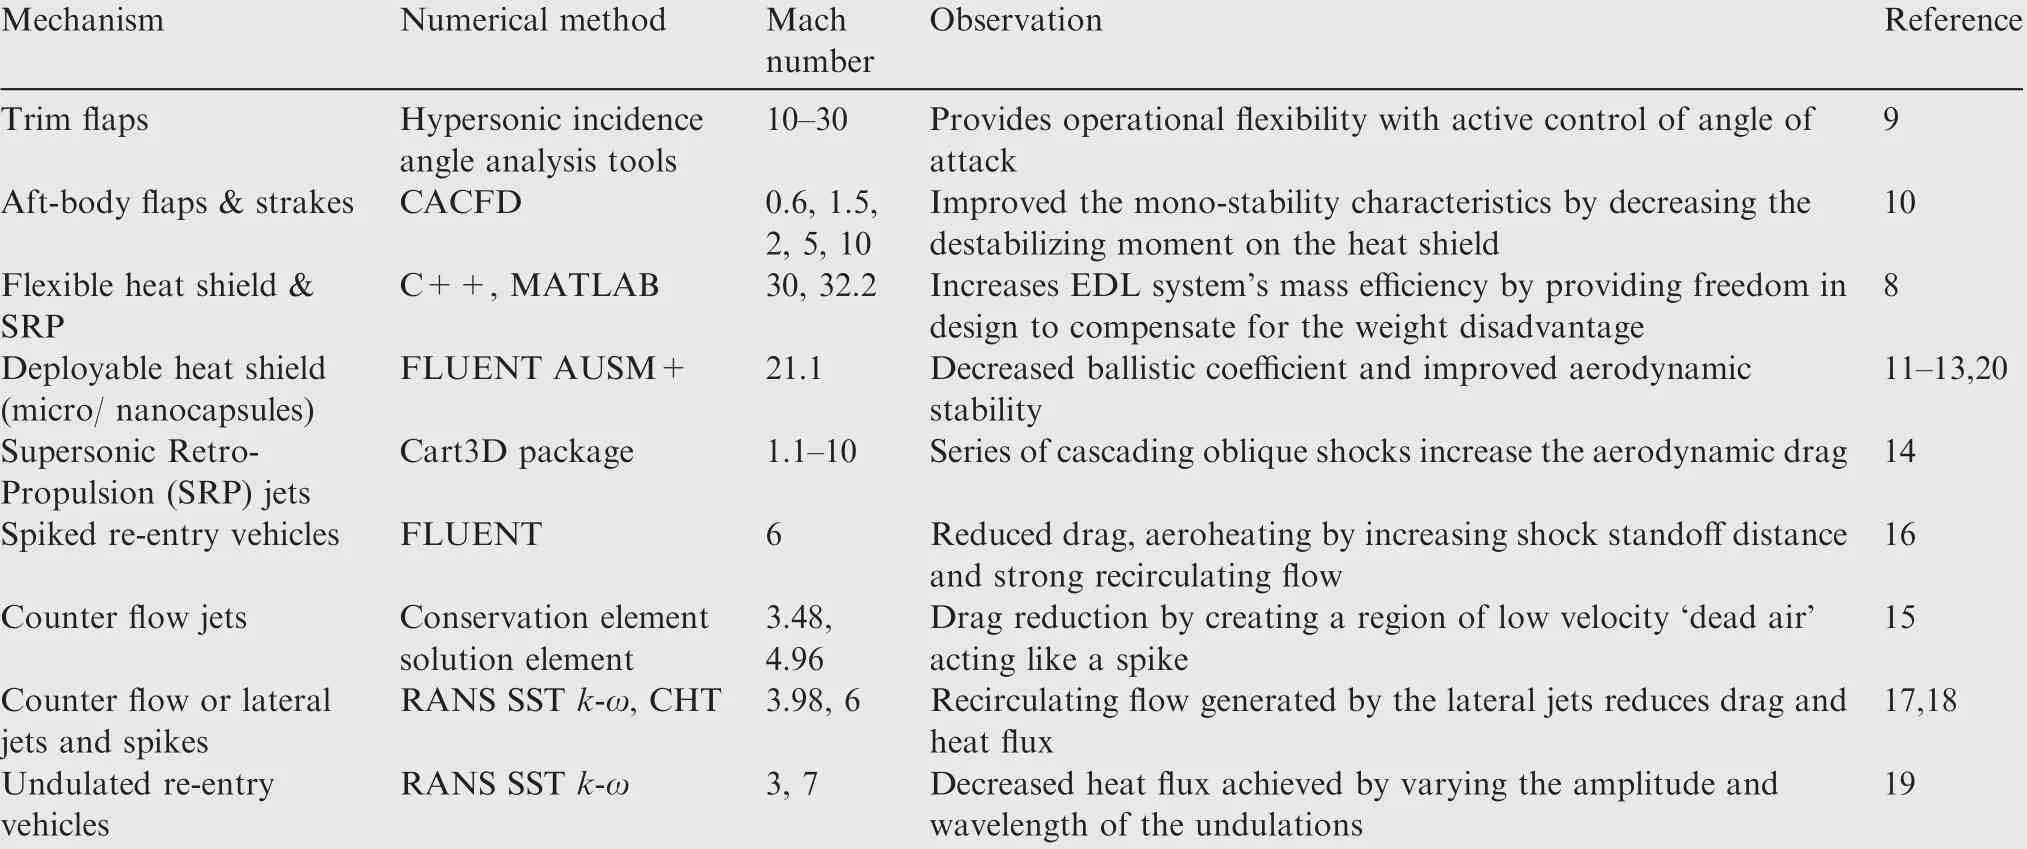
Table 1 Previous computational works on re-entry vehicles.
Over the years, the effect on the drag coefficient due to a physical modification in any vehicle has piqued the curiosity of various researchers and aerodynamicists. Re-entry vehicles have always been a subject of interest in this regard, considering the huge practical implications. Many researchers have worked to improve the re-entry parameters of the Orion CEV and other re-entry vehicles. Some of the notable computational works on re-entry vehicles are listed in Table 1.Braun et al.8identified the limitations of the existing Entry, Descent and Landing (EDL) technology for re-entry vehicles and suggested a flexible heat shield mechanism stating its advantages over the existing solid heat shield designs. A study by Whitmore et al.9involved the comparative aerodynamic analysis of the re-entry configurations:HL-20,Biconic capsule,Apollo capsule and a modified Apollo capsule with trim flaps. Moreover, Chen et al.10computationally investigated the effect of flaps and strakes in the re-entry vehicles in order to improve the monostability characteristics in both subsonic and hypersonic regimes while maintaining the required L/D ratios. The effect on ballistic coefficient and stability due to the deployable heat shield was demonstrated by Carandente,11Savino12andFedele13et al. Supersonic retro propulsion jets,14counter flow jets,15spiked vehicles16and counter flow jets with a spike,17,18which alter the bow shock and drag in accordance with the requirements, have also been studied. Kaushikh et al.19introduced undulations on the aft-body of a re-entry vehicle to analyze the parameters like mono-stability characteristics and peak heat flux. Table 2 lists the effect of some of these design alterations on the critical parameters of re-entry.8-20The current work aims to develop a ballistic aerocapture9mechanism,for an Orion based re-entry vehicle.

Table 2 Various mechanisms considered and their impact on critical parameters of re-entry.
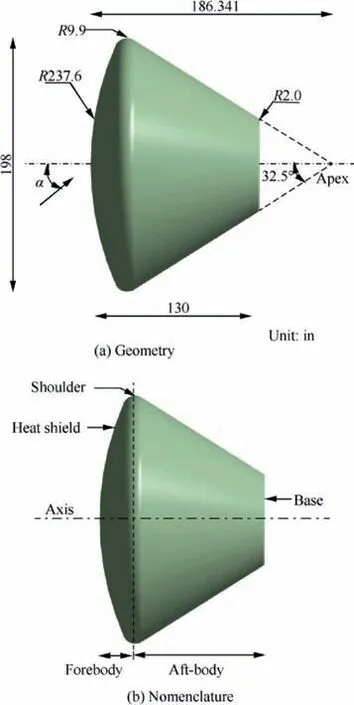
Fig. 1 Baseline re-entry vehicle geometry and nomenclature.
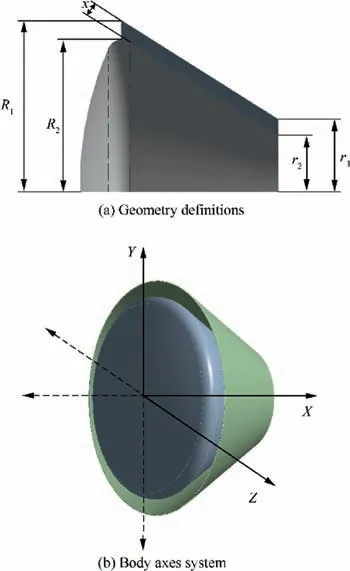
Fig. 2 Ducted re-entry geometry definitions and body axes system.
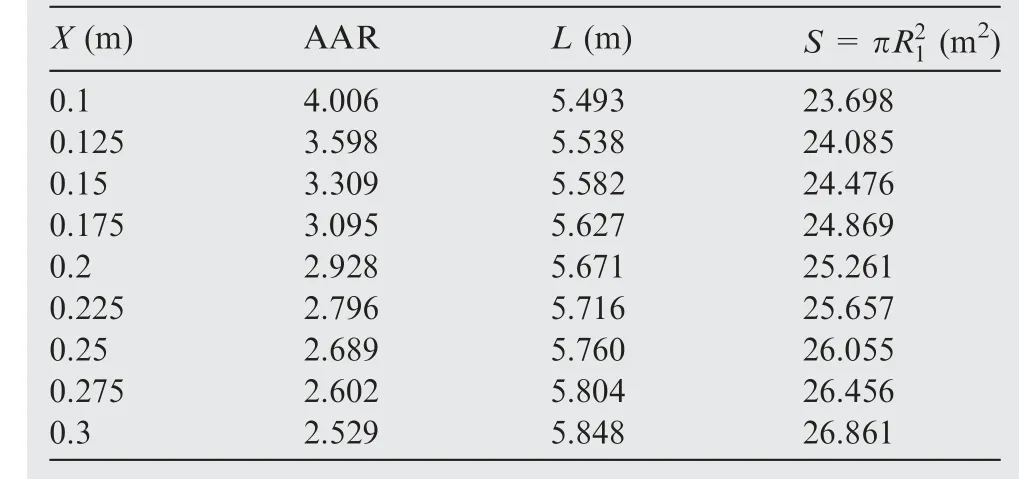
Table 3 Design specifications of considered DRVs.
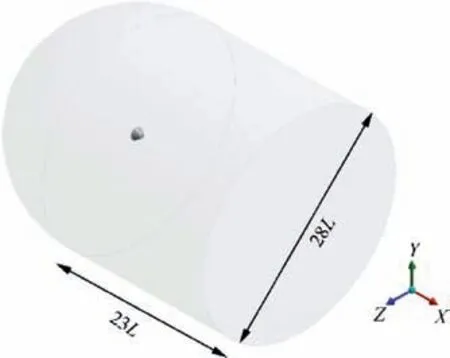
Fig. 3 Isometric view of computational domain.
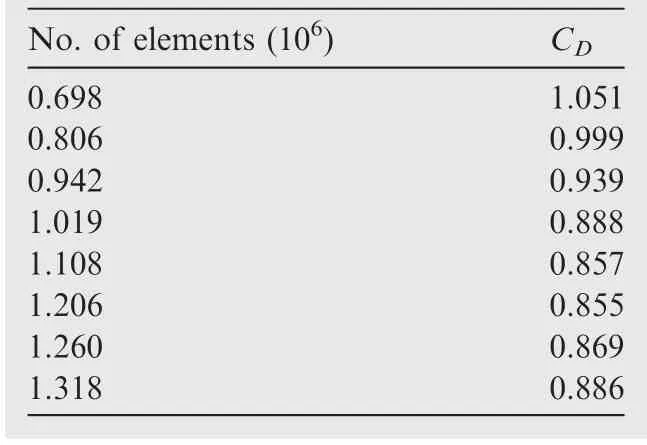
Table 4 Mesh independency results.
2. Computational methodology
The configuration of the baseline re-entry vehicle considered in the present work is derived from the Orion Crew Exploration Vehicle3, a reusable transportation capsule similar in shape to the Apollo capsule. It has an increased heat shield diameter and extends for a span of around 3.3 m (L=130 in), with alaunch mass of 8900 kg. Fig. 1 shows the dimensions and nomenclature of the baseline model used in the current study.

Table 5 Coefficients of Cp polynomial equation.
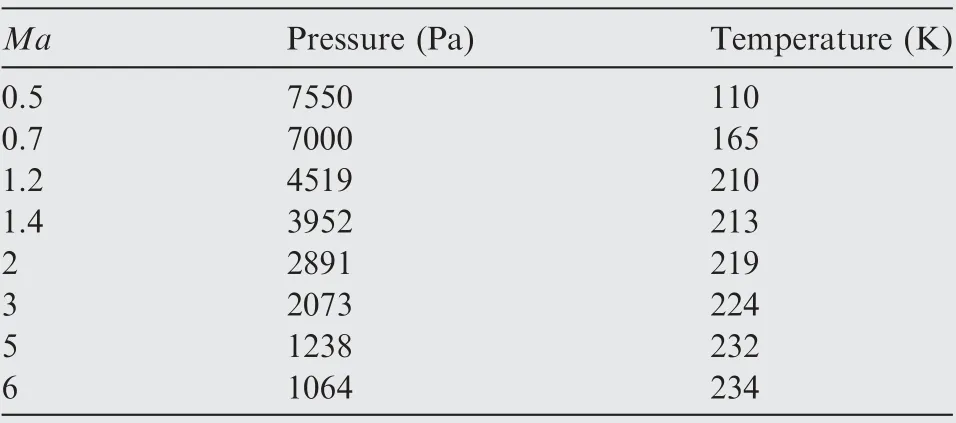
Table 6 Freestream boundary conditions.
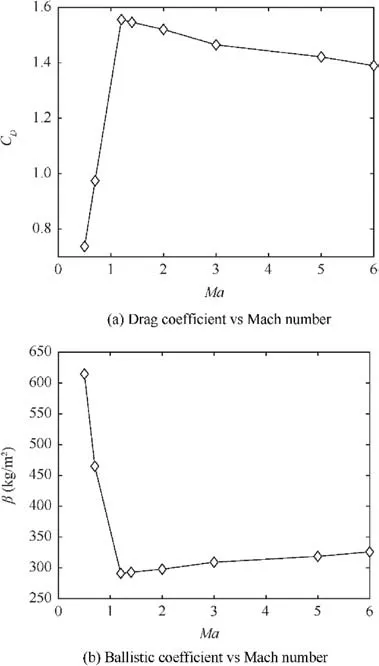
Fig.4 Drag coefficient and ballistic coefficient vs Mach number of baseline re-entry vehicle.
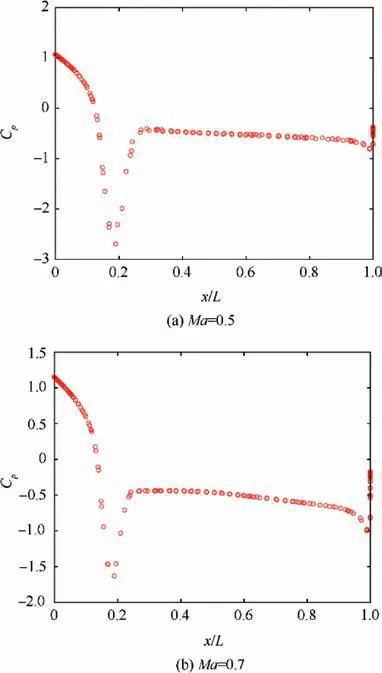
Fig.5 Pressure coefficient Cp vs axial position x/L plotted along the sectional surface of baseline re-entry vehicle in subsonic regime.
The proposed re-entry vehicle design constitutes a duct encapsulating the aft-body of the baseline model from the shoulder to the base. The proposed design is characterised by the normal spacing of the duct from the capsule’s aft-body surface(x).The extended curvature of the heat shield is taken to be the entry of the duct inlet.As the normal spacing between the duct and the capsule’s surface is varied, the inlet and outlet annular areas of the duct differ. It was speculated that this variation in the area would affect the drag. To formally analyse its effect, a non-dimensional parameter termed as the Annular Area Ratio (AAR) was introduced. AAR is defined as the ratio of the area of the annular inlet to that of the outlet and is mathematically represented as follows:

The radii taken into consideration for calculating the AAR of ducted models are shown in Fig. 2(a). In this study, nine configurations obtained by varying the normal spacing of the duct, in increments of 0.125 m, in the range of 0.1-0.3 m, as shown in Table 3, have been considered. The reference area(S) is the projected area of the DRV onto the YOZ plane.The proposed models are termed as Ducted Re-entry Vehicles(DRVs).
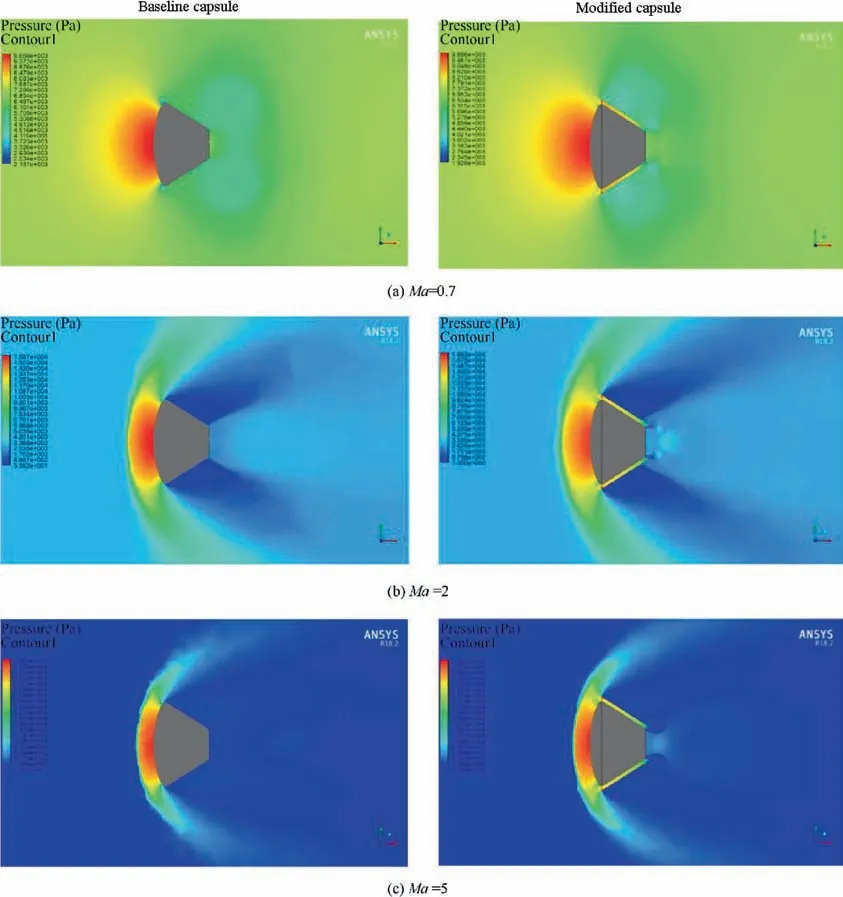
Fig. 6 Pressure contour comparison between baseline capsule and DRV (AAR=3.1).
The current study is limited to the aerodynamic effect of the addition of duct to the re-entry vehicle,modelled as a smooth body.The body axis system of the proposed DRV is shown in Fig.2(b)wherein the axis of the re-entry vehicle lies along the X-direction with the heat shield facing the freestream.Hence the axial,normal and side forces act along the X,Y and Z-axes respectively.
The computational domain,shown in Fig.3,is divided into a finite number of unstructured tetrahedral elements. In order to identify the mesh density that provides a mesh independent result, grid independency study is done on the baseline CEV model and the value of drag computed using the RANS solver is validated.6The drag coefficient CDas predicted by different mesh densities are tabulated in Table 4. From the results, a mesh density of 1.2 million elements was chosen to be used throughout the study.
The mesh is converted to polyhedra in Fluent, for its known ability to handle stretched cells and to predict recirculating flows accurately.21Moreover, polyhedral mesh automatically creates prismatic elements at the boundary and walls thereby overcoming the inability of tetrahedral mesh to resolve boundary layers. The 3D, double-precision, implicit density-based solver of flux type Roe-FDS is used for all the computational simulations. Reynolds Averaged Navier Stokes (RANS) equations are solved to get the smooth variation of the averaged velocity and the pressure fields in a turbulent flow. The two-equation SST k-ω turbulence model has been used to close the RANS equations as it predicts the separation and reattachment better than other models.22Air, of ideal gas density variation, is chosen to be the freestream fluid. Three-coefficient form of Sutherland’s viscosity law,by Sutherland (1893), based on the kinetic theory of gases and idealized intermolecular-force potential, is used to define viscosity.

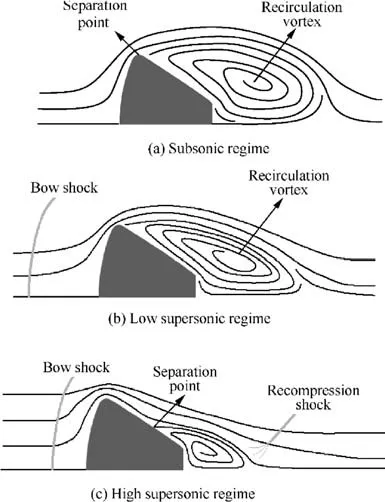
Fig. 7 Schematic diagram of flow pattern over baseline re-entry vehicle.
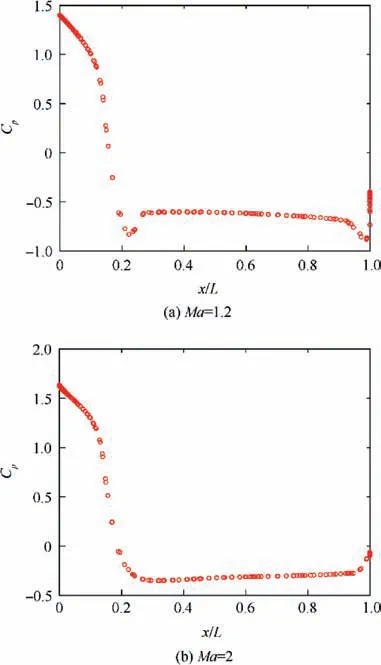
Fig. 8 Pressure coefficient vs axial position plotted along the sectional surface of baseline re-entry vehicle in low supersonic regime.
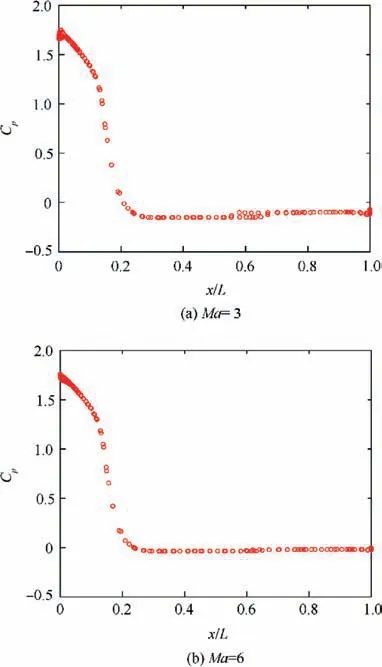
Fig. 9 Pressure coefficient vs axial position plotted along the sectional surface of baseline re-entry vehicle in high supersonic regime.
where μ0is the reference viscosity, T0is the reference temperature and Su is the Sutherland constant.The piecewise polynomial equation defines the variation of specific heat capacity,Cpas a function of temperature23in the range of 550-2000 K. Cpis taken to be 1018.2 J/(kg·K) for the temperature range 273-550 K.24Table 5 gives the coefficients of the polynomial equation used for Cp.

Thermal conductivity k (T )variation is calculated from the following piecewise-linear equation at 36 data points of temperature from 250 K to 2000 K in steps of 50 K:

The computational domain boundaries were set to pressure far-field, to simulate the freestream conditions and stationary wall, and to ensure no-slip condition over the models. Based on the framework of previous works, the freestream static boundary conditions listed in Table 6 are used for the pressure far-field condition.The turbulence intensity and viscosity ratio are set to their default values 5% and 10 respectively.
Green-Gauss node based gradient is used for its accuracy over cell-based gradients on irregular unstructured meshes.The discretization scheme for the convection terms was set to first-order upwind scheme for the first few iterations and then changed to second-order upwind scheme to be proceeded with till convergence. To improve the start-up and general solution behaviour of the simulations, Higher-Order Term Relaxation (HOTR), Convergence Acceleration for Stretched Meshes option(CASM)and Warped-face Gradient Correction were enabled. All the residuals were set to 1×10⁻⁶.
3. Results and discussion
3.1. Baseline re-entry vehicle
The drag coefficient obtained for the baseline model is plotted for various Mach numbers in Fig. 4(a). The mass of the baseline re-entry vehicle is presumed to be 8900 kg, and for the ducted capsules, an allowance of 100 kg is given to account for the ducts. The ballistic coefficient, β, is calculated (in kg·m-2) using the formula (5) and plotted at various Mach numbers as shown in Fig. 4(b).

Upon observation of the drag coefficient plot, it is found that there is a rise in CDinitially followed by a gradual decrease proceeding towards Mach number independence which is evident by the decrease in slope as Mach number increases.The inverse proportionality of β to CDis clearly evident from Fig.4.The range of the ballistic coefficient is found to lie between 290 and 615 kg/m2.
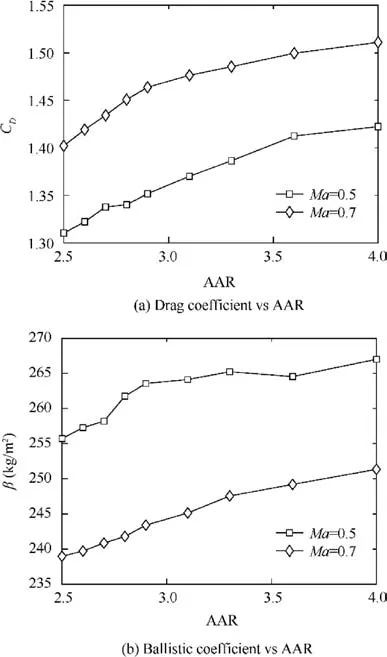
Fig. 10 Drag coefficient and ballistic coefficient vs AAR of ducted re-entry vehicle at subsonic Mach number.
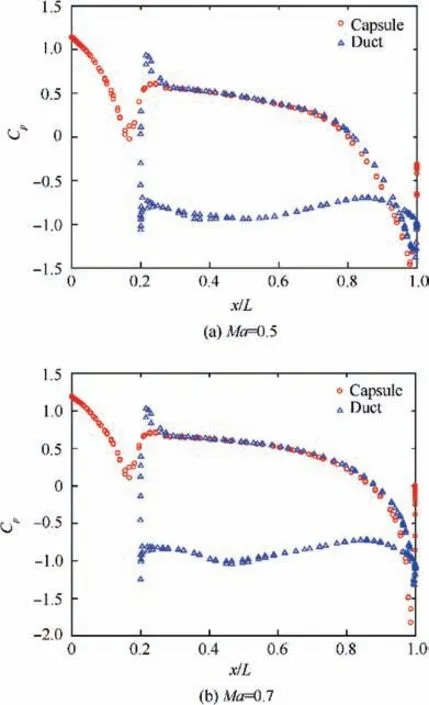
Fig. 11 Pressure coefficient vs axial position plotted along the sectional surface of the DRV of AAR=4 in subsonic regime.
3.1.1. Subsonic regime
In the subsonic regime,Mach number 0.5,0.7 were considered.The baseline model shows a significant increase in drag from Mach number 0.5 to 0.7. Cpdistribution along the sectional surface of the baseline re-entry vehicle is plotted against the axial position x/L of the capsule. When the freestream flow encounters the capsule, it stagnates at the centre of the heat shield, causing an increase in pressure, which can be seen as the peak Cpvalue at zero x/L,in Fig.5.The flow pattern over the baseline re-entry vehicle was observed for each regime using the streamline plots and the schematic is shown in Fig.6.The sudden drop in Cpnear the shoulder of the capsule indicates strong flow acceleration, after which, the flow separates to create vortices symmetric about the axis of the capsule,recirculating over the aft-body.This recirculation vortex is represented schematically in Fig. 7(a). The pressure remains almost constant over the aft-body indicating a separated flow.Near the base,another expansion region is observed,followed by an increase in Cpas we proceed towards the axis of the capsule. At Mach 0.7, the strength of this expansion region reduces,indicated by the rise in Cpvalue at the shoulder.Also,an increase in base pressure is seen at higher Mach Number Ma.The increase in pressure at the heat shield is evident from Fig.5(a).It also elucidates the region of expansion with lower pressure near the base. From Fig. 4(b), it is clear that the ballistic coefficient is very high in the subsonic regime.Given that the mass and area of the baseline re-entry vehicle do not change, the high value of β is due to the low drag coefficients.
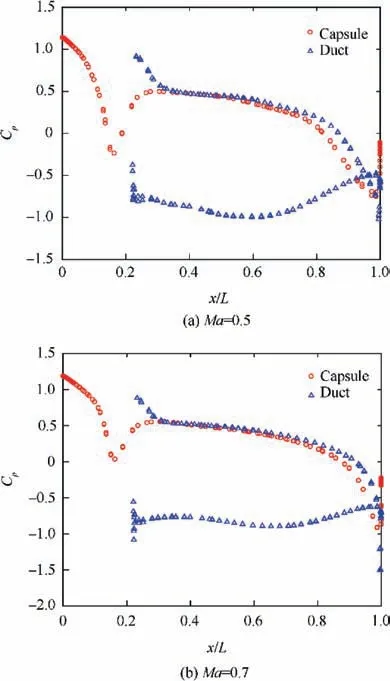
Fig. 12 Pressure coefficient vs axial position plotted along the sectional surface of the DRV of AAR=2.5 in subsonic regime.
3.1.2. Low supersonic regime
The observed spike in CDfrom Mach number 0.7 to 1.2 can be attributed to the presence of shock waves. Among the considered Mach numbers, the baseline re-entry vehicle attains maximum drag at Mach number 1.2 after which it decreases steadily. Generally, the supersonic flow over blunt re-entry vehicles is characterised by the presence of a bow shock, as depicted in Fig. 7(b). The flow strongly decelerates downstream of the bow shock as Ma increases. On the other hand,the shock stand-off distance decreases, increasing the heat shield pressure steadily throughout the regime. At higher Mach number,the recirculating flow shrinks in size,eventually resulting in a partially attached flow over the aft-body. From Fig. 6(b), it can be seen that compression shock over the base of the capsule, prominent from Mach number 2, redirects the flow again into the freestream direction. Considering the surface pressure coefficient, Fig. 8 reveals that the aft-body and the base experience an overall rise in surface pressure,in addition to the increase in peak pressure at the heat shield with respect to Mach number.
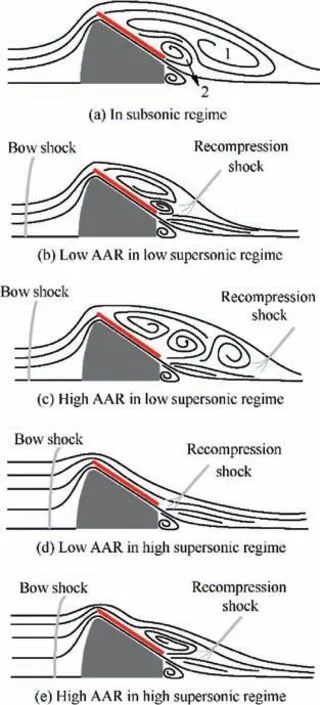
Fig. 13 Schematic diagram of flow pattern over DRVs.
3.1.3. High supersonic regime
In this regime, the bow shock becomes stronger and moves in closer to the capsule raising the heat shield pressure(Fig.6(c)),attaining a constant value. Fig. 9 displays the increase in aftbody pressure, up to the freestream pressure with increasing Mach number. As can be seen in Fig. 7(c), the flow over the aft-body is partially attached, before separating to form a smaller recirculating zone.In general,the drop in pressure difference across the capsule and reduction in the recirculation region explain the drop in drag with Mach number in the supersonic regime. The progressive decrease in drag with Ma,as observed in Fig.4(a),can be construed as an early sign of Mach number independence.
3.2. Ducted re-entry vehicle
3.2.1. Subsonic regime
From Fig. 10(a), it can be observed that the drag coefficient increases monotonically with AAR and Mach number. As the frontal area of the DRV decreases with the increase in AAR,the ballistic coefficient increases with AAR.As observed in Fig. 10(b), in the subsonic regime, ducted re-entry vehicles exhibit lower β values as Ma reaches unity.The range of β lies between 237 and 270 kg/m2for the DRVs whereas it ranges from 460 to 615 kg/m2for the baseline re-entry vehicle.
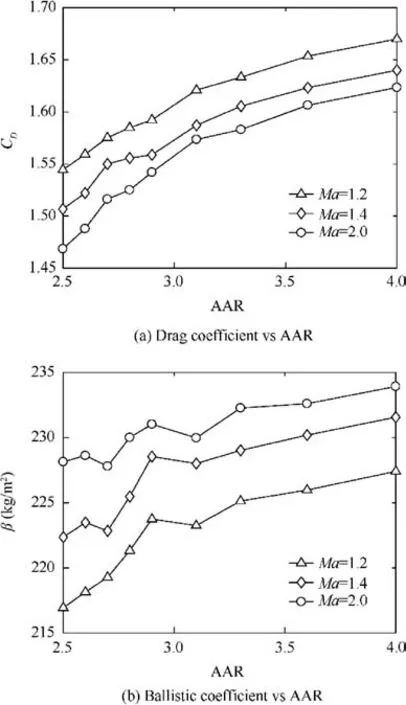
Fig. 14 Drag coefficient and ballistic coefficient vs AAR of ducted re-entry vehicle at low supersonic Mach numbers.
From the Cpplots in Figs.11 and 12,it can be seen that the peak heat shield pressure for the ducted models is slightly higher than that of the baseline model irrespective of the AAR. Comparing the surface pressure distribution over the baseline model to that of the ducted models, it is noteworthy that there is a significant pressure drop towards the base of the vehicle.The pressure drop can also be seen at the inner surface of the duct’s end. This indicates a strong acceleration of the bypassed duct flow towards the base. The pressure difference between the inner and the outer surface of the duct produces a normal pressure force on the duct. The increase in drag of the ducted capsules is speculated to be the result of the additional axial component of the normal pressure force on the duct. At Mach number 0.5, the pressure difference on the duct surfaces nullifies itself towards the base at an axial position of around 0.9, whereas at Mach number 0.7 the pressure difference continues further towards the duct outlet explaining the observed increase in drag coefficient at Mach number 0.7.
The freestream flow stagnates at the heat shield and tries to expand near the shoulder as in baseline capsules. But, due to the presence of duct,the flow expansion is reduced,eventually stagnating at the inner surface of the duct inlet, and hence the rise in Cpat the axial position of around 0.16 is observed.It is presumed that the low pressure at the base draws the stagnated flow near the inlet, accelerating through the duct (Fig. 6(a)).The flow separates from the duct in the ducted models as opposed to the baseline model where it separates at the shoulder. This creates a recirculation vortex, shown in Fig. 13(a)as 1.The outflow from the duct creates a counter-rotating vortex,pushing the original symmetric vortex outwards, represented as 2 in Fig. 13(a). This counter-rotating vortex produces a stagnation point over the upper surface of the duct.
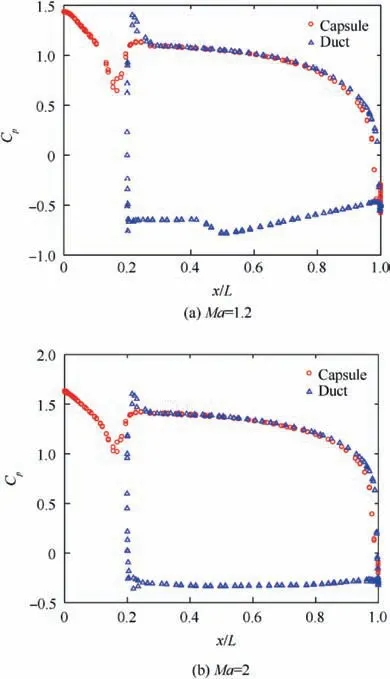
Fig. 15 Pressure coefficient vs axial position plotted along the sectional surface of the DRV of AAR=4 in low supersonic regime.
With decreasing AAR,the peak pressure at the bottom surface of the duct inlet drops slightly. It is evident that, towards the outlet of the duct, the pressure on the capsule surface and the duct’s inner surface differ, reducing the overall high pressure inside the duct. This creates a strong suction resulting in an accelerated flow through the duct. This accelerated duct flow elongates the counter-rotating vortex and shrinks the original symmetric recirculating vortex. These effects might justify the decreasing trend of drag seen with a decrease in AAR.
3.2.2. Low supersonic regime
Mach numbers 1.2,1.4 and 2 have been covered under the low supersonic regime.The trends in CDand β with AAR and that of Cpalong the length of the capsule are shown in Fig. 14(a)and (b). Additionally, the flow behaviour is also discussed briefly in this section.
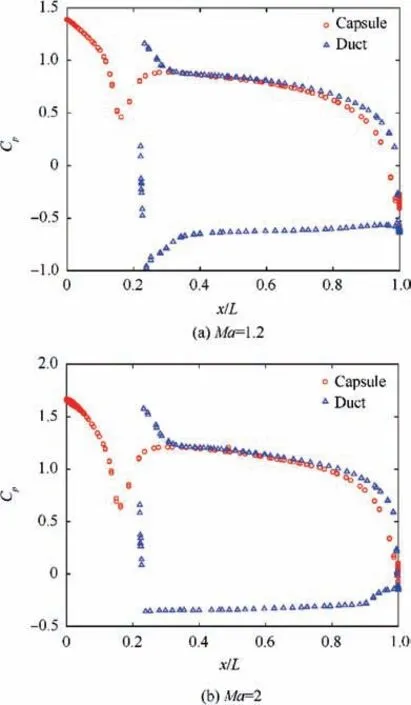
Fig. 16 Pressure coefficient vs axial position plotted along the sectional surface of the DRV of AAR=2.5 in low supersonic regime.
The general trend of increasing CDwith increasing AAR is seen in this regime also. Ballistic coefficient, being dependent on drag, also behaves in a similar fashion, but in an inverted manner. The ballistic coefficient increases with AAR for all Mach numbers except Mach number 1.2, which could explain the high value of CD. Both of the plots are in agreement with this point.In this regime,β lies between 215 and 235 kg/m2for the DRVs,which is lower compared to that of the baseline reentry vehicle which ranges from 290 to 300 kg/m2.
From the Cpplots shown in Figs. 15 and 16, it is observed that the peak pressure at the heat shield is slightly higher at low supersonic regime relative to the subsonic regime. The peak pressure coefficient is just around 1.4 at Mach number 1.2,exactly 1.5 at Mach number 1.4 and greater than 1.5 at Mach number 2,suggesting an increasing trend.This can be attributed to the decrease in standoff distance of the bow shock.With the increase in Mach number,it is also observed that the pressure on the outer surface of the duct is fairly constant along the length of the capsule. There is a tendency for the flow in the annular region to remain at a higher pressure as opposed to that at the subsonic regime where there was a steady drop of pressure along the length of the capsule (Fig. 6(b)). This tendency increases with increase in Mach number. However, as the flow approaches the base of the capsule,the pressure drops sharply, resulting in an accelerated flow inside the duct. This outflow is further accelerated by the expansion region around the base. As the AAR decreases, the pressure difference between the outer and inner surfaces of the duct decreases,which is noticeable in the plots. This might explain the reason for higher drag at higher AARs.
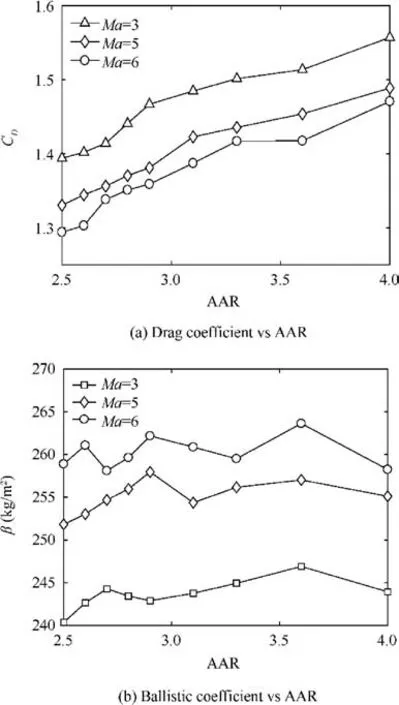
Fig. 17 Drag coefficient and ballistic coefficient vs AAR of ducted re-entry vehicle at high supersonic Mach numbers.
For ducted capsules of lower AAR, as Mach number increases from subsonic to supersonic, the recirculating region seen at the rear of the capsule shortens in length. The size of the original recirculation vortex is significantly reduced in comparison to that of the subsonic regime. At higher AAR,the counter-rotating vortex becomes strong enough to separate the original vortex into two discrete vortices,one of which lies over the duct between the counter-rotating vortex and duct inlet while the other extends downstream from the base. At Mach number 2, the transition to the next regime starts with the diminishing vortices and predominant attached flow over the duct.This is represented in Fig.13(b)and(c).Recompression shock is a common characteristic observed in all cases.
3.2.3. High supersonic regime
In this regime,Mach number 3,5 and 6 are considered.Similar to other regimes, the drag coefficient increases with a decrease in normal duct distance from the capsule. It is evident from Fig. 17(a) and (b) that, as the freestream Mach number increases to higher and higher values,CDdrops steadily,bringing about an equivalent increase in the overall ballistic coefficient range of the ducted capsules in this regime. However,with respect to baseline re-entry vehicle,the DRVs have lower β values.
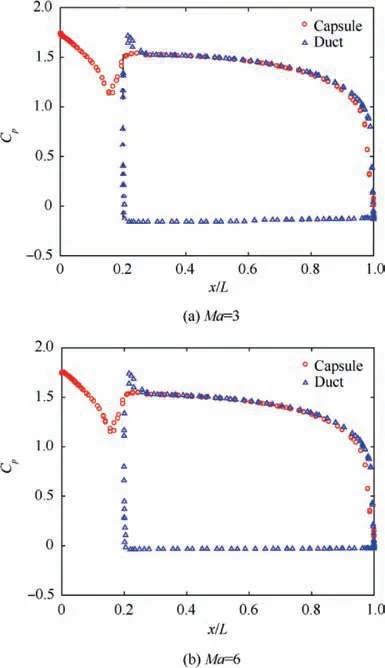
Fig. 18 Pressure coefficient vs axial position plotted along the sectional surface of the DRV of AAR=4 in high supersonic regime.
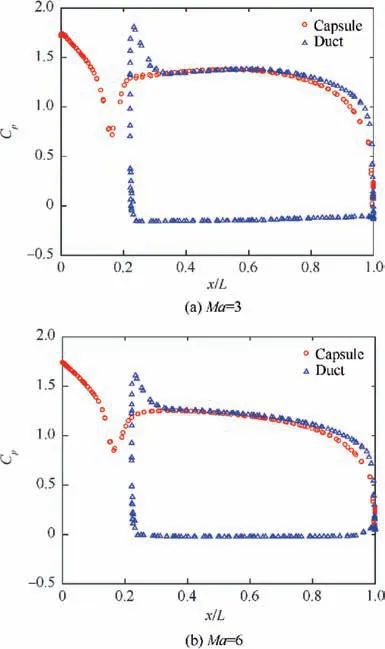
Fig. 19 Pressure coefficient vs axial position plotted along the sectional surface of the DRV of AAR=2.5 in high supersonic regime.
In this regime, the peak heat shield pressure and the base pressure of the ducted capsules remain constant without much deviation from the baseline capsule. However, the drag improvement when compared to the baseline capsule can be explained by the axial component of the normal duct force.
With the increase in Mach number from 3 to 6,the pressure distribution over the upper surface of the duct increases and gradually attains a value equal to the freestream pressure.This is evident from Figs.18 and 19.There is almost no Cpvariation throughout the upper surface of the duct. Furthermore, it is evident from Fig. 6(c) that the high-pressure region inside the duct is prevalent for almost the entire length of the duct.For ducted capsules of lower AAR,the pressure inside the duct falls gradually, weakening the pressure difference across the duct. This minimizes the drag contribution of the duct,explaining the observed decline in drag coefficient value.
Fig. 13(d) and (e) illustrate that, in the high supersonic regime, bow shock moves closer to the capsule. The flow over the ducted configurations of higher AAR indicates that the flow over the duct tries to attach to the surface and separates eventually.The previously diminishing counter-rotating vortex over the outlet of the duct fades away and only the original recirculating vortex subsists. However, ducted capsules of higher AAR display another flow pattern wherein the flow remains attached to the duct surface without any recirculation zone,and hence no vortex is seen.Throughout the regime,the recompression shock is established irrespective of the freestream Mach number.
3.3. Enlarged re-entry vehicle
One might speculate that the increase in drag for the DRVs is possibly due to the increased frontal area. To avoid such perplexity, an enlarged capsule equivalent to the best performing ducted capsule (AAR=4) has been modelled and simulated for three Mach numbers, one in each regime. The enlarged model,without the duct,has an increased heat shield diameter but the same basic design as the baseline CEV,with the length,back shell angle,and the radius of the heat shield unchanged as shown in Fig. 20. The aim is to compare the drag coefficients of these equivalent models of the same frontal area.The results indicate that increasing the frontal area of the capsule while keeping all other design parameters constant, in fact, reduces the drag of the capsule as opposed to the original speculation.The comparison of drag is presented in Fig. 21.
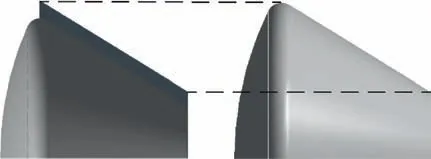
Fig. 20 Illustration of the equivalence of an enlarged re-entry vehicle with the DRV.
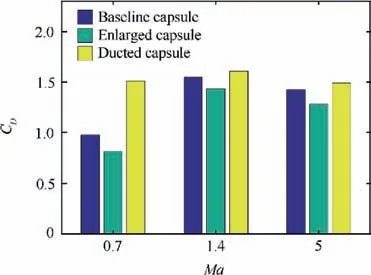
Fig. 21 Comparison of drag coefficients of baseline, enlarged and its equivalent DRV at Ma=0.7, 1.4 and 5.
4. Conclusions
The present work aims at developing a ballistic aerocapture method for an Orion based re-entry vehicle to achieve optimal re-entry. This was achieved by circumventing the CEV with a duct extending from the shoulder to the base of the capsule,to increase the drag thereby lowering the ballistic coefficient. A baseline re-entry vehicle and nine different DRV configurations were modelled and computationally investigated under three flow regimes ranging from Mach number 0.5 to 6. The results were compared to study the drag characteristics and surface pressure characteristics, and to understand the flow phenomena due to the presence of the duct. The conclusions are as follows:
(1) The addition of a circumventing duct reduces the ballistic coefficient significantly.
(2) The increase in drag seen in the DRVs is not due to the change in the effective frontal area but due to modified flow around and through the constant duct surrounding the baseline CEV.
(3) The pressure drag of the DRV was due to two components: the pressure difference across the capsule that produces an axial force on the vehicle (along+X),and the pressure difference across the duct that produces a normal force on the duct.
(4) It was observed that the higher AAR configurations performed well under all the regimes,unlike the lower AAR configurations,which showed a negative increase in drag with increasing Mach number.The general trend is that,with increasing AAR, drag contributed by the duct increases, and with increasing Mach number, drag increases up to Ma=1.2, after which the pressure difference across the capsule is compromised, leading to the observed decrease in drag.
Hence, it is aerodynamically possible to modify the drag and ballistic coefficient at any point of the trajectory in a DRV by varying the AAR.
Acknowledgement
This work was supported by Research and Modernization Fund, SASTRA University (No. R&M/0035/SoME-008/2015-17).
 CHINESE JOURNAL OF AERONAUTICS2020年7期
- CHINESE JOURNAL OF AERONAUTICS的其它文章
- An experimental method for squealer tip flow field considering relative casing motion
- A novel none once per revolution blade tip timing based blade vibration parameters identification method
- Highly efficient computation method for hazard quantification of uncontained rotor failure
- Optimal motion cueing algorithm for accelerating phase of manned spacecraft in human centrifuge
- Effective control allocation using hierarchical multi-objective optimization for multi-phase flight
- Fault-tolerant control and vibration suppression of flexible spacecraft: An interconnected system approach
