Unsteady experimental and numerical investigation of aerodynamic performance in ultra-high-lift LPT
Xiao QU, Yanfeng ZHANG,*, Xingen LU, Junqiang ZHU
a Key Laboratory of Light-Duty Gas-Turbine, Institute of Engineering Thermophysics, Chinese Academy of Sciences, Beijing 100190, China
b University of Chinese Academy of Sciences, Beijing 100190, China
KEYWORDS Experimental investigation;Low pressure turbine;Periodic wake;Secondary flow;Ultra-High-lift
Abstract Detailed experimental and numerical investigations were performed for an ultra-high-lift front-loaded low-pressure turbine cascade(Zw=1.58)with periodic wakes.The interaction mechanisms between the incoming wakes and endwall secondary flow were carefully examined. Wakes were produced by moving upstream rods, and flow field downstream of the cascade was measured using a seven-hole probe.Experimental results revealed that incoming wakes influenced not only the boundary layer development of the blade suction surface but also the complex endwall secondary vortex structures. On the suction surface: Incoming wakes clearly suppressed the suction side separation bubble at a low Reynolds number of 25000.Nevertheless,the effects of different wake passing frequencies were not significantly different at Re=100000, and the profile losses under wake passing were even greater than in the absence of wakes. At the endwalls: Incoming wakes more strongly suppressed secondary flow at Re=100000 than at Re=25000, because the lowmomentum fluid inside the incoming wakes clearly increased the endwall cross-passage pressure gradient at Re=25000. The experimental results indicated that periodic wakes decreased the passage vortex and counter vortex core strength by 25% and 30%, respectively, at Re=100000.Instantaneous results also demonstrated that endwall secondary vortices decreased significantly near the position of wakes passing.
1. Introduction
A Low-Pressure Turbine(LPT)typically accounts for approximately 30% of the total weight of the engine.1An appropriately designed high-lift blade can reduce the number of blades or stages in an LPT, thereby decreasing the overall weight of the engine.2,3However, increasing the blade loading may cause separation within the blade boundary layer and increased endwall secondary flow,resulting in a sharp increase in the profile and secondary losses. The Reynolds number of an LPT decreases under high-altitude cruising conditions and can be as low as 3×10⁴-5×10⁴, which is considerably less than the critical Reynolds number.4The boundary layer on the blade surface is largely laminar under such low Reynolds numbers, and separation bubbles on the blade suction side may or may not undergo reattachment.This severely decreases the aerodynamic performance of the LPT and greatly limits the application of high-load blades.
Low Reynolds number and high blade loading are two of the most challenging problems in the design of LPTs. Hodson and Howell5found ‘‘calming effects” in the study of wakeboundary layer interaction, and showed that the incoming wakes suppressed the blade surface boundary layer separation.This technology was successfully applied to design lowpressure turbines for BR710 and TRENT engines,The Zweifel coefficient (Zw) of the low-pressure turbine blades was increased by 20%, the number of blades was significantly reduced, and the weight of the low-pressure turbines was reduced by 38%.6
It is crucial to clarify the unsteady physical mechanisms in high-load LPTs to adequately control the internal flow loss of high-lift LPTs by using the unsteady wakes. Hourmouziadis7reported the occurrence of laminar separation bubbles on the blade suction side of high-lift LPTs at low Reynolds numbers,because of the high reverse pressure gradient, and first proposed that the key to LPT design is to control the flow separation and transition of the blade suction side under a real unsteady aerodynamic environment. Hodson and Dawes8found that the wake-boundary layer interaction in an LPT decreased the profile losses by suppressing the suction surface separation bubble.These findings have also been confirmed by Brunner et al.9, Zhang et al.,10and Volino11in both experimental and numerical studies.
Furthermore, the incoming wake not only affects the boundary layer development at the blade surface but also influences the secondary flow structures.12,13Highly complex and three-dimensional flow separation occurs at the endwalls.The corner vortex, counter vortex, and passage vortex are the major sources of secondary losses in LPTs.The size of the passage vortex and the secondary losses are affected by numerous factors, such as the aspect ratio, roughness, and incoming boundary layer thickness.14The relative motion between the rotor and stator results in unsteady flow in turbomachinery,and incoming wakes are considered one of the most important unsteady mechanisms in axial turbines.15Consequently, a growing number of researchers have started to pay attention to the influence of incoming wakes on secondary flow.16Qu et al.17demonstrated that unsteady wakes simultaneously exert both positive and negative effects on endwall secondary flow,but the Zweifel coefficient of computational LPT cascade was 1.08. With the increase of blade loading, particularly for ultra-high-lift LPT (Zw >1.4), the separation bubble on blade Suction Surface(SS)and the cross-passage pressure gradient is enhanced significantly,so the evolution mechanism of endwall secondary flow under unsteady condition is more complex,the interaction between separation bubble and endwall secondary flow was unknown under incoming wakes passing. Schneider et al.18examined the endwall flow inside a two-stage LPT at a low Reynolds number and found that the secondary flow field inside the rotor passage was strongly affected by unsteady interactions from the upstream guide vane; the structures of the secondary vortices inside the rotor passage were quite different from the classical secondary flow field known from steady LPT cascades. Qi et al.19studied the development of endwall secondary velocities under the influence of upstream wakes, and reported that the passage vortex and the Pressure Surface(PS)leg of the horseshoe vortex were suppressed under unsteady conditions with wakes. Ciorciari et al.20demonstrated that the upstream wakes generated by moving bars result in periodic suppression of the strength of the secondary vortices under various flux coefficients and passing frequencies.
Compared to a high-lift LPT cascade(Zw=1.08)of previous investigation,17stronger endwall secondary flow and local adverse pressure gradients occur for ultra-high-lift frontloaded airfoils,and the endwall flow field is extremely complex under unsteady conditions. The detailed unsteady physics of the influence of incoming wakes on endwall secondary flow in ultra-high-lift LPTs have yet to be fully elucidated, particularly under low Reynolds numbers. In the present study,detailed experimental and computational investigations were conducted using an ultra-high-lift front-loaded airfoil as the study object (Zw=1.58). Particular emphasis was placed on the effect of incoming wakes on endwall secondary vortex structures.
2. Experimental and numerical approaches
2.1. Test rig and instrumentation
The unsteady experiment was conducted in a low-speed turbine cascade wind tunnel at ambient temperature. A crosssectional view of the low-speed wind tunnel is presented in Fig. 1. The wind tunnel consisted of five parts: the centrifugal fan,divergent section,settling section,contraction section,and unsteady test section (Fig. 2). The speed of the centrifugal fan was controlled using a CONVO inverter, and the adjusting accuracy was 0.36 r/min. A pitot probe was installed at the inlet of the cascade to measure the total pressure, velocity,and inlet boundary layer distribution. The maximum fluctuation amplitudes of the inlet deviation angle,dynamic pressure,and static pressure were less than 1%, 5%, and 4%, respectively, of the average values. The blade pressure distribution was measured using a static pressure tap around the airfoil.A seven-hole probe was installed on a traverse mechanism driven by a stepping motor and was controlled by LabVIEW data acquisition procedures.The error range for the pitot probe and seven-hole probe was ±1%, and the accuracy of the stepping motor was ±0.1 Hz. The data from pressure probes is collected by Pressure Systems Incorporated (PSI). The type of PSI is 9116-0106011300, and the error was less than ±1 Pa in the present measurements. The flow field downstream of the cascade was measured by a seven-hole probe. The experimental measuring area downstream of the cascade was 100×120 mm2, and the number of measurement points was 42×28.Moving cylindrical rods ahead of the stationary blade were used to produce incoming wakes, because blades and cylindrical bars generate similar wake structures.21-23The total pressure downstream of the bars was also measured using the pitot probe (Fig. 1) to calculate the mixing losses due to the bars. To precisely evaluate the effects of the unsteady wakes on the flow field downstream of the cascade, the mixing losses due to the bars were subtracted from the total pressure losses in all cases. Table 1 summarizes the main aerodynamic and geometric parameters of the ultra-high-lift LPT cascade. A photograph of the ultra-high-lift linear LPT is presented in Fig. 3.
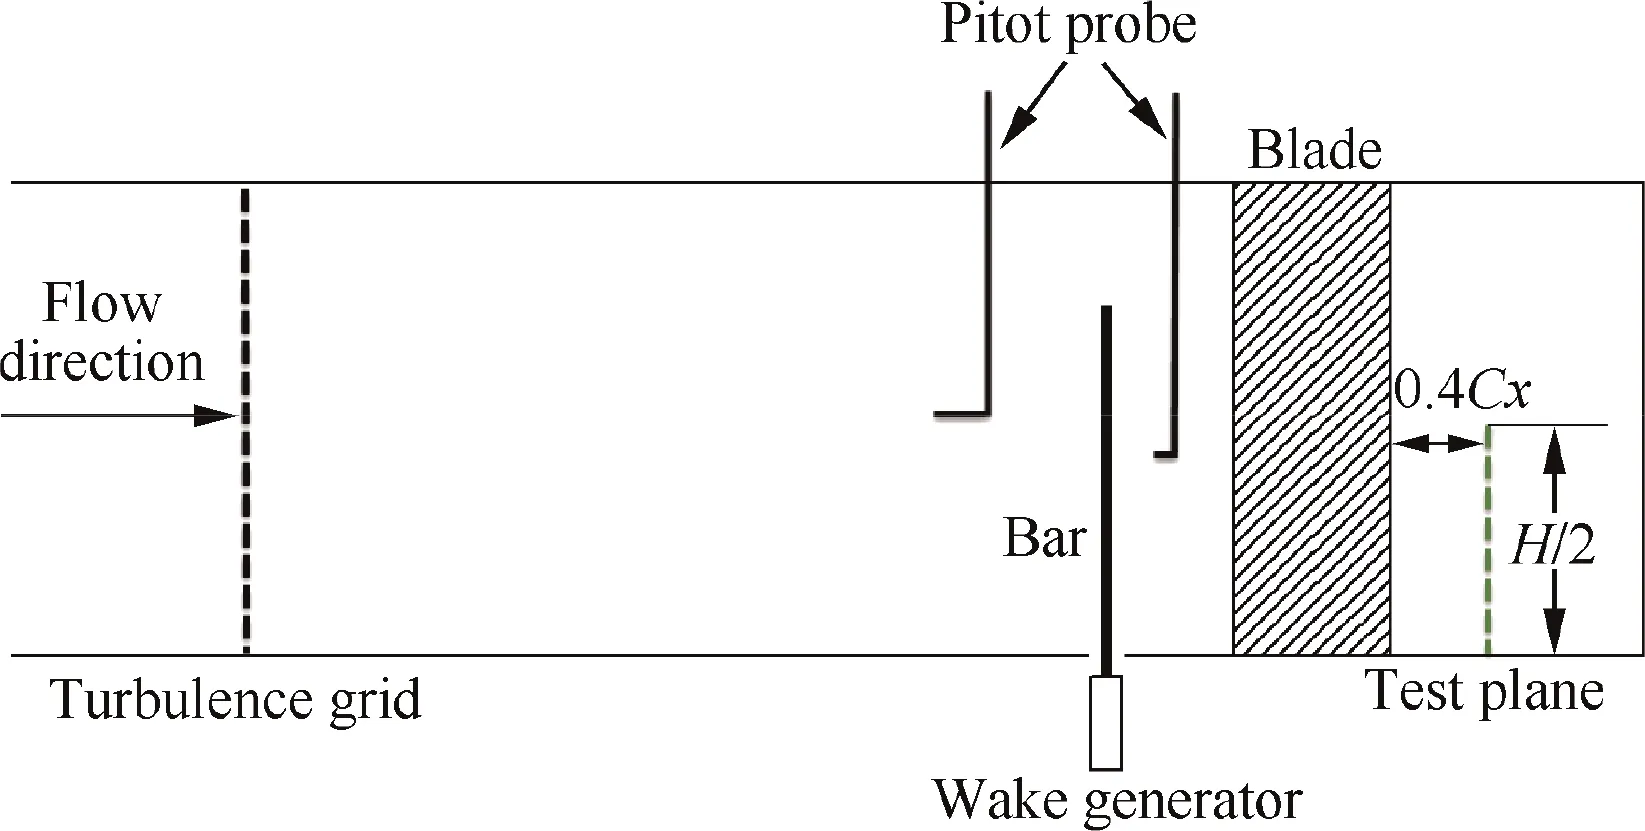
Fig. 1 Cross-sectional view of low-speed linear turbine cascade wind tunnel.
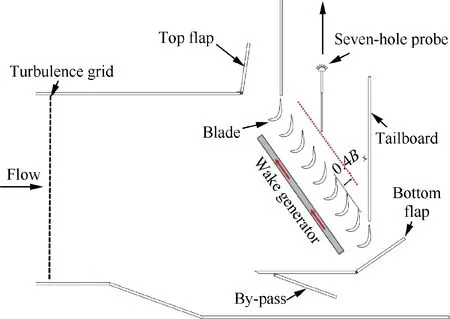
Fig. 2 Unsteady linear cascade test section.
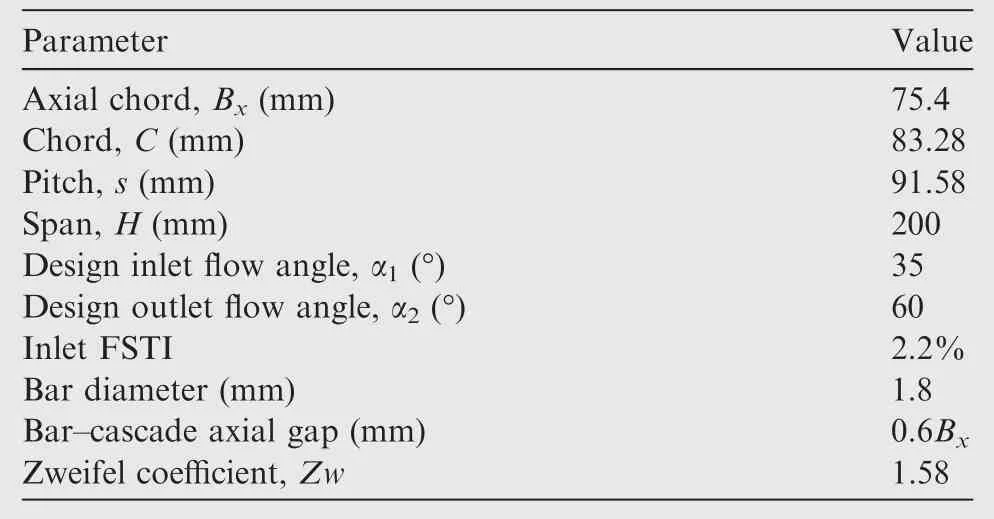
Table 1 Parameters of ultra-high-lift LPT cascade.
2.2. Data processing
The static pressure coefficient is defined as

where po,iand ps,iare the inlet total pressure and static pressure,respectively,and ps,locis the blade surface static pressure.The total pressure loss coefficient is defined as
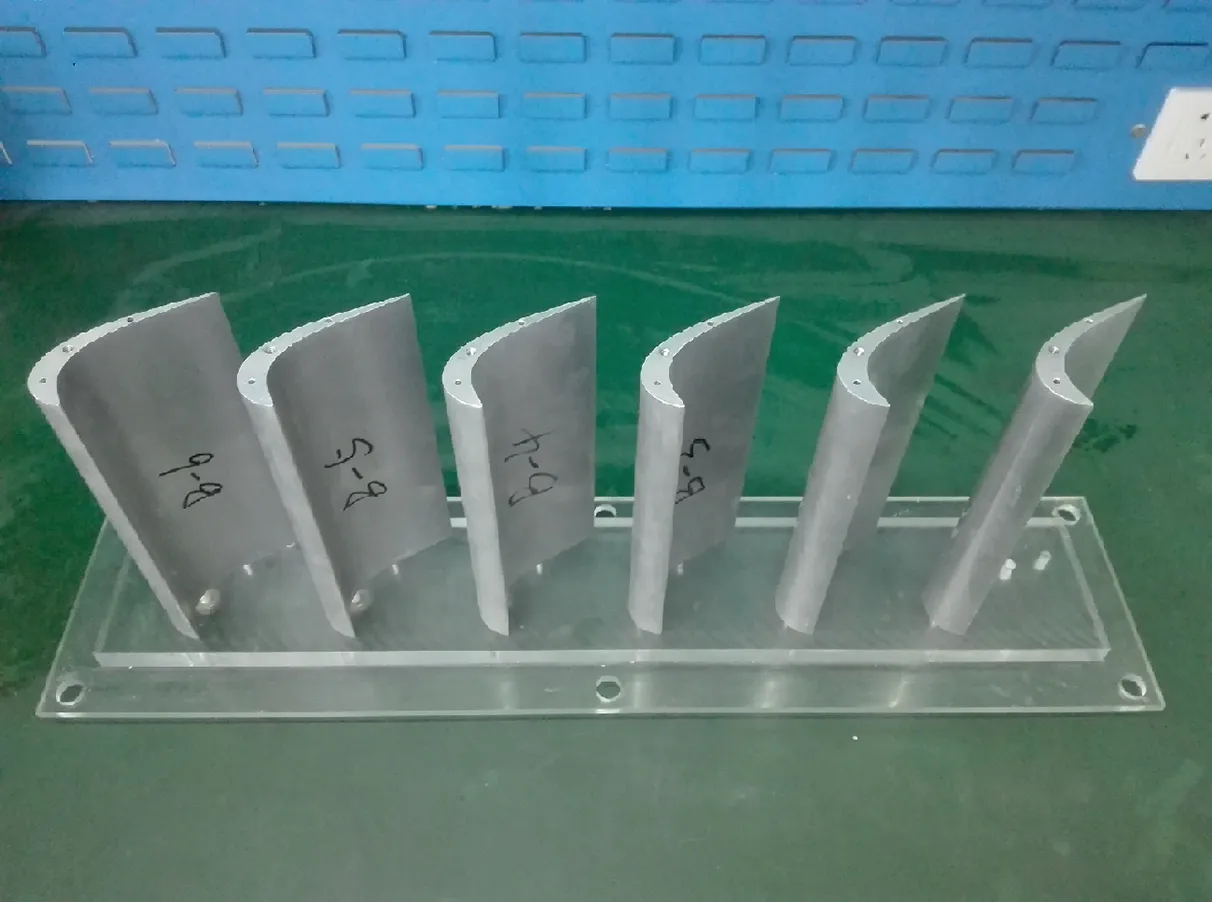
Fig. 3 Photograph of linear turbine cascade row.

where po,eis the exit total pressure.
The Secondary Kinetic Energy (SKE) is an important parameter for evaluating the degree of secondary losses.24It can be considered as the source of secondary losses in the cascade passage. The SKE is defined as

where u, v and w are the velocity components in the axial,pitchwise, and spanwise directions, respectively. vSECand wSECare the secondary (SEC) velocity. α is the massaveraged exit flow angle in a plane. The non-dimensional secondary kinetic energy is defined as

where Uin,stis the velocity at the inlet midspan.
2.3. Numerical method
The standard numerical solver ANSYS CFX 13.0 was used to calculate the flow in the turbine cascade.A two-equation Shear Stress Transport (SST) turbulence model was adopted to achieve the closure of the Reynolds-averaged Navier-Stokes equations. To accurately calculate the laminar-to-turbulent transitional flows, the ‘‘gamma-theta” transition model25-27was also adopted and coupled with the SST turbulence model.
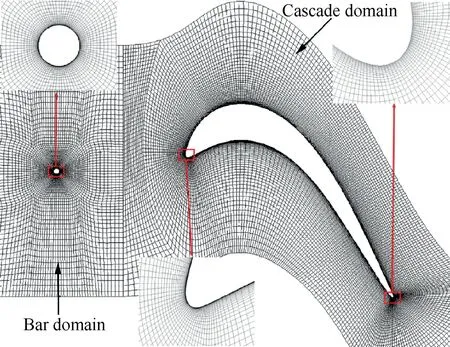
Fig. 4 Structured mesh topology for cascade passage.
To increase the calculation speed, computational domains were adopted as the half-span cascade in all computational cases. The ‘‘H-O-H” and ‘‘O” mesh topologies were used for the cascade domain and bar domain, respectively, as depicted in Fig. 4. The verification of the grid dependency is shown in Fig.5(Re=50000).The number of grid points in the streamwise direction determined the prediction accuracy for the separation bubble on the blade suction side, and the number of grid points in the spanwise direction affected the prediction accuracy for the endwall secondary vortices. Therefore, the changing trend of total pressure loss (Y) with streamwise points number is indicated in Fig.5(a),and 50000 points were adopted in the streamwise direction.The changing trend of the non-dimensional secondary kinetic energy (CSKE) with spanwise points number is calculated in Fig. 5(b), while maintaining the streamwise points number of 50000. Ultimately, 105 points were adopted in the spanwise direction, approximately 2.6 million points in total, for the stationary cascade domain.Inlet freestream turbulence, total temperature and spanwise velocity distribution are specified as inflow boundary conditions and the outlet static pressure is specified as outflow boundary condition.In the unsteady calculations,the time step of each period was 60 and the passing frequency (F) of the moving bars was approximately 1.2; the detailed calculation procedure for the passing frequency of the wakes was described previously.28To meet the requirements of the SST turbulence model, the maximum non-dimensional wall distance(y+)was less than 1 at the first node from the solid walls(blade and hub endwall).
The development of a separation bubble on the blade suction surface and endwall secondary flow structures are both strongly affected by the blade loading. As shown in Fig. 6,the cascade loading coefficient Cpwas determined using Computational Fluid Dynamics (CFD) and compared with the experimental results at the midspan under various Reynolds numbers. The predicted blade loading distributions exhibited good agreement with the experimental data.The size and position of the separation bubble were also predicted accurately at Reynolds numbers of 25000 and 100000.These results demonstrate the reliability of the numerical methods applied in this paper, even at low Reynolds numbers.
3. Results and discussion
3.1. Flow field measurement downstream of cascade
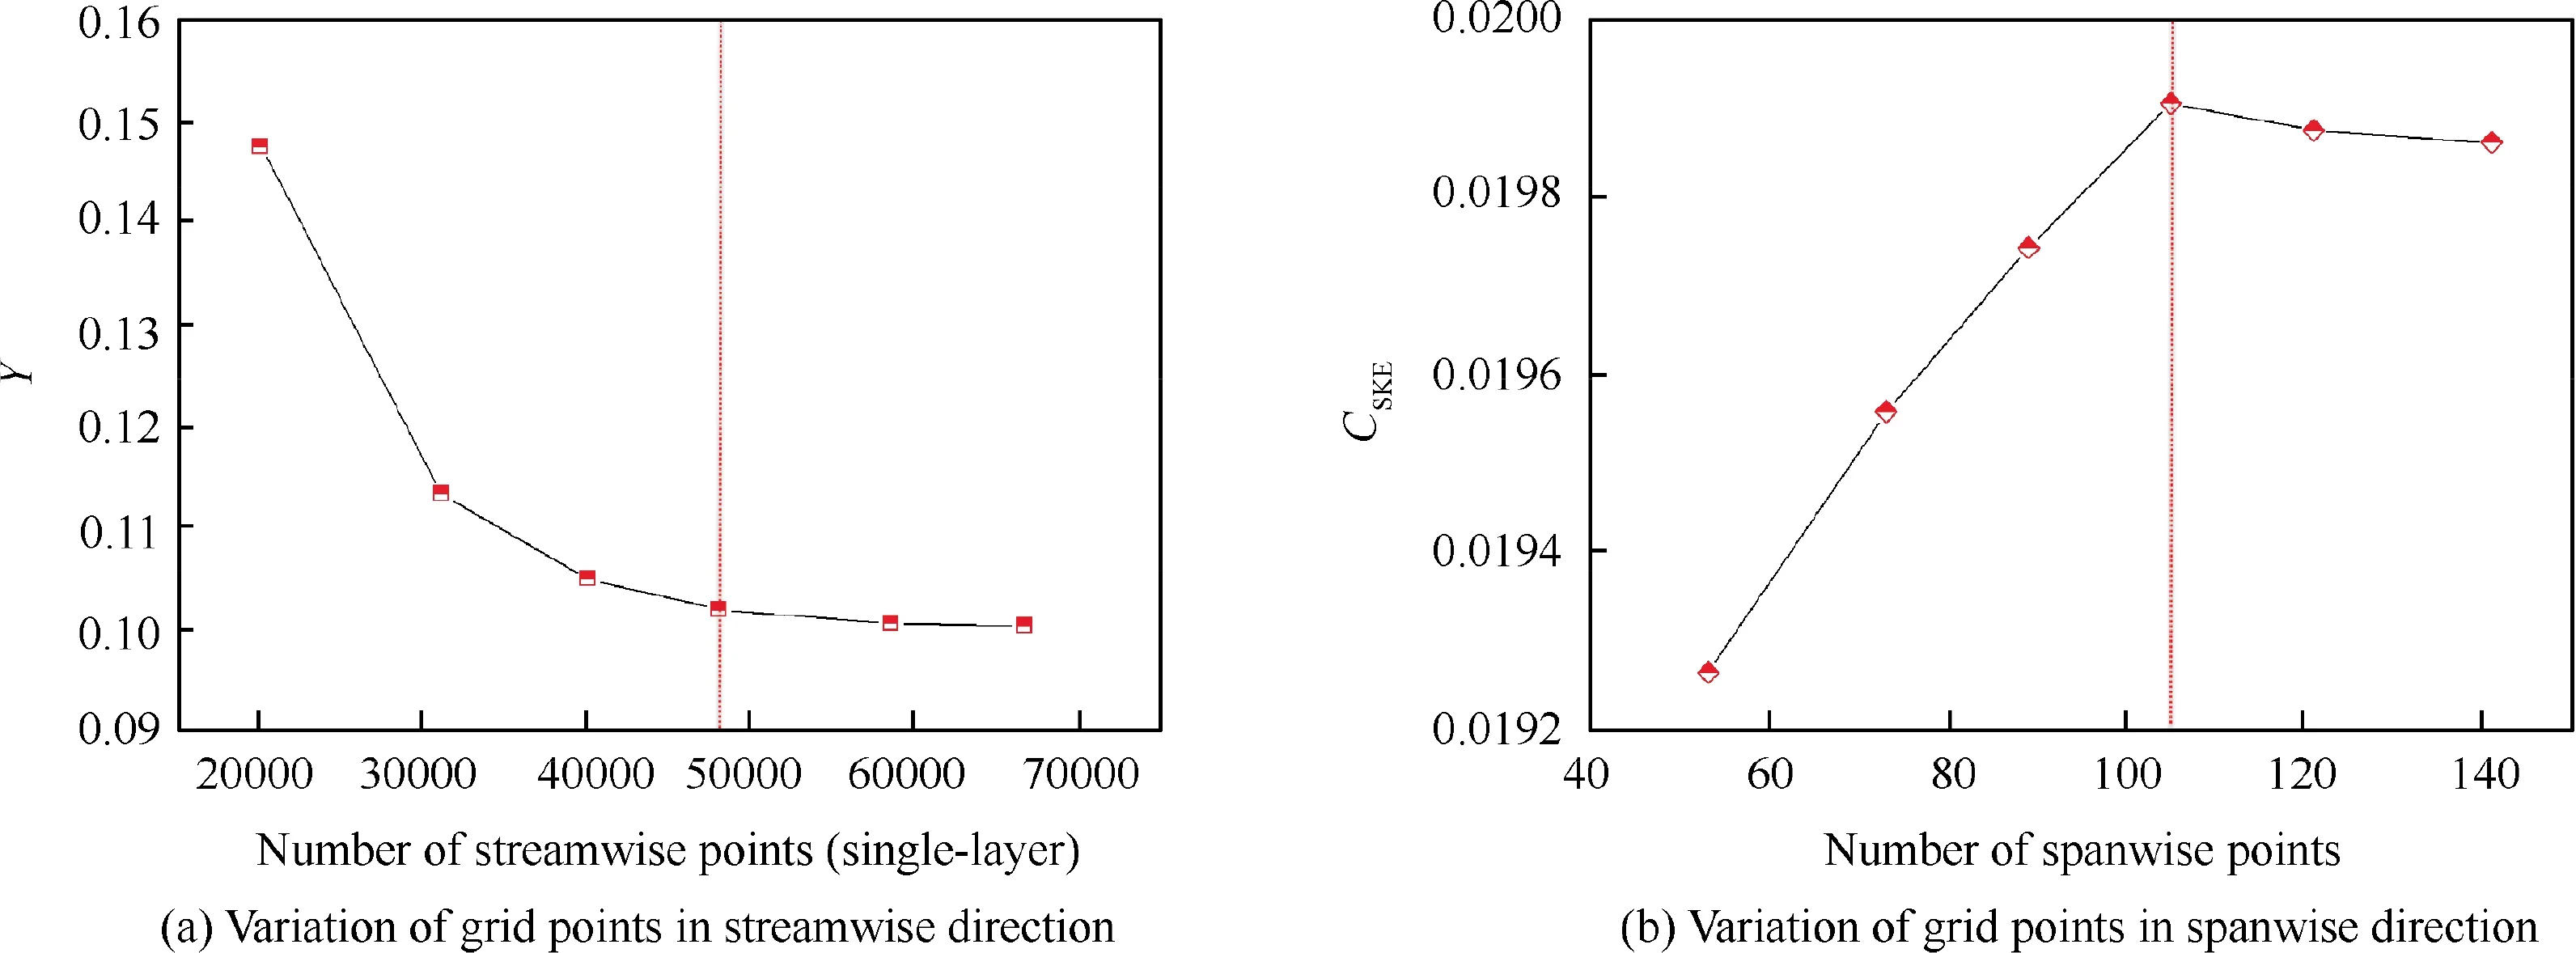
Fig. 5 Verification of grid dependency.
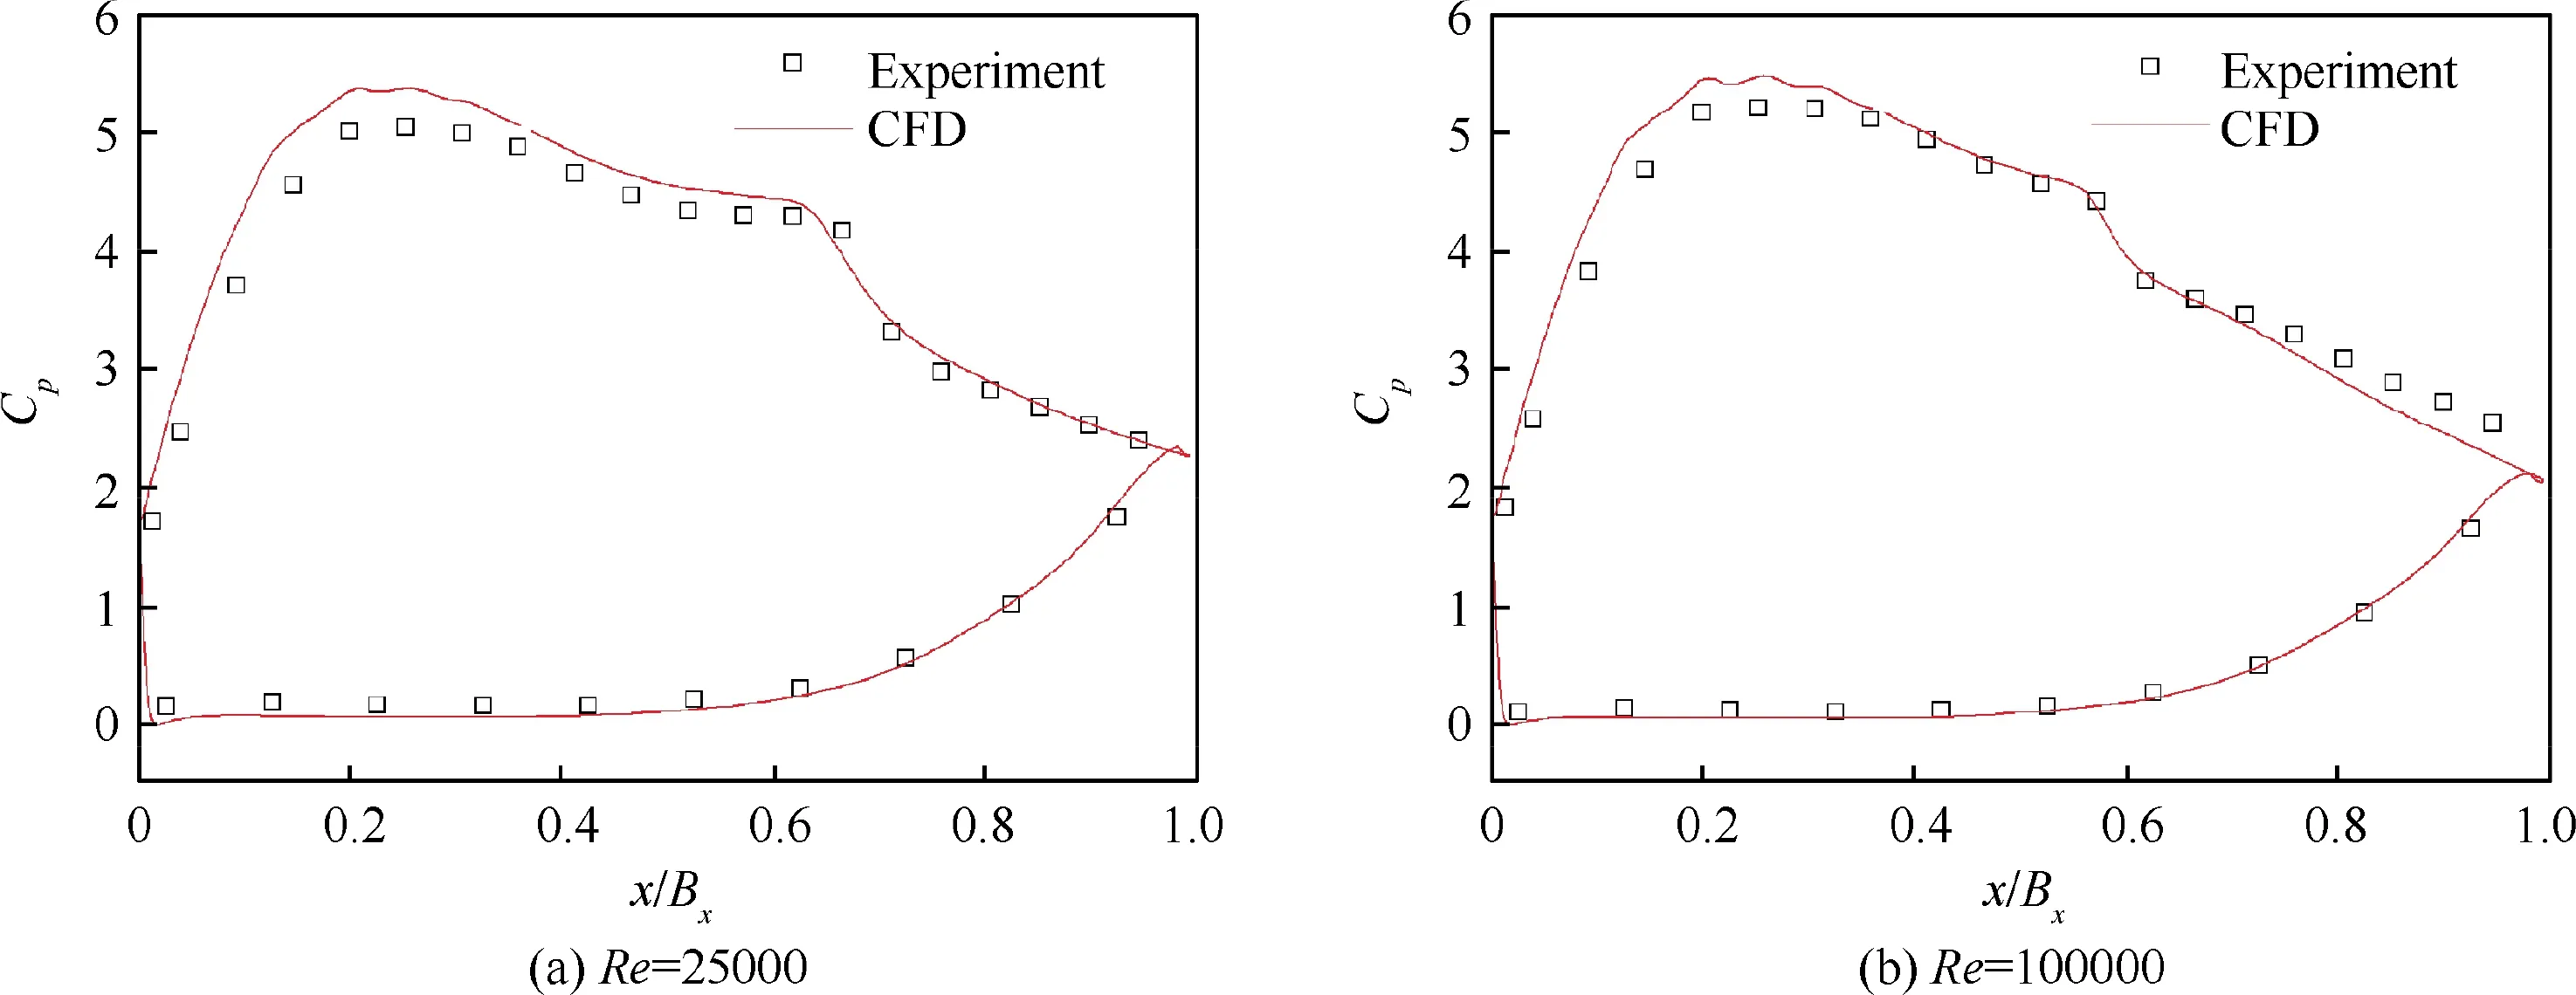
Fig. 6 Comparison of experimental and numerical static pressure coefficients on blade surface.
Endwall flow inside LPT are highly three-dimensional and complex because of various secondary vortex structures mainly including: horseshoe vortex, passage vortex, counter vortex and corner vortex. Marks et al.29and Bear et al.30gave a detailed distributions about the development process of these vortices.The influence of incoming wakes on the aerodynamic performance of the ultra-high-lift LPT cascade was investigated experimentally under low Reynolds numbers of 25000 and 100000,as presented in Fig.7.The total pressure loss coefficient was measured using the seven-hole pressure probe at 40% of axial chord (Bx) downstream of the cascade. It can be seen that the periodic wakes reduced the peak loss of the secondary flow by approximately 10% at Re=25000 and 4% at Re=100000, and the size of secondary vortex decreased significantly with increasing Reynolds number.Furthermore, upstream wakes affected not only the endwall secondary flow losses but also the profile losses near the midspan in the ultra-high-lift LPT cascade. At the low Reynolds number of 25000, incoming wakes reduced the width of the wake region downstream of the cascade. However, the width of the wake at the exit of the cascade was slightly greater at the high Reynolds number of 100000. In the following, the effects of incoming wakes on the blade suction surface boundary layer at the midspan and the endwall secondary velocities are discussed in detail,with a particular emphasis on the interaction mechanism.
3.2. Influence of upstream wakes on profile losses at midspan
To examine the effects of incoming wakes on the profile losses,the midspan position at 40%of axial chord downstream of the LPT cascade was measured for various passing frequencies,as presented in Fig. 8. The height and width of the wake regions at the cascade exit generally indicate the strength and size of the blade suction side separation bubble. At Re=25000, the upstream wakes reduced the area and height of the wake regions, which indicates that separation bubbles on the blade suction side were suppressed, and decreased the total pressure loss in the ultra-high-lift LPT cascade exit. Upon increasing the passing frequency of the incoming wakes, the size of the separation bubbles on the blade suction side further decreased.At Re=100000, the inhibitory effect of the wakes on the blade suction surface separation bubbles decreased, and no obvious differences were observed between the different passing frequencies.Unfortunately,the loss of the free-flow region and the width of the wakes were increased owing to the extra mixing loss due to the wakes. Additionally, the wake height and width at the cascade exit clearly decreased compared with the results at the lower Reynolds number,which indicates that the size of the blade suction side separation bubble was relatively small.
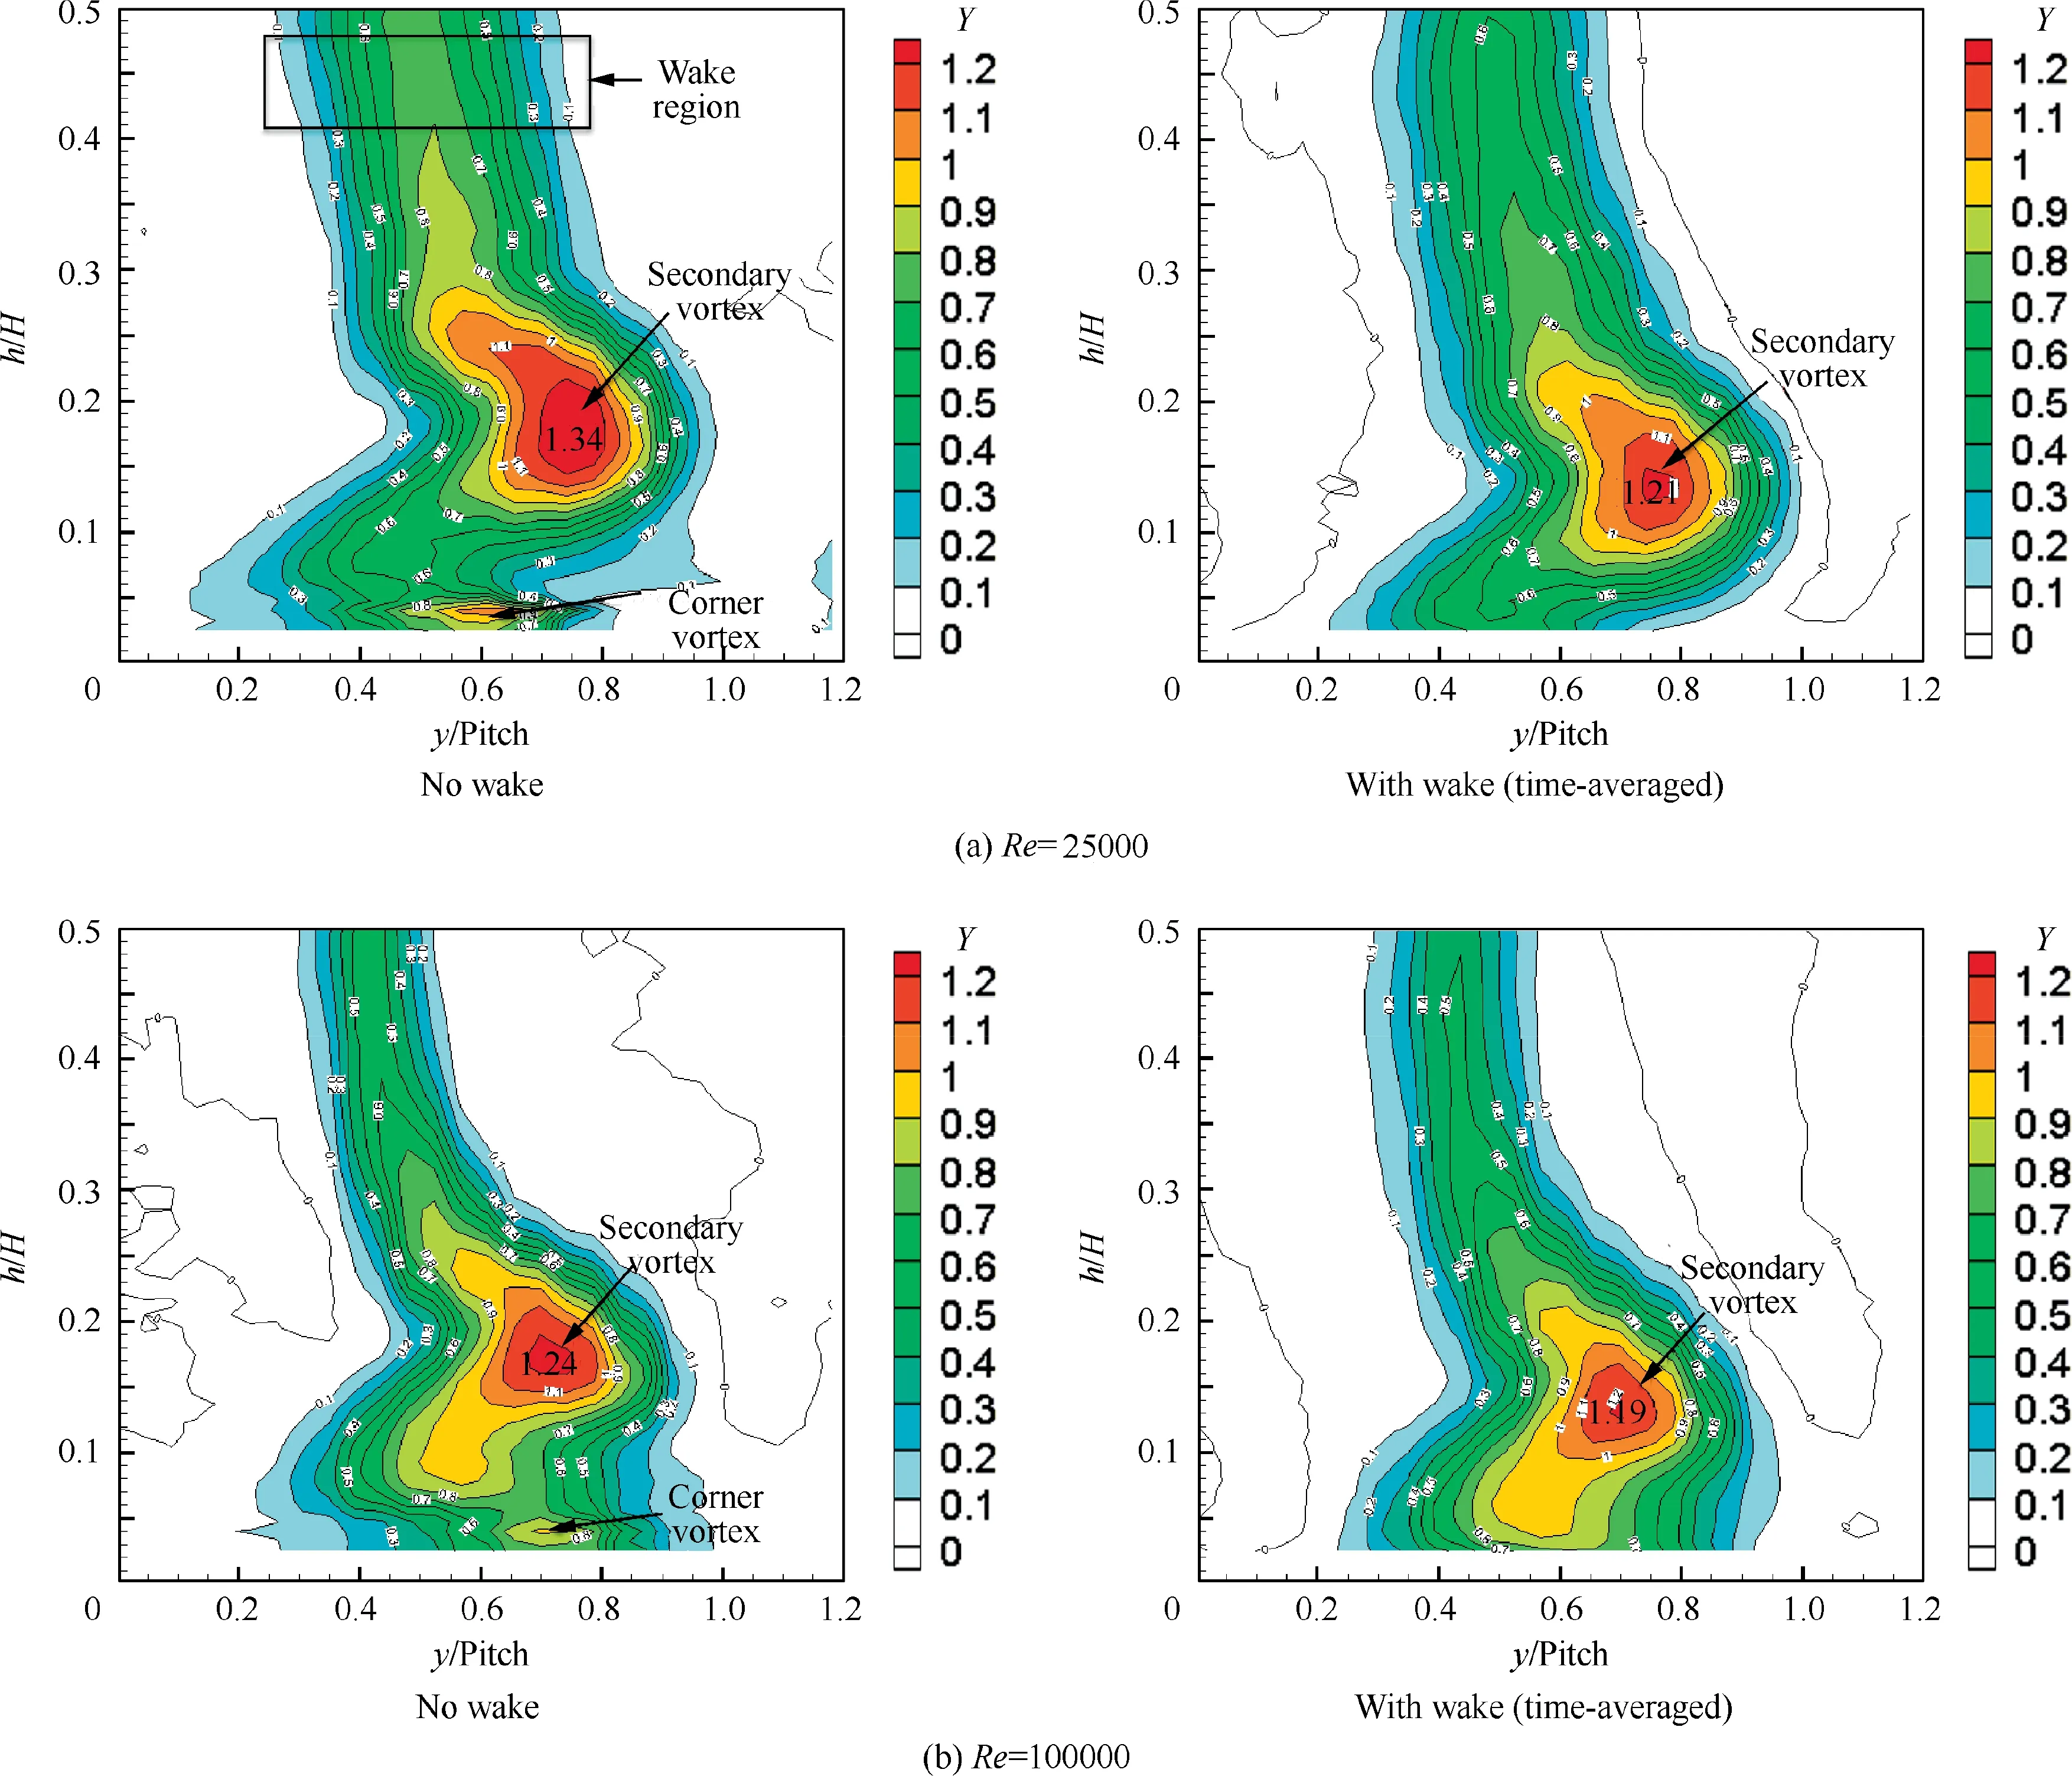
Fig. 7 Flood contour of total pressure loss coefficient downstream of cascade (experimental results).
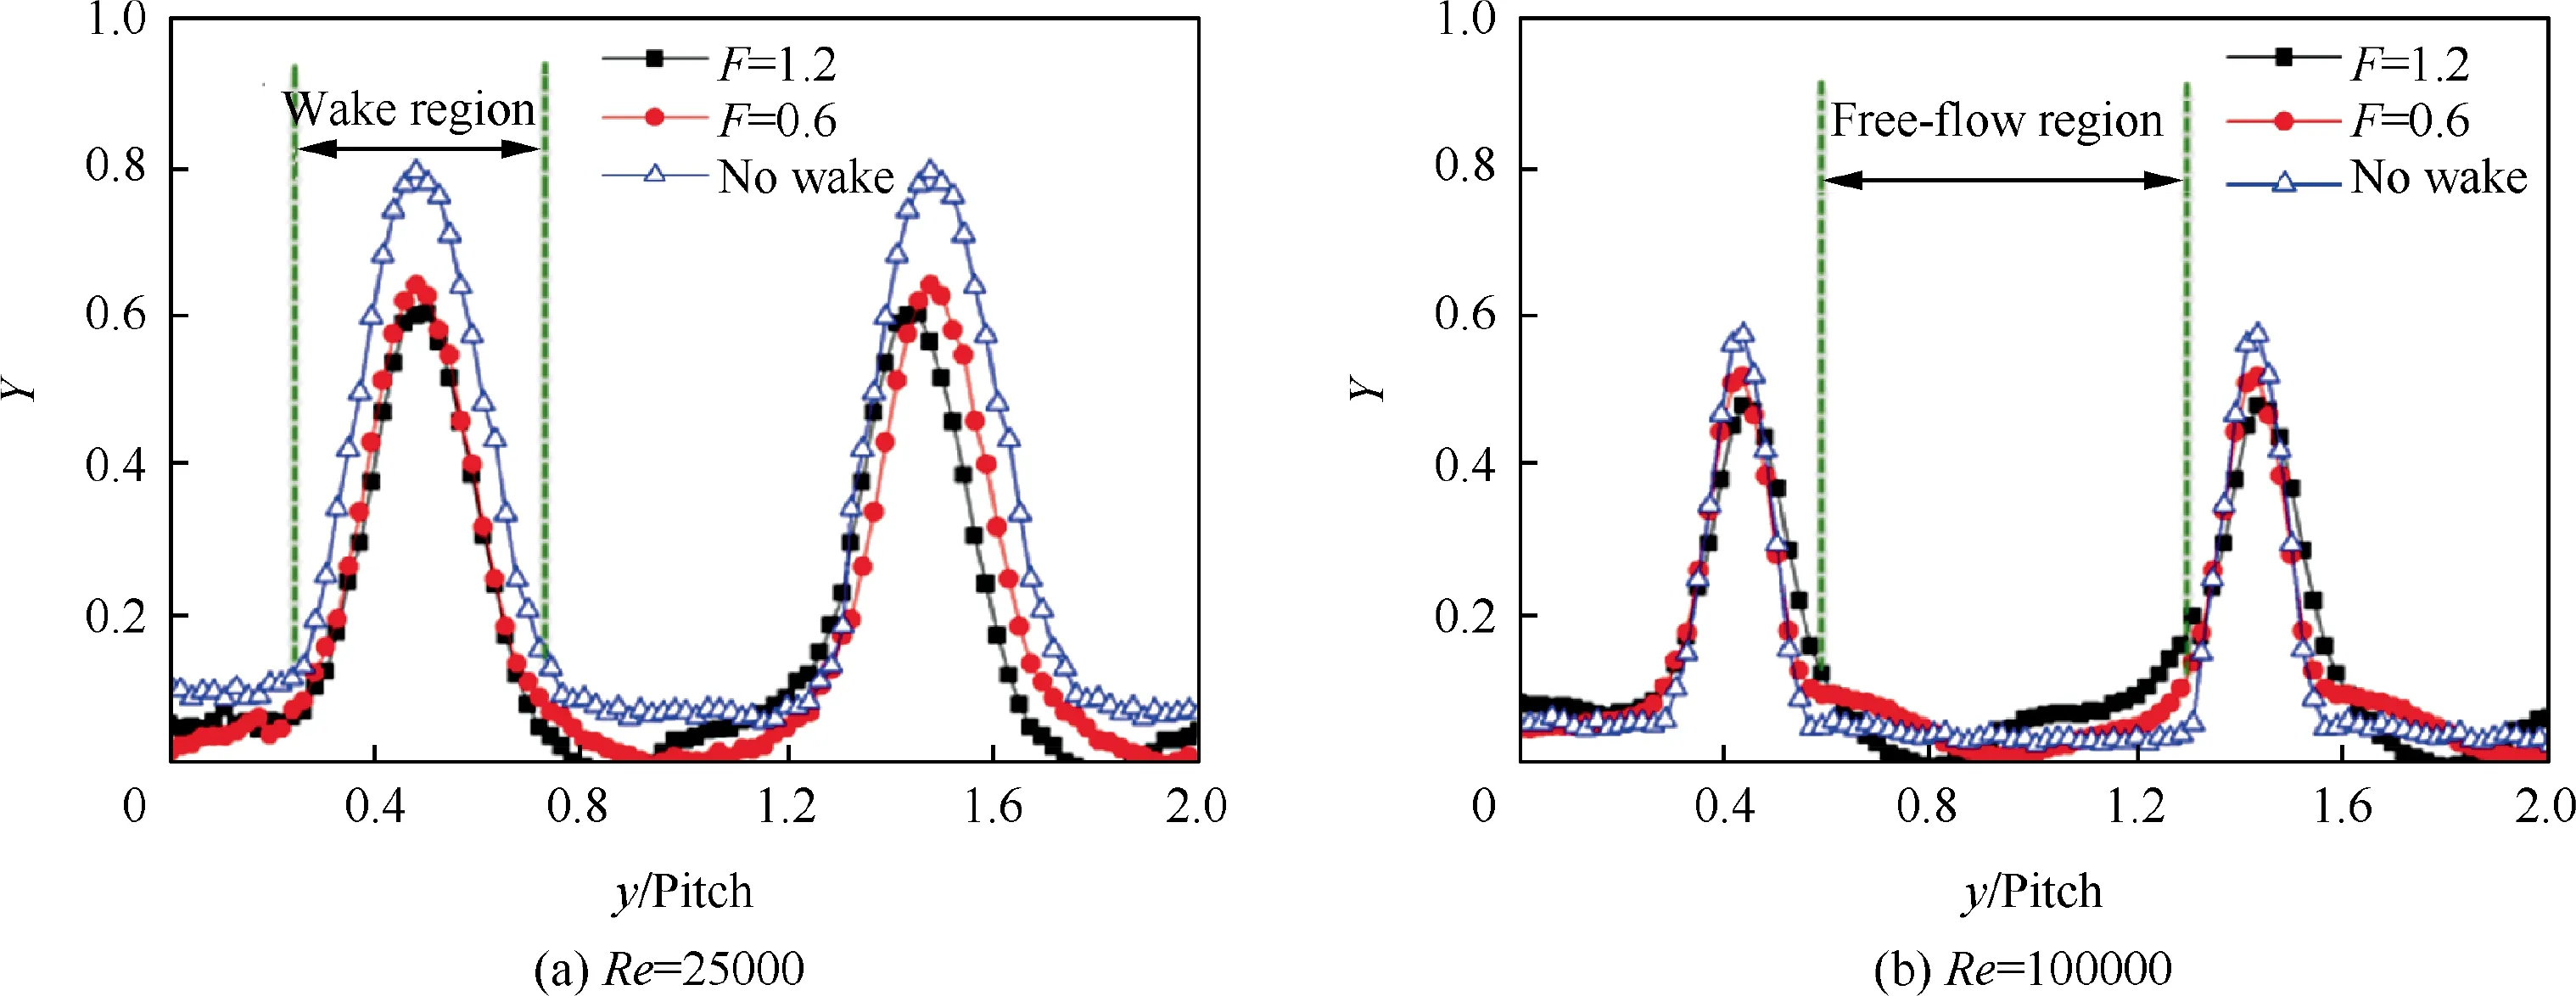
Fig. 8 Total pressure loss distributions for different passing frequencies of incoming wakes (experimental results).
To evaluate the overall effect of the incoming wakes on the aerodynamic performance at the midspan, the distribution of the profile losses downstream of the LPT cascade was measured for various passing frequencies and Reynolds numbers,as presented in Fig. 9. In the absence of wakes, the profile losses decreased with increasing Reynolds number. At Re=25000,increasing the wake passing frequency reduced the profile losses.However,the influence of the wakes became weaker with increasing Reynolds number. On the contrary, increasing the wake passing frequency increased the total pressure losses at the cascade exit.The profile losses in the presence of wakes were even greater than those in the absence of wakes at the high Reynolds number of 100000, as indicated by the ‘‘A” in Fig. 9.Based on these experimental results,upstream wakes therefore exert two distinct effects.On the one hand,periodic wakes can suppress the blade suction side separation.On the other hand,upstream wakes increase the mixing losses during cascade passage. Therefore, appropriately adjusting the wake passing frequency has the potential to substantially improve the aerodynamic performance of the ultra-high-lift LPT.
3.3. Influence of incoming wakes on secondary flow
3.3.1. Time-averaged results
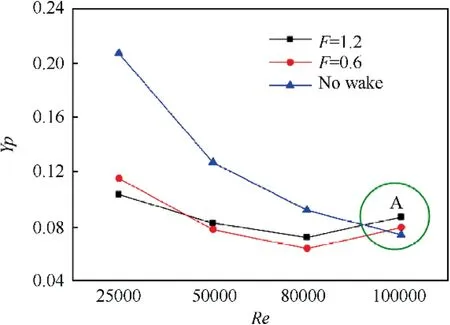
Fig. 9 Profile losses at cascade exit for various wake passing frequencies and Reynolds numbers (experimental results).
The endwall secondary vortex structures were measured at 40% of axial chord downstream of the LPT cascade. The flow fields of the Dimensionless Streamwise Vorticity (DSV)coefficient overlaid on total pressure loss coefficient are presented in Fig. 10. According to the right-hand rule, the vorticity of the Passage Vortex (PV) is positive, whereas the vorticities of the Corner Vortex (VC) and Counter Vortex(CV) are negative. Under the unsteady conditions with wakes(Re=25000), the peak values of the passage vortex and counter vortex reduced by 8.9% and 4.8%, respectively, compared with the results in the absence of wakes, whereas the corner vortex essentially disappeared, because the corner vortex moved closer to the endwall with decreasing strength and could not be detected by the pressure probe. At the high Reynolds number of 100000, the periodic wakes decreased the peak values of the passage vortex and counter vortex by 25% and 30%, respectively, compared with the results in the absence of wakes, and the size of the passage vortex,counter vortex and corner vortex was also reduced. These experimental results demonstrate that the unsteady wakes had the potential to suppress endwall secondary flow in the ultra-high-lift LPT cascade. However, an interesting phenomenon was observed that has not been reported in previous investigations: the suppressing influence of the incoming wakes on the secondary vortices gradually increased with increasing Reynolds number. The following discussion presents a numerical study of the interaction mechanisms of the unsteady wakes and endwall secondary flow.
Fig.11 presents the vortex isosurfaces using the Q-criterion and the time-averaged total pressure loss coefficient in the cascade passage. The upstream wakes clearly weakened the pressure side leg of the horseshoe vortex (Vph) at Reynolds numbers of both 25000 and 100000. The endwall boundary layer was involved into the main flow passage because of wake transport, resulting in reduced thickness, as indicated by the letters ‘‘E” and ‘‘J” in Fig. 11, which weakened the lowmomentum fluid to involved into Vph. Nevertheless, at Re=25000,more low-momentum fluid inside the suction side separation bubble was contained within the secondary flow upon passing of the wakes, compared with the results in the absence of wakes, as indicated by the letters ‘‘A” and ‘‘C”on plane 5 in Fig. 11(a), which has the potential to increase the strength of the secondary vortices. In contrast, at Re=100000, approximately the same amount of lowmomentum fluid of the blade boundary layer was contained within the secondary flow in the presence and absence of wakes, as indicated by the letters ‘‘F” and ‘‘H” on plane 5 in Fig.11(b),and the passage vortex was suppressed significantly upon passing of the wakes. Furthermore, in the presence of upstream wakes the endwall vortices were very scattered compared with the results in the absence of wakes,which indicates that incoming wakes induce additional vortex structures to interact with the secondary vortices and decrease the strength of the corner vortex, particularly at Re=25000. Fig. 10(a)also shows the similar phenomena.
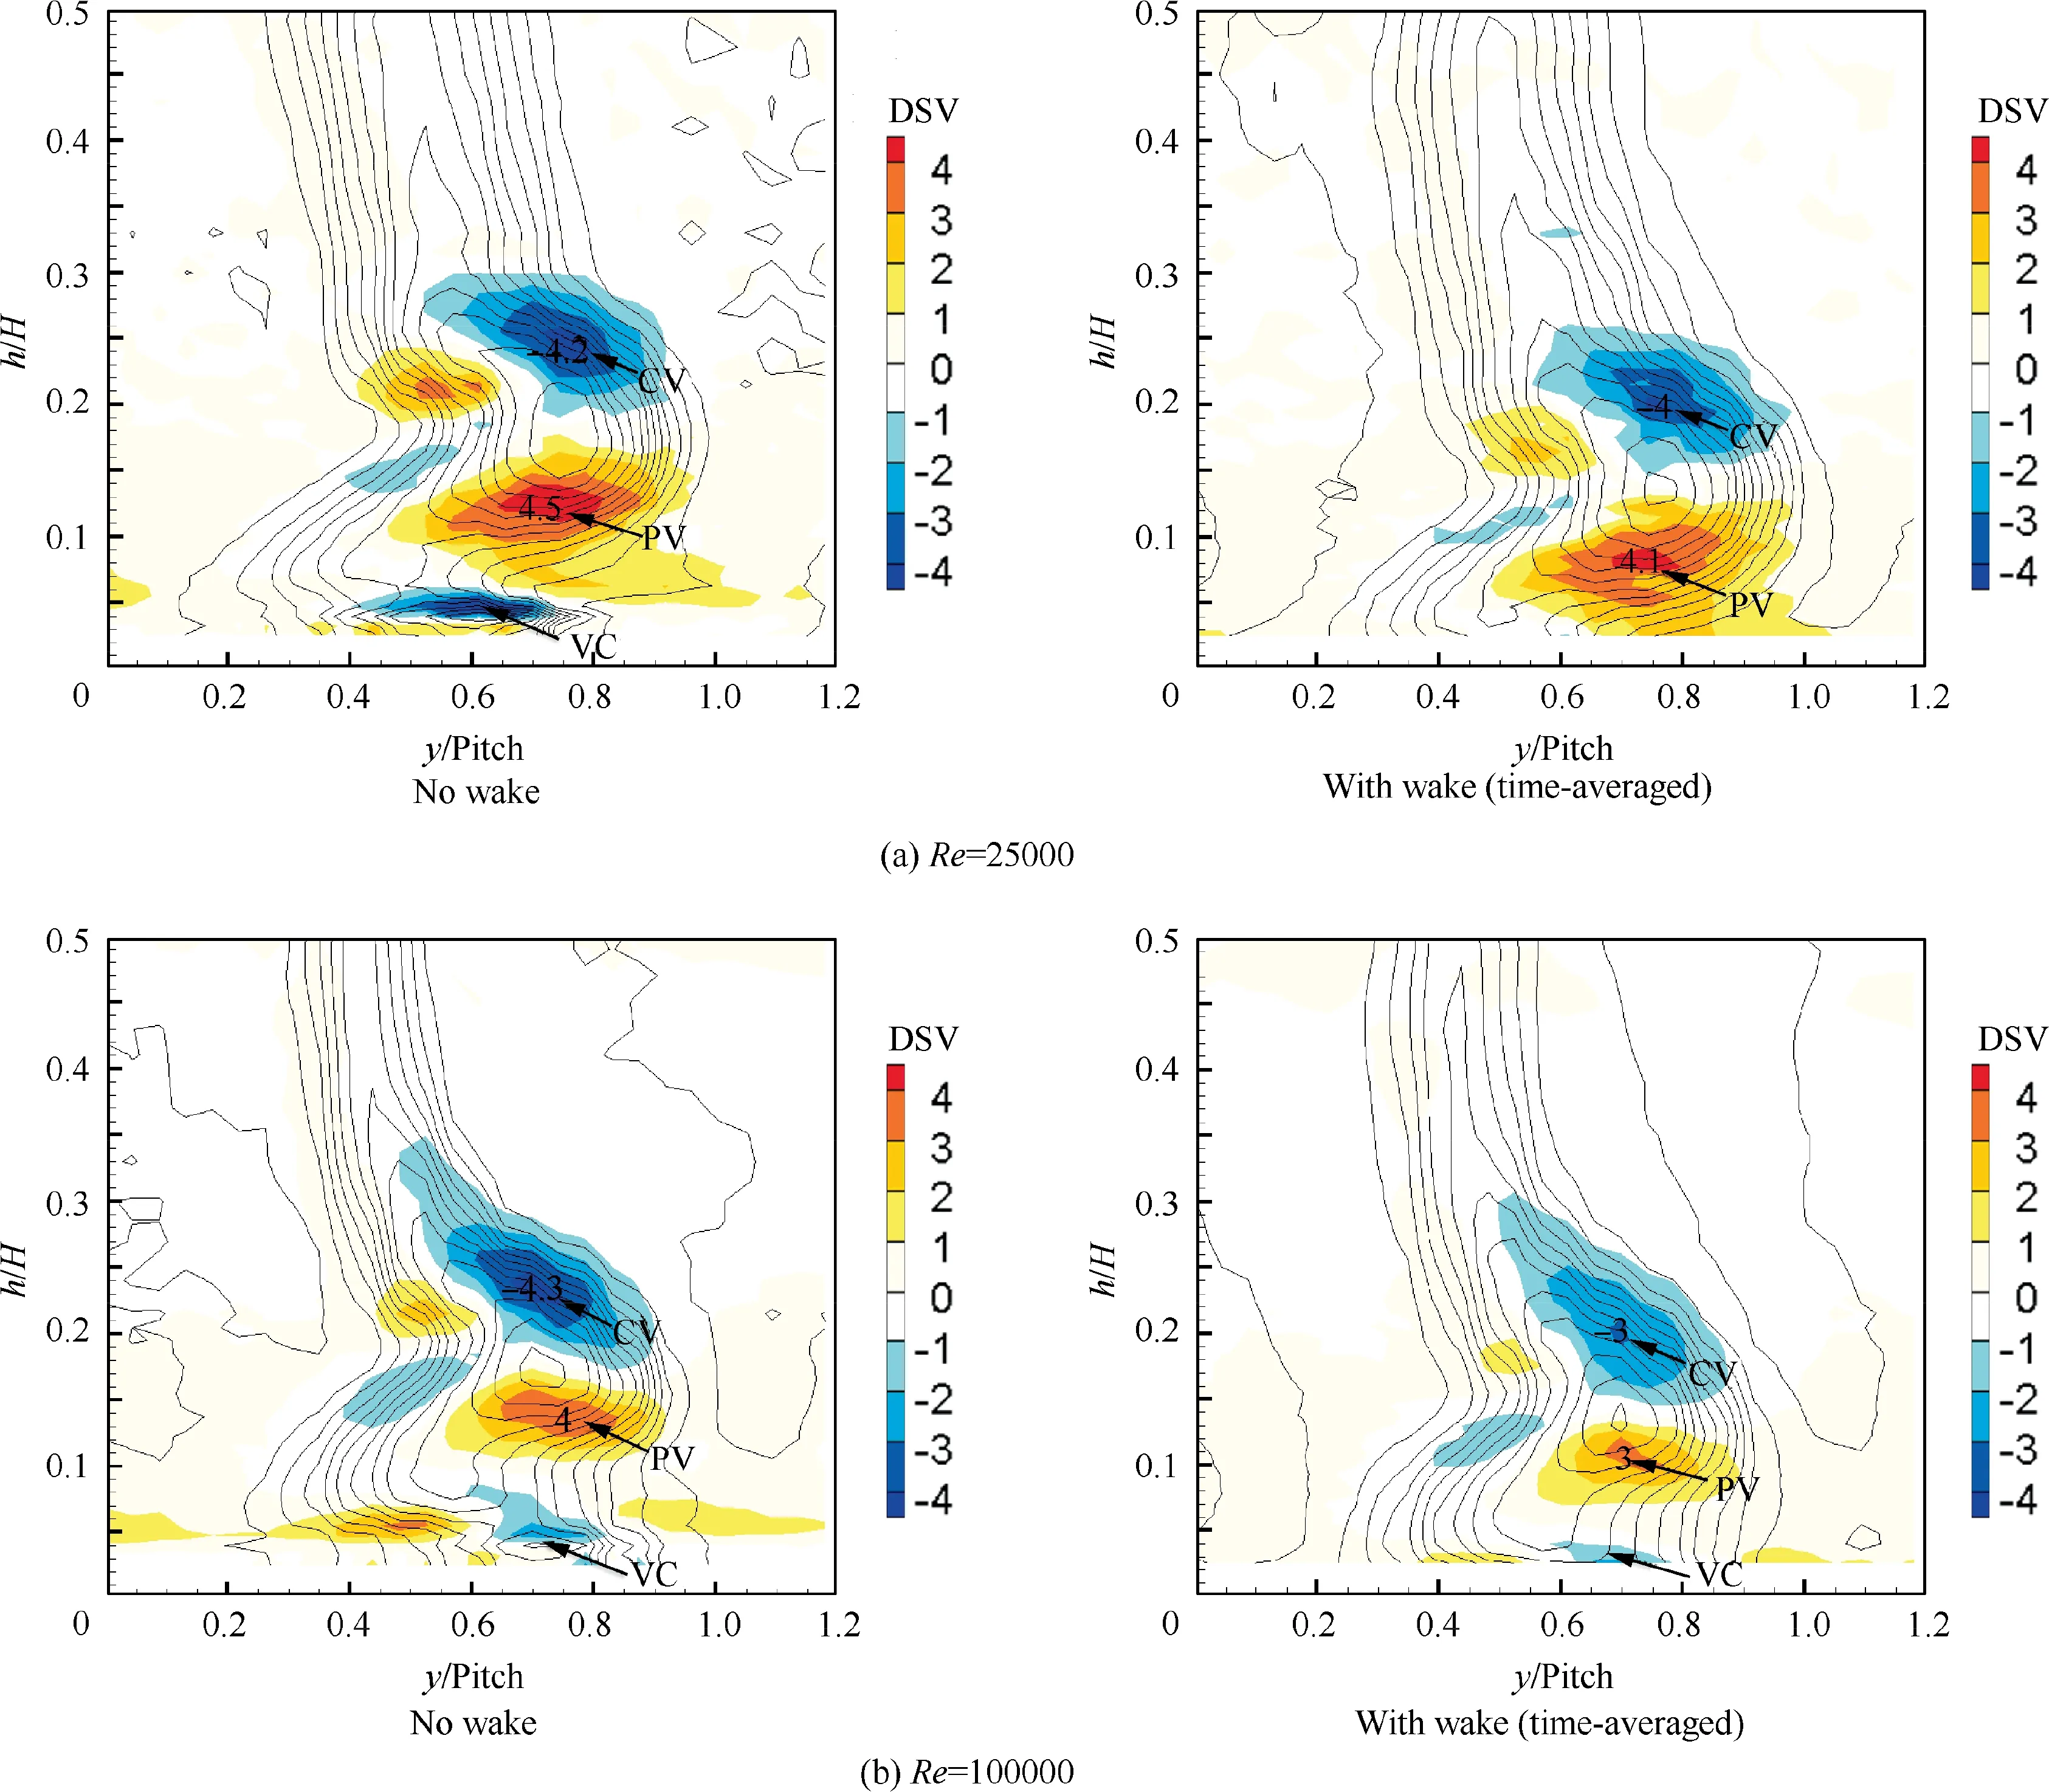
Fig. 10 Dimensionless streamwise vorticity coefficient overlaid on total pressure loss coefficient at blade exit (experimental results).
The distributions of the blade surface static pressure coefficient at 10% blade span are presented in Fig. 12. Upstream wakes reduced the pressure at the blade suction surface because of the low-momentum fluid inside the incoming wakes and also strengthened the cross-passage pressure gradient, particularly under low Reynolds numbers. These effects are not beneficial for suppressing endwall secondary flow. Additionally, a hump was observed in the Cpdistribution at Re=25000, as indicated by ‘‘I” in Fig. 12(a),because the passing of the passage vortex resulted in decreased pressure, as indicated by the letters ‘‘B” and‘‘D” in Fig. 11(a). At Re=100000, a substantially smaller hump was observed in the Cpdistribution in the absence of wakes, as indicated by ‘‘II” in Fig. 12(b), because the strength of the passage vortex clearly decreased in the presence of wakes, as indicated by the letters ‘‘G” and ‘‘I”in Fig. 11(b).
To quantitatively describe the changes in secondary flow strength inside the cascade passage, the mass-averaged SKE in various planes of the cascade passage is presented in Fig. 13. It can be seen that the strength of the secondary vortices first increased significantly and then decreased slowly in the cascade passage, because the position of maximum load is at the front part of the blade for front-loaded airfoil, and secondary vortices were gradually reduced through mixing processes after the position of approximately 0.7 Bx. In general,incoming wakes can decrease the SKE in the cascade passage, and the effect of unsteady wakes is more significant during the decreasing stage of the secondary vortices. Compared to the results for the low Reynolds number of 25000,the suppressing influence of the incoming wakes on the SKE was more readily apparent at the high Reynolds number of 100000.However,the time-averaged SKE under unsteady conditions revealed an increase near the blade trailing edge at Re=25000, as indicated by the letter ‘‘A” in Fig. 13(a).Owing to the complex interactions between the upstream wakes,suction surface separation bubble,and secondary flow,the strength of the endwall vortices increased.
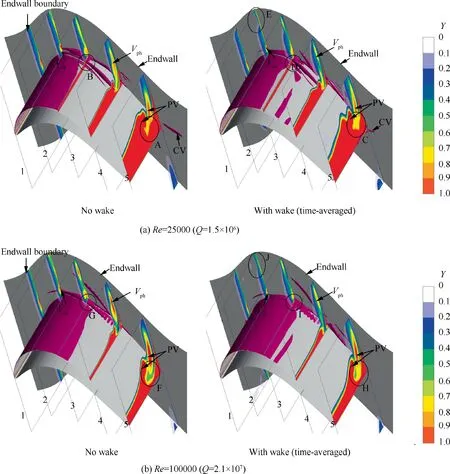
Fig. 11 Vortex isosurfaces using Q-criterion and time-averaged total pressure loss coefficient (CFD results).
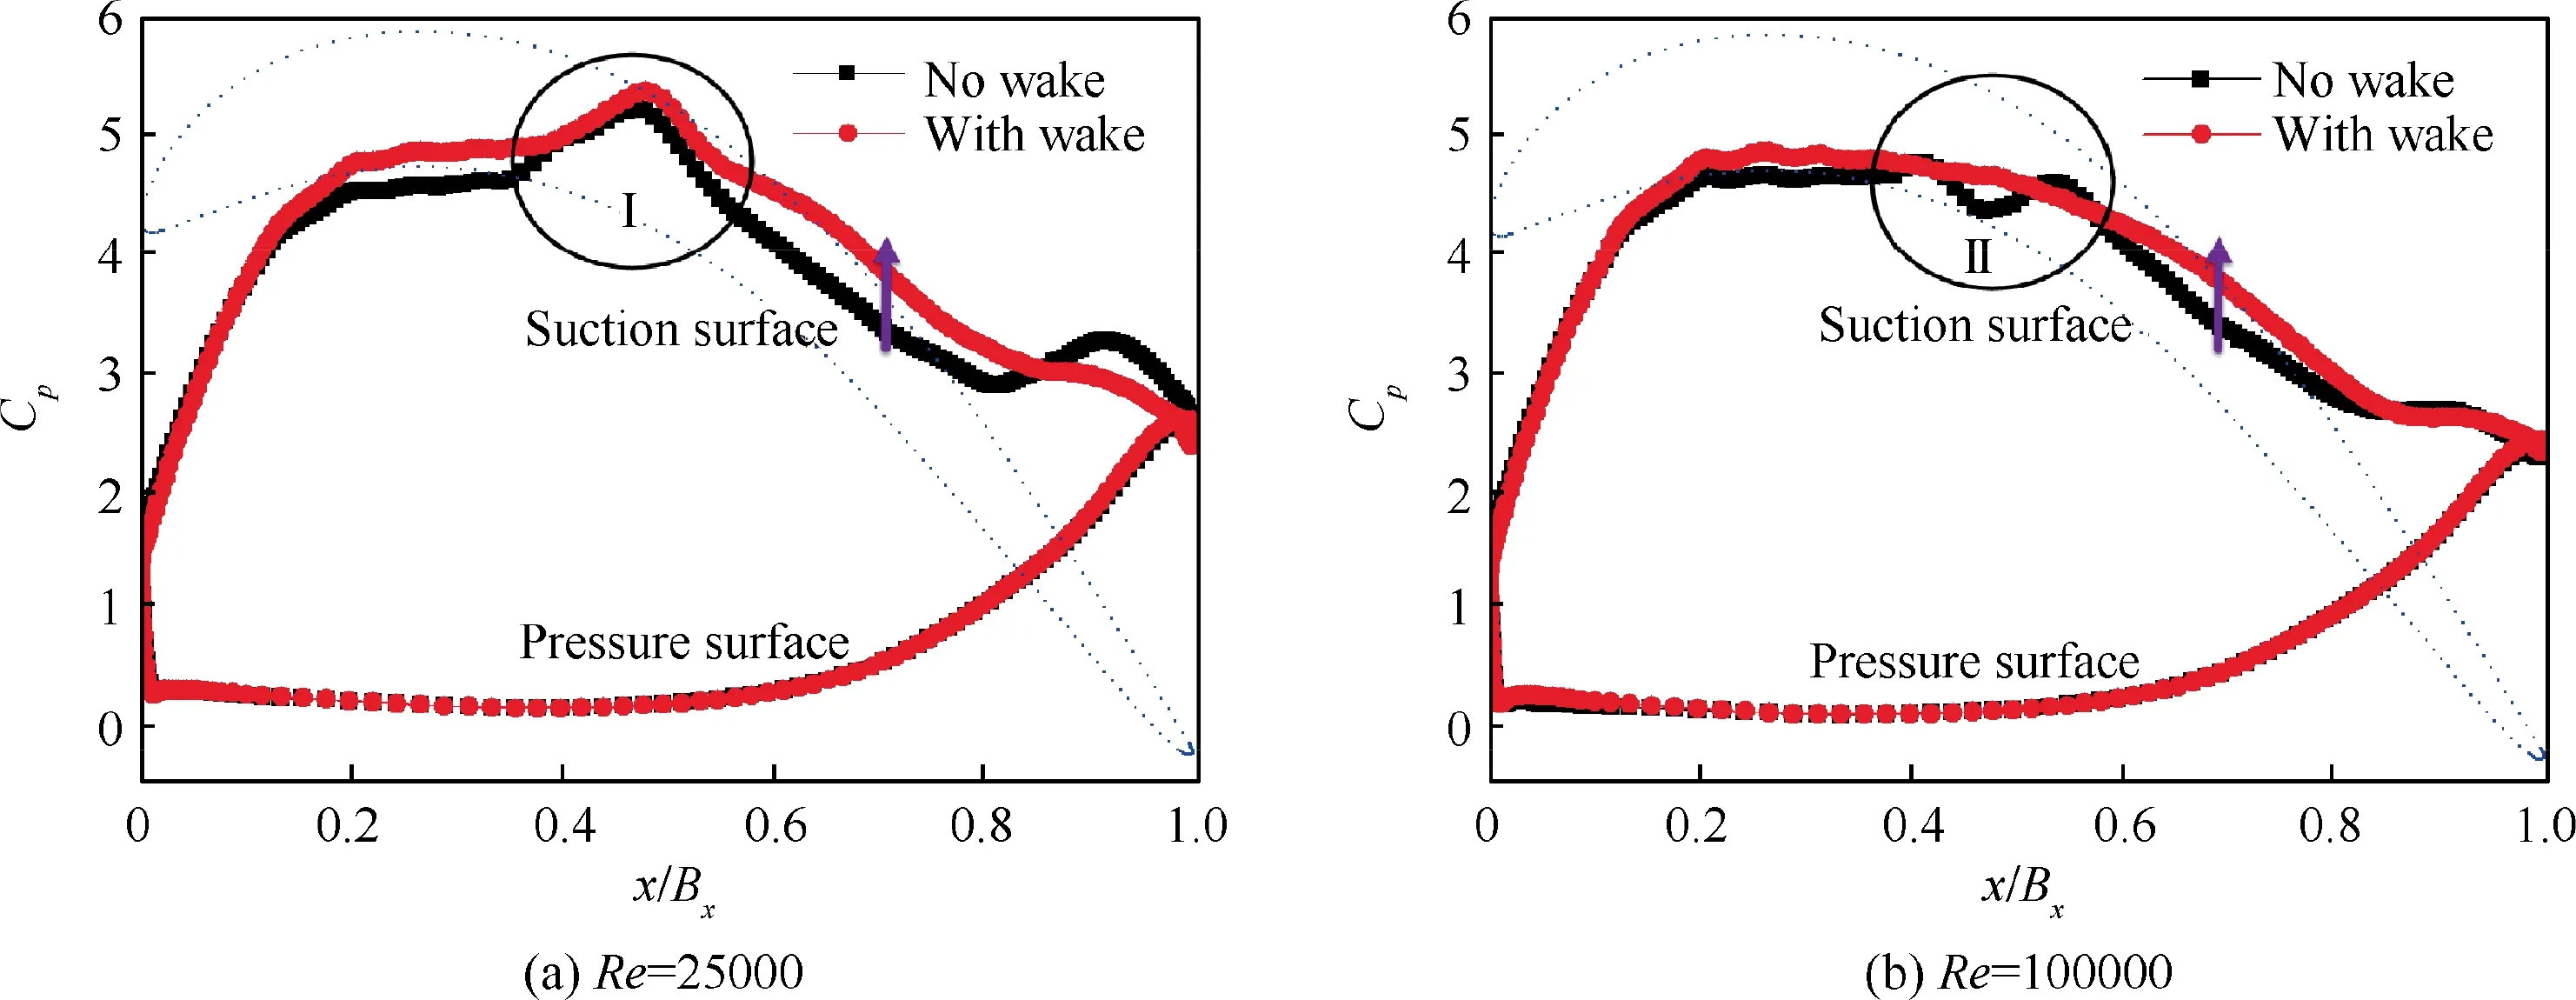
Fig. 12 Blade surface static pressure coefficient distributions near endwall (CFD results).
3.3.2. Instantaneous results

Fig. 13 Mass-averaged secondary kinetic energy in various planes of cascade passage (CFD results).
To elucidate the development of the endwall secondary vortices in the presence and absence of wakes, the instantaneous results of the three-dimensional isosurfaces using the Qcriterion are presented in Fig. 14 (Re=100000), which are useful for tracing the origins and trajectories of the endwall secondary vortices. The surfaces are colored according to the dimensionless streamwise vorticity, and the Turbulence Kinetic Energy (TKE) at the blade midspan is also shown for helping tracing positions of incoming wakes.Compared to the steady conditions with no wakes,the structures of the endwall secondary vortices exhibited obvious periodic changes under the passing of upstream wakes. At t/τ=1/3(t is time, τ is wake passing period), the first wake (wake 1) had moved to the middle of the blade and started to interact with Vphand Vsh. The pressure side leg of the horseshoe vortex appeared as a pit,as indicated by‘‘I”in Fig.14,while Vshhad essentially disappeared, as indicated by ‘‘II”. At t/τ=2/3, the upstream wake had moved to the trailing edge of the blade.The passage vortex and counter vortex had already formed after the intersection of Vphand Vsh.The sizes of the passage vortex and counter vortex decreased significantly under the passing of the wakes, as indicated by ‘‘III” and ‘‘IV”. At t/τ=1, the upstream wake had moved downstream of the blade to further interact with the passage vortex and counter vortex.The counter vortex had essentially disappeared while the passage vortex was significantly suppressed, as indicated by ‘‘V”. At this moment, the subsequent wake (wake 2) had begun to enter the cascade passage,and the passage vortex strength increased at the interval between wake 1 and wake 2, as indicated by‘‘VI”. Therefore, there exists the potential to use periodic wakes to continuously suppress the endwall secondary flow by optimizing the wake passing frequency, which will be the focus of a follow-up study. To achieve the maximum aerodynamic performance, it is crucial to optimize the balance between the profile losses, secondary flow losses, and wake mixing losses in the LPT.
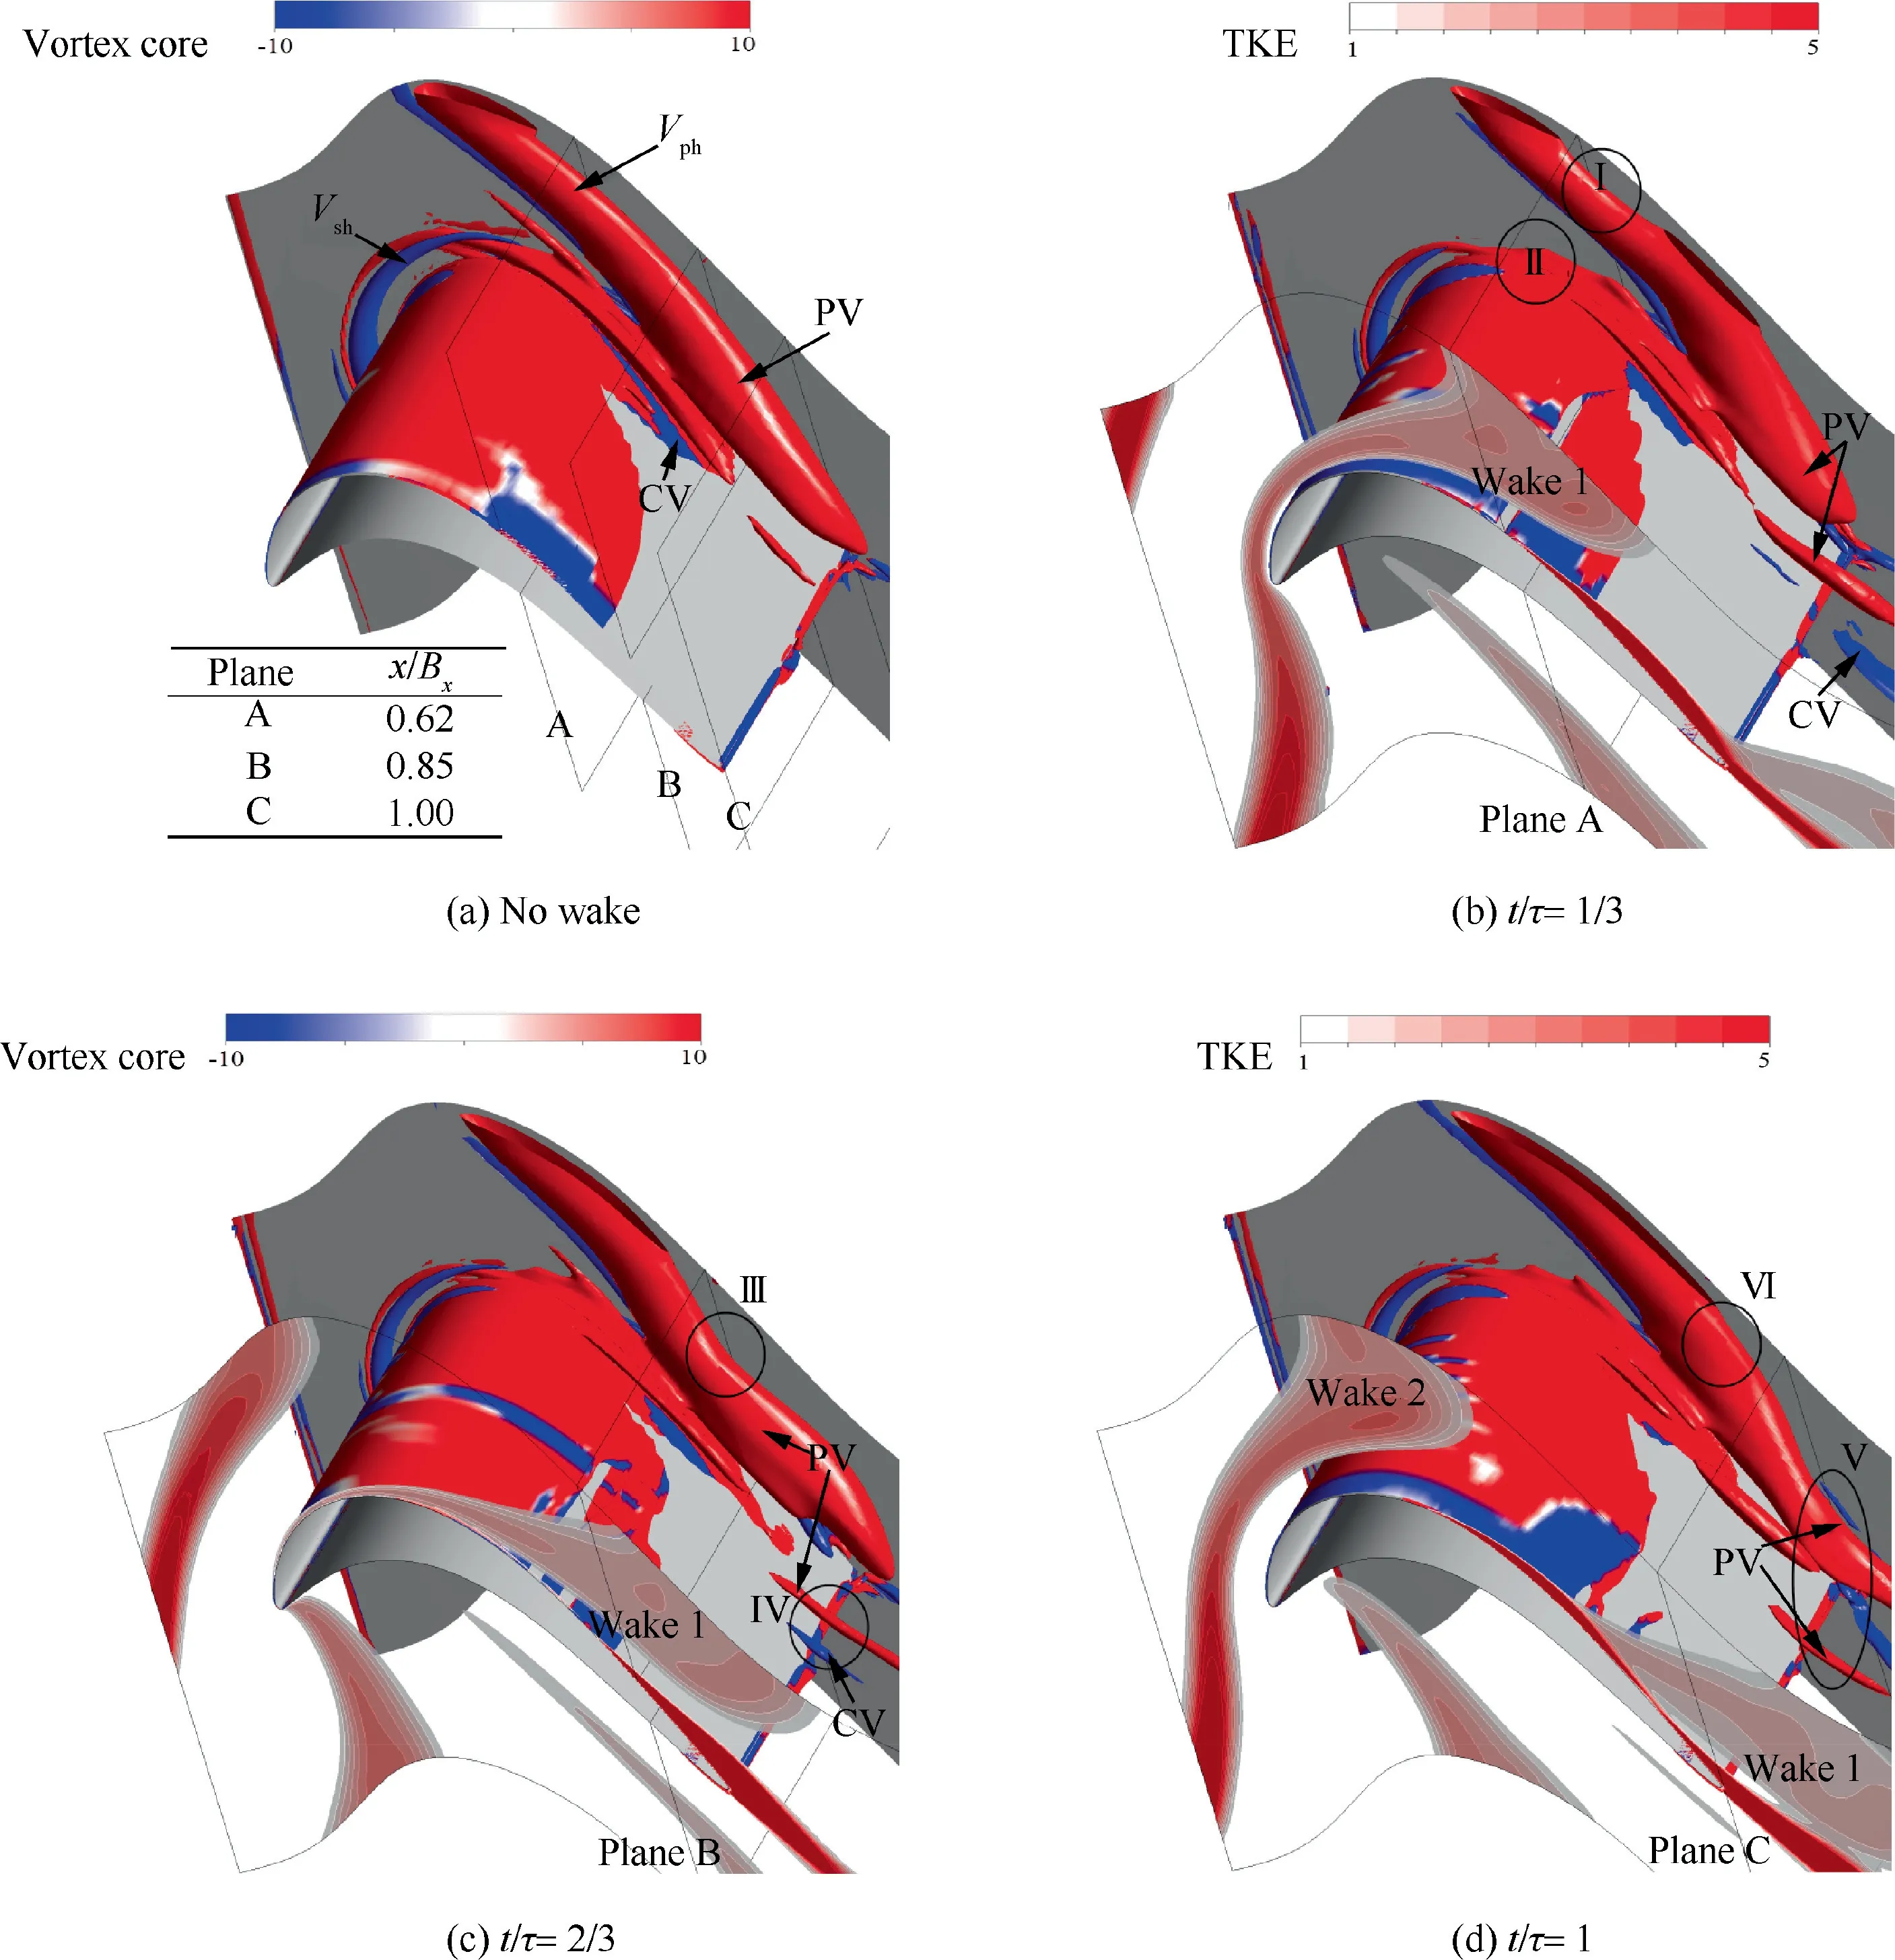
Fig. 14 Secondary flow structures visualized using Q-criterion isosurfaces at Q=2.2×10⁶, colored according to dimensionless streamwise vorticity and also showing TKE contours at midspan (CFD results).
To further examine the interaction between the incoming wakes and endwall secondary vortex, Fig. 15 presents a comparison of the streamwise vorticities for the different planes shown in Fig. 14 in the presence and absence of wakes. At t/τ=1/3, the upstream wakes had reduced the strength of Vshand Vphat plane A compared with the results in the absence of wakes.A greater negative vorticity appeared above Vph, as indicated by the letter ‘‘A” in Fig. 15. The formation reason is rolling-up of low-energy flow because of the interaction between the periodic wakes and endwall boundary layer.This negative vorticity was beneficial for counteracting the positive vorticity of Vphand thus helped to reduce the strength of Vph.At t/τ=2/3,Vphunder the unsteady wakes had obviously weakened at plane B.The strength of the counter vortex had increased, which was beneficial for counteracting the positive vorticity of the passage vortex and reducing its size. At t/τ=1, the structure of the endwall secondary vortices at plane C was very complex. Compared with the steady conditions in the absence of wakes, under unsteady conditions the endwall secondary vortices were closely intertwined, as indicated by the letter ‘‘B”. The positive and negative vorticities of the endwall secondary vortices further mixed and cancelled one another out, which helped to suppress the endwall secondary flow.
4. Conclusions
An ultra-high-lift front-loaded airfoil was used to examine the effects of periodic wakes on aerodynamic performance via a combination of experimental measurements obtained using a seven-hole probe and numerical calculations. The unsteady interaction mechanisms between the incoming wakes and endwall secondary flow have been discussed in detail, and the influence of the incoming wakes on the profile losses at the midspan has also been analyzed. The results can be summarized as follows.
(1) On the suction surface: At a low Reynolds number of 25000, upstream wakes significantly reduced the width and height of the wake region downstream of the cascade and suppressed the blade suction surface separation bubble. The size of the separation bubbles on the blade suction side further reduced upon increasing the wake passing frequency. At a high Reynolds number of 100000,the inhibitory effect of the wakes on the blade suction surface separation bubble decreased, and no obvious differences were observed for different wake passing frequencies. The loss of the free-flow region and the width of the wake increased, because the upstream wakes introduced greater mixing losses.
(2) At the endwalls:(A)Time-averaged results:The endwall secondary flow in the cascade passage was very strong,and the height of the secondary flow region accounted for approximately 30% of the span. The suppressing effect of incoming wakes on secondary flow gradually increased with increasing Reynolds number, because the low-energy flow inside the incoming wakes led to a clearly increased cross-passage pressure gradient near the endwall at the low Reynolds number of 25000. The experimental results demonstrated that periodic wakes reduced the peak strengths of the passage vortex and counter vortex by 8.9% and 4.9%, respectively, at Re=25000, and 25% and 30%, respectively, at Re=100000, compared with the results in the absence of wakes. Furthermore, at the high Reynolds number of 100000, the unsteady wakes clearly reduced the secondary kinetic energy inside the cascade passage and significantly suppressed the endwall secondary vortex structures, compared with the results at the low Reynolds number of 25000. (B) Instantaneous results: Secondary vortex structures decreased significantly at the position of the passing wakes.Some interesting phenomena were observed in the presence of wakes, including the occurrence of a greater negative vorticity above the pressure side leg of the horseshoe vortex due to the interaction between the periodic wakes and endwall boundary layer, which counteracted the positive vorticity of the pressure side leg of the horseshoe vortex and helped to suppress the endwall secondary flow.
Acknowledgments
Financial support for this work from the National Natural Science Foundation of China (Nos. 51876202, 51836008) is greatly appreciated.
 CHINESE JOURNAL OF AERONAUTICS2020年5期
- CHINESE JOURNAL OF AERONAUTICS的其它文章
- Experimental of combustion instability in NTO/MMH impinging combustion chambers
- Three-line structured light vision system for non-cooperative satellites in proximity operations
- Remaining useful life prediction of aircraft lithium-ion batteries based on F-distribution particle filter and kernel smoothing algorithm
- Flow characteristics around airfoils near transonic buffet onset conditions
- Experimental investigation of flow and distortion mitigation by mechanical vortex generators in a coupled serpentine inlet-turbofan engine system
- An improved prediction model for corner stall in axial compressors with dihedral effect
