Flow characteristics around airfoils near transonic buffet onset conditions
Ynxiong ZHAO, Zhixiong DAI, Yun TIAN, Yuexi XIONG
a School of Aeronautic Science and Engineering, Beihang University, Beijing 100083, China
b China Helicopter Research and Development Institute, Jingdezhen 333001, China
c National Lab for Aeronautics and Astronautics, Beihang University, Beijing 100083, China
KEYWORDS Dynamic Mode Decomposition;Separated bubbles;Shock waves;Transonic buffet;Transonic flow
Abstract In transonic flow, buffet is a phenomenon of flow instability caused by shock wave/boundary layer interaction and flow separation. The phenomenon is common in transonic flow,and it has serious impact on the structural strength and fatigue life of aircraft. In this paper, three typical airfoils:the supercritical OAT15A,the high-speed symmetrical NACA64A010,and the thin,transonic/supersonic NACA64A204 are selected as the research objects.The flow fields of these airfoils under pre-buffet and buffet onset conditions are simulated by Unsteady Reynolds Averaged Navier-Stokes (URANS) method, and the mode analysis of numerical results is carried out by Dynamic Mode Decomposition (DMD). Qualitative and quantitative analysis of the shock wave motion, shock wave intensity, shock foot bubble and trailing edge separation, and pressure coefficient fluctuation were performed to attain deep insight of transonic buffet flow features of different airfoils near buffet onset conditions.The results of DMD analysis show that the energy proportion of the steady mode of these airfoils decreases dramatically when approaching the buffet onset angle of attack, while the growth rate of the primary mode increases inversely. It was found that at the onset of buffet, there exist different degrees of merging behavior between shock foot bubble and trailing edge separation during one buffet cycle, and the instability of shock wave and separation induced shear layer are closely related to the merging behavior.
1. Introduction
In transonic flow,the interaction between shock wave and turbulent boundary layer may induce large-scale flow instability,which is a kind of self-sustained oscillation under certain range of Mach number and angle of attack,and this phenomenon is called transonic buffet. During one buffet cycle, the shock wave position and intensity change periodically. At the same time, shock wave induces separation and the thickness of the boundary layer also changes periodically. The shock wave motion and the oscillation of the related flow field will produce significant changes in aerodynamic forces and moments. The changes interacting with the elastic structure will affect the structural strength of the aircraft. Therefore, buffeting has become an important consideration in transonic aircraft design.
Regarding the buffet mechanism, Lee1proposed a selfsustained feedback model for asymmetrical airfoil buffet with shock movement only on the upper surface of airfoil. The model supposes that the motion of the shock wave generates pressure waves propagating downstream at a certain velocity,with the instability growing as it travels from the separation point through the separated shear layer. As the disturbances reach the trailing edge, upstream propagating pressure waves are produced so that the unsteady Kutta condition is satisfied.These Kutta waves travel towards the shock in the subsonic region above the separated flow. The interaction between the upstream propagating pressure waves and the shock results in energy exchange,completing the feedback loop and sustaining the periodic shock oscillation. Although Lee’s model proves to be consistent with the experiments of the BGK No. 1 airfoil, subsequent literature2,3has been somewhat conflicting regarding the applicability of the original formulation of the wave-propagation feedback model.
A competing theory for the mechanism governing transonic shock buffet,related to the instability in a global aerodynamic mode, has been posited by Crouch et al.4-6Crouch believes that transonic buffet is caused by the global instability of the flow. As the flow enters the unstable region, these unstable phenomena (shock oscillation, periodic separation, pressure pulsation, etc.) will be excited. The buffet boundary and frequency predicted by this model agree well with the experimental and numerical simulation data.Furthermore,Crouch et al.4also found that the Mach number ahead of shock wave and the burst of the bubble at the shock foot, previously proposed by Pearcey7and Lee1,8,9,are not suitable as the buffet onset criterion. Recently, Iovnovich10investigated the transonic flow around the airfoil with different thicknesses and curvatures using URANS method. Consistent with Crouch’s results, Iovnovich and Raveh10found that the bursting of the shock foot bubble is not suitable as the criterion for buffet onset,and gave three factors that affect the intensity of the shock wave,namely the wedge effect, shock wave motion effects and airfoil curvature effects. Iovnovich also found that the end of buffet is marked by complete separation behind the shock wave.
With the deepening of research in this field,transonic buffet under more complex flow conditions has been studied. By means of experiments11-14and numerical simulations,15-18researchers studied the three-dimensional buffet problems.The characteristic flow frequencies of a three-dimensional wing were found to be approximately an order of magnitude higher than those of a two-dimensional airfoil. In the three dimensions case, the frequency spectrum is more broadband instead of well-marked peaks in two dimensions. Some researchers investigated the elastic effect of the structure on the shock buffet and found obvious fluid-structure interaction characteristic. Steimle et al.19carried out unsteady transonic flow over an elastic swept wing, assessing the fluid-structure coupling mechanism under conditions where incipient and massively separated flow is present.Raveh et al.20,21studied the areoelastic response of an elastically suspended airfoil in transonic buffet flow using Navier-Stokes based computer simulations and found the frequency lock-in phenomenon. Hartmann et al.22observed the phenomenon of frequency lock-in in a wind tunnel experiment. Quan et al.23investigated the structural natural frequency, mass ratio and structural damping on lock-in characteristic of the elastic system through URANS simulations. Gao et al.24studied the dynamics of a spring suspended NACA0012 airfoil in transonic buffeting flow and revealed the physical mechanism underlying the frequency lock-in phenomenon, namely, single degree of freedom flutter. Based on the study of buffet mechanism, researchers also studied the buffet control method. Passive control methods such as slots,25,26vortex generators,27,28shock control bumps,29-31etc., and active control methods such as trailing-edge deflector,32,33fluidic vortex generator,34trailing-edge flap,35,36etc.have been extensively studied.
Modal decomposition37of flow fields is increasingly used to explore insight on fundamental flow mechanisms. The Dynamic Mode Decomposition (DMD) is one of the modal decomposition approaches. The DMD method was originally proposed by Schmid et al.38,39Later, many researchers proposed various improved DMD methods.40-42Kou43, Yuya44,Gao45and Poplingher46applied the DMD method to investigating the transonic shock buffet phenomenon.
The research on the phenomenon of transonic buffet seems to have paid more attention on the flow structure and selfsustained feedback mechanism in the past 60 years,47while the instability mechanism that transforms the flow from prebuffet to buffet is lack of deep research. In view of the above-mentioned application background and existing problems, this paper uses URANS and DMD modal analysis method to carry out research on transonic buffet flow instability mechanism based on OAT15A (supercritical),NACA64A010 (high-speed symmetrical) and NACA64A204(transonic and supersonic thin) airfoils. Qualitative and quantitative analysis of the shock wave motion, shock wave intensity, shock foot bubble and trailing edge separation, and separation induced shear layer perturbations were performed to attain deep insight of transonic buffet instability of different airfoils.
2. Introduction of DMD method
The basic DMD method38meets the requirements of the flow field study in this paper. The nature of DMD is to regard the flow evolution as a linear dynamic process. By analyzing the characteristics of the flow field snapshots of the entire process,the low-order modes and their corresponding eigenvalues can be extracted to represent the flow field information.
The time snapshots obtained through experiments or numerical simulations can be written as snapshot sequence matrixes X and Y,and the time interval between any two snapshots is Δt, i.e.

Assume that the flow field vi+1can be represented by linear mapping A and flow field vi, i.e.

The hypothesis in Eq. (3) satisfies the above mapping relationship for sampling in the entire area and the entire period.For a slowly changing system, the multiplication rule is the basis for the above. In addition, if the dynamic system itself is nonlinear, then this process is a linear estimation process.In other words, nonlinear estimation is achieved by a linear hypothesis. According to the assumption Eq. (3), it yields:

From Eq. (4), we can see that the system matrix A can translate the time-space physics field Δt along the time dimension, so the matrix A represents the time evolution of the flow field. However, in the actual calculation, A may be a matrix with a huge amount of data. Therefore, a small matrix is expected to replace the matrix A. By using the eigenvalues of a low-dimensional matrix ~A to estimate the eigenvalues of A,the DMD method can be applied to solving practical dynamic problems.
For a matrix X with rank r, we can perform singular value decomposition on it, i.e.

where U is a unitary matrix, which satisfies UUH=I,U ∈Cm×r; UHis a conjugate transpose matrix of U;V ∈Cn×r; Σ is a diagonal matrix including r non-zero singular values in its diagonal.In this study,singular value decomposition is implemented in MATLB using the economical decomposition. This decomposition can save the computer’s memory and speed up the data reading and processing efficiency. Now A and Y can be written as

The calculation of the matrix A can be seen as a minimization problem:

In the formula, ‖·‖2Fis the Frobenius norm. So A can be approximated as

in Eq.(9),the eigenvalue obtained by the eigenvalue decomposition of the matrix ~A is a part of the eigenvalues of A, that is the Ritz eigenvalues.
Define the eigenvalue of the jth mode as μj, and the corresponding eigenvector is zj,and then the growth rate gjand frequency wjof the flow can be obtained by the logarithm of the eigenvalue

If the eigenvalue falls within the unit circle, then the corresponding mode is stable, otherwise it is unstable.
Define the jth dynamic mode as

and then each mode of the flow field forms a mode matrix:

Define the amplitude of the jth mode as

and then the vector of each modal amplitude of the flow field is

The DMD method is used to extract the main modes of the flow field.The flow field xiat any time can be expressed by the linear combination of the main mode and the time coefficient:

3. Validation of numerical methods
This section mainly compares the CFD results of different grid resolution, turbulence model and time-step with experiment and numerical verification of DMD methods.OAT15A airfoil is selected to perform numerical simulation with experimental data.Then,the results obtained by numerical calculation with optimal grid and turbulence model are performed by DMD decomposition and reconstruction. Finally, the reconstruction field is compared with basic flow field to verify the feasibility of DMD method.
3.1. Validation of URANS method
In this section,the wind tunnel experimental data of OAT15A airfoil48at ONERA S3Ch wind tunnel is compared with the numerical calculation. The flow conditions are set as Ma∞=0.73, α∞=3.5°, and Rec=3×10⁶. In this paper,the third-order accuracy Roe upwind scheme associated with the MUSCL flux limiter scheme of Van Leer is selected for the spatial discretization of the convective fluxes. For the viscous dissipative terms, second-order central differencing has been adopted. The temporal discretization was second-order accuracy dual-time stepping.
Three turbulence models,Spalart-Allmaras(SA),k-ω Menter model with an SST corrector and the Explicit Algebraic Stress Model Gatski-Speziable(EASM)in eddy-viscosity,have been assessed firstly.A medium C-H type mesh(the grid detail can be found in Table 1 and Fig.1 presents the grid topology)was selected and the physical time step of 3.5 μs has been adopted.The mean pressure coefficients Cpof different turbulence models are presented in Figs.2(a)and 3(a).It can be seen that SA and SST models predict the shock location slightly downstream and the case of EASM was more serious, but all of the turbulence models failed to predict the trailing edge pressure coefficient. From the Root Mean Square (RMS) of the fluctuations of statistical pressure (P-Pave)rms/q0on the upper surface shown in Fig.3(a),it is observed that SA model yielded the best agreement with the experimental data compared with other turbulence models. Hence, SA model is selected as the turbulence model in later investigations.St=0.0681(corresponding to f=75 Hz),and the measured50is St=0.0626 (corresponding to f=69 Hz). It can be seen that URANS method with SA turbulence model has good adaptability in predicting the frequency of transonic buffet.Therefore, for the near buffet onset simulation, we finally use the medium-grid Grid B, SA turbulence model and the physical time step Δt=3.5 μs for all of the following researches.

Table 1 Grid size characteristics.
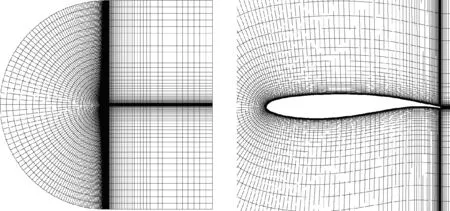
Fig. 1 Grid topology around airfoil and far field.
3.2. Validation of DMD method
Secondly,the effect of mesh convergence in space was analyzed on three levels.The grid details are shown in Table 1.For all grids, the first cell size perpendicular to the airfoil surface corresponds to y+<1. SA model was selected as the turbulence model and the physical time step of 3.5 μs has been adopted. The differences between medium and fine grid simulations on the airfoil are slight,but the fine grid is more appropriate for shock-buffet simulations, which is plotted in Figs. 2(b) and 3(b) respectively.
Thirdly, the effect of physical time steps was assessed.Figs. 2(c) and 3(c) illustrate that the different physical time steps yielded similar mean surface pressure and similar RMS of the statistical pressure fluctuations on the upper surface.In conclusion, compared with the current published literature results,2,48,49the calculation results are good enough.
Fig.4 shows that the calculated frequency spectrum characteristics agree well with the experimental data, SPL is the sound pressure level. A nondimensional frequency, the Strouhal number,is introduced:St=fL/U∞,with f being the buffet frequency,L being the reference length,and U∞being the freestream velocity. The calculated buffet Strouhal number is
In this paper,the URANS result of the OAT15A airfoil under condition of Ma∞=0.73, α∞=3.2° is selected to verify the DMD method. The corresponding growth rates and nondimensional frequencies are given in Table 2, and the pressure contours of each mode obtained by DMD are shown in Fig. 5, and It can be found that the modes obtained by the DMD method exist in conjugated form except for the first mode,and the first mode represents the steady state characteristic of the flow field, while high-order modes represent the dynamic changes of the flow field.
The time evolution of the pressure distributions in one buffet cycle is shown in Fig.6,T is the evolution cycle.In order to verify the accuracy of DMD mode extraction, the flow field is reconstructed with different modes.Fig.7 shows the flow field of four instantaneous moments in a period calculated by numerical calculation. Fig. 8 presents the flow field obtained by mode reconstruction of the DMD corresponding to the instantaneous moment. From the qualitative view, the flow field obtained by DMD mode reconstruction is very similar to the real flow field. In addition, the quantitative differences between the two flow field data at corresponding moments are shown in Fig. 9. The errors are relatively bigger at the moment of 3/8T and 7/8T. This may be due to the fact that only the first 9 modes are used in the reconstruction, hence the high-order modes contained in the flow at these moments cannot be recovered. However, the magnitude of the errors between real and reconstructed flow field is small, which proves the feasibility of the DMD method.
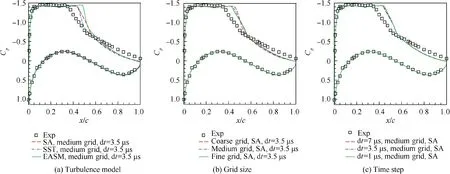
Fig. 2 Influence of different turbulence models, grid size and time step on distribution of airfoil surface pressure coefficient.
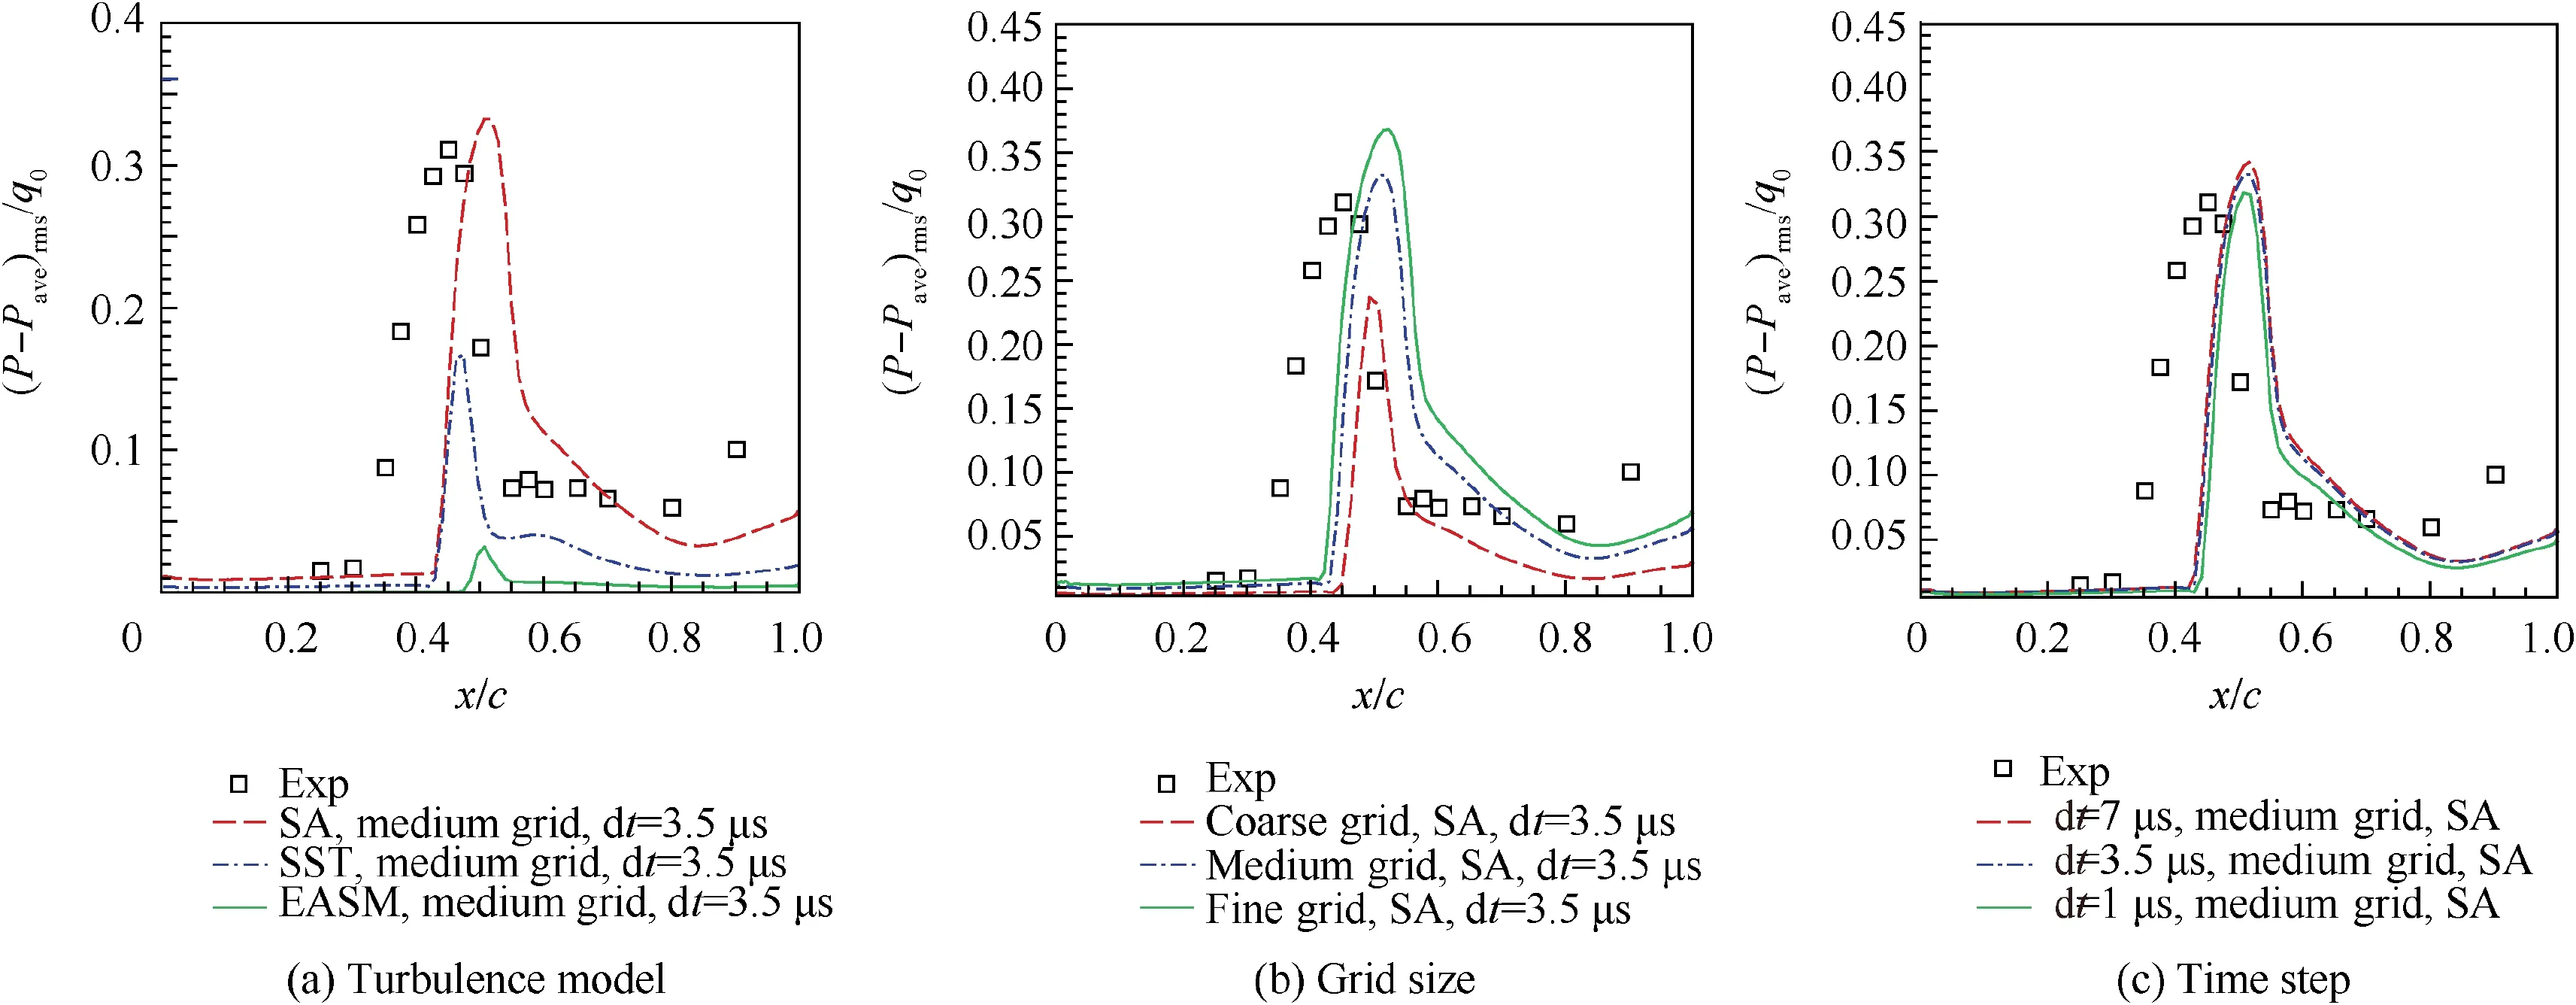
Fig. 3 Influence of different turbulence models, grid size and time step on RMS of pressure fluctuation coefficient of upper airfoil.
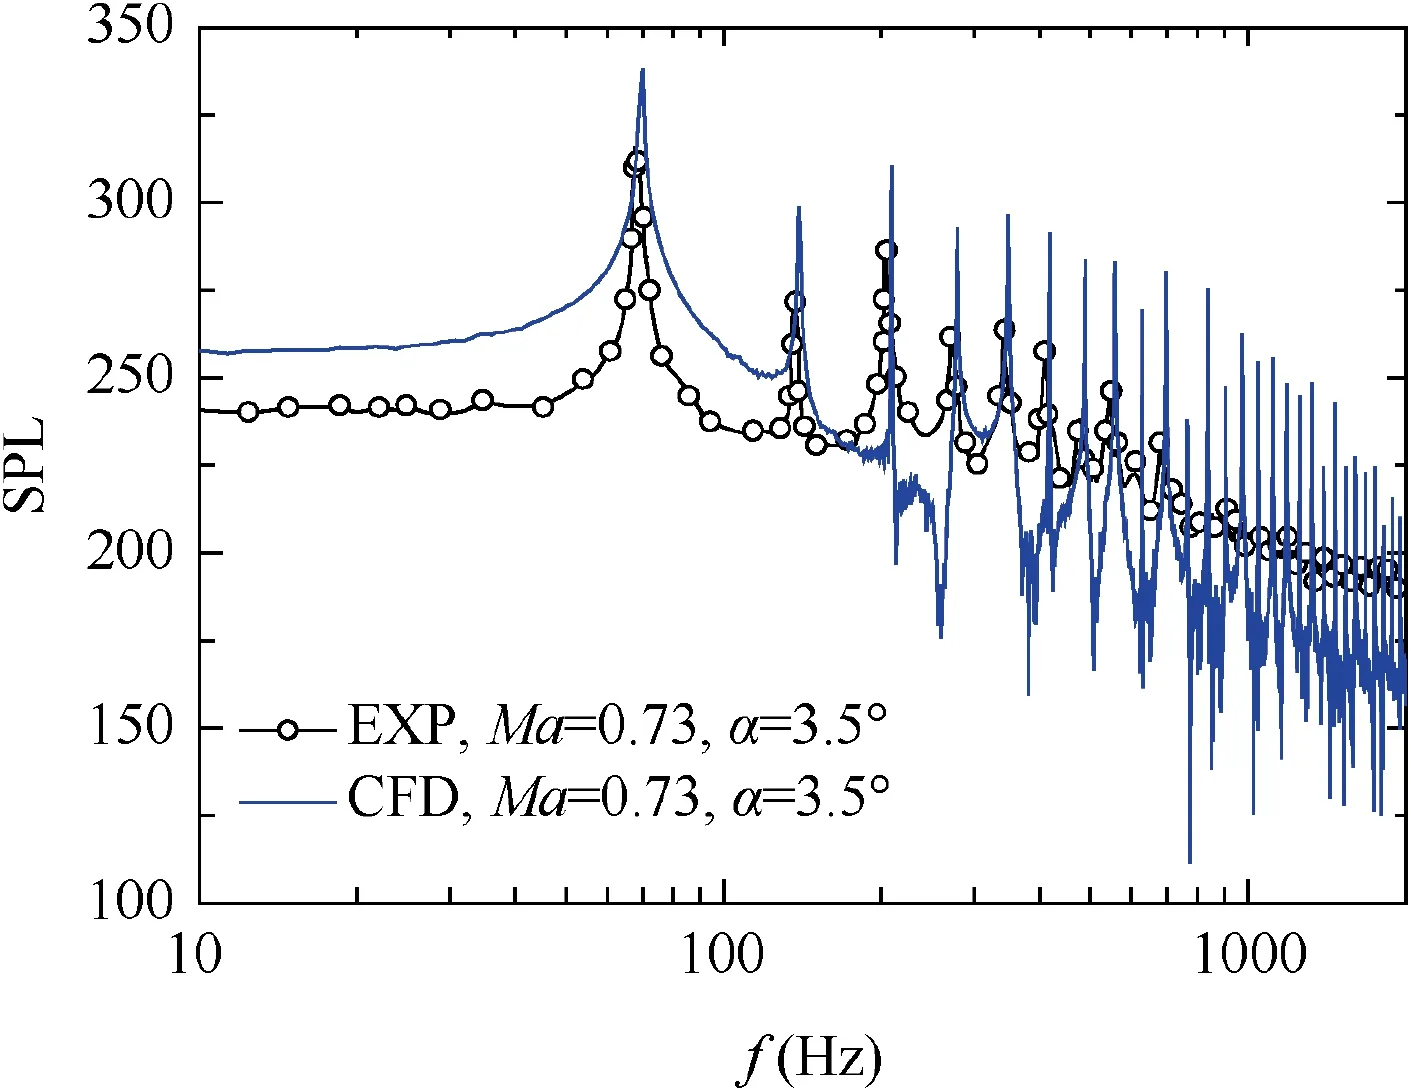
Fig. 4 Comparison of power spectral density of experimental data and URANS results.

Table 2 Growth rates and nondimensional frequencies of the first 9 DMD modes.
4. Buffet onset flow field analysis
In this section,the DMD method is used to analyze the numerical results of different airfoils comprehensively. The buffet onset angles of attack are determined based on these results,and a comparative analysis is performed between the flow field before and after the buffet onset.
4.1. Analysis of DMD flow field
Based on the study in Section 3.1, freestream and mesh characteristics listed in Table 3 are adopted in the following calculations, and the turbulence model is SA model. The physical time step Δt=3.5 μs is used for unsteady calculations.
DMD analysis of flow field is performed over a wide range of angles of attack.The growth rate of Mode 2,the proportion of the Mode 1 energy and the amplitude of the lift coefficient oscillation of different airfoils are presented in Fig. 10. It can be seen that the growth rate of Mode 2 of OAT15A,NACA64A010 and NACA64A204 airfoil is stable between α∞=3.2°-10°, α∞=2.6°-8.5° and α∞=5.3°-7.5° respectively, and the values are all approaching zero.
Paying attention to Mode 1 energy curve,it can be observed that for OAT15A airfoil, before α∞=3.2° and after α∞=10°,the energy of mode 1 takes up nearly the entire flow field energy, which means that the flow field information of Mode 1 can represent the full flow field. Moreover, the flow field of Mode 1 represents mean flow field, and the energy of Mode 1 accounting for most of the total energy indicates that the flow field changes very little with time.After α∞=3.2°,as the angle of attack increases, the energy occupied by Mode 1 becomes lower and lower, and the corresponding Mode 2 and higher modes contribute more to the flow field.The Mode 1 energy of the NACA64A010 airfoil starts to decrease at α∞=2.6°.The phenomenon of NACA64A204 airfoil appears at α∞=5.3°.
Similarly, taking OAT15A airfoil as an example, the oscillation amplitude of the lift curve becomes gradually higher after α∞=3.2°, and the peak value reaches at about α∞=6°, and then returns back to nearly zero at about α∞=10°.The trend of lift oscillation curve is coinciding with the growth rate of Mode 2 and the proportion of the Mode 1 energy curve. This indicates that the growth rate of Mode 2 and the proportion of the Mode 1 energy can possibly be used as a new verification method to determine the buffet onset and offset. The same trend of the lift oscillation curve can also be seen with NACA64A010 and NACA64A204 airfoil.
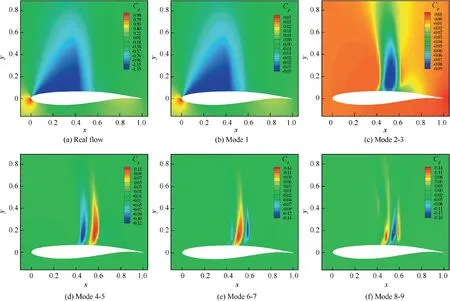
Fig. 5 Contours of OAT15A airfoil pressure coefficient by DMD.
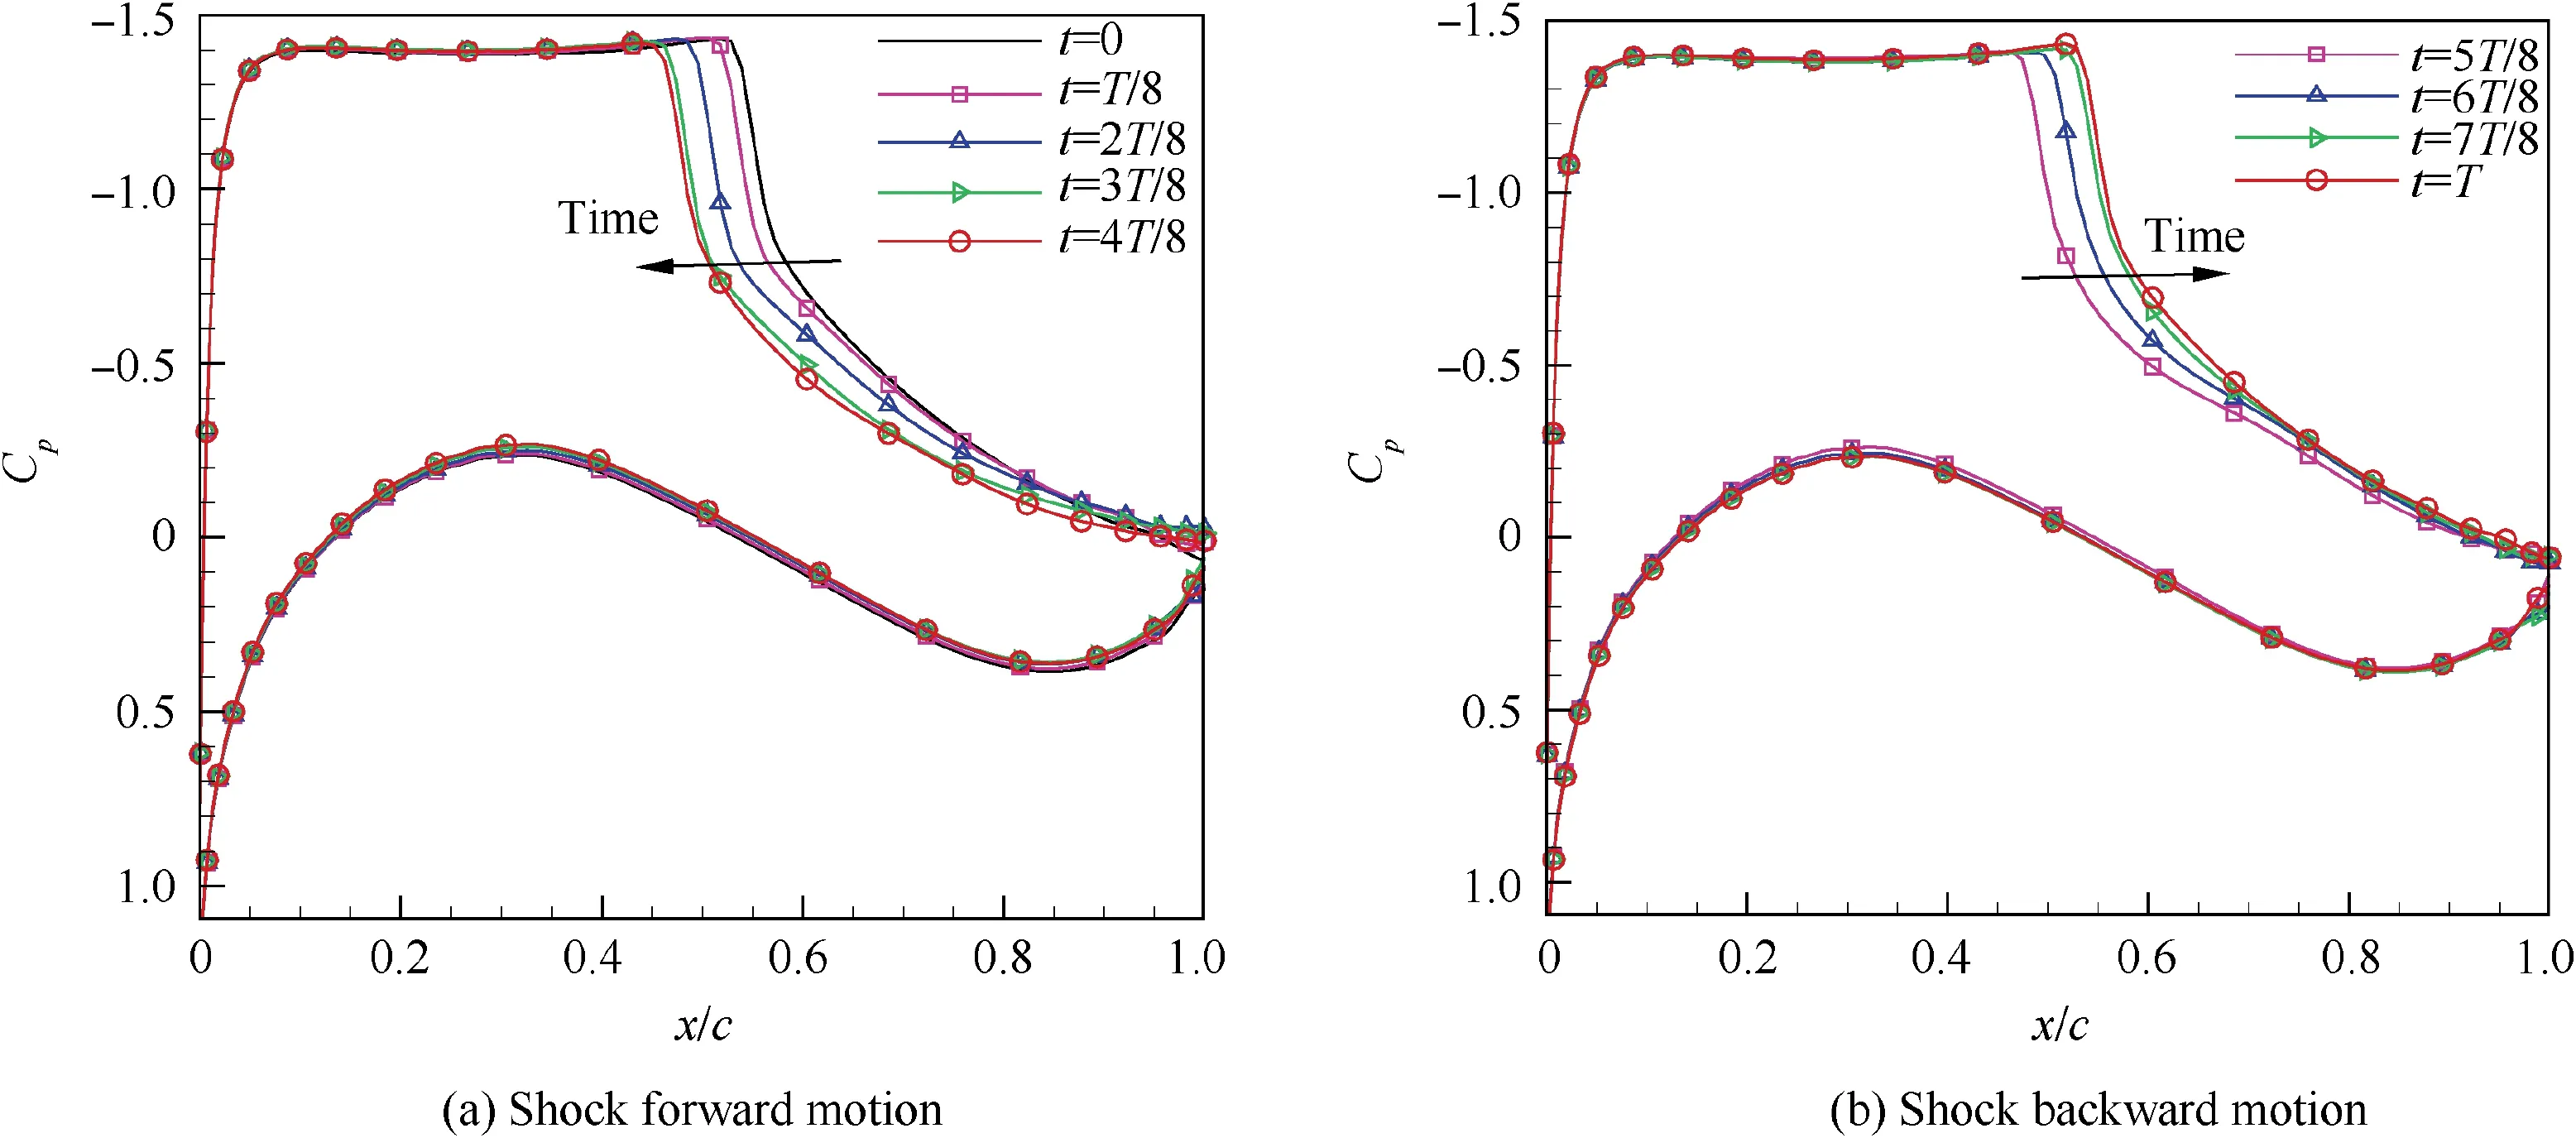
Fig. 6 Time evolution of pressure distributions.
It can be seen from the oscillation amplitude of the lift curve that the post-buffet offset angles of attack of three airfoils OAT15A, NACA64A0l0 and NACA64A204 are 10.2°,8.6°,and 7.6°,respectively.The growth rate of Mode 2 and the proportion of Mode 1 from DMD analysis are similar between pre-onset and offset conditions for all the three airfoils. However, this does not necessarily mean that the flow field characteristics are similar. Figs. 11-13 present the pre-buffet onset and post-buffet offset steady flow field solutions of the three airfoils in terms of Mach number maps and flow streamlines.Again, taking OAT15A airfoil as an example, the flow aft of the shock exhibits different separation characteristics. Under the pre-buffet onset condition, a separation bubble at around 0.6c exhibits behind the shock, followed by a region of reattached flow, while under the post-buffet offset condition, a massive separation is visible aft of the shock. Similar conclusions can be drawn for the other two airfoils.
After comprehensive analysis of different airfoils, typical angles of attack before and after buffet onset are selected to study the instability mechanism of transonic buffet.The specific angles are shown in Table 4,where αpreis the angle of attack before buffet, and αonis the angle of attack at which buffet onset takes place.

Fig. 7 Contours of OAT15A airfoil pressure coefficient calculated by URANS.

Fig. 8 Contours of OAT15A airfoil pressure coefficient reconstructed by DMD.

Fig. 9 Errors of pressure coefficient between original field and DMD field for OAT15A airfoil.

Table 3 Freestream and mesh characteristics.
Analysis of the velocity in the x direction allows for a more intuitive analysis of the characteristics of the flow field, especially the variation trend of shock and separation bubbles.Thus, Mode 2 and higher modes of x direction velocity are reconstructed by DMD method and defined as velocity perturbation (U Perturbation) to characterize the unsteady trend of the flow field. Fig. 14 shows the reconstructed contours of the U Perturbation of different airfoils before buffet onset. It is found that the flow field of U Perturbation before buffet exhibits a certain degree of steady and does not change with time or change very weakly. This means that the fluctuation of the original flow field is very small.
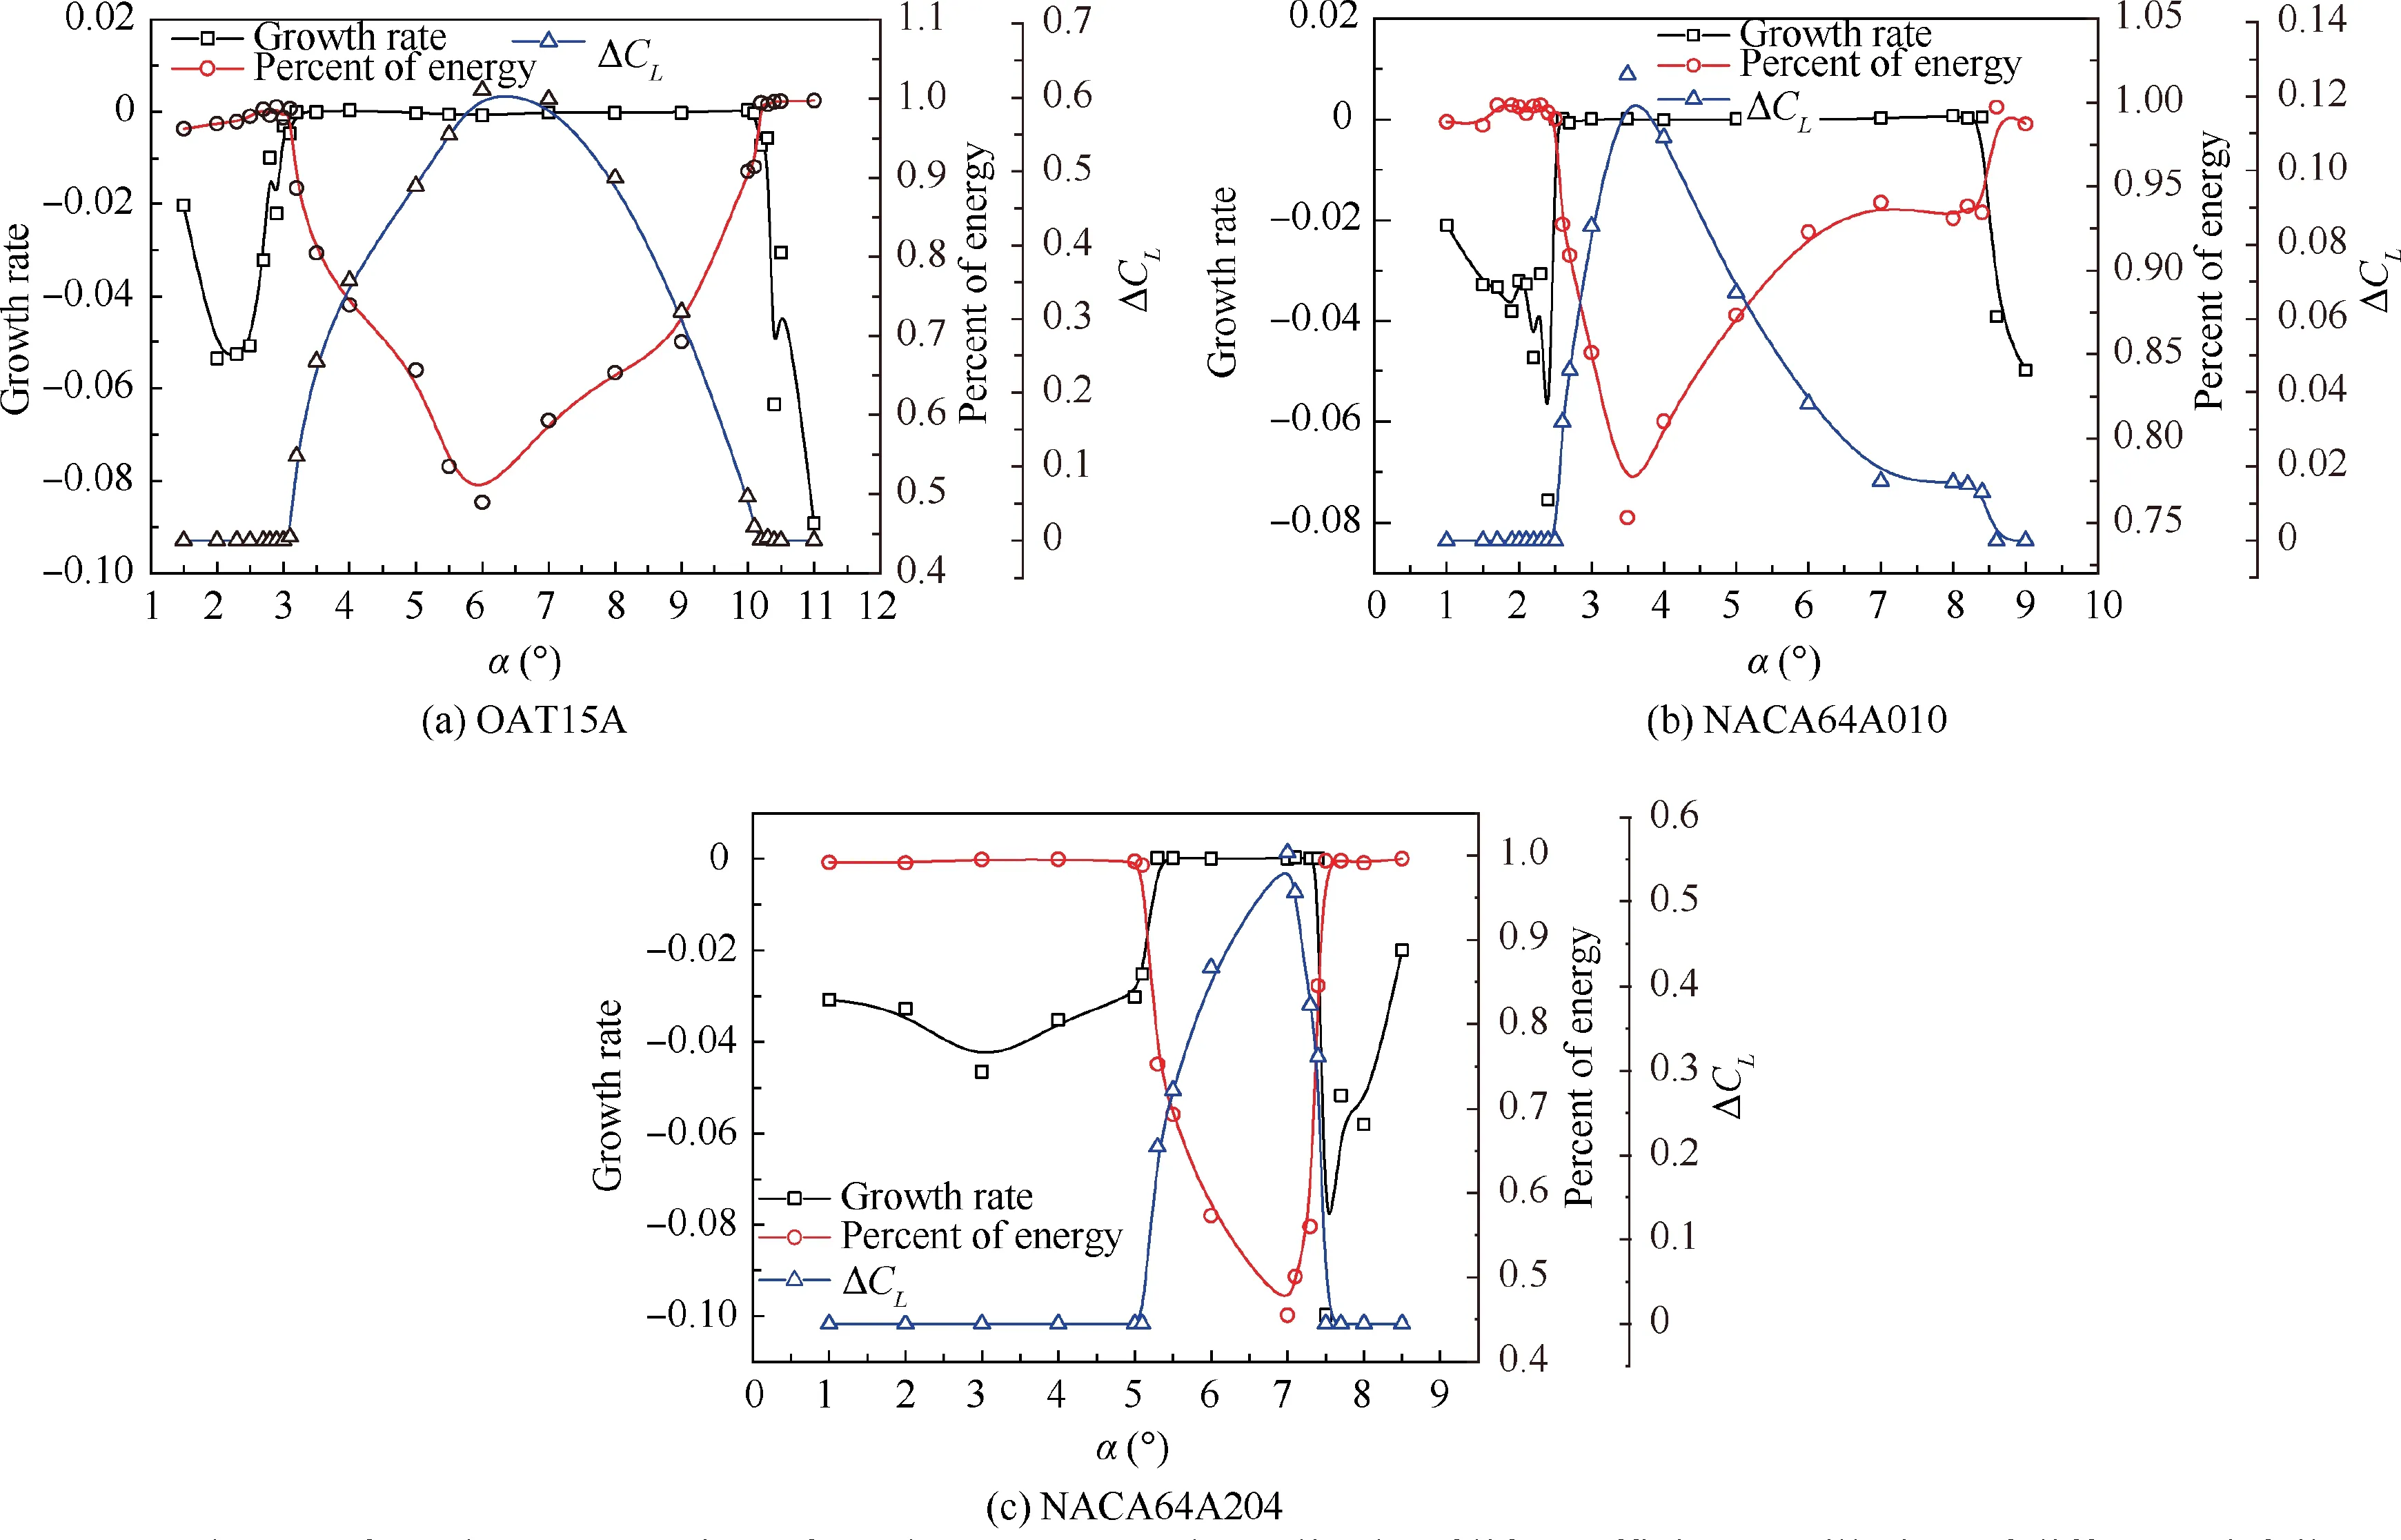
Fig. 10 Growth rate of Mode 2, proportion of Mode 1 energy and amplitude of lift coefficient oscillation of different airfoils.

Fig. 11 Mach number maps and flow streamlines for OAT15A airfoil under pre-buffet onset and post-buffet offset conditions.

Fig. 12 Mach number maps and flow streamlines for NACA64A010 airfoil under pre-buffet onset and post-buffet offset conditions.
Figs.15-17 show the reconstructed contours of U Perturbation at four different stages in one buffet cycle of OAT15A and NACA64A010, NACA64A204 airfoils. It shows that the remarkable velocity perturbation in the flow field appears at two regions. One is near the shock wave position, and this is generally considered to be the inherent instability of the shock wave;the other is in the separated zone,which results from the interaction between the separated shear layer and the shock wave, and this flow instability is generally referred to as Kelvin-Helmholtz instability.51-53It can be seen from Figs.15 and 18(a) that from the stage of t=1T/8 to t=3T/8, the U Perturbation near the shock wave position and separated zone is positive,and the shock wave moves to the trailing edge while the shock foot bubble and trailing edge bubble shrink gradually. The reason for the phenomenon should be that the forward velocity perturbation reduces the pressure gradient in the separation bubbles, so that the separation bubbles gradually shrink. The change of flow field from the stage of t=5T/8 to t=7T/8 is mainly caused by the negative perturbation velocity. The position of the shock wave moves to the leading edge,and the separation bubbles gradually become larger and expand forward.This variation is somewhat similar to the low-frequency instability mechanism of Wu & Mart’s separation bubble ‘‘breathing effect” based on the dynamic balance between the mass flow rate of the shear layer obtained from separation bubble and the flow rate injected from the vicinity of the reattached point.54From Figs. 16 and 18(b),Figs. 17 and 18(c), it can be found that there are also similar changes in one cycle of the NACA64A010 and NACA64A204.

Fig. 13 Mach number maps and flow streamlines for NACA64A204 airfoil under pre-buffet onset and post-buffet offset conditions.

Table 4 Specific selected angle of attack for different airfoils.
4.2. Flow field characteristics analysis
In this paper, the time-space evolution of flow separation on the upper airfoil before and after buffeting in one period of three airfoils is also studied. Comparing Fig. 18 with Fig. 19,it can be found that the separation of flow on the upper surface on the three airfoils before and after buffeting shows a commonality in time-space evolution. The flow on the upper surface before buffeting is a stable separation, and the size and shape of the separation bubble do not change or change slightly.In addition,the shock wave position changes slightly.When the buffet occurs, the flow field produces a significant change,the shock wave moves back and forth along the chord greatly, and the shock-induced bubble merges into trailingedge bubble and then bursts out periodically,which is inconsistent with the view of Iovnovich and Raveh10that the initiation of buffeting does not relate to the bursting of separation bubbles.
In order to get deep insight into the changes of flow field under pre-buffet and buffet conditions, the streamlines and x direction velocity contours around the airfoil in a buffet cycle are investigated.It can be seen from Fig.20 that the separation area of the OAT15A airfoil mainly exists at the trailing edge and the shock foot before buffet,and the size of the shock foot bubble almost does not change, while under the buffet onset condition,the trailing edge separation and the shock foot bubble expand,then the shock foot bubble bursts out periodically,and the size of the shock foot bubble changes obviously.Fig. 21 shows that only the shock-induced bubble exists on the NACA64A010 airfoil before buffet and the separation bubble periodically expands toward the trailing edge and then shrinks while buffet onset, and the change of the size of shock foot bubble is similar to OAT15A airfoil.Fig.22 indicates that the NACA64A204 airfoil has a stable separation bubble extending from the shock foot to the trailing edge before buffet, while under the buffet onset condition, the shock-induced bubble then bursts out periodically, and the change of the streamline slope near shock foot is similar to OAT15A and NACA64A010 airfoils. In conclusion, the three airfoils show different separation pattern under pre-buffet conditions, while under buffet onset conditions,they all show the characteristics of periodic merging and separation between shock-induced bubble and trailing edge bubble.
In addition, the relationship between the shock foot Mach number and the speed of shock wave is also investigated.Compared with static shock wave,the speed of the shock wave can affect the shock wave intensity. Taking OAT15A airfoil as an example,it can be seen from Fig.23 that the speed of the shock wave and the Mach number ahead of the shock wave have experienced a process of sinusoidal variation with about 180°phase-difference. As mentioned in preceding text, Iovnovich10gave the conclusion that the strength of the unsteady shock is affected by the wedge effect,the dynamic effect,and the airfoil curvature effect.

Fig. 14 Reconstructed contours of high-mode x direction velocity before buffet onset for different airfoils.

Fig.15 Reconstructed contours of high-mode x direction velocity during a buffeting cycle for OAT15A airfoil,Ma∞=0.73,α∞=3.2°.

Fig. 16 Reconstructed contours of high-mode x direction velocity during a buffeting cycle for NACA64A010 airfoil, Ma∞=0.8,α∞=2.6°.

Fig. 17 Reconstructed contours of high-mode x direction velocity during a buffeting cycle for NACA64A204 airfoil, Ma∞=0.75,α∞=5.3°.

Fig. 18 Time-space evolution of flow separation on upper surface for three airfoils on buffet.
(1) Wedge effect.The shock pressure rise generates flow separation, which in turn acts as a geometrical wedge,increasing the shock strength and slanting it at its foot.

Fig. 19 Time-space evolution of flow separation on upper surface for three airfoils before buffet.
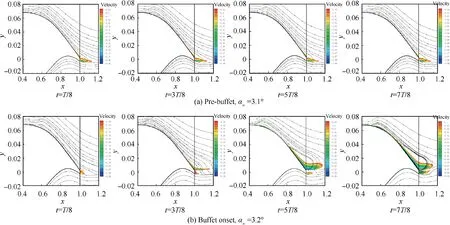
Fig. 20 Streamlines and x direction velocity contours (only values below zero are visualized) around OAT15A airfoil before and after buffet.
(2) Dynamic effect. As the shock travels upstream, the shock-motion velocity increases the Mach number ahead of the shock, relative to the shock itself. Typical shock-motion velocities as the shock starts moving upstream were found to be up to 5% of the freestream velocity.Since shock strength is correlated to the square of the Mach number ahead of the shock, this dynamic effect may be significant to the initial strengthening of the shock.
(3) Airfoil curvature effect. Flow expansion at the sonic region is surface curvature dependent. Since the initial downstream position of the shock is close to the zero surface curvature location (slightly behind the uppersurface maximum curvature), the decrease in shock strength due to its forward motion is minor compared with the wedge and dynamic effects, which tends to increase the shock strength.
The results of this paper can give a reasonable explanation of the dynamic effect,but it is impossible to quantitatively analyze the other two effects on the shock strength.The change of the shock strength will affect the shape of the shock-induced separation bubble and the thickness of the shear layer, thus affecting the change of the flow field. Glancing back to Figs. 20-22, we can find that the shock position during one buffet cycle did not change dramatically for OAT15A and NACA64A010 airfoils, and therefore the airfoil curvature effect can be neglected. Despite the range of shock position variation reaching about 0.2c for NACA64A204 airfoil, considering that the thickness of this airfoil is just about 4%c,the airfoil curvature effect can also be neglected. Finally, we propose that the key factor that makes the shock wave move periodically should be the wedge effect under buffet onset condition.
4.3. Analysis of pressure fluctuation characteristics
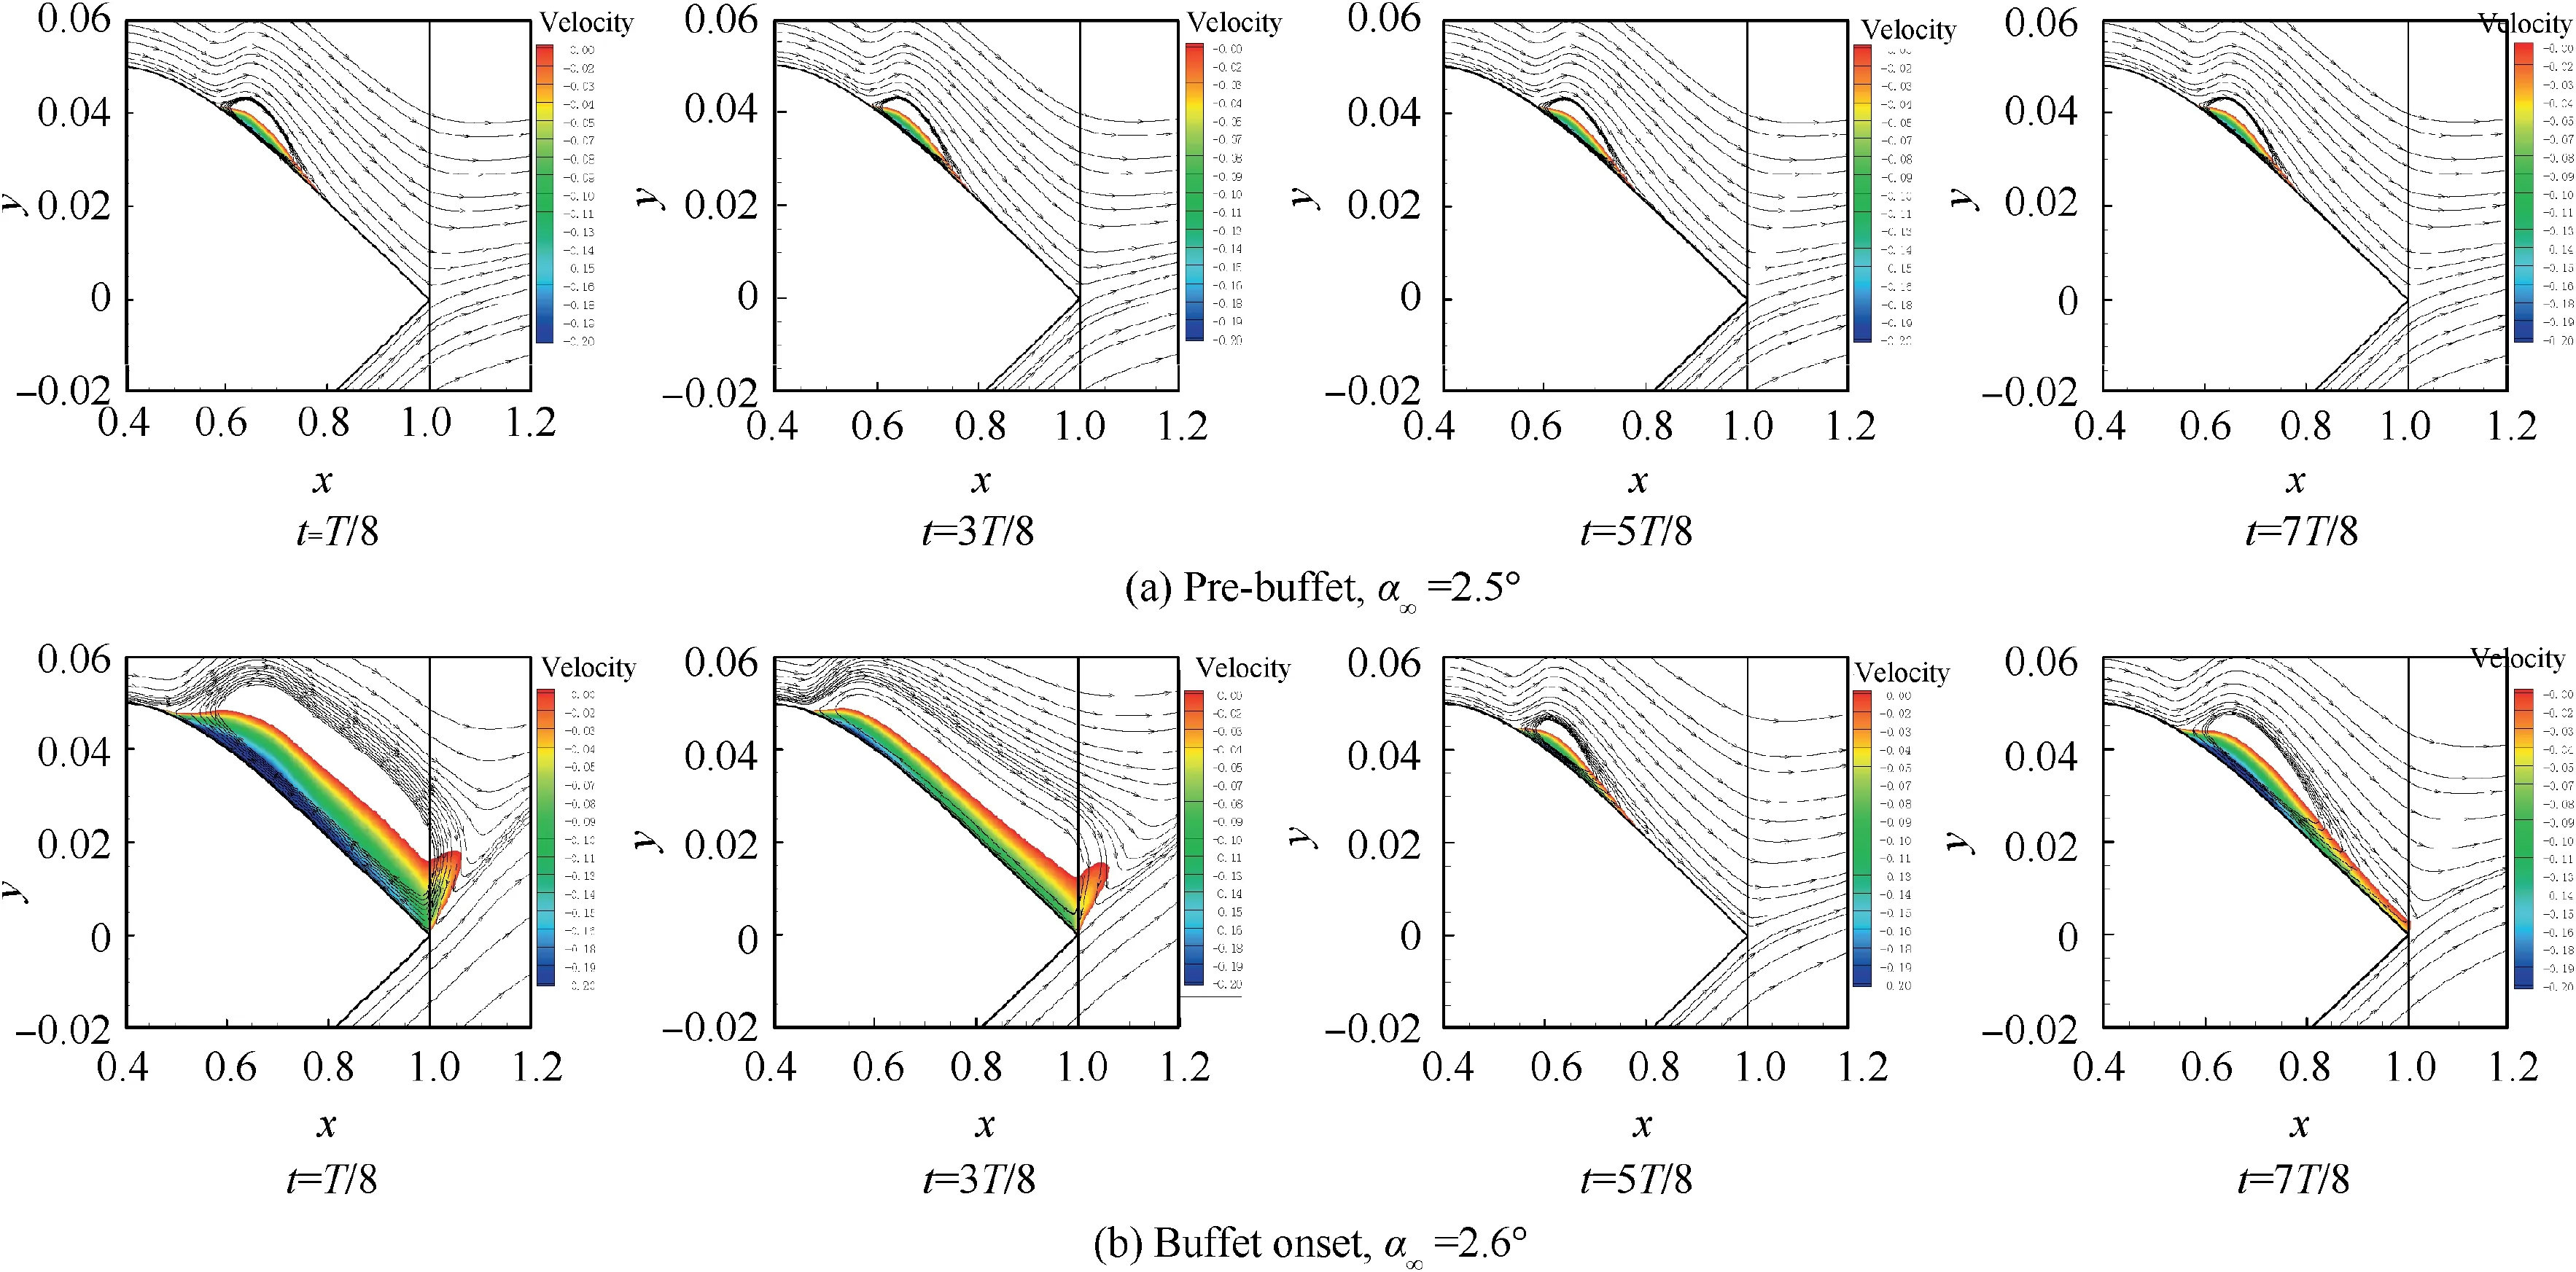
Fig. 21 Streamlines and x direction velocity contours (only values below zero are visualized) around NACA64A010 airfoil before and after buffet.
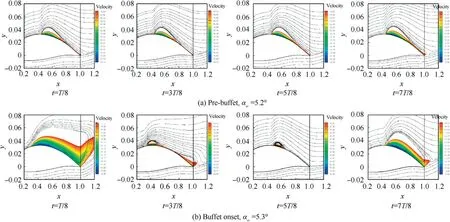
Fig. 22 Streamlines and x direction velocity contours (only values below zero are visualized) around NACA64A204 airfoil before and after buffet.
In order to investigate the pressure coefficient fluctuation characteristics before and after buffeting, seven pressuremonitoring points on the upper surface of the airfoil are selected, which were located at 0.2c, 0.3c, 0.4c, 0.5c, 0.6c,0.7c, 0.8c, and 0.9c. These points include the position before and after shock.For OAT15A airfoil,Fig.24(a)indicates that there exists minor sinusoidal fluctuation under pre-buffet condition, and the correlation relationship between different points is much higher; the propagation direction between 0.5c and 0.8c is towards the leading edge, which maybe attribute to the fact that the flow between this area is attached;in addition,the pressure coefficient at position x/c=0.9 exhibits significant high-frequency characteristics, and the main frequency components are 1300 Hz, 2650 Hz, 3950 Hz and 5250 Hz (corresponding to St of 1.18, 2.40, 3.58 and 4.76,respectively). Combined with Fig. 20(a), we can contribute the phenomenon to Kelvin-Helmholtz instability which results from the separated sheer layer,while under buffet onset condition, which can be seen from Fig. 24(b), the pressure fluctuation amplitude becomes much higher, and the correlation between different points becomes much lower; the perturbation propagation direction behind the shock is towards the trailing edge and there did not appear obvious highfrequency characteristics at any location.
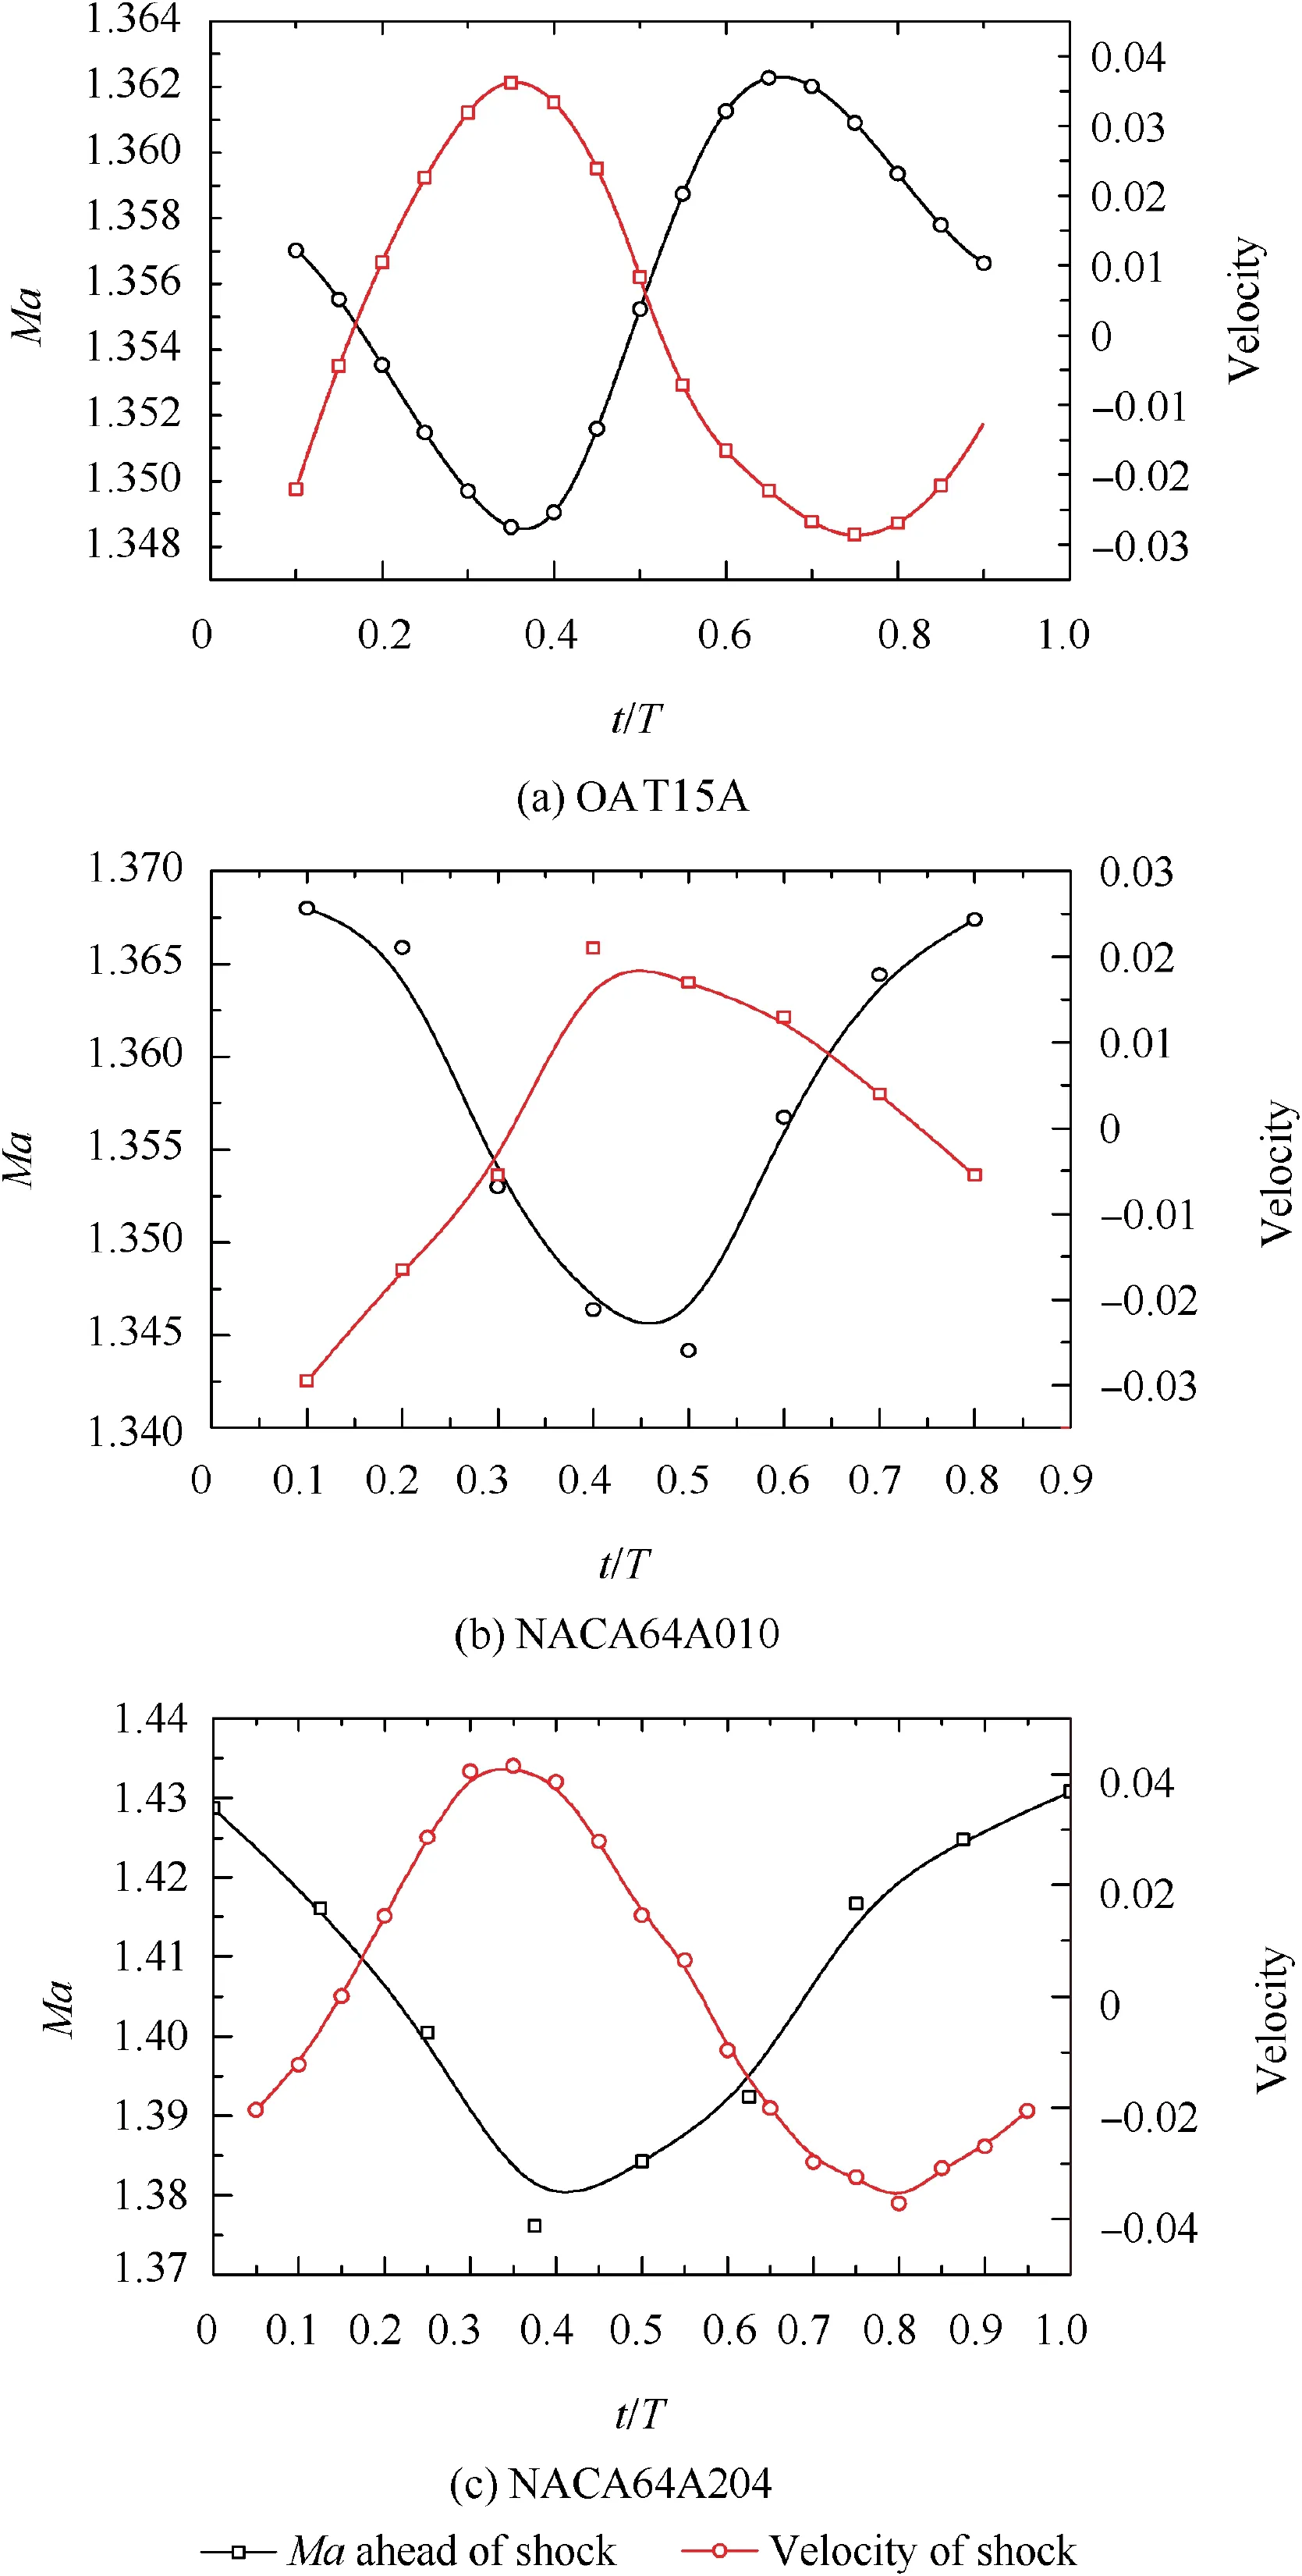
Fig. 23 Relationship of Ma ahead of shock and velocity of shock wave in one cycle for three airfoils.
For NACA64A010 airfoil, Fig. 25 indicates that the main characteristics of pressure fluctuation are similar to OAT15A airfoil,and the difference is that the perturbation propagation direction under pre-buffet condition is towards the trailing edge and all of the locations behind shock wave exhibit significant high-frequency characteristics. For NACA64A204 airfoil, Fig. 26 indicates that the main characteristics of pressure fluctuation are basically the same as NACA64A010 airfoil, and the only difference is that there did not appear obvious high-frequency characteristics at any location under pre-buffet condition.
Figs. 27-29 show the Power Spectral Density (PSD) of the pressure coefficient of three airfoils at monitoring points before and after buffet.It can be found that there exists a clear basic frequency about 75 Hz before and after buffet on OAT15A airfoil, and the difference between pre-buffet and buffet is that the basic frequency peak before buffet is very small, and there is no multiple frequency; for NACA64A010 airfoil, the basic characteristic is similar to OAT15A airfoil,and the difference is that there exist obvious broadband high-frequency characteristic at x/c=0.7 and 0.9 under prebuffet condition, which is in accordance with previous analysis. Unlike OAT15A and NACA64A010 airfoils, the power spectral density characteristic of NACA64A204 airfoil does not show much difference before and after buffet, and even under buffet-onset condition, the multiple frequency characteristic is still not obvious.
5. Conclusions
In this paper, three typical airfoils of OAT15A,NACA64A010,and NACA64A204 are selected as the research objects to study the flow characteristics under pre-buffet and buffet onset conditions.The structure and changes of flow field are numerically simulated by URANS method.Mode analysis is performed on the results obtained by numerical calculation by the DMD method. The conclusions are as follows:
(1) The energy proportion of Mode 1 and the growth rate of higher modes obtained by the DMD method can be used to determine the buffet onset and offset.
(2) Under buffet onset conditions, the shock-induced bubble and trailing edge separation will merge together with different duration during one buffet cycle for all airfoils.This is contrary to the results of previous literature, but consistent with Lee’s conclusion.
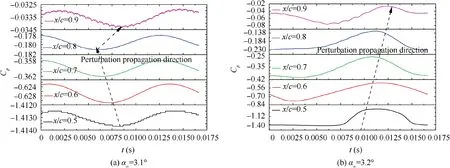
Fig. 24 Time history of pressure coefficient on different monitoring points of OAT15A airfoil.
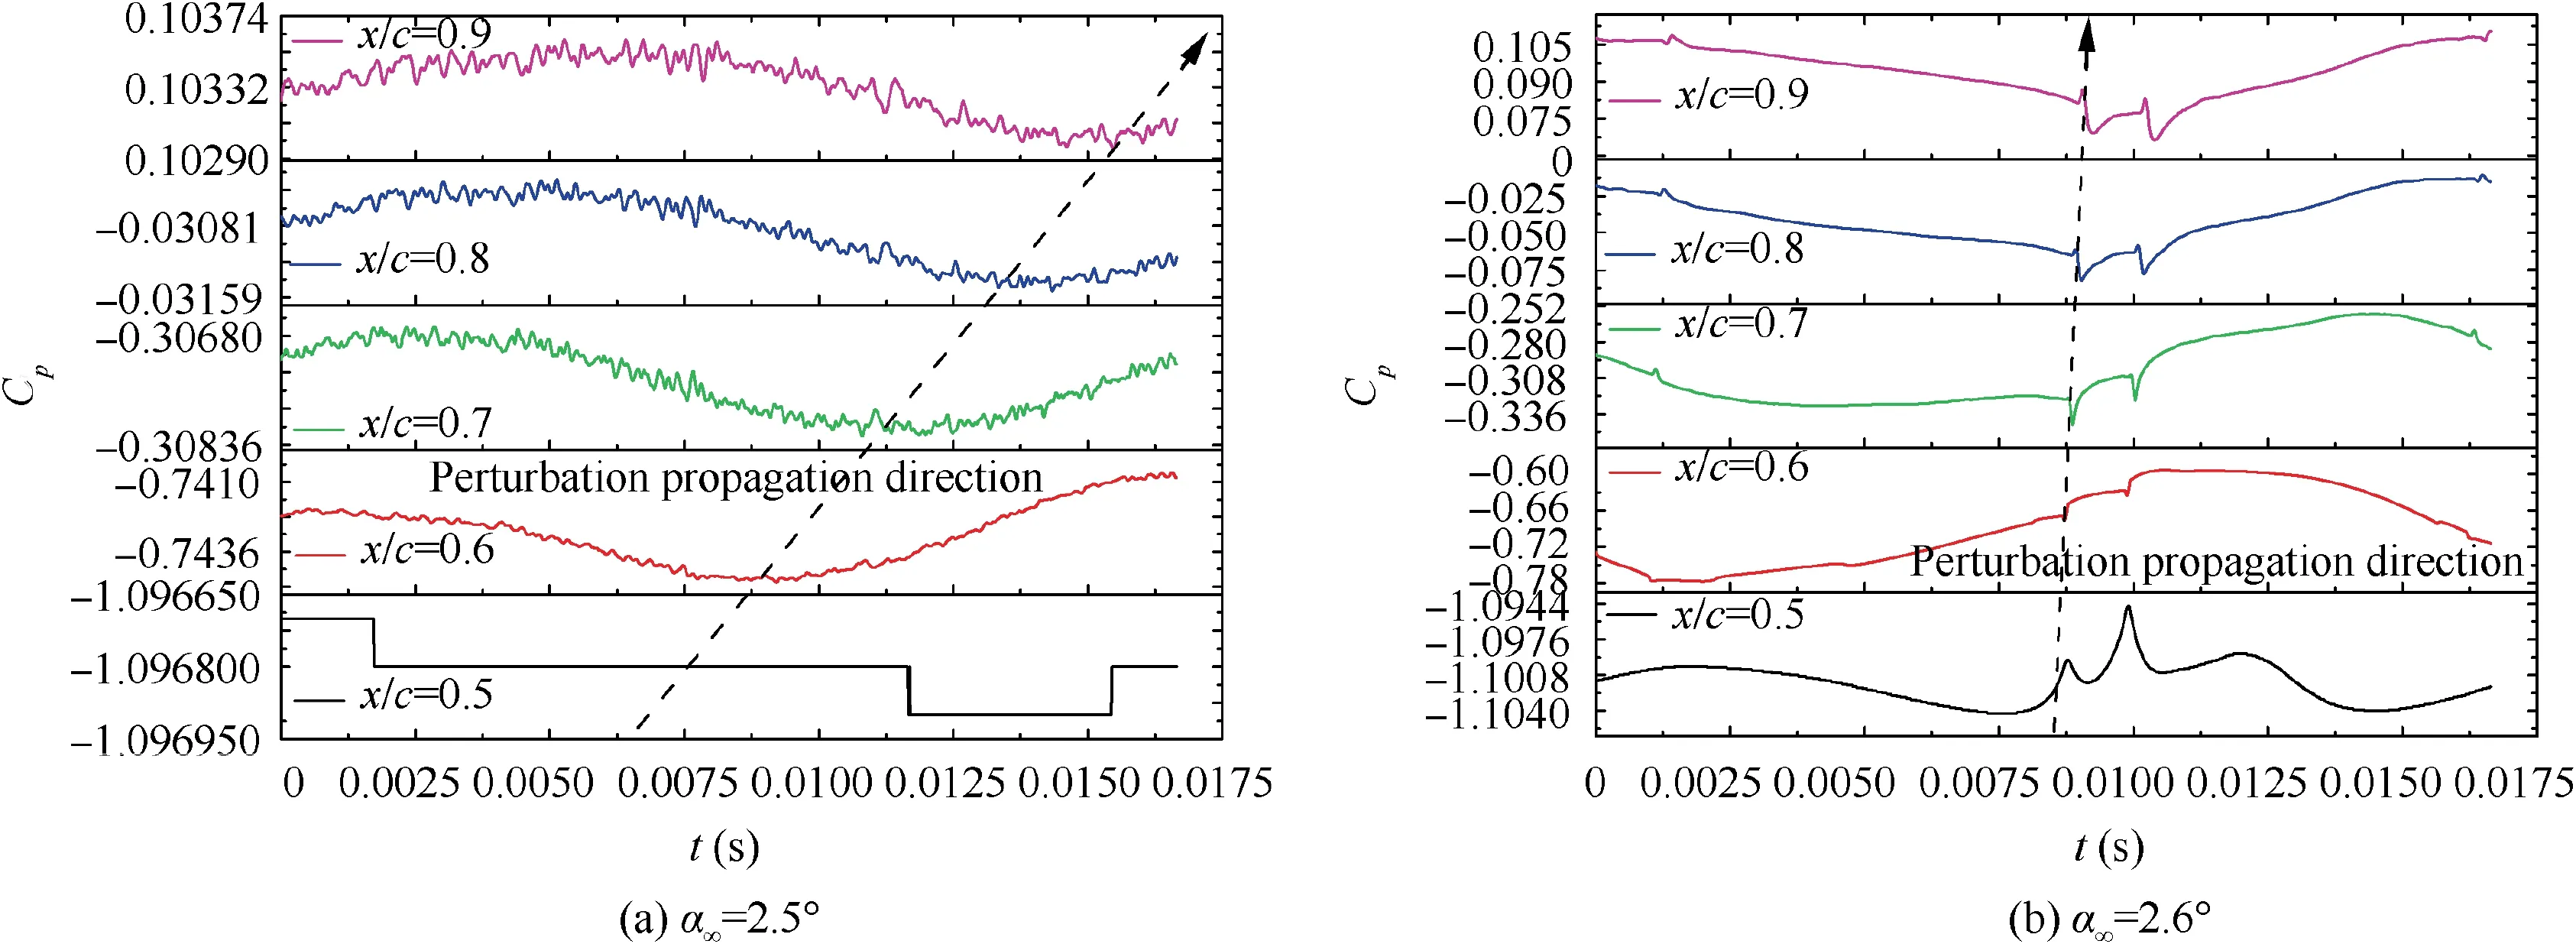
Fig. 25 Time history of pressure coefficient on different monitoring points of NACA64A010 airfoil.
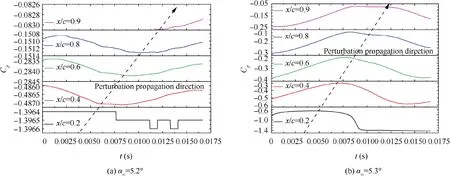
Fig. 26 Time history of pressure coefficient on different monitoring points of NACA64A204 airfoil.

Fig. 27 Power spectral density of pressure coefficient on different monitoring points of OAT15A airfoil.
(3) The key factor that affects the shock strength should be the wedge effect under buffet onset condition for different airfoils.
(4) The correlation of pressure fluctuation on the surface of different airfoils will decrease and the power spectral density will increase geometrically under buffet onset conditions. For OAT15A and NACA64A010 airfoils, the multiple frequency based on the main frequency will appear under buffet onset conditions, and at the same time, the high frequency characteristic in the trailing edge separation area will diminish. For NACA64A010 airfoil,there is no obvious multiple frequency and highfrequency characteristic under pre-buffet and buffet onset conditions.
Present work is intended to give some deep insight into the flow characteristics near buffet onset conditions for different airfoils, and further work may focus on the mechanism of those flow characteristics.
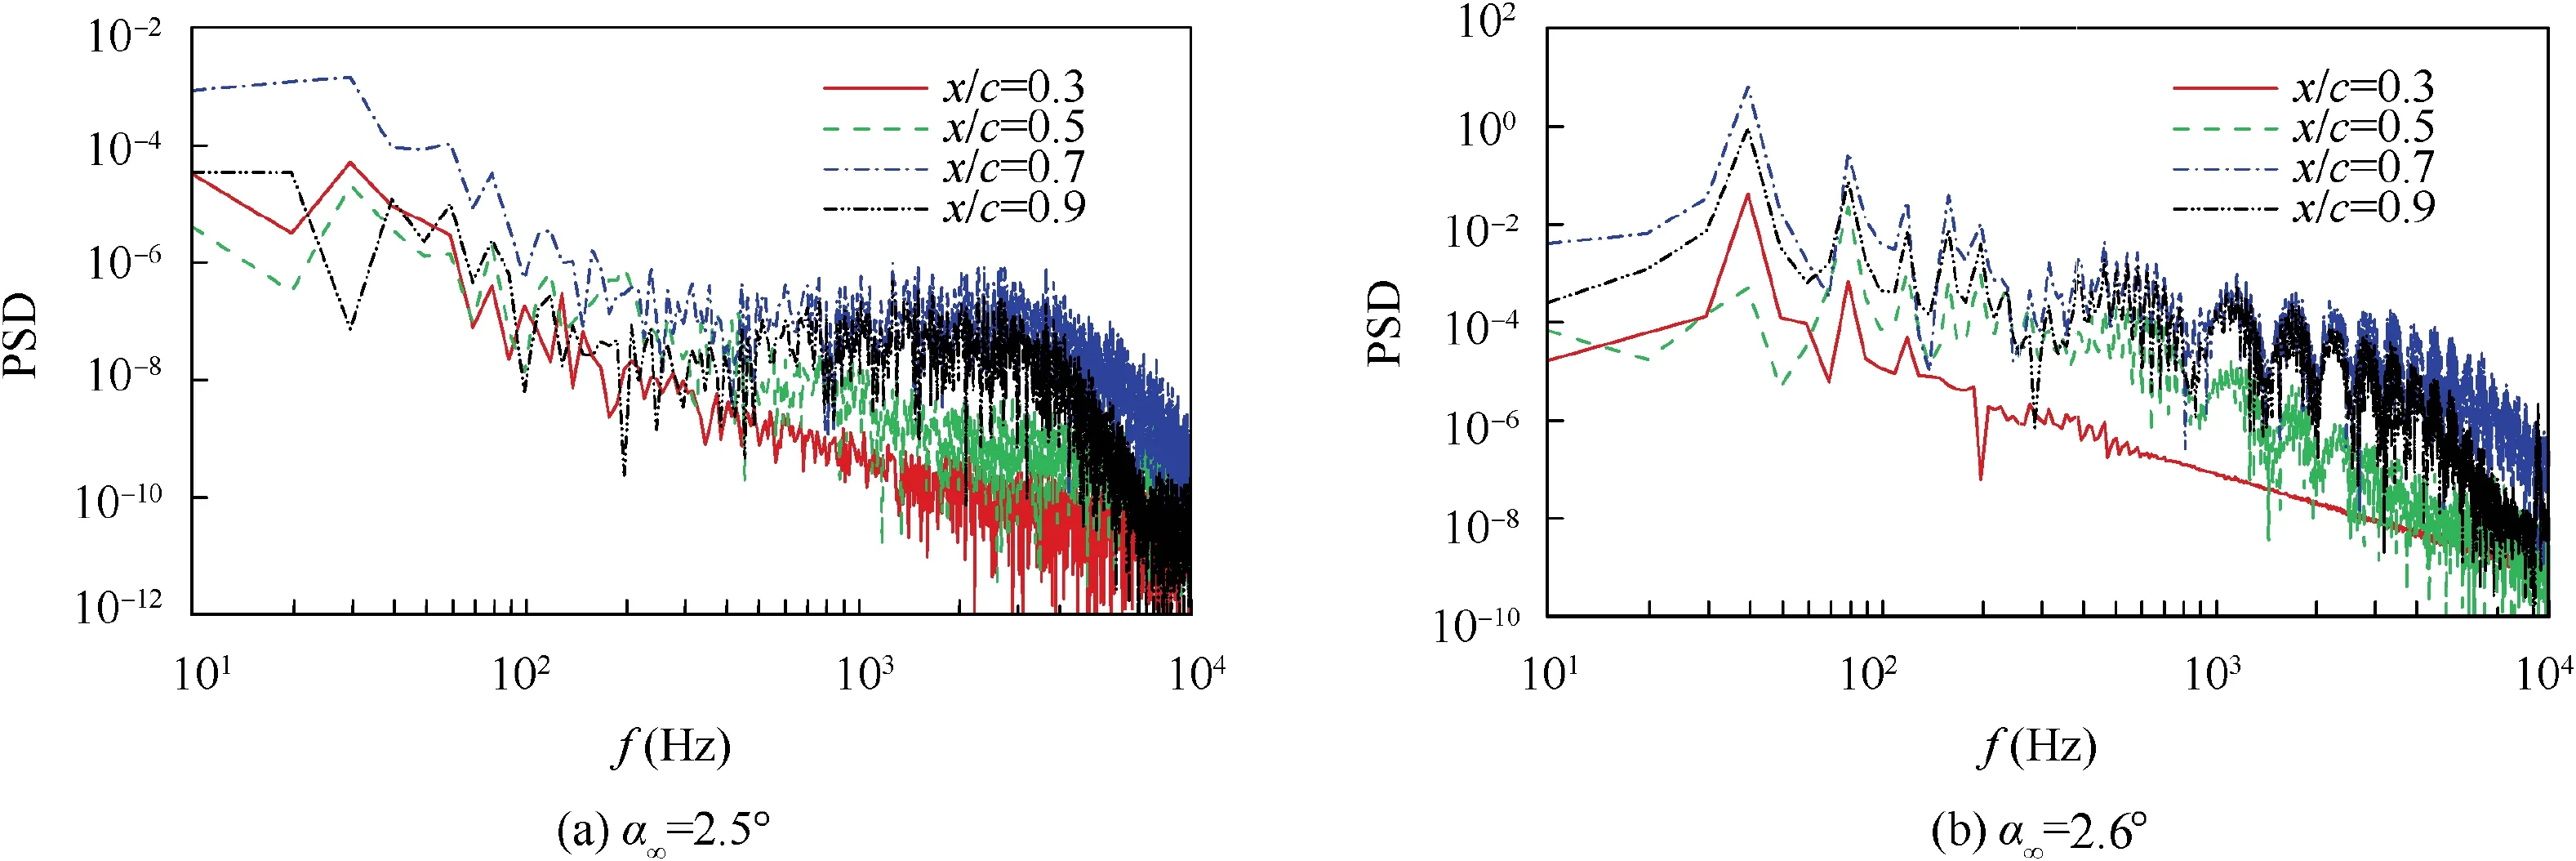
Fig. 28 Power spectral density of pressure coefficient on different monitoring points of NACA64A010 airfoil.

Fig. 29 Power spectral density of pressure coefficient on different monitoring points of NACA64A204 airfoil.
Acknowledgement
This work was supported by the National Natural Science Foundation of China (No. 11802009).
 CHINESE JOURNAL OF AERONAUTICS2020年5期
- CHINESE JOURNAL OF AERONAUTICS的其它文章
- Experimental of combustion instability in NTO/MMH impinging combustion chambers
- Three-line structured light vision system for non-cooperative satellites in proximity operations
- Remaining useful life prediction of aircraft lithium-ion batteries based on F-distribution particle filter and kernel smoothing algorithm
- Experimental investigation of flow and distortion mitigation by mechanical vortex generators in a coupled serpentine inlet-turbofan engine system
- An improved prediction model for corner stall in axial compressors with dihedral effect
- Consensus disturbance rejection control of directed multi-agent networks with extended state observer
