Experimental investigation of flow and distortion mitigation by mechanical vortex generators in a coupled serpentine inlet-turbofan engine system
Imn MAGHSOUDI, Mohmmd Ali VAZIRY, Mostf MAHMOODI
a Department of Aerospace, Malek-Ashtar University of Technology, Tehran 158751774, Iran
b Department of Aerospace, Malek-Ashtar University of Technology, Isfahan, Shahinshahr 115/83145, Iran
KEYWORDS Distortion coefficient;Power spectral density;Serpentine inlet;Total pressure;Vortex generators
Abstract The performance of compact,aggressive ducts in advanced propulsion systems is limited by the internal flow separation coupled with the formation of secondary counter-rotating vortices that give rise to intensive flow distortions at the duct exit. An experimental investigation was conducted to study the flow field and passive suppression of flow separation and Aerodynamic Interface Plane(AIP)distortion in a serpentine air inlet duct.Tests were performed by a turbofan engine at several Engine Operating Points (EOPs) from 56% (idle) to 100% (max). A large total pressure deficit region arose at the upper part of the AIP, which was associated with the upper surface flow separation.Using the new mechanical S-type vortex generators in two longitudinal positions(VG1 and VG2), separation and loss were diminished at the upper part of the duct and AIP. The VG2 arrangement attained the maximum reductions in distortion coefficients which were 73.72%,60.7% and 37.8% in DC(90°), DC(60°) and ΔPC/P metrics, respectively. In the next step of the study, some unsteady aspects of the flow field were analyzed inside the duct. The separation onset and reattachment points were determined by the standard deviation of static pressure on the upper surface.The AIP spectral distribution showed that the boundary of low pressure and high pressure recovery regions was dominated by the maximum fluctuations. Furthermore, the PSD diagram of several probes at AIP revealed the vortex shedding frequency and its higher harmonics at separation region. The energy content of distinct unsteady spectral features in the bare configuration was significantly reduced using VGs, which showed the improvement of flow at the duct exit.
1. Introduction
The embedded propulsion systems of the modern aircrafts often feature highly compact inlet diffusers for their installed jet engines. The main flow phenomena that have caused total pressure loss and distortion in the AIP of diffusers are the
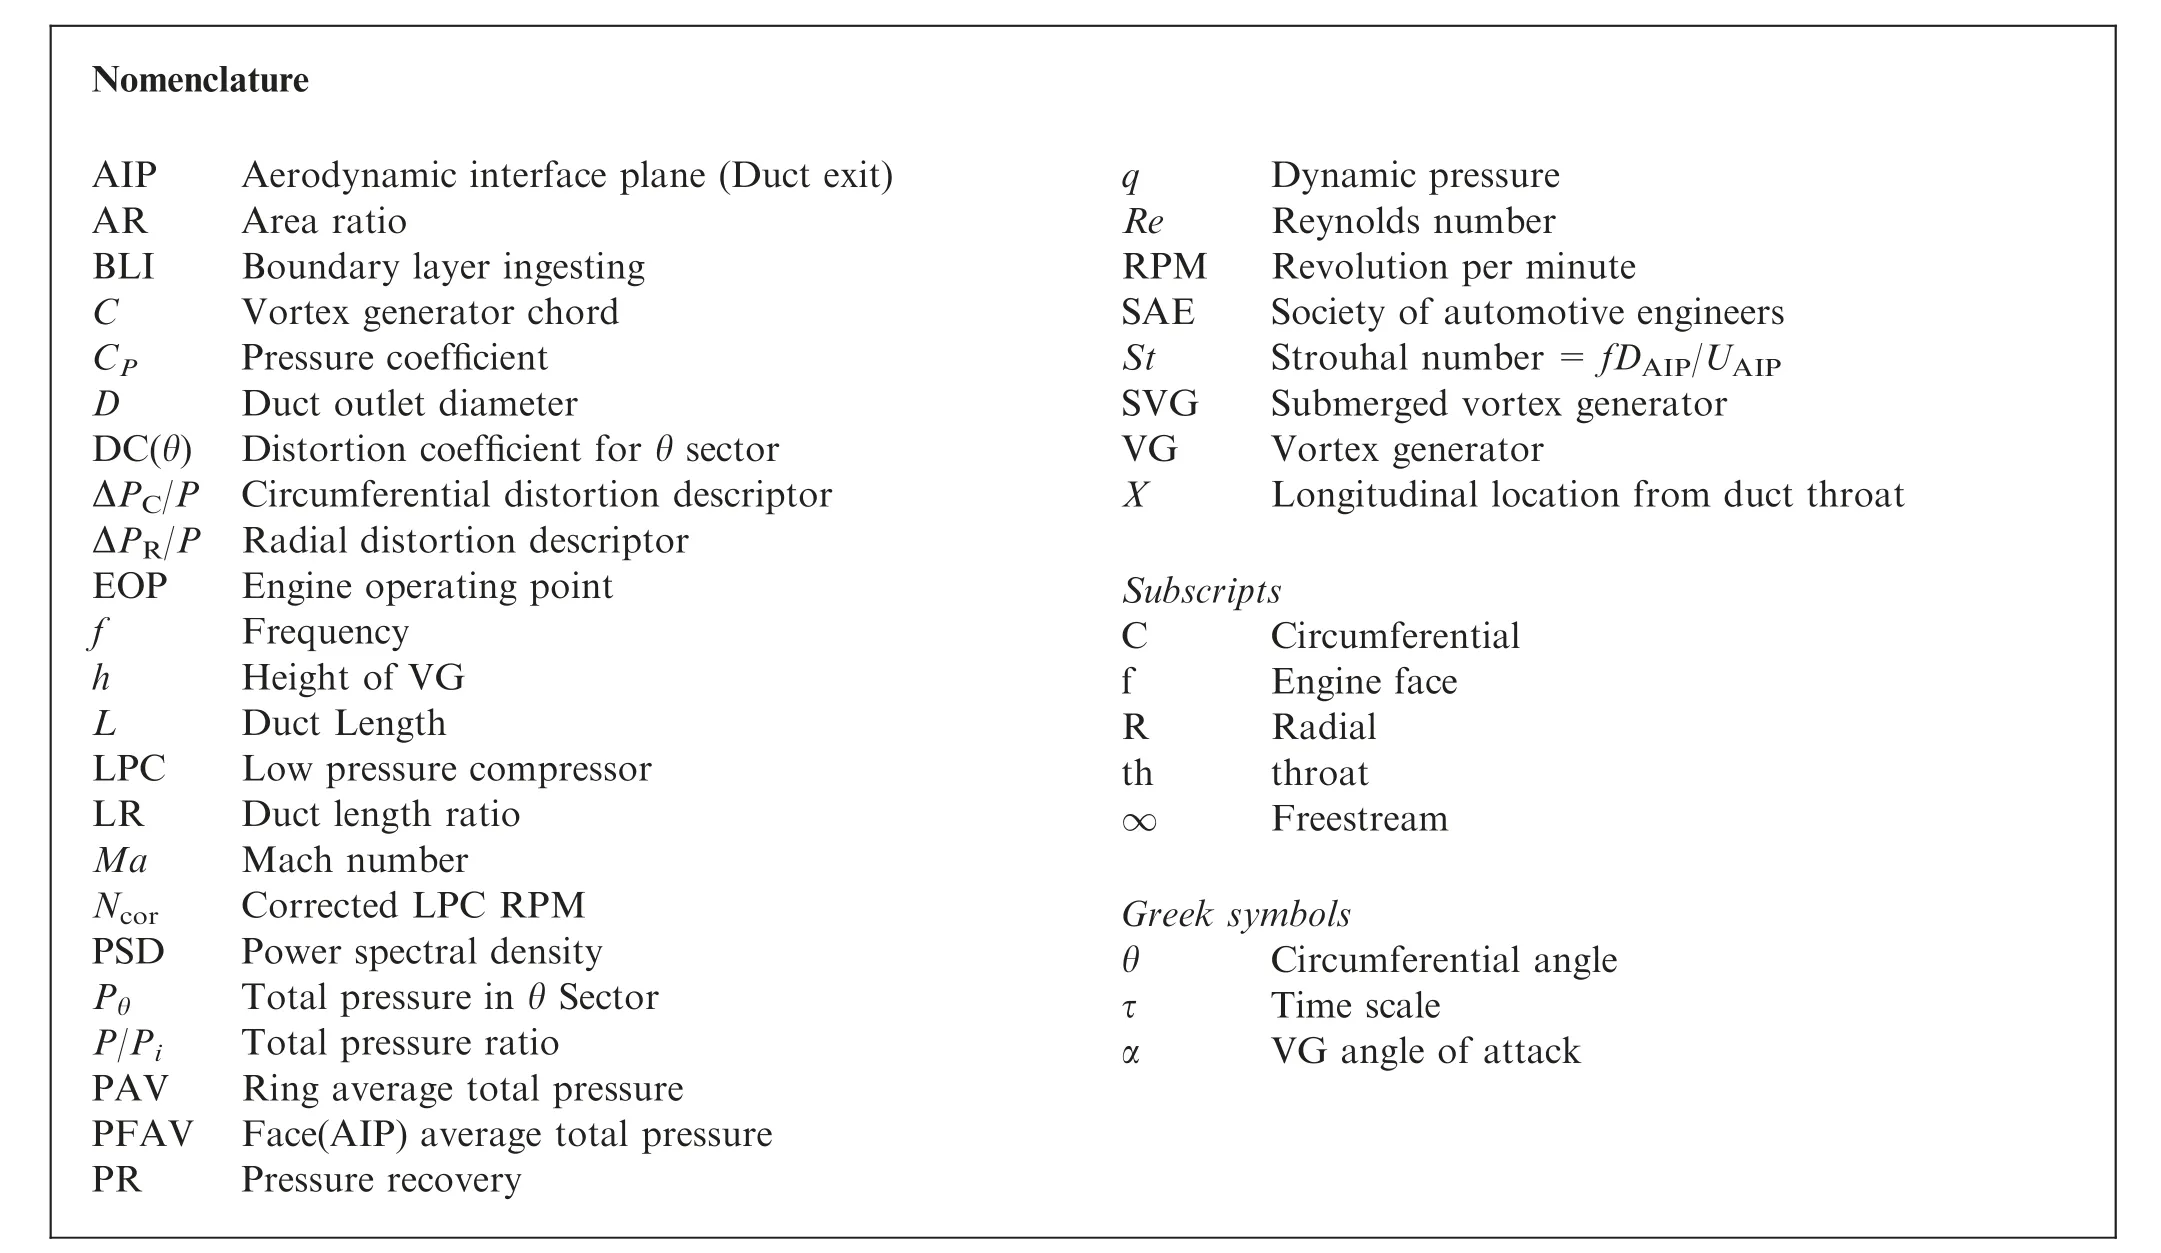
Nomenclature AIP Aerodynamic interface plane (Duct exit)AR Area ratio BLI Boundary layer ingesting C Vortex generator chord CP Pressure coefficient D Duct outlet diameter DC(θ) Distortion coefficient for θ sector ΔPC/P Circumferential distortion descriptor ΔPR/P Radial distortion descriptor EOP Engine operating point f Frequency h Height of VG L Duct Length LPC Low pressure compressor LR Duct length ratio Ma Mach number Ncor Corrected LPC RPM PSD Power spectral density Pθ Total pressure in θ Sector P/Pi Total pressure ratio PAV Ring average total pressure PFAV Face(AIP) average total pressure PR Pressure recovery q Dynamic pressure Re Reynolds number RPM Revolution per minute SAE Society of automotive engineers St Strouhal number=fDAIP/UAIP SVG Submerged vortex generator VG Vortex generator X Longitudinal location from duct throat Subscripts C Circumferential f Engine face R Radial th throat∞ Freestream Greek symbols θ Circumferential angle τ Time scale α VG angle of attack
https://doi.org/10.1016/j.cja.2019.12.002 1000-9361 © 2020 Chinese Society of Aeronautics and Astronautics. Production and hosting by Elsevier Ltd.This is an open access article under the CC BY-NC-ND license(http://creativecommons.org/licenses/by-nc-nd/4.0/).separation of turbulent boundary layer and formation of secondary flow structures inside the duct. The separation phenomenon results in reduced total pressure, increased distortion,and increased swirl at the engine face as well.Total pressure distortion can be detrimental to the operability of engine compressor.Also,it triggers the vibration of the blades and lowers the surge margin.
Passive and active flow control methods have been extensively studied in highly compact diffusers, with the aim of improving flow loss metrics at the AIP.In the passive method,the mechanical Vortex Generators (VGs) are used in a row to attenuate pressure losses and flow separation. In the active method, continuous1or pulsed jet stream is blown into the boundary layer by jet VGs.
A single angled row of microjet VGs was installed at the upstream of the second bend in a serpentine inlet (L/D=3)to counteract the secondary flow inside the duct.2With a bleed rate of 1% (Math=0.55), the maximum of 70% and 40%reductions in distortion coefficient were achieved at the design(cruise)and off-design conditions,respectively.Bleed flow control method was employed at a BLI inlet duct.3At the maximum bleed flow of 2%, distortion intensity was reduced by an average of 19%-36% inside the duct.
Two sets of 20 blowing jets were computationally studied on the serpentine duct (L/D=4.2) upper and lower walls in five separated and integrated arrangements.4The jets blowing mass flow ratios were 1%and 2%,respectively.Total pressure recovery of the best flow control schemes(C3 and C5 schemes)was increased over 3% and DC(60°) and ΔPC/P distortion metrics were decreased over 60% at blowing mass flow ratio of 2%.
Several numerical investigations of flow were conducted in order to validate computational models inside the convoluted ducts.5,6Two in-house and commercial codes were assessed and compared with experimental results inside a baseline serpentine duct.5The in-house code predicted the flowfield more accurately than commercial one. Five different turbulence models were compared with experimental results in three cases of the baseline, passive and active flow controls inside a convoluted inlet.6The 7-equation model based on omega equations outperformed the others at predicting the lower wall separation region and the flowfield at AIP plane.
The vane type VGs (C/Dth=0.168, α=26° to 28°, h=2-3 mm) and microjet flow control were compared inside an S-duct inlet (L/D=2.5).7The distortion and turbulence fluctuations results showed dramatic improvement (as much as 50%) of vane VGs over the active control case.
A single array of vane type VGs (C/D=0.09,h/D=0.09,α=22°)was employed inside the serpentine inlet(L/D=6.2)in order to improve flow uniformity.8VGs suppressed separation at the duct upper surface and distortion was decreased from 11.7% to 2.3%. The total pressure recovery was decreased as compared to the baseline case, which may be attributed to the counter rotating configuration of VGs.
In rectangular cross-section S-ducts (L/D=4.3), a sort of trapezoidal shaped submerged-vortex generator was applied in four combinations (4 locations and numbers).9In another research endeavor,10fishtail type,submerged vortex generators were investigated in an S-shape rectangular duct, and their positional parameter was changed during the optimization process. The results indicated that DC(60°) distortion coefficient reduced up to 16% in the best design point.
Applying hybrid passive and active method, distortion was reduced up to 35%, in comparison with the case without flow controls.11
Flow control was experimentally conducted in an S-shaped diffuser using mechanical VGs and pulsed microjets at MaAIP=0.2 and MaAIP=0.4.12The passive VGs (h/D=0.036,α=18°)caused further improvement as compared to the pulsed and steady jet VGs. Results showed 56% and 33%reductions in DC(60°)coefficient and total pressure peak fluctuations, respectively.
A unique bump shaped static VG was installed in front of a submerged S-shape inlet for performance improvement at AIP.13The AIP Mach number ranged from 0.25 to 0.6. VG could effectively increase pressure recovery (3.38%) at all MaAIPs by pushing away the fuselage boundary layer from the duct entrance.The DC(60°)distortion was increased below MaAIP=0.4 and remained approximately constant up to MaAIP=0.6.
Straight passive vortex generators were studied by numerical simulations in a semi-submerged boundary layer ingesting intake.14The best vortex generator sets reduced total pressure distortion by 80% with only a 0.35% reduction in total pressure recovery at the design condition. It was shown that passive flow control ensures sufficiently uniform flow reaching the engine face such that the possibility of the engine surge totally eliminated with only a negligible decrease in pressure recovery.
Several experimental and numerical investigations on flow field and passive flow control were conducted at Cranfield University on a generic S-duct configuration with different centerline offsets.15-19The geometry of the circular diffusing S-duct was similar to the one used in Ref.20
The S-PIV method was utilized for the assessment of some unsteady aspects of complex flow field.15,16The high offset duct had higher levels of dynamic and steady swirl distortion.Two coherent vertical and switching structures were determined as the most-energetic features for the both ducts. Furthermore, these studies were followed by a numerical unsteady flow field analysis.17,19Results showed the regions of unsteadiness, which were associated with the classical secondary flows as well as the streamwise flow separation.Passive flow control was studied in the S-duct inlet of Ref.15using a co-rotating pattern of mechanical VGs.18VGs suppressed the flow separation and secondary flows and relocated the AIP pressure deficit regions towards the circumference of the AIP.Results indicated that DC(60°)and pressure loss,reduced up to 50% and 30%, respectively for the mean flow field.
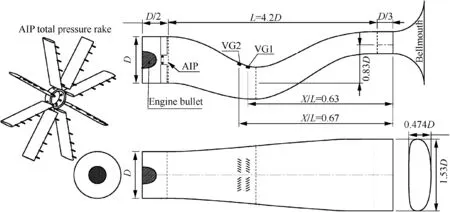
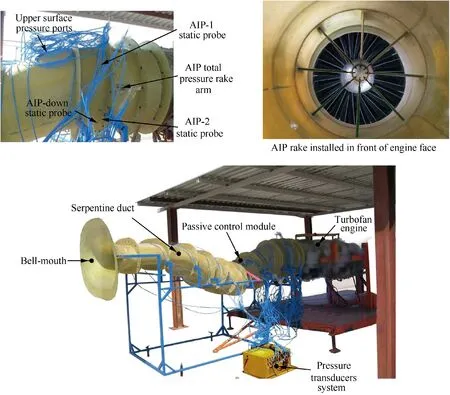
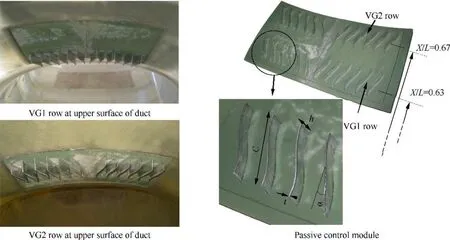
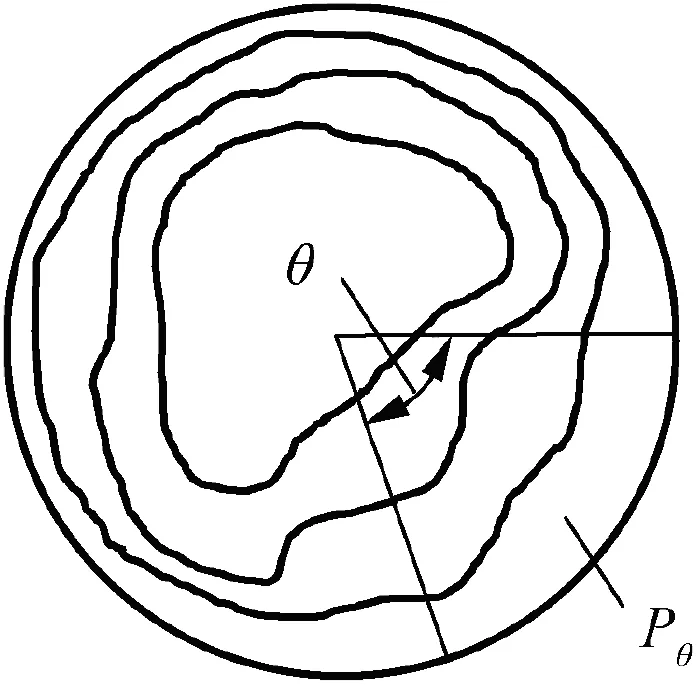
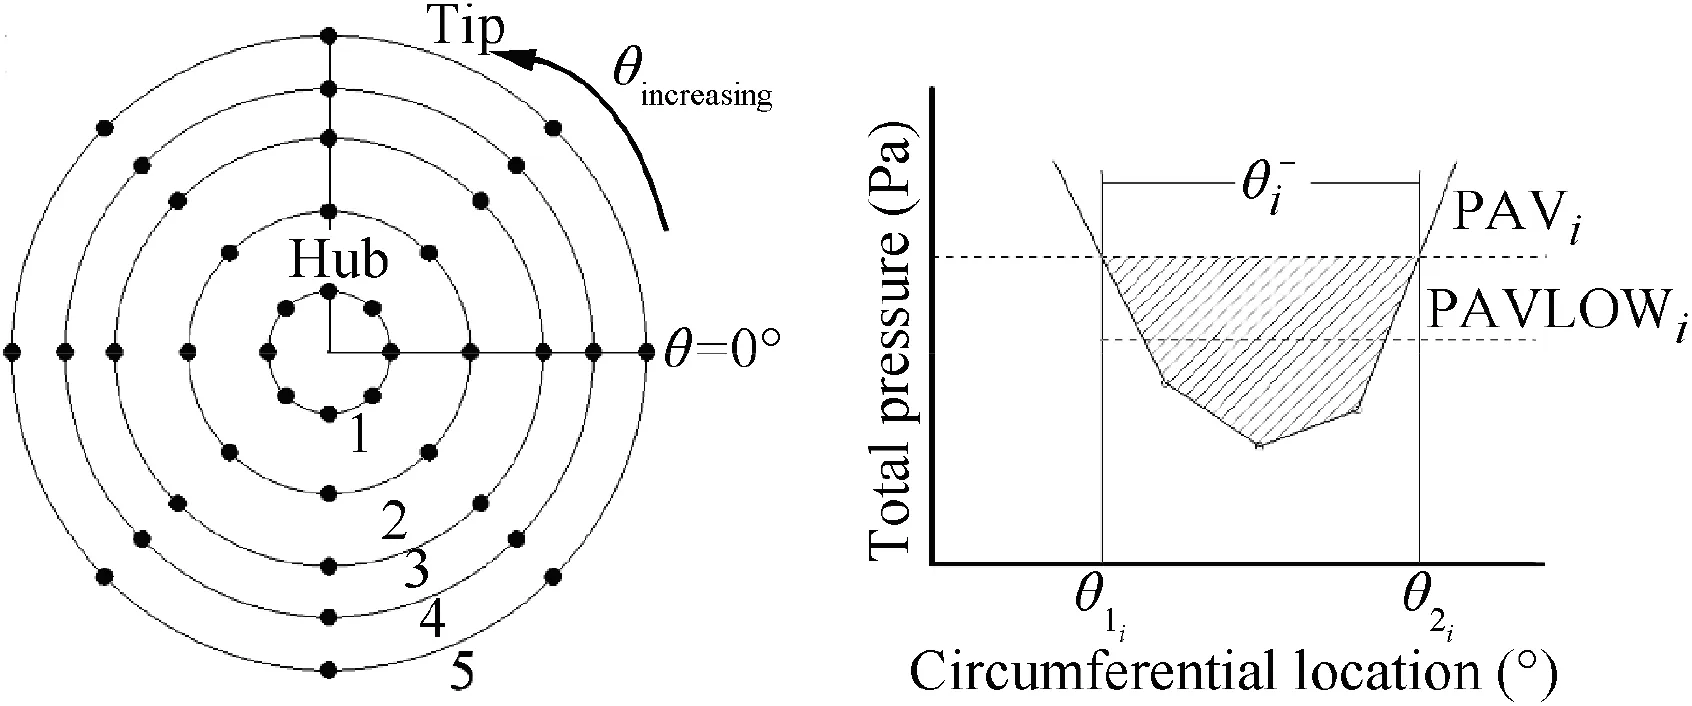
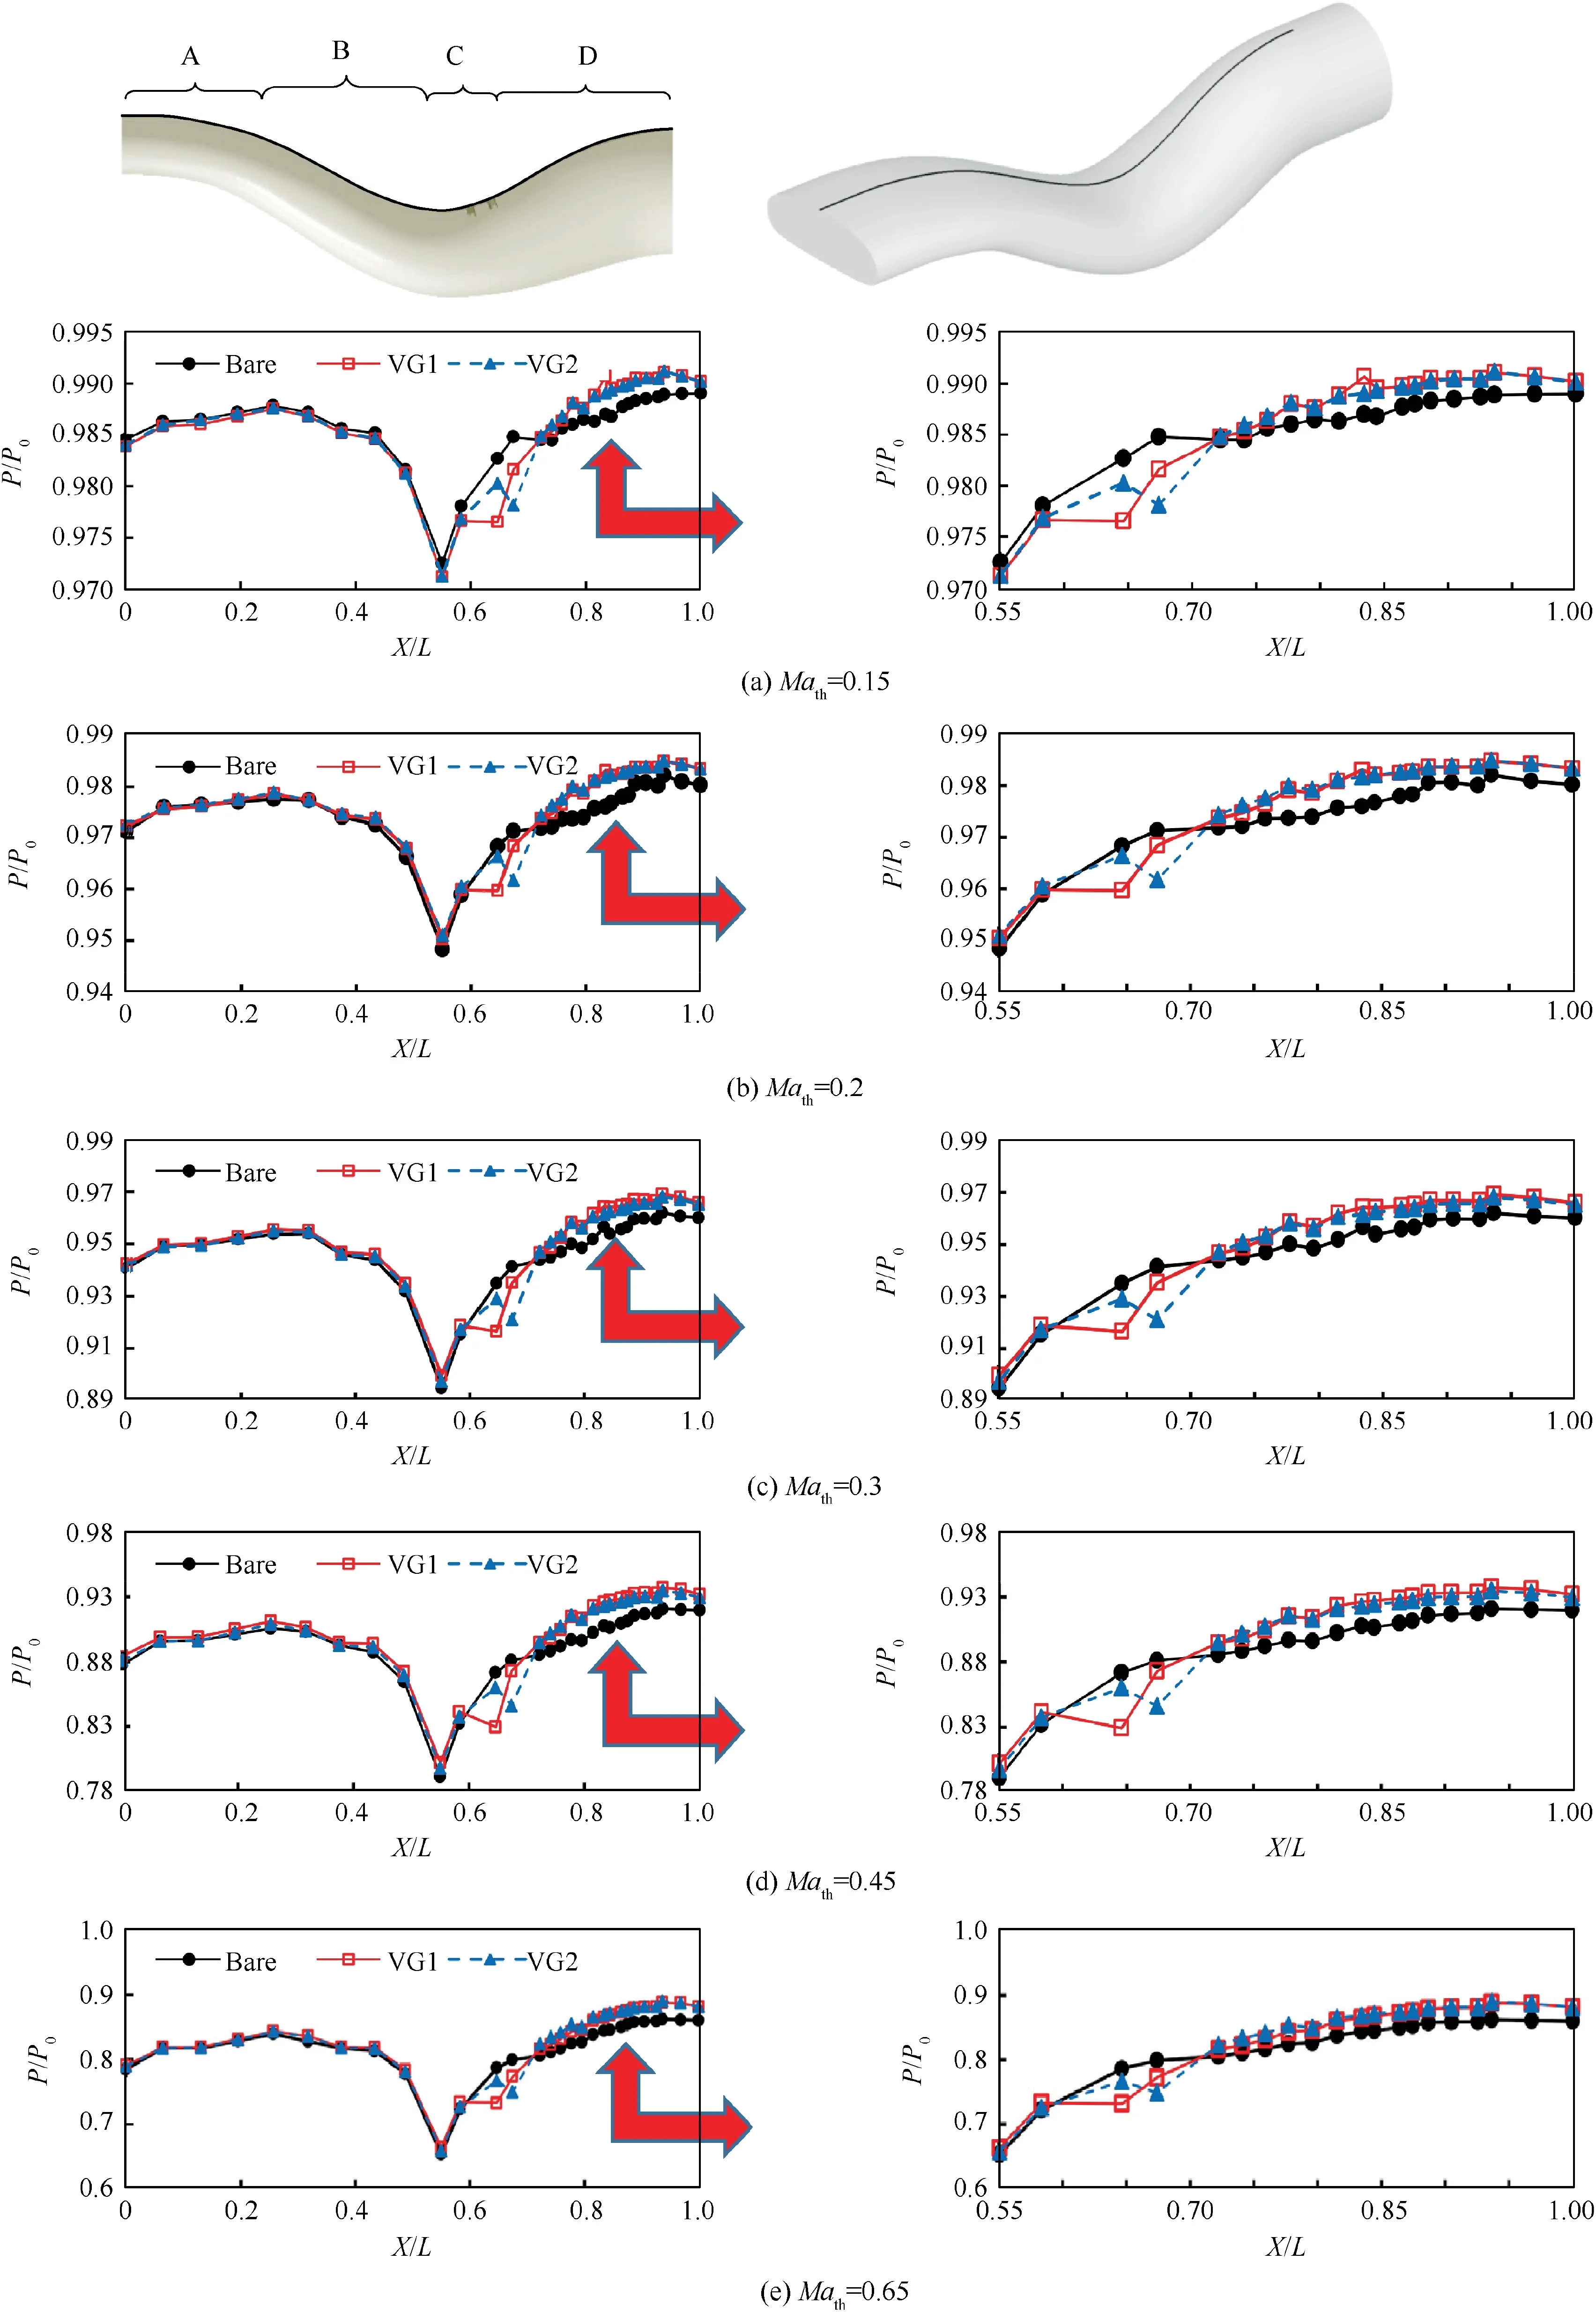
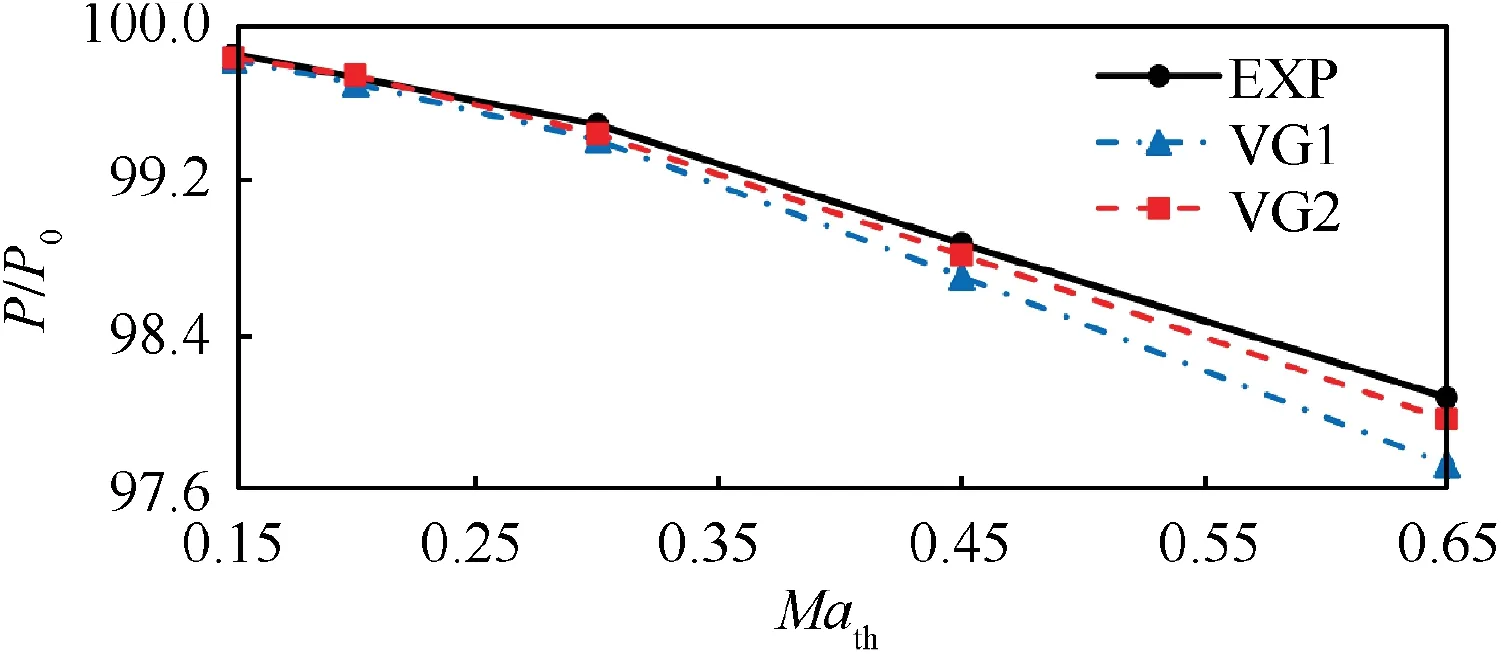
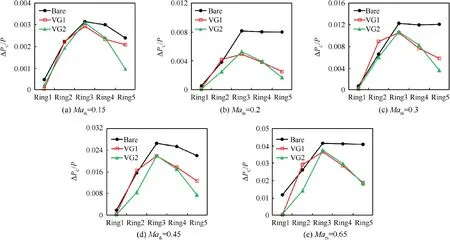
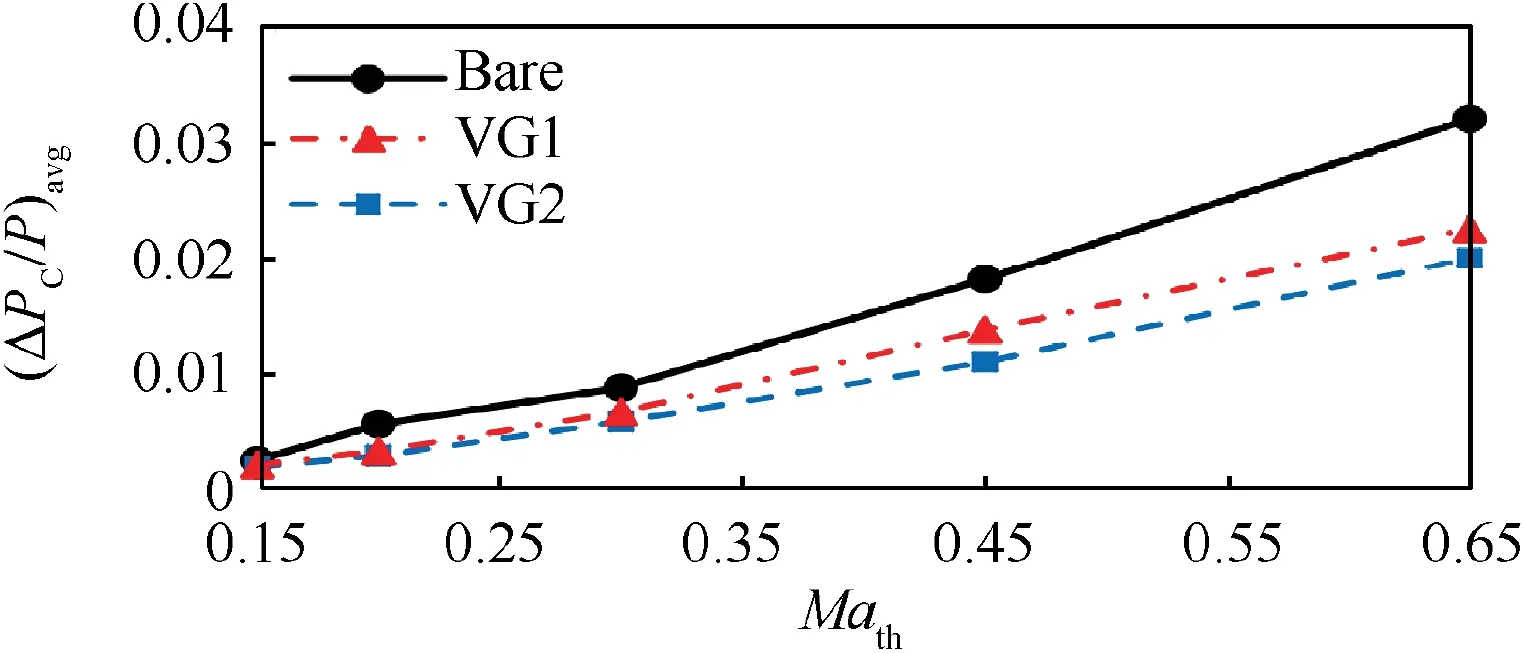
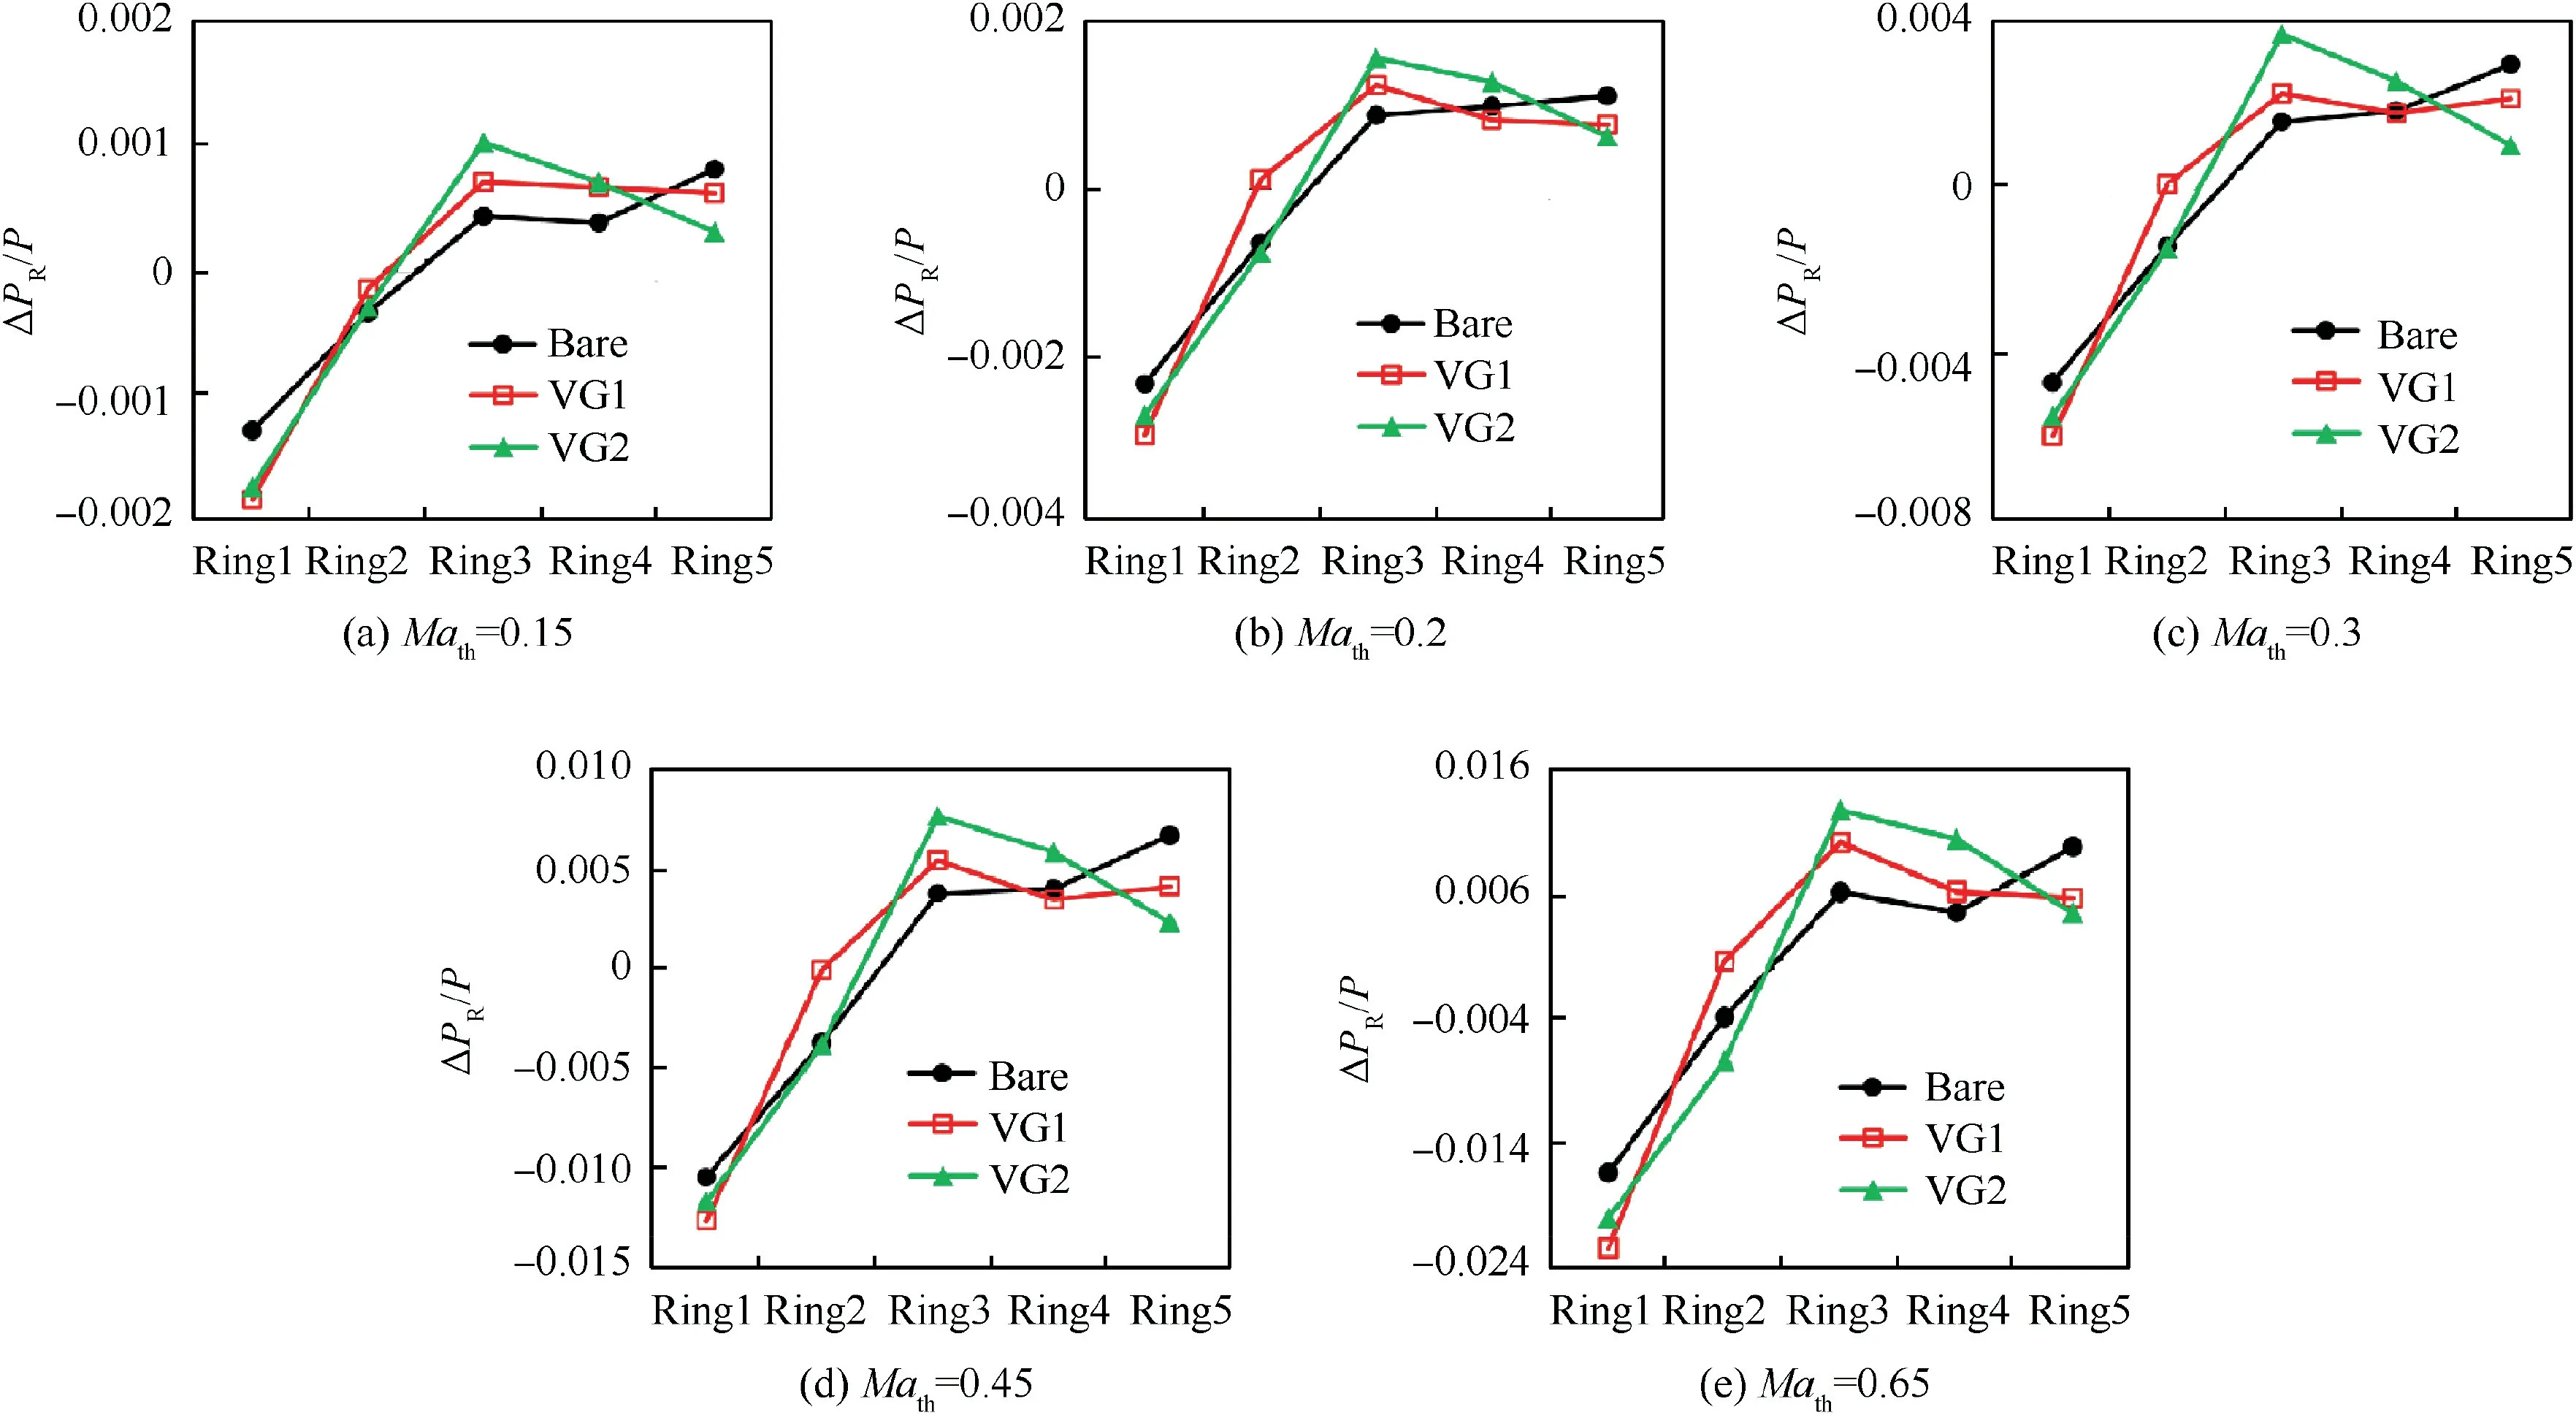
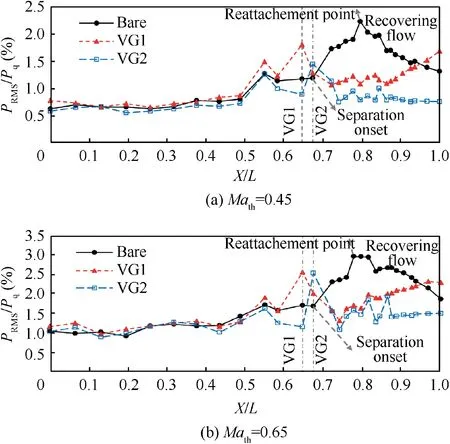
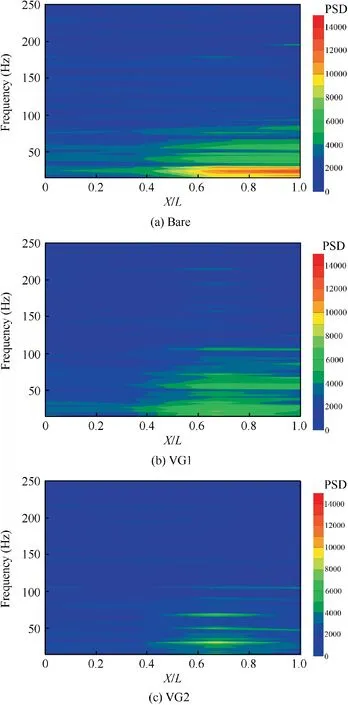
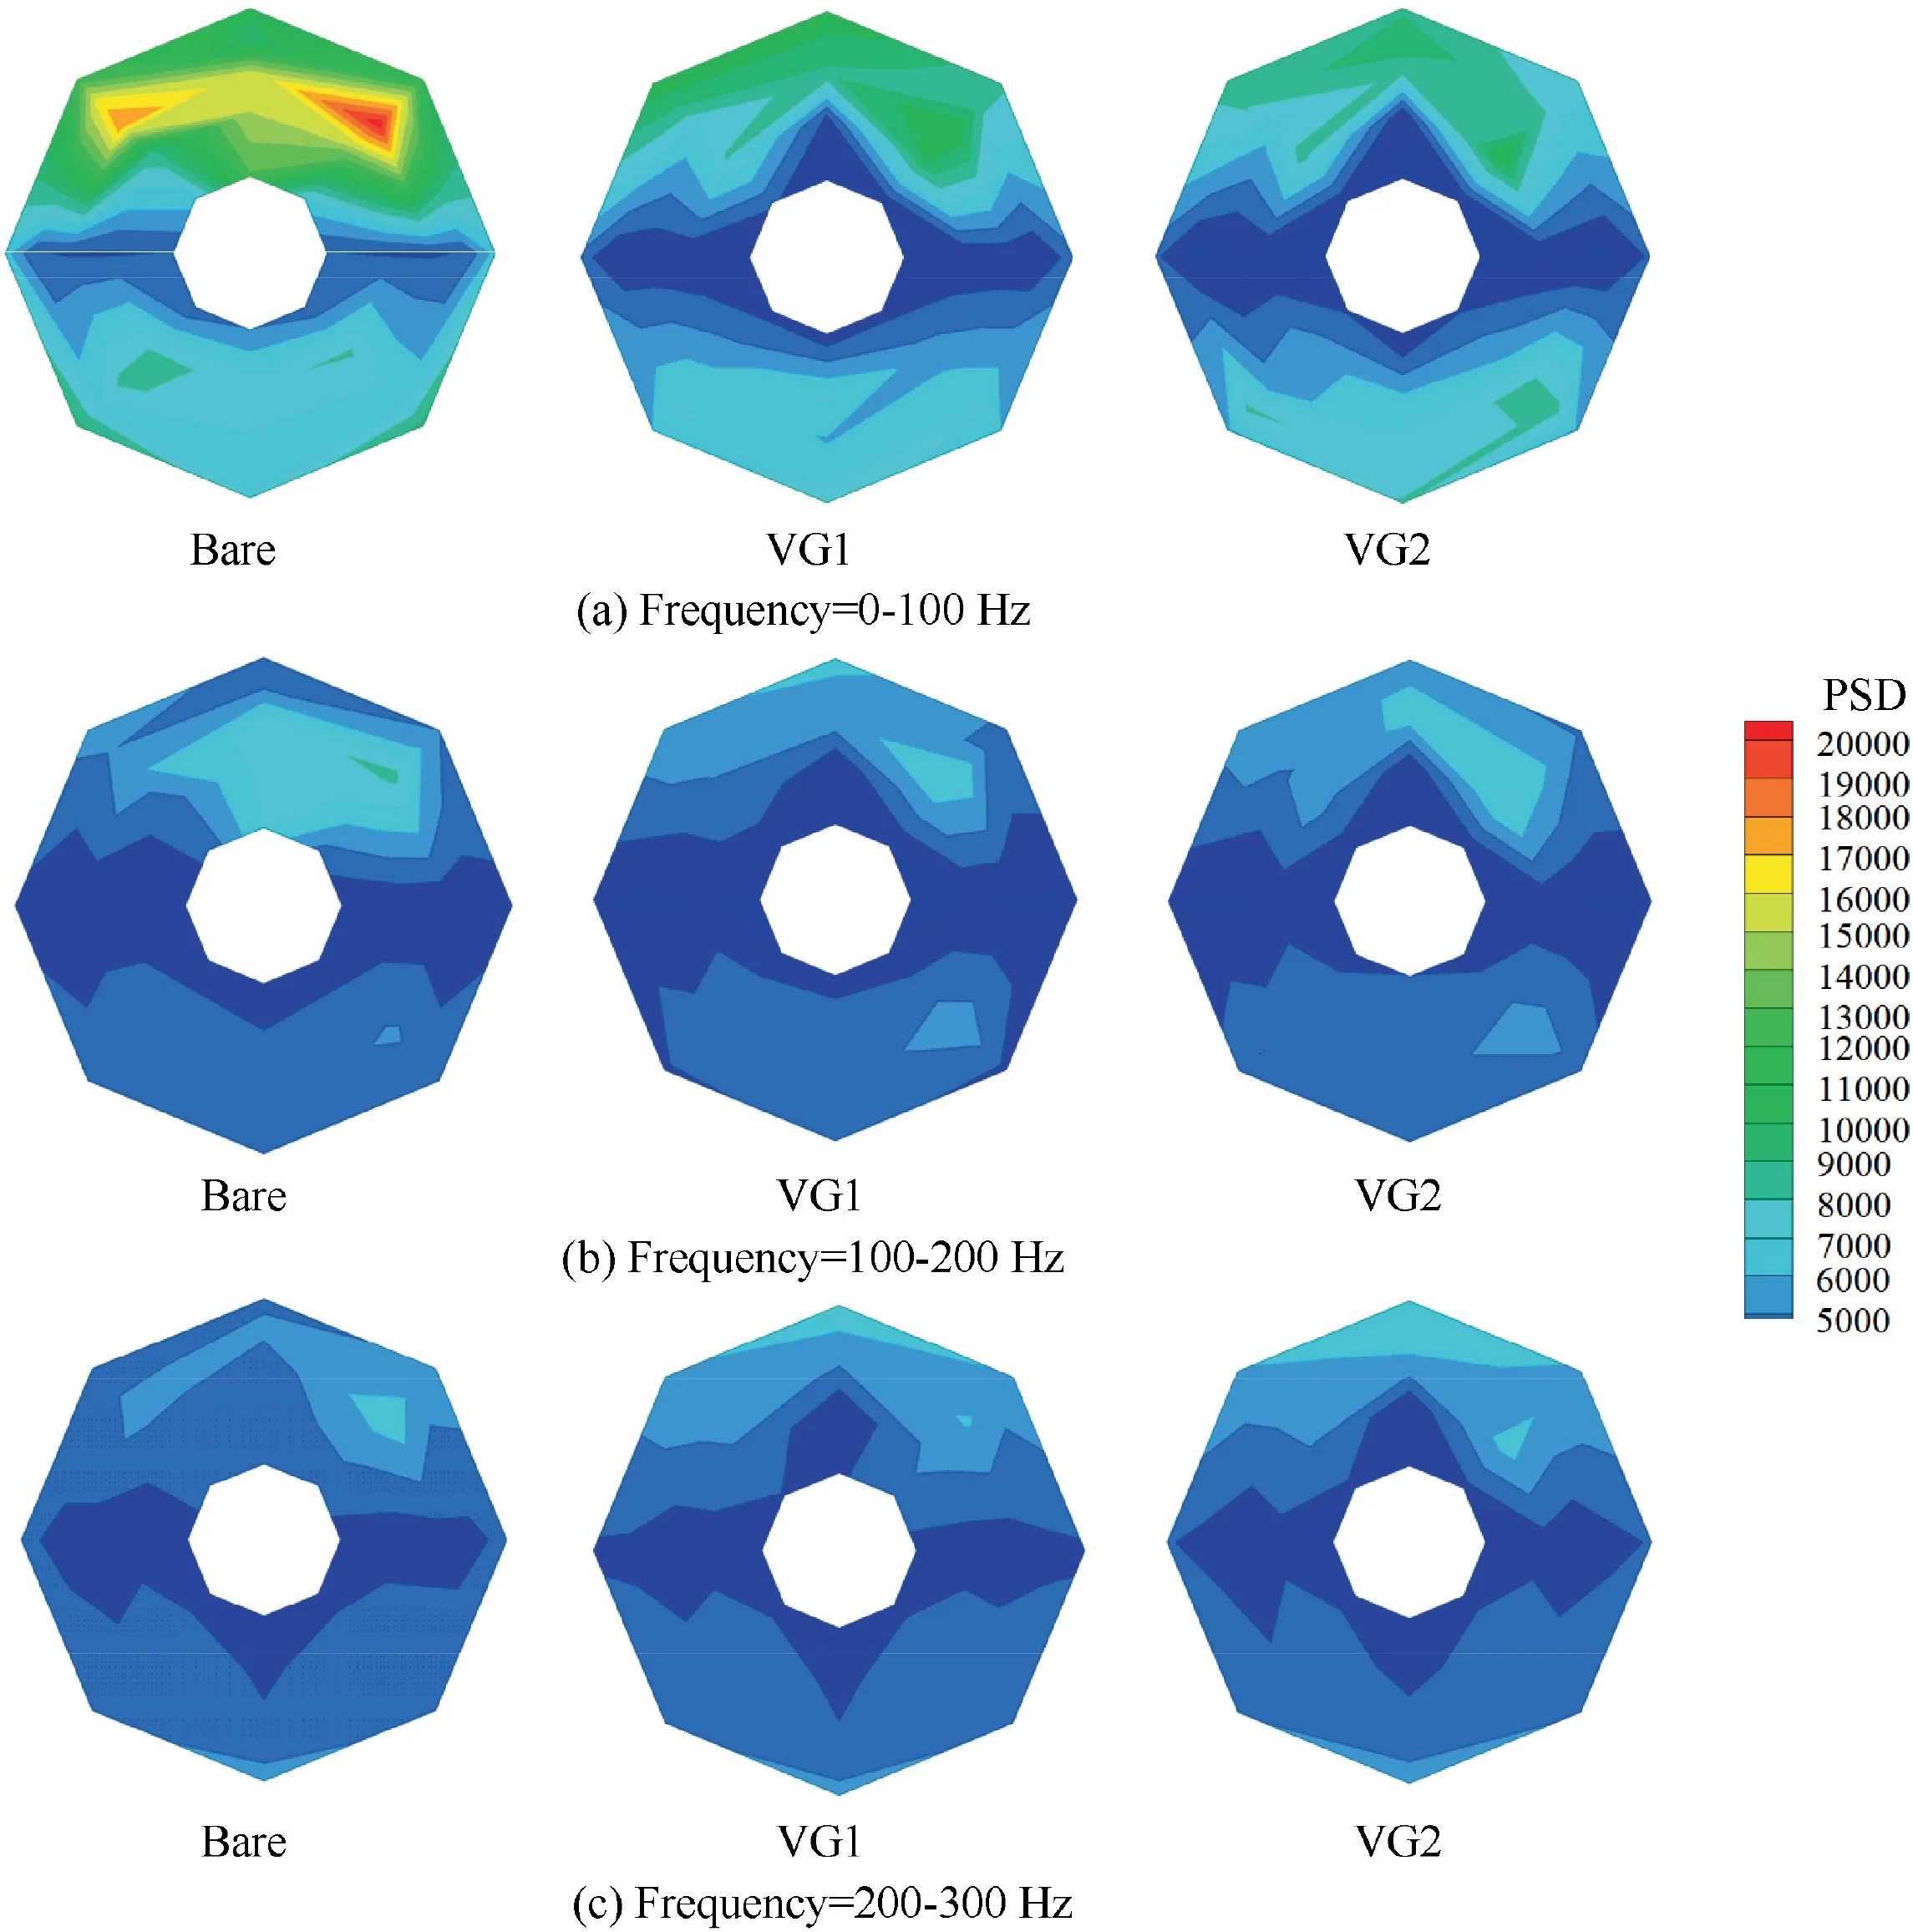
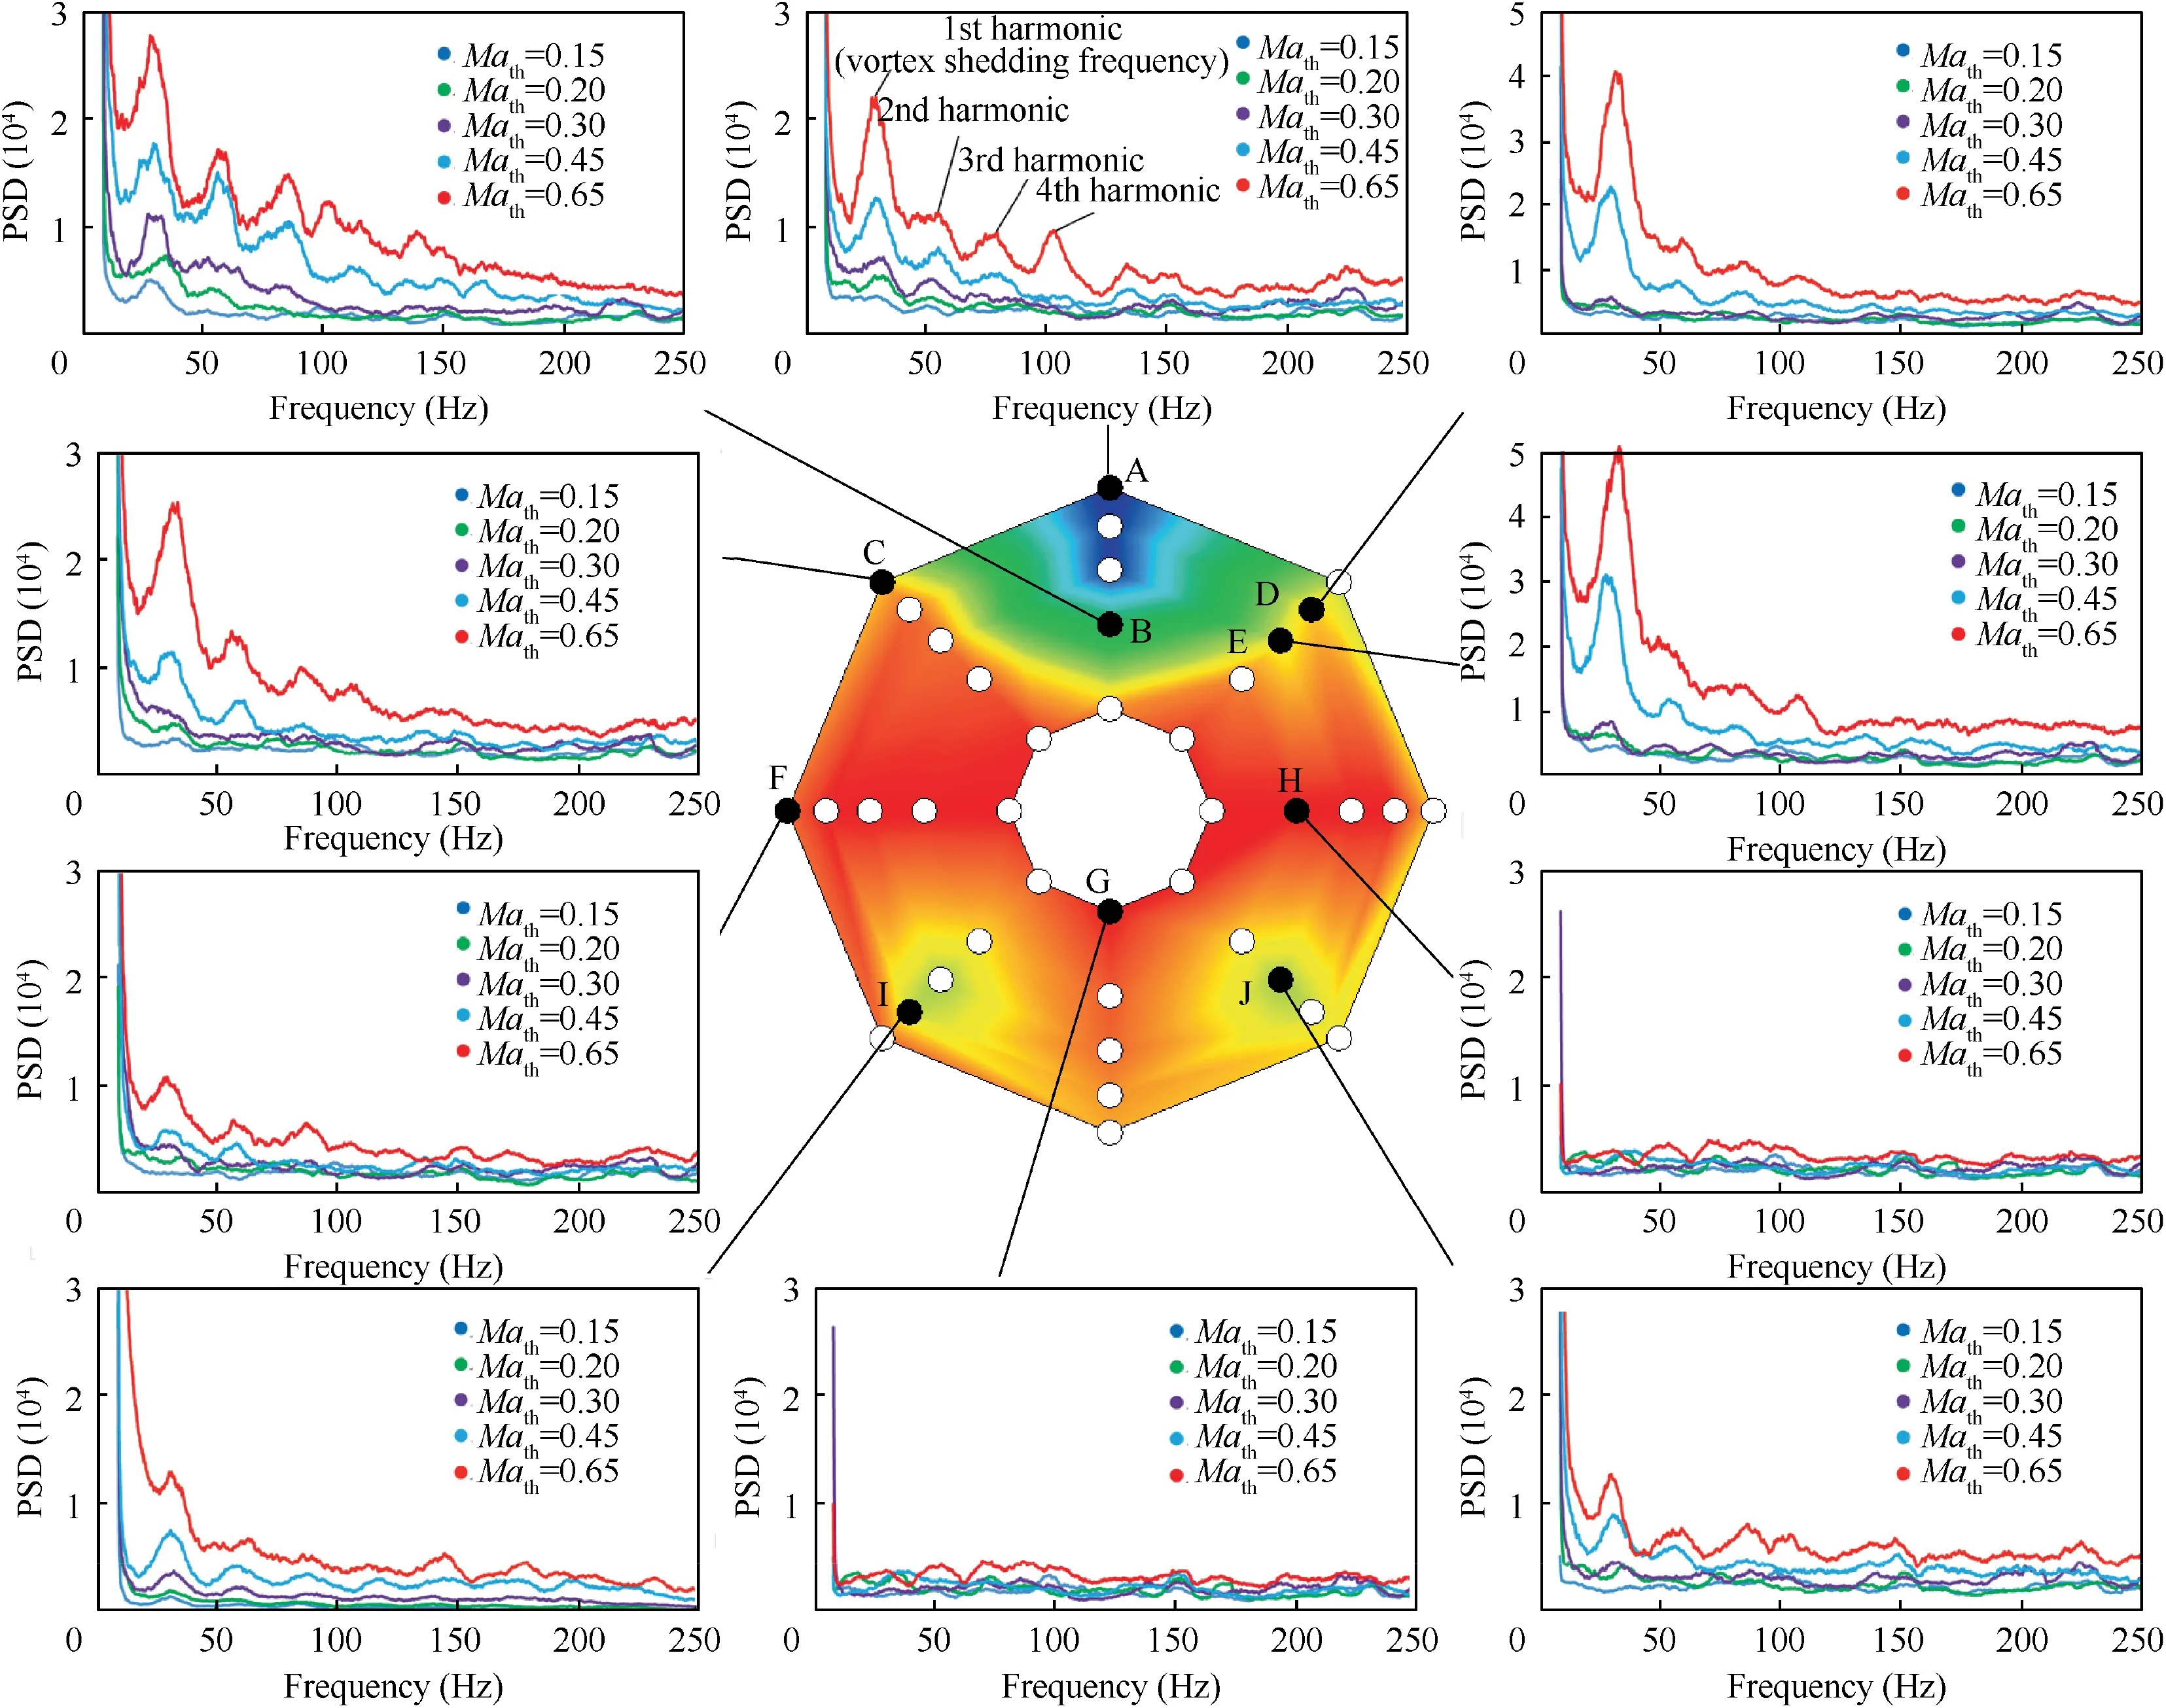
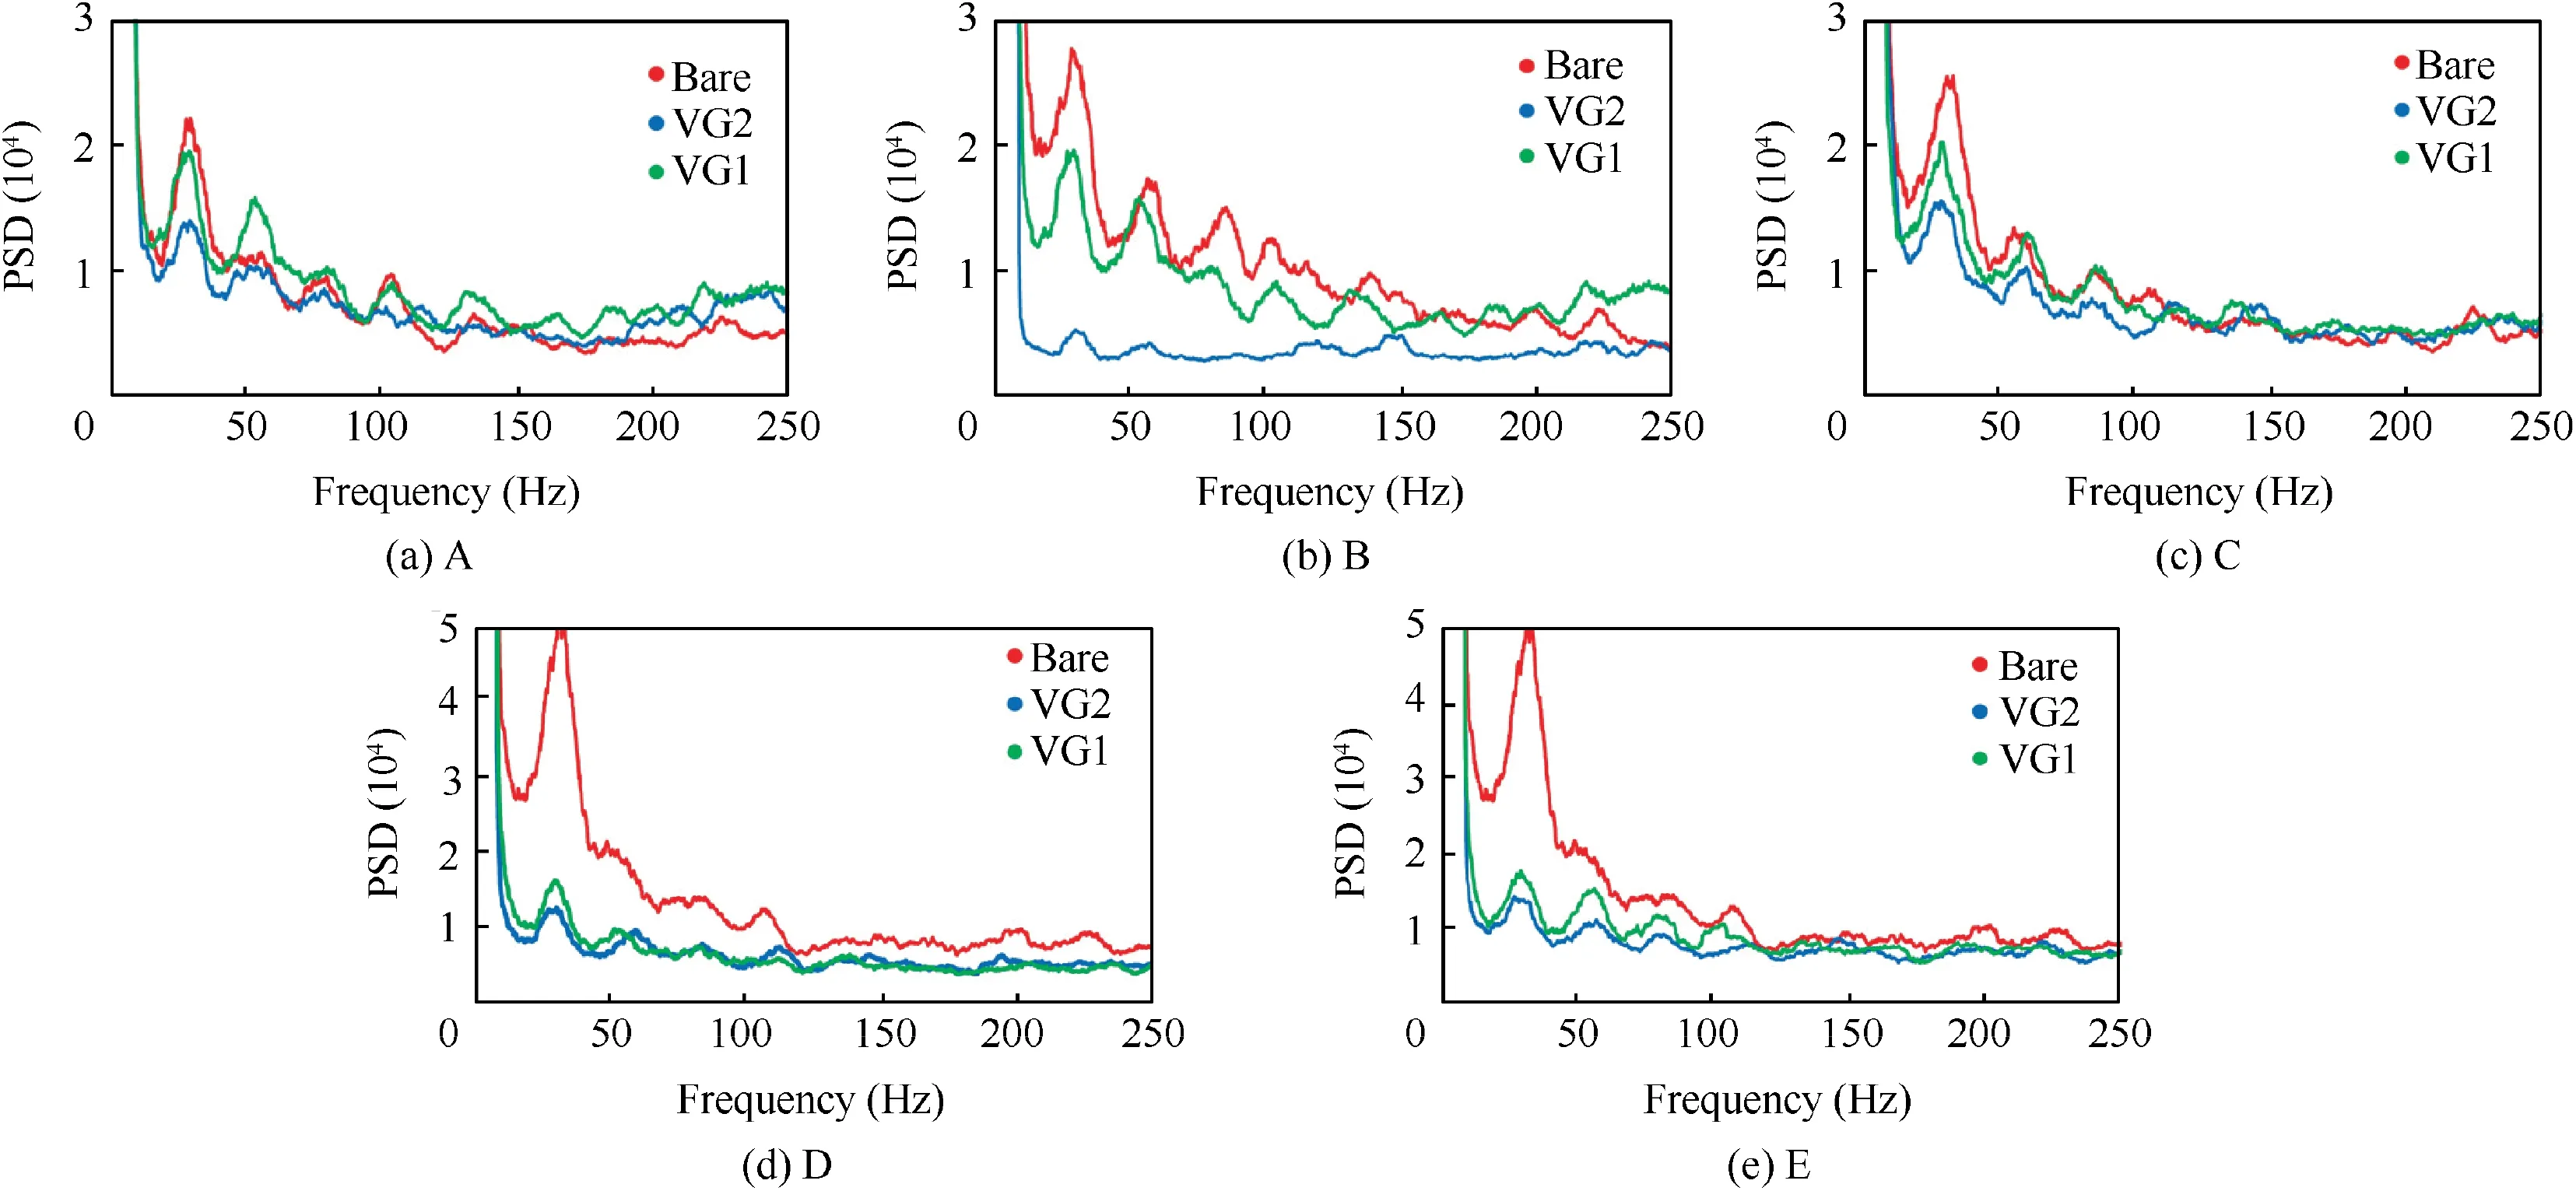
Experimental investigation of the flow in a coupled inletturbofan engine system highlighted a significant flow separation close to the AIP.21A set of six co-rotating pattern of mechanical vane type VGs was installed and tested. The VGs did not have a significant effect on flow improvement inside the duct. Then, an unsteady flow behavior was detected in one location on the duct surface within the range of 0.21 In another research endeavor, a complexly shaped inlet duct was tested with a turbofan engine. Steady state measurements highlighted the vortical flow structures inside the duct.22The AIP pressure deficit region was mitigated slightly at high engine RPMs. A large scale flow separation arose at the upper part of the duct, which was manifested by a pressure plateau. The onset position of the separation region did not change over the operating range of the engine. Furthermore, instantaneous pressure measurements at the AIP upper surface showed a flow unsteadiness within the range of 0.282 According to the survey presented above, it can be concluded that most of the previous researches were conducted on scale-down S-shaped inlet models in laboratories and there were a few works which used full-scale serpentine duct with jet engines.Moreover,the active flow control method did not use in full-scale inlet-engine researches because this system had the engine power penalty for injecting flow or drag penalty for bleeding an inlet. Regarding the distortion metrics, there is still no complete investigation on all aspects of distortion and their reductions due to flow control over the entire EOPs of a turbofan engine. In the field of passive flow control,almost all of the previous works used straight profile mechanical VGs and the optimized profile VGs have not been employed for achieving the better flow control results.In the only research of passive flow control in the duct with turbofan engine in Ref.21,VGs could not mitigate the distortion and separation of flow inside the duct. As regards the flow field study, there is a lack of literature focus on the unsteady analysis of flow on the duct surface (to determine the separation onset and reattachment points) and on AIP total pressure sensors (to determine vortex shedding characteristics at the duct exit). The present work is focused on the experimental assessment of flow behavior inside a generic full-scale serpentine inlet duct over the entire operating range of a turbofan engine. Furthermore, the new optimized profile mechanical VGs will be used in two longitudinal positions with the aim of mitigating the flow distortion at AIP and suppressing the flow separation on the upper surface of the duct. In order to give an insight into the underlying nature of the flow fluctuations inside the duct, the new aspects of unsteady analysis will be performed at AIP and on the duct surface for determining vortex shedding and the separation region characteristics, respectively. The serpentine duct of the present research was designed so that to fully obscures direct line-of-sight view of the engine face.As illustrated in Fig.1,the serpentine duct assembly features a length-to-diameter ratio of 4.2 and the diffusion area ratio of Ainlet/Aexit=0.8. The bean-shaped elliptical inlet section is followed by a dual-turn offset diffuser to the exit section(AIP). Two straight constant cross-section ducts, one in the inlet (throat) section with the length of D/3 (to simulate the boundary layer development over a fuselage forebody) and the other at the end of the duct with the length of D/2(to align the flow parallel to the engine axis) were connected to the serpentine duct.Moreover,a bellmouth contraction with an area ratio of 6.2 was employed for smooth ingestion of the surrounding air. The total pressure data acquisition plane, called AIP,was located at a distance of D/2 upstream of the turbofan engine inlet face (Figs. 1 and 2). Fig. 1 Schematic of serpentine inlet and AIP total pressure rake. Fig. 2 Serpentine duct static test assembly with pressure data acquisition system and university laboratory turbofan engine. The SAE standard rake,23,24which comprised of 40 total pressure probes, was designed and installed for the total pressure data acquisition at AIP (Figs. 1 and 2). The rake consists of eight equiangularly spaced arms, each of which contains five probes.In radial direction,the probes were located at the centroids of equal area sectors.The rake arms section had a symmetrical airfoil profile to ensure the minimum interference with their upstream and downstream flowfields. The rake area blockage ratio was less than 10%of AIP,which did not significantly change the flow behavior in comparison with the nonrake duct.25 The upper surface of the duct was equipped with approximately 50 static pressure ports to obtain the surface pressure distributions (Fig. 2). The number of ports was increased in the separation region for higher resolution of pressure measurement. In order to assess the dynamic pressure,Mach number,and mass flow rate, the duct walls at each of AIP and throat sections were instrumented with six circumferential static pressure ports. The pressure data acquisition system is comprised of two 40 Honeywell 143PC05D and 142PC01D differential transducers,with their measurement ranges being 0-5psi and 0-1psi, (1 psi=0.006895 MPa) respectively. The data acquisition box was connected to the NI-Cdaq-9188X chassis with three NI9205 analog input modules, with each having 32 channels.The NI-CDAQ output was connected via a LAN cable to a PC and the voltage data was simultaneously saved by a Labview program. Calibration of pressure transducers was performed by a digital manometer and the linear gradient of the pressure-voltage diagram was plotted for each of the transducers. The serpentine duct assembly was connected to a 4500 pound-force turbofan engine at the MUT university Aero-Propulsion Research Laboratory. The tests were conducted at five EOPs or RPMs between 56% (idle) The static and total pressure values were measured relative to the ambient pressure (Pamb), which was recorded at a fixed location within the test site.The tests were performed in 4 days with different ambient conditions, and therefore, the EOPs were defined as the corrected Low Pressure Compressor(LPC) RPM (Ncor) relative to the sea level LPC RPM of the turbofan engine. For assessing the uncertainty in the present research,at first the uncertainty of the pressure transducer system was calculated based on a method presented in Ref.26and the results are tabulated in Table 1. Once the uncertainties of the measured values are known,the uncertainty propagates to a calculated quantity through a formulation developed in Ref.27An estimate of the uncertainty levels for the key parameters is provided in Table 2. As shown in Table 2, for every calculated quantity, the uncertainty is very small in comparison with its nominal value,giving confidence that these results are sufficiently accurate to support the conclusions of this research. In order to prove repeatability of the results, data acquisition was repeated three times for each RPM such that the duration of each data sampling was set for 10 s. If the difference between the measured data was less than 1% in 3 replicates per RPM, the results would be confirmed. The vortex generator pattern used in this study was chosen as the optimal design points of Ref.28comparing the numerical analysis of straight and S-type profile VGs. S-type VGs were more effective in separation control than the straight VGs with equivalent heights.In Ref.28the profile of the straight VGs has changed to S-type profile by using the results of the geometrical sensitivity analysis of the Adjoint based formulation. The goal of the sensitivity analysis was to minimize the pressure loss at the duct exit. Besides the shape optimization of the VGs, their longitudinal location (3 positions), VGs height (2 heights), VGs length (2 lengths) and VGs angle of attack (3 angle of attacks) were also investigated for about 60 design points and finally the optimal points were selected for the present work. The optimal design points had the minimum flow loss metrics in three aspects of distortion,swirl and total pressure loss at AIP. Table 1 Measurement system uncertainty. The removable flow control module (printed by the ABS material based on the curvature of the duct surfaces at the VGs location) with two rows of co-rotating S-type VG vanes was integrated into the duct design over the upper downstream surface which triggered the massive flow separation (Fig. 3). VG rows had 12 aluminium VGs(6 in the right and 6 on the left sides of the duct symmetry plane) which were separately installed in the two longitudinal locations of X/L=0.63(VG1) and X/L=0.67 (VG2) on the control module(Fig. 3). Length, height and profile angle of VGs were C/Lduct=0.025, h/DAIP=0.042 and α=30°, respectively. Several metrics have been proposed to quantify flow loss at the duct AIP. The aerodynamic behavior of the flow at the duct outlet is quantified by the total pressure loss, and the stability pressure ratio is assessed by distortion descriptors. 3.3.1. Total pressure loss coefficient Total Pressure Loss Coefficient(PLC)of the duct is defined as the difference between the ambient and the duct exit (AIP)average total pressures, normalized by the free-stream total pressure.29 3.3.2. Distortion descriptor first definition (DC(θ)) In this approach,the distortion coefficient is defined as the difference between the engine face or AIP average total pressure(Pf)and the lowest average total pressure in any sector defined by a critical angle of θ (Pθ) at the exit plane, which has been normalized by the dynamic pressure at the duct exit.29 In most cases,the theta angle is considered to be 60°or 90°.In Fig. 4, the maximum total pressure loss sector for calculating the DC(θ) coefficient is shown. 3.3.3.Distortion descriptor second definition(ΔPC/P&ΔPR/P) This definition is known as the circumferential and radial distortion coefficients, which are expressed by the ΔPC/P and ΔPR/P factors.23,24 Fig. 3 Mechanical vanes rows installation in VG1 and VG2 locations on upper surface of duct. ΔPC/P coefficient depends upon the number and size of pressure deficit regions in AIP. This type of measurement is executed by the standard total pressure rake with five rings(Fig. 5). The average total pressure of the maximum loss region of the ring and circumferential distortion intensity is calculated as follows.23,24 The radial distortion intensity is the difference between the ring average pressure (PAVi) and the face average pressure(PFAV) for each ring. Using Eq. (4), the radial distortion intensity is calculated as. The tip-radial-distortion intensity(ΔPR/P)tipwas defined as the largest of radial-distortion intensities for the two outer rings, and the hub-radial distortion (ΔPR/P)hubintensity was defined as the largest of the radial-distortion intensities for the two inner rings. Fig. 4 60° loss sector for calculating DC(60°) distortion coefficient. Fig.5 AIP 40 pressure transducer locations in 5 rings and ΔPC/P calculation graph at the i-th ring. Mach and flow rates at the throat and AIP are calculated via static pressure drop. The throat and AIP Mach increase from 0.15 and 0.13 (Re=1.5×10⁶) at idle EOP (Ncor=56%) to 0.65 and 0.48 (Re=5.5×10⁶) at max EOP (Ncor=100%),respectively(Fig.6). This indicates that the flow is decelerated inside the duct and reaches the engine demanded velocity at AIP. The experimental total pressure contours at AIP of the bare and flow control ducts are shown in Fig. 7. At the bare duct case,a large total pressure deficit region arises in the upper half of the AIP in all throat Mach numbers. This pressure drop is associated with the massive separation of flow in the aft bend upper surface of the duct.Increasing the throat Mach number increases the observed loss at the duct exit.The maximum loss at the upper part of the AIP increases from 0.85% at Math=0.15 to 11% at Math=0.65. In the lower half of the AIP,two detached and weaker loss regions are formed symmetrically on both sides,which are not clearly discernible in all cases.The origin of these regions is the classical secondary flow structures inside the duct.There is also a slight drop at the bottom of the AIP, which is attributed to the boundary layer buildup at the lower surface of the duct.The total pressure probes at the center of the AIP measure the modest losses, which indicate the high overall pressure recovery in this region. Fig. 6 Mach and Reynolds variation at AIP and throat. For the passive suppression of flow distortion, two VG rows(see Section 3.2)were installed separately in the direction of the flow on the upper surface of the duct,and the tests were repeated in the same throat and AIP Mach numbers as the bare duct. The total pressure contours at flow control cases are characterized by two upper right and left loss regions at AIP (Fig. 7), which is in agreement with the result of Ref.12for the S-duct flow control by mechanical VGs.VGs can effectively redirect the separation-prone flow towards the upper right and left sides of the duct and relocate the pressure deficit region towards the circumference of the AIP. Consequently,the separated flow structures are generally suppressed. It can be observed that the extent of the upper right and left pressure deficit regions in VG2 case is lower than that of VG1 at all throat Mach numbers, which indicates the higher efficiency of the closer VG row to the AIP. From the physical point of view, it can be inferred that the VG1 row is installed at the upstream position of separation onset,so the VGs interfere with the clean flow before the separation occurs and induce the forced vortices towards the left and right sides of the duct. These vortices are less likely to remain attached to the duct wall and their resultant AIP losses are located in a more central position as compared to the VG2 case. In VG2 case the low momentum flow at separation onset region is directed toward the side walls via VGs. These vortices remain closer to the upper wall and their AIP loss regions have smaller size than VG1 case. The total pressure ratio contours in Fig. 7 show a slight asymmetry in the left and right half of the AIP,which is more discernible at flow control cases. This asymmetry may be attributed to the following reasons. Firstly, as the tests did not perform in the wind tunnel condition, the duct inflow is somewhat inhomogeneous. Secondly, the small geometric differences between the left and right side of the duct and asymmetrical positioning of the VG rows in flow control cases.The final and most probable reason may be the engine pumping effects on the upstream flow. Rotation of the LPC blades at high RPMs induces the static pressure distortion in corotating direction of rotor rotation (The engine rotation was clockwise). Due to this phenomenon the upstream flow is somewhat directed towards the compressor rotation direction,and consequently, the symmetry of the flow disappears inside the duct. In flow control cases the core of the upper left loss region was somewhat moved away from the upper left probes,and conversely, in the upper right side of the AIP, the upper right loss region enters the region of upper right probes. This leads to the higher total pressure loss measurement on the right side and lower loss at the left side of the AIP in flow control cases. This asymmetry also occurs in the bare duct case, but is less visible as compared to the flow control cases. Fig. 8 shows the longitudinal static pressure ratio distribution on the upper surface of the ducts.It can be seen that the pressure gradient at the duct inlet is slightly positive from the throat up to the X/L=0.257 (region A). At region B(0.257 In the C and D regions of the bare duct,the flow decelerates and becomes more prone to flow separation.The latter eventually occurs slightly downstream from X/L=0.674. At lower throat Mach numbers, the flow separation is detectable by the pressure plateau between 0.674 In 0.583 4.4.1. Total pressure recovery Table 3 and Fig. 9 show that increasing the engine mass flow leads to a greater difference between the high and low momentum fluid regions, and consequently, the total pressure recovery is reduced at AIP. The pressure recovery at max EOP(MaAIP=0.48) is 98.08, which shows a 1.92% loss at this operating point. At Math=0.45 and Math=0.65, due to the compressibility effects and thickening the boundary layer,the pressure loss is increased and the slopes of the pressure recovery charts change as compared to the lower throat Mach numbers. It can be found that the total pressure recoveries for the bare and flow control cases are almost constant over the full engine operating range. However, the flow control cases produce a slight decrease (maximum 0.347%) in the pressure recovery from the bare case.The reason is that the mechanical VGs only redistribute the low momentum boundary layer flow,so an increase in the pressure recovery would not be expected when using passive flow control devices such as VG vanes as work by extracting energy from the flow. It is postulated that the slight decrease in the pressure recovery may be related to the combination of VGs extracting energy from the flow, flow separation on or near them,and a total pressure measurement resolution at the AIP. Regarding the relevant research works on mechanical VGs in the literature, the slight effect of the VGs on total pressure recovery were also reported in Refs.11,14,30,31. Fig. 7 Experimental total pressure ratio contours at AIP of bare and flow control cases at five EOPs. 4.4.2. Distortion metrics 4.4.2.1. DC(θ) distortion coefficients. DC(60°) and DC(90°)distortion coefficients are compared in Fig. 10. At the bare case, as the throat Mach number increases to Math=0.3(Ncor=80%),the distortion values decrease and then increase at Math=0.45 (Ncor=90%) and 0.65 (Ncor=100%). This behavior is postulated to be related to the slightly unstable performance of the turbofan engine up to Ncor=80% and compressibility effect of flow at higher throat Mach numbers. Fig. 8 Experimental static pressure ratio charts over upper surface of bare and flow control cases at five EOPs. Table 3 Total pressure recovery in different RPMs. Fig. 9 Total pressure recovery versus throat Mach number. The arrangement of the VGs in both longitudinal positions effectively mitigates the distortion coefficients over the entire EOPs. The reduced values of distortion coefficients at flow control cases remain almost constant for all throat Mach numbers. The VG2 duct performance is more effective (has lower distortion values) for improving the distortion levels as compared to VG1 case, which highlights the proper longitudinal position of the VG2 row over the upper surface of the duct. It can be seen in Table 4 that the reduction in DC(90°)values is more than DC(60°)in all cases and is above 70%.However,the reduction percentage of the VG1 case at higher EOPs is reduced for DC(90°) coefficient. Regarding the DC(60°) metric, it is noteworthy that as the throat Mach number increases,the effectiveness of VGs on the VG2 duct is increased, and the reduction of distortion reaches 60.7% at Math=0.65. The maximum distortion reduction is lower in the VG1 duct and is 48.01%. 4.4.2.2. Circumferential and radial distortion intensities. The ΔPC/P factor is compared for five different AIP rings in Fig.11.It can be found that in all cases and throat Mach numbers, ΔPC/P factor increases rapidly from Ring 1 and hits the peak value at Ring 3.This is attributed to the fact that the circumferential position of maximum total pressure loss regions at the bare and flow control ducts is placed in this Ring(Fig. 7). Ring-by-ring inspection reveals that (except for Ring 2 at all throat Mach numbers in VG1 case) VGs can significantly attenuate the bare duct circumferential distortion intensity.This distortion mitigation is more highlighted in two outer rings, where the ΔPC/P factor is reduced over 30% and over 60% at Ring 4 and Ring 5, respectively. It is notable that the lower values of ΔPC/P at the 2nd and 5th rings in VG2 duct indicate the higher efficiency of this VGs position for improving distortion levels. The average of five rings ΔPC/P coefficient in the bare and flow control cases is shown in Fig. 12 over the entire engine operating range. It can be seen that the distortion increases almost linearly with respect to the throat Mach number.Flow control cases (VG1 and VG2) reduce the ΔPC/P coefficient as compared to the bare duct, of which the VG2 duct causes a greater distortion reduction. Table 5 shows the reduction of ΔPC/P coefficient in the flow control cases.The VG2 duct has a higher reduction in comparison with the VG1 at all throat Mach numbers, with the highest drop occurring at Math=0.2 (52%). The radial distortion intensity(ΔPR/P)is compared for five AIP rings in Fig. 13. The bare plots show that the radial distortion increases from Ring 1 to 5 in all throat Mach numbers,which indicates that this factor is more affected by viscous effects of the boundary layer on the inlet duct walls. This is in agreement with the results obtained in Refs.25,30,32-34The negative values of this factor in Ring 1 and 2 signifies the higher values of PAV1,2in comparison with the AIP average total pressure(PAV)at the Eq.(3).VGs can not markedly mitigate the radial distortion over the entire engine operating range. Conversely, this factor is slightly deteriorated at Rings 3 and 4, which may be associated with the large boundary layer being distributed from the upper AIP loss region of the bare configuration to the more central positions in this plane(See Fig. 7). The tip radial distortion ((ΔPR/P)tip) at Ring 5 is reduced in all operating points using VGs with the VG2 case being more effective than VG1. The maximum reductions of 65% and 67% are obtained at Math=0.45 and Math=0.3,respectively. Fig. 10 DC(60°) and DC(90°) distortion coefficients versus throat Mach number for bare and flow control cases. Table 4 Effect of flow control on reduction of DC(θ) distortion coefficients. Fig. 11 ΔPC/P coefficient of bare and flow control cases in five AIP rings at five throat Mach numbers. Fig.12 Average ΔPC/P coefficient of bare and flow control cases at all throat Mach numbers. The performance of the engine compression system is provoked by flow structures whose time scales are on-theorder-of or longer than a single revolution of the rotor blades(τfull-scale≥60/RPMmax).25,35To obtain the correct dwell time for the blades passing through the distorted region, the probe data must be low-pass filtered at a frequency corresponding to one revolution of the engine compressor blades.Therefore,the Cut-off frequency for unsteady analysis is calculated as follows.25 Considering the fact that experimental tests of this study were performed by a full-scale serpentine duct, the highest frequency of pressure fluctuation affecting the engine compressor is calculated as 250 Hz(RPMmax=15000 r/min) which is one-fourth of the sensors sampling frequency. In the present work, the large diameter (0.0045 m) and short length (L<2.5) tubes were used for transferring pressure data from the probes to the pressure transducer box.Moreover, the range of pressure measurement in this research was from 7000 to 34000 Pascals. Therefore, the time lag for unsteady analysis can be negligible. Table 5 Effect of flow control on reduction of ΔPC/P distortion coefficient. Fig. 13 ΔPR/P coefficient of bare and flow control cases in five AIP rings at all throat Mach numbers. 4.5.1. Spectral analysis in the upper surface symmetry plane The longitudinal evolution of static pressure fluctuations in the upper surface of the duct is plotted in Fig.14 for Math=0.45 and 0.65. The RMS values of the fluctuating surface pressure are normalized on dynamic pressure. There are not any notable differences between the values of the bare duct and flow control cases at X/L<0.58 region. Regarding the passive flow control cases,it can be seen that there are two distinct peaks at X/L=0.646 and X/L=0.674(that are immediately downstream of the VG rows) in VG1 and VG2 ducts, respectively. These peaks are associated with the local increase of the fluctuations and mixing of flow at the center of the VG rows on the upper surface of the duct. At the bare duct case, the PRMSvalue starts to increase sharply at X/L=0.674 and reaches the predominant peak value at X/L=0.796 (Fig. 14). This behavior was observed for all throat Mach numbers. It can be inferred that the onset of the flow separation occurs in X/L=0.674 and the highest pressure fluctuation (X/L=0.796) arises just upstream of the flow reattachment point which is in agreement with earlier work in Ref.36Furthermore, pressure fluctuation at X/L=0.796 is about 3% of the dynamic pressure, which is in a good agreement with the result obtained in Refs.36,37for turbulent separated flow in the S-duct and backward-facing step configurations. After the reattachment point (X/L=0.796), the flow begins to recover and fluctuations decay up to the AIP. Adding VGs, flow separation is eliminated and there is no longer a noticeable peak inside the separation zone and the pressure fluctuations levels are much lower than the bare case.However, at VG1 case, the fluctuations increase after X/L=0.85 and reach the values higher than the uncontrolled case at AIP. This is due to the improper position of VGs in comparison with the VG2 case (too far forward of separation onset). The spectral distribution of upper surface fluctuations is presented in Fig. 15 for Math=0.45. The significant level of energy is observed at downstream part of the bare duct at f=28 Hz (shedding frequency), which signifies the existence of flow separation at this region.This phenomenon is repeated with two lower amplitude harmonics at higher frequencies of 56 and 84 Hz and decays before 100 Hz. Fig.14 Upper duct surface pressure fluctuations in the bare and flow control cases at Math=0.45 and Math=0.65. At the flow control cases, the PSD levels are significantly diminished at lower frequencies, and only notable level of energy and its harmonics can be observed at the VG row positions. As previously discussed, this phenomenon is associated with the increasing local flow fluctuation across the VG rows.The extent of the PSD levels in VG2 case is significantly lower than that of VG1(where the fluctuations extent up to the AIP),and the levels decay up to the X/L=0.9.This provides further evidence of the more efficient flow control at VG2 case. 4.5.2. AIP probes spectral analysis The spectral distribution of AIP total pressure probes highlights the flow characteristics at 0-300 Hz frequency range(Fig. 16). It can be deduced that there are distinct regions in which the total pressure fluctuations have clear dominant distributions at particular frequency ranges. Most of the fluctuations occur in the range (0-100 Hz). At this frequency range,the bare duct indicates a local maximum unsteadiness in the boundary of low pressure and high pressure recovery regions at upper half,with its topology being in a good agreement with the results obtained in Refs.12,36Moreover, there is a notable energy level at the lower half of the AIP, which is associated with the classical secondary flow and the developed boundary layer from the lower wall of the duct.At the(100-300 Hz)frequency range, the PSD levels significantly decay. In the flow control cases, the energy content of AIP upper half maximum fluctuations is significantly reduced in comparison with the bare configuration. Another notable point is that the PSD levels on the right side of the AIP are slightly higher than that of the left side at all 3 cases which is related to the asymmetry of flow at the duct (described in Section 4.2). Fig. 15 Power spectral density (ΔP2/Hz) distribution of upper surface pressure fluctuations. Fig. 17 shows the power spectral density of time-resolved total pressure data at AIP.For probes A and B,several distinct peaks are observed in f=28, 56, 84 and 112 Hz at Math=0.65, which are repeated with the lower amplitudes at other throat Mach numbers.The most energetic one occurs at f=28 Hz and is called the first harmonic, which indicates the vortex shedding frequency. The amplitudes of higher harmonics are decreasing and are called the second harmonic(f=56 Hz), third harmonic (f=84 Hz) and fourth harmonic(f=112 Hz). This vortex shedding frequency (28 Hz) is related to the range of 0.104 Fig. 16 Spectral distribution of total pressure fluctuations at Math=0.65. As for G and H probes,which are located in the clean flow regions at the center of the duct,there are not any notable phenomenon at the frequency range of 0-250 Hz, and consequently, their PSD diagrams do not have any distinct peaks.The F probe is located in the clean region, however, it is close to the duct wall and affected by the wall boundary layer.Accordingly, there are low-amplitude peaks which correspond to the wall boundary layer. Secondary flow region probes (I and J) have a lower peak value at the vortex shedding frequency than that of separation region probes (A, B, C, D & E) and their harmonics are not clearly visible. This is due to the weak secondary flow structures in comparison with the flow separation at the upper surface of the duct. The effectiveness of VGs on the most energetic features of AIP upper half probes is shown in Fig.18.At A and C probes,the first harmonic PSD value is reduced by one-half in the VG2 duct.However,this value is reduced to one-fifth at B,D and E probes in comparison with the uncontrolled case. In the VG1 duct,the reduction of first harmonic PSD values is lower than the VG2 case at all studied probes.The reduction is not significant in A,B and C probes,but the PSD levels are comparable with the VG2 case at D and E probes.This comparison shows that VGs effectively reduce the energy content of the frequencies associated with the largest fluctuations for the bare configuration, which the VG2 duct causes the higher reductions as compared to VG1 case. Cross-power spectral density(Coherence)and phase analysis of three pairs of nearfield,farfield and symmetric probes at AIP are shown in Fig.19.As it is represented,due to the close proximity of the two E and D probes,they have a strong level of coherence at frequencies below 100 Hz. The phase diagram also indicates that the two signals are in phase at this range of frequency. This analysis shows moderately strong lowfrequency correlation between two probes, which indicates that they measure similar phenomena. In the case of E’ and H probes, the coherence level is very low at(0-250 Hz)and two probes do not show any significant correlations. The phase diagram also shows out of phase fluctuations in most of the frequencies,which signifies the different nature of their signals. The reason is that the H probe is located in the region of low total pressure fluctuation (clean flow)and the E’probe is located in the edge of pressure deficit region, where the highest fluctuations were observed. In the case of two symmetric probes at AIP(E&E’),the significant level of coherence can be found at 30 Hz, and the phase characteristic indicates that the unsteadiness at this frequency is approximately-170° out of phase. This frequency belongs to the vortex shedding frequency previously identified in PSD diagrams.Previous research revealed that strong out of phase coherence at low frequencies signifies the lateral movement at AIP.12This lateral movement is attributed to the vortex pair movement inside the separation region. The high pressure fluctuation region is located on the external edges of these vortices (see Figs. 16 and 17) and it can be inferred that they can alternately move laterally. Fig. 17 PSD (ΔP2/Hz) diagrams of several probes at AIP for bare configuration. Fig. 18 Comparison of effect of VGs on PSD peak values in AIP pressure deficit region at Math=0.65. Experimental investigation of flow and distortion mitigation was conducted on a full-scale coupled serpentine inletturbofan engine system. The main objective of the present study was to gain a fundamental understanding of the underlying steady and unsteady flow physics governing the development and propagation of separation followed by implementation of the passive flow control method which attenuate distortion to an acceptable level. Tests were conducted over the entire of EOPs at five intervals in the range of 56% (idle) (1) AIP upper half total pressure ratio contours of the bare configuration indicated a large pressure deficit region,which originated from the flow separation on the upper surface of the duct.At the lower half of AIP,there were two detached and weaker loss regions,which were associated with the development of the classical secondary flow inside the duct. The separation region of flow was characterized by a pressure plateau zone at the CPcurve(at Math=0.15 and 0.2), which was not readily discernible at higher throat Mach numbers (EOPs). (2) The qualitative study of VGs efficacy showed that they relocated the pressure deficit region towards the circumference of the AIP,and consequently,the separation was removed from the upper wall of the duct. Furthermore,using VGs,there was no longer a pressure plateau or CPcurve drop-off at the separation region. (3) The quantitative study of flow through loss metrics revealed that there was a maximum of 1.92%total pressure loss at the bare case, which was not considerably changed in flow control cases.DC(90°)and DC(60°)distortion coefficient reduced by 65.84% and 48.1% at VG1 (X/L=0.63) and by 73.72% and 60.7% at VG2(X/L=0.67) configurations, respectively. The average circumferential distortion coefficient (ΔPC/P) also reduced by 29.66% at VG1 and by 37.82% at VG2 cases. Furthermore, the tip radial distortion ((ΔPR/P)tip) was reduced by over than 20% and 60% in all operating points at VG1 and VG2 cases, respectively. (4) The onset points of flow separation (X/L=0.674) and reattachment (X/L=0.796) regions were determined through assessing the standard deviation of measured static pressure over the upper surface of the duct. The further spectral distribution analysis of fluctuations indicated the significant level of energy at the downstream part of the bare duct, which signified the existence of flow separation at this region. The standard deviation and PSD levels significantly diminished using VGs at the upper surface and only a notable level of energy was detected at the position of VGs row. (5) The AIP spectral distribution showed that the boundaries of low pressure and high pressure recovery regions were dominated by the maximum total pressure fluctuations in the frequency range of 0-100 Hz. (6) The PSD analysis of several AIP probes at the bare configuration ascertained the vortex shedding frequency at 28 Hz and its higher harmonics at 56, 84 and 112 Hz.The peak values of fluctuating energy were significantly increased at the boundary of pressure deficit and high pressure recovery regions. (7) The reduction of the fluctuations was dramatic for the flow control cases, and VGs could effectively reduce the energy content of the frequencies associated with the largest fluctuations for the bare configuration. (8) The cross-power spectral density analysis of two AIP nearfield probes showed that the fluctuations were closely in phase and highly coherent at the frequency range of(0-100 Hz).Likewise,two farfield probes PSD analysis, showed out of phase behavior with low levels of coherence in this frequency range. The analysis of two symmetric probes also showed the strong out of phase coherence at f=30 Hz, which may be associated with the lateral movement of the twin vortices at AIP.2. Serpentine duct configuration
3. Methodology
3.1. Experimental setup and measurement technique
3.2. Mechanical VGs characteristics

3.3. Duct flow loss metrics




4. Results and discussion
4.1. Throat and AIP Mach numbers
4.2. Total pressure contours at AIP

4.3. Upper surface static pressure
4.4. Flow loss metrics at AIP




4.5. Unsteady analysis


5. Conclusions
 CHINESE JOURNAL OF AERONAUTICS2020年5期
