Simulator of pyroshock environment and eあect rules of its adjustable parameters
Hongd ZHAO, Jifeng DING, Wei LIU, Zhiwei HAO, Yi SUN,*,Qiuhu ZHANG, Yizhi LIU
a School of Astronautics, Harbin Institute of Technology, Harbin 150001, China
b Institute of Spacecraft System Engineering, China Academy of Space Technology, Beijing 100094, China
KEYWORDS Adjustable parameters;Maximum Expected Flight Environment (MEFE);Protective cover;Pyroshock;Shock Response Spectrum(SRS)
Abstract During the launching of spacecraft, the on-board devices will undergo a series of pyroshock environments.In order to verify the reliability of these devices under these pyroshock environments,all of them are needed to take the shock test before launching.This paper has carried out an in-depth research on the simulation method of the pyroshock based on the true explosive excitation. In this study, a simulator containing multiple adjustment parameters is presented and the safety is considered by the design of the protective cover. And the working process of this setup is simulated with the explicit dynamic codes LS-DYNA.What’s more,the effects of the adjustment parameters on the three factors of shock Response Spectrum (SRS) of the resonant board are explored carefully. The rules achieved in this paper are verified by a typical example. The results indicate that the improved simulator can avoid the danger of explosive and make full use of the advantage of actual explosive excitation.And the test condition can be quickly realized at the simulator according to the effect rules of the three adjustable parameters.
1. Introduction
In aerospace engineering, the pyrotechnic separation devices are widely used to realize the connection-separation between satellite and rocket.1,2During the process of satellite-rocket separation,the pyroshock caused by the action of pyrotechnic separation devices generates and then propagates to the structure of satellite, arousing the shock response of satellite structures.3This response has the properties of transient, wide frequency range and high amplitude and is called the pyroshock environment.This environment usually has little effect on the main structures of the satellite,but it is easy to cause the damage of some electronic components and precision equipment which are sensitive to the environment of high frequency and high amplitude.4,5Some common faults caused by the pyroshock such as the failing of welding point,fracturing of ceramic material and so on can even lead to the failure of the whole space mission.6,7Therefore,many equipment and components must be subjected to the shock test before launching to check the shock resistance of them.However,it is still difficult at present to reproduce the true pyroshock environment accurately in the ground test. Many institutions and scholars have developed a series of researches on the simulation of pyroshock environment.
At present,there are mainly five methods for the simulation of pyroshock environment. They are the pyrotechnic devices excitation, the explosive excitation, the mechanical impact,electric vibration table and the laser excitation. Lee et al.8reviewed the requirements of various experimental methods of pyroshock environment simulation and they further introduced the measurement and characteristics of pyroshock.Mao and Li9summarized and compared the pyroshock simulation techniques such as the standard impulses, electrodynamic shakers, pyrotechnic device, mechanical test facilities and so on.For the method of pyrotechnic devices,Fernandez10developed the pyroshock test by using the true pyrotechnic separation nuts 5/8′′to simulate the pyroshock environment of the MSL(Mars Science Laboratory).The advantage of this method is that it can accurately reproduce the pyroshock environment of specific separation device. However, its energy of pyroshock cannot be adjusted and can only be used to simulate the specific pyroshock environment, which limits its application range.Ma et al.11made some researches on the simulation techniques of pyroshock environment by adopting the true explosive loading.They mentioned that this method can make the real pyroshock environment reappear and produce strong shock to meet the requirement of the qualification test. In practical engineering,the method of mechanical impact is most widely used. Velmurugan and Najeeb12combined the experimental and numerical methods to investigate the pyroshock simulation setup of projectile shock excitation. In addition,they also further studied the effects of the device parameters on the pyroshock environment,such as the laminate thickness,projectile velocity, locations and so on. Park et al.13also adopted the way of mechanical impact to carry out the pyroshock test for the equipment on the Korea Satellite Launch Vehicle-I (KSLV-I). Due to limitation of high frequency, the method of electric vibration table more tends to simulate the pyroshock environment which contains little high-frequency signals. As for the laser excitation, it is a new method developed in recent years to simulate the pyroshock. Both Jang14and Wang15et al. made some researches with this method.However,the response magnitude based on the laser excitation is very small compared with the true pyroshock environment.Therefore, more works about this method still need to be developed for the practical application in engineering.
Although some progresses about the simulation methods of pyroshock environment have been made,there are still obvious defects about each of them. For example, the mechanical impact method which is commonly used in practical engineering will bring the problem of ‘‘over test at low frequency and under test at high frequency”.And the method with true explosive excitation is reasonable, but the safety problem is accompanying, which makes it difficult to adjust the parameters through multiple tests to realize the standard pyroshock environment. Considering from the safety of the pyroshock environment simulation, this paper presents a simulator about the pyroshock environment firstly. This simulator is based on the excitation of true explosive and has multiple adjustable parameters. Secondly, the working process of the simulator is simulated and the effect rules of its adjustable parameters on the three factors of SRS of the resonant board are explored with explicit dynamic code LS-DYNA. Finally, a true pyroshock environment is introduced and used to verify the correctness of the rules got in this paper.
2. Simulator of pyroshock environment
In order to simulate the complex oscillating shock of the pyroshock environment accurately, a simulator based on the true explosive excitation is proposed in this section. This simulator takes the form of the double-plate to realize the multiple adjustment parameters. Besides that, the working process of the simulator is simulated with the explicit dynamic code LSDYNA.
2.1. Design of simulator
The simulator of pyroshock environment proposed in this paper is shown in Fig.1.From the figure,it can be known that the simulator mainly consists of explosive, protective cover,loading board, resonant board and connectors. Before the shock test,the whole setup is suspended at the frame with flexible ropes by the four handing rings at the corners of the loading board.The explosive is bonded to the center position of the bottom of the loading board. The explosive is within in the protective cover which is bolted at the bottom of the loading board to avoid the potential hazard to the testers and equipment.A square hole namely pressure relief hole at the bottom of the protective cover is designed to facilitate the layout of the thunder pipeline and the discharge of the detonation product gas. In order to simulate the pyroshock environment of the precision devices which are installed on the satellite structures through the composite brackets more realistically,the material of resonant board takes the carbon fiber composites. The thickness of each layer is 0.125 mm. And the laying way is 0°/±45°/90°. The number of the layers is determined by the actual thickness of the resonant board. The resonant board is fixed on the loading board with the four connectors. In this setup, the adjustable parameters are the amount of the explosive, the thickness of the resonant board, the position of the connectors and so on. The effects of these parameters on the shock environment of the resonant board will be discussed in detail in Section 3.
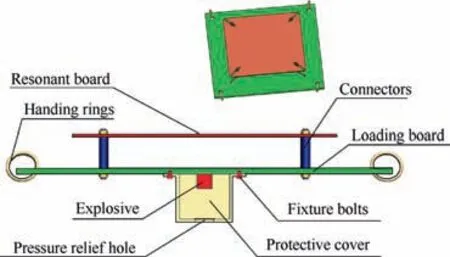
Fig. 1 Simulator of pyroshock environment.
2.2. Finite element model
Due to the huge cost and the dangers for the shock test of pyroshock environment, the explicit dynamic code LS-DYNA is used to perform the concerning researches to make full use of the advantage of the numerical method. The process of finite element modeling is introduced in this section.
2.2.1. Material model
In the satellite structures, many precision devices are installed on the cabin board through the brackets to achieve the functions of vibration decrease, shock isolation and heat insulation. Considering the strict weight control of the payload in aerospace engineering, most of the brackets are made in carbon fiber composite materials as the properties of lighter weight and larger strength. Therefore, the shock waves must pass through the brackets made of composite materials before they reach these precision devices. The transformation and response characteristics of the shock wave in the composite material are more representative and closer to the true shock environment that the device undergoes.Therefore,the material of the resonant board adopts the carbon fiber composite materials. The specific material parameters are listed in Table 1.
As the strong impact from the detonation product gas, the stress of some parts of the loading board and the protective cover would exceed the yield stress of them. And some of the structures may present the characteristics of plastic or even the fluid.Therefore,the Johnson-Cook constitutive models are used to describe the mechanical behavior of these materials under the high strain rate. The form of the model can be written as

where σyis the dynamic yield stress, ε is the effective plastic strain, ˙ε and ˙ε0are the effective plastic strain rate and the reference strain rate, respectively, A is the static yield stress, B is the hardening constant, n is the hardening exponent, C is the constant related with the strain rate, m is the temperature exponent,T*=(T-T0)/(Tm-T0),Tmis the melting temperature,T0is room temperature.The specific values of the model for the loading board and protective cover are listed in Table 2.16,17
In this paper, pentaerythritol tetranitrate (PETN) is selected for the explosive loading. Besides the basic material parameters, the Equation Of State (EOS)of PETN also needsto be defined to describe the relationship between the pressure of the product gas and the volume. The classical trinomial EOS of Jones-Wilkins-Lee (JWL) adopted for the PETN is shown as Eq. (2). And the three items in JWL control the high-, medium- and low-pressure range respectively.
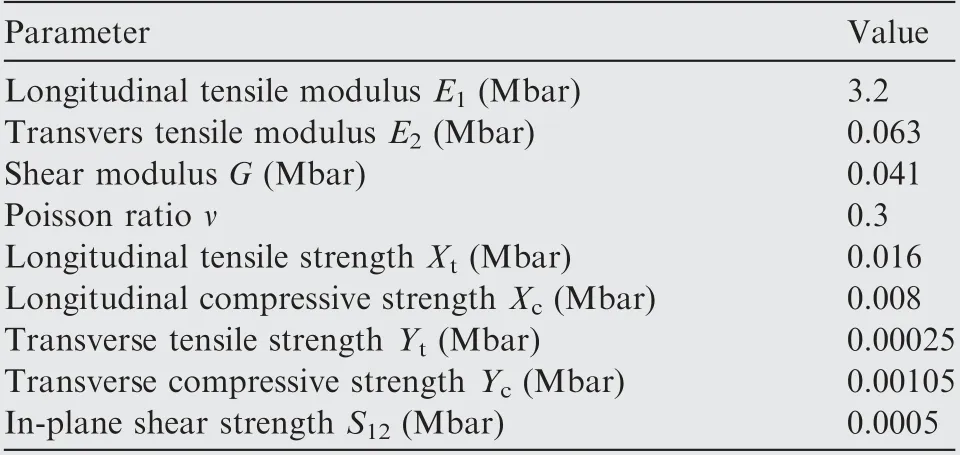
Table 1 Material parameters of resonant board.
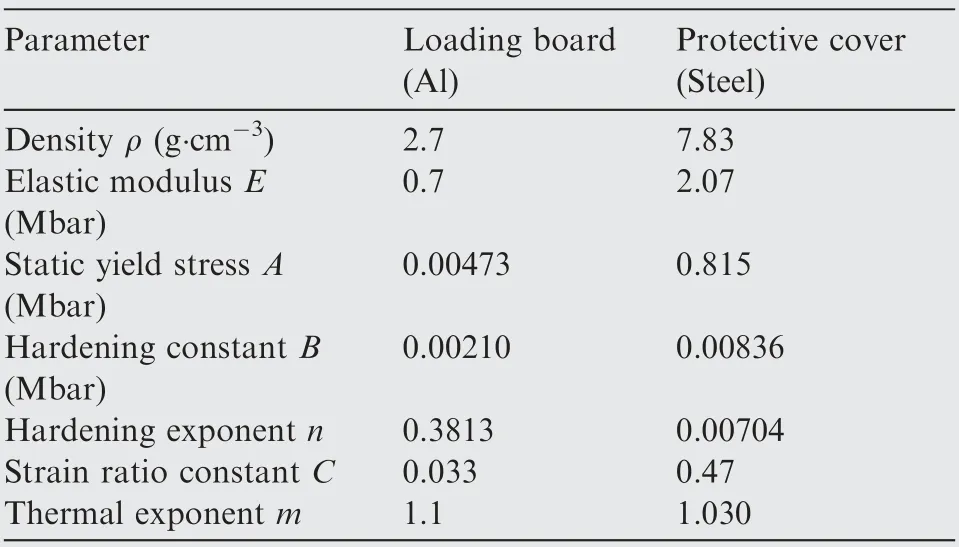
Table 2 Material parameters of loading board and protective cover.16,17

where p is the pressure of the product gas,γ=V/V0is the relative volume, V0is the initial volume, E is the initial energy,and A, B, R1, R2, ω are the undetermined parameters which can be obtained with cylinder test or related papers.The specific parameters of PETN are shown in Table 3.18
2.2.2. Algorithm of detonation simulation
The Lagrange, Arbitrary Lagrange-Euler (ALE) and Smoothed Particle Hydrodynamics (SPH) are the three methods which are most commonly used in the simulation of explosive detonation process. In Lagrange algorithm, the explosive material is attached to the elements deforming with the motion of explosive material and interacting with structure elements by defining the contact. A fatal flaw about this method is that the explosive elements could experience a serious distortion and even leads to the calculation termination. Therefore, the Lagrange method is only applicable to some simple explosive models. As to the ALE algorithm, the additional air model is introduced and built around the explosive. In this method,the detonation products and air are deemed as fluid and set as Euler elements, while the structure boards are solid and set as Lagrange elements. The prominent advantage of this method is that the Euler elements do not rely on the materialof explosion products which can flow in the Euler grid while the elements shape remains unchanged. And the Fluid-Structure Interaction (FSI) is set to realize the interaction between explosion products and solid structures. As the Euler elements do not deform with explosive products, the ALE method effectively avoids the deficiency of Lagrange and is widely used in the simulation of explosive detonation. Thus this method is also employed in this paper. The SPH method disperses the explosive into particles moving along with the explosion products and realizes the interaction between particles and the structures by defining the contact parameters.Because the elements are represented by particles, the phenomenon of element distortion will not exist, avoiding the defect of the Lagrange algorithm effectively. Therefore, the SPH method has also been widely used in recent years.
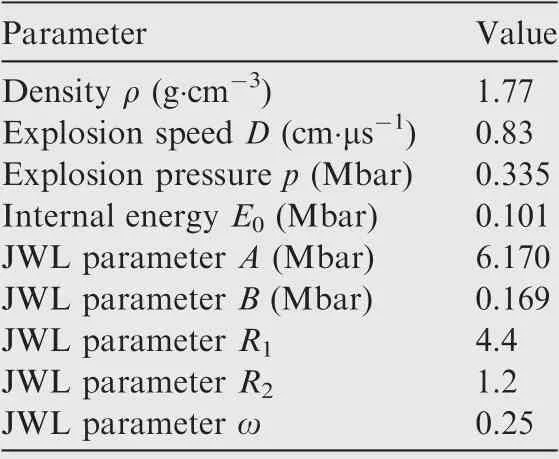
Table 3 Material parameters of PETN.18
2.2.3. Division of grids
Due to the strong impact from the detonation product gas,the pyroshock waves at the loading board and the resonant board have the characteristics of transient, high frequency and high amplitude. In order to describe this characteristic accurately,the grids in the finite element model must be fine enough. Itis generally believed that the finite element model can capture the high-frequency information of the pyroshock wave only when there are at least six elements in each wave length. The wave length of the pyroshock can be calculated as
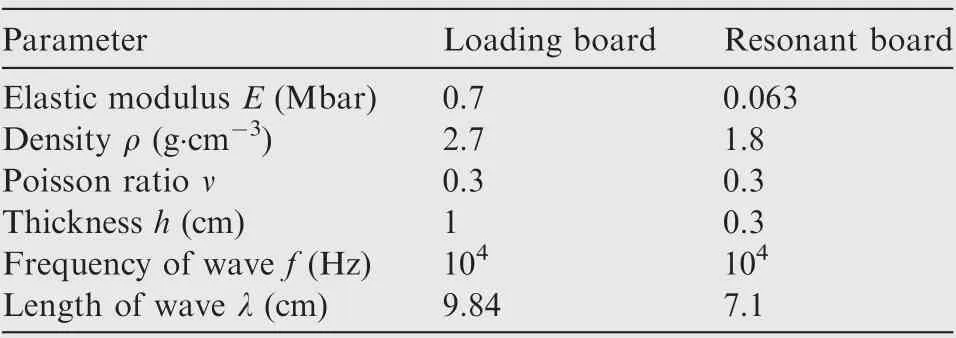
Table 4 Parameters of structure boards and pyroshock wave.

where λ is the length of the pyroshock wave,f is the frequency,D=Eh3/12(12-ν2) is the bending stiffness of the board, h is the thickness of the board,ν is the Poisson ratio,and msis the mass of the board.The basic parameters and the shortest wave lengths of the two boards are listed in Table 4.
The finite element model of the simulator is shown in Fig.2.From the figure, it can be seen that there are air elements surrounding the explosive elements, indicating that the algorithm in the model is ALE.
2.3. Working process
After the finite element model of the simulator is established,the working process is simulated with explicit dynamic code LSDYNA and shown as Fig. 3. At 0 μs, the explosive is ignited and detonated, causing the high temperature and pressure product gas instantaneously. And the product gas will produce a strong pyroshock to the loading board.When the time is about 250 μs,the product gas expands in the protective cover and continues to produce the pyroshock to the bottom of the loading board. This pyroshock wave propagates from the center to the periphery and reaches the location of the connectors at some moment.And then,it will transmit to the resonant board,arousing the pyroshock response at the resonant board.At 500 μs,the protective cover is filled with the detonation product gas. And the product gas is fully mixed at this time.The pressures of different positions tend to be the same.At this time,the pyroshock of product gas to the loading board has been completely attenuated. After 1000 μs, the product gas is discharged from the pressure relief hole and the pressure at the protective cover begins to reduce. The whole process is completed.

Fig. 2 Finite element model of simulator.
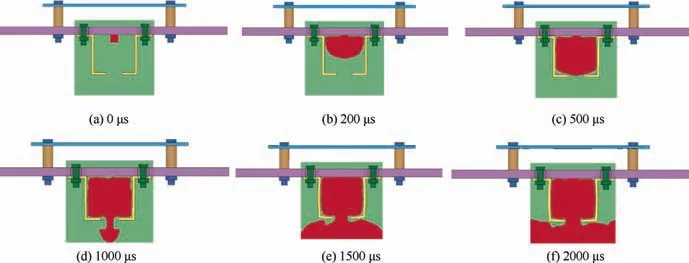
Fig. 3 Simulation of working process of simulator.
In order to further learn the characteristics of pressure shock, the pressure history curves of six air elements in the protective cover are extracted and presented in Fig. 4. It can be found from the figure that there are obvious pressure peaks about these elements at around 250 μs. And the values of the peaks are quite different for these elements. These pressure peaks are the source power to excite the pyroshock on the loading board. When it is about 500 μs, all the pressures tend to be the same, indicating that the detonation product gas in the protective cover is fully mixed. With the elapse of time,the product gas discharges from the pressure relief hole, and the pressure values of these elements gradually decrease. In summary, the pressure curves keep in accordance with the working process of the simulator discussed above.
3. Effect rules of adjustable parameters
In order to explore the effect rules of the adjustable parameters on the pyroshock environment of the resonant board,this section develops the researches of the adjustable parameters.They are the amount of the explosive, the thickness of the resonant board,the locations of the connectors and the positions of the measure point.
3.1. Three factors of SRS
Due to the complex oscillation characteristics of the pyroshock response in time domain, the SRS is generally used as the severity indicator of the pyroshock in practical engineering.19,20Shock response spectrum analysis is a method to transform the pyroshock signals from time domain to frequency domain. In this method, the pyroshock signal in time domain is used as the base excitation and is applied to a series of Single Degree Of Freedom (SDOF) systems with different natural frequencies.21And then, the natural frequencies are taken as the transverse axis, and the maximum response of each SDOF system is used as the longitudinal values corresponding to the natural frequency. The curve plotted above is called the SRS of the pyroshock signals. A typical standard SRS is shown as Fig. 5. From the figure, it can be seen that SRS mainly consists of three factors. They are the peak value of high frequency, break frequency and the slope of the low frequency.Therefore,the study of the effect rules of the adjustable parameters mainly focuses on exploring how the relevant parameters influence the three factors of the SRS at the resonant board, so as to quickly realize the shock test condition.
3.2. Effect of mass of devices to be tested
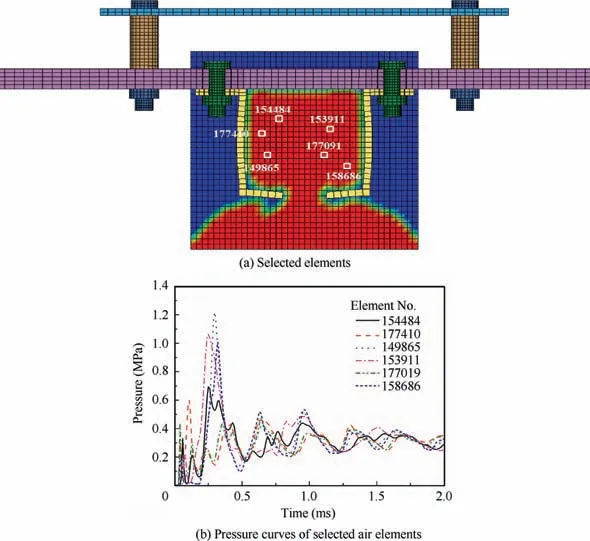
Fig. 4 Pressure history curves of selected elements.
In this section,a lumped mass point is introduced in the model firstly to consider the effects of the devices to be tested. This lumped mass point is fixed on the resonant board through four rigid elements in the Finite Element (FE) model. Three cases with no lumped mass, 5 kg and 10 kg lumped mass are simulated respectively. A measure point at the resonant board is selected and shown in Fig. 6. The acceleration histories of the measure point of these cases are shown in Fig. 7. Compared with the no lumped mass case,there is no obvious differences after the 5 kg or 10 kg lumped mass are added in the model. And the responses with 5 kg and 10 kg lumped mass are completely coincident.This phenomenon may be explained as follows.Under the excitation of true explosive,the response at the resonant board belongs to the high-frequency response,while the effect of the lumped mass is mainly in the lowfrequency range. By applying the Fourier transformation to the red curve in Fig. 7, its frequency information is obtained and illustrated in Fig.8.From the figure,it can be known that the shock response under the explosive excitation mainly concentrates on the 2 kHz-20 kHz frequency range. In order to further verify the explanation, the three FE models of the resonant board with no lumped mass, 5 kg and 10 kg lumped mass were built as Fig.9.And then the modal analysis was executed to the three FE models.The 1st,100th and 200th modal frequency and shapes of the three cases are listed in Table 5 and Fig. 10 respectively. From the table and the figure, it can be seen that the lumped mass has a large effect on the inherent frequency and shapes at the low frequency range.When it comes to the high-frequency range, the inherent frequencies of the three cases are closer and the modal shapes are similar. Since the explosive excitation mainly arouses the high-frequency response, the lumped mass has little influence on the shock response of measure point at the resonant board.
In practical engineering, the simulator may be used for the shock test of various devices that have different mass and fixed ways at the resonant board. Therefore, this paper mainly develops the research on the case that no device is installed on the resonant board.
3.3. Effect of amount of explosive
In order to study the effects of the amount of the explosive on the three factors of the SRS, four different cases with the amount of 13.17 g, 26.35 g, 35.14 g and 52.70 g are computed respectively. The acceleration history curves of measure point for four cases are presented in Fig. 11, where the shapes of the four curves basically keep in accordance with each other and the amplitudes of these curves increase gradually with the increase of the amount of the explosive. And then, the SRS transformations are performed to the four time history curves. And the SRSs of them are shown in Fig. 12. From the figure,it can be seen that the shapes and the break frequencies of the SRSs are totally the same. The amplitudes of these SRS also increase with the increase of the amount of the explosive, which is consistent with the rules in time domain.
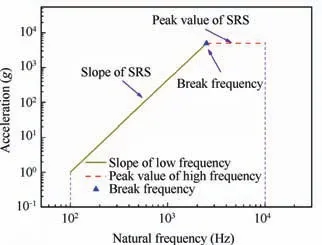
Fig. 5 Three factors of SRS.
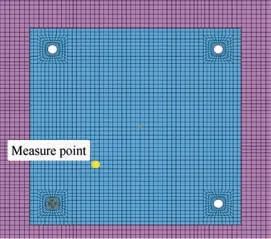
Fig. 6 Position of measure point.
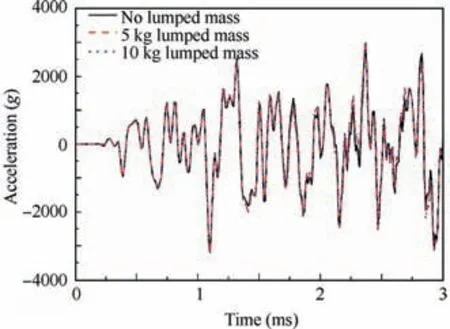
Fig. 7 Acceleration histories for three lumped mass cases.
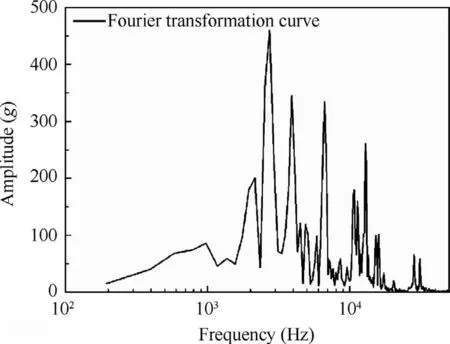
Fig. 8 Fourier transformation form of response curve of no lumped mass.
From the analysis above, it can be concluded that the amount of the explosive does not affect the shape of the SRS, and only changes the amplitude of the SRS. In order to further give the quantitative relationship between the amount of the explosive and the amplitude of the SRS, the mass of the explosive is taken as the abscissa and the amplitude of the SRS corresponding to the mass is taken as the ordinate.And then the least squares method is used to fit the relation curve which is illustrated in Fig. 13. The relationship is expressed as
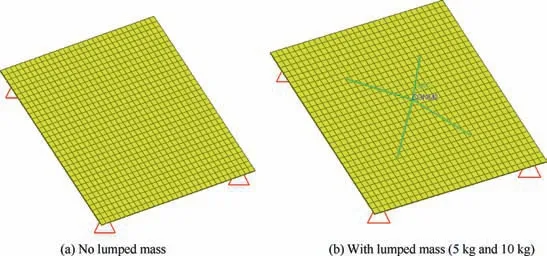
Fig. 9 FE models of resonant board.

Table 5 Frequency parameters for different cases.

where xmis the mass of the explosive,and yais the acceleration amplitude of the SRS. Once given the amplitude of the SRS,the corresponding mass of the explosive can be calculated from the equation above.
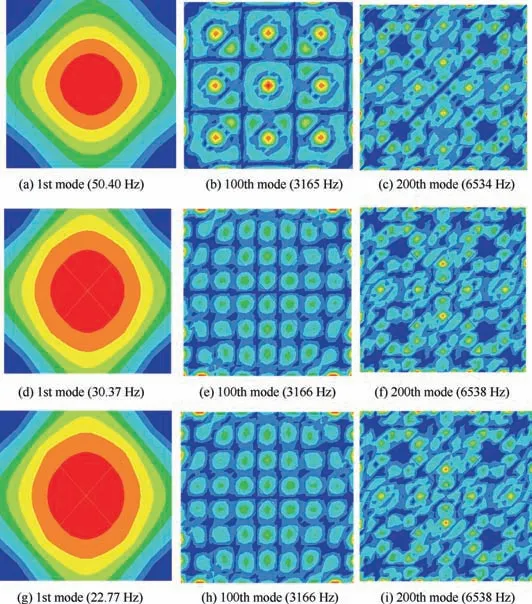
Fig. 10 Modal shapes of the 1st, 100th and 200th mode of three cases.
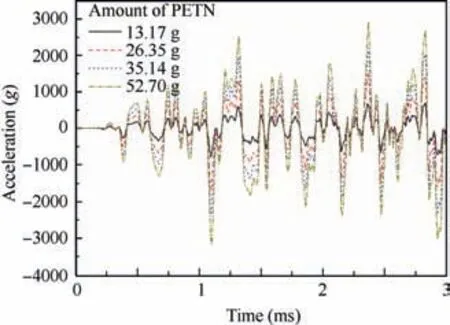
Fig. 11 Time history curves for four different explosive doses.
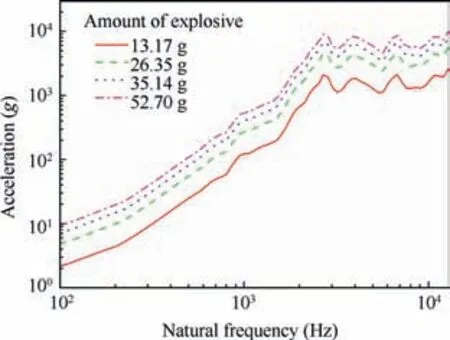
Fig. 12 SRSs for four different explosive doses.
The stress color plot of the loading board for the case of maximum explosive dose (52.70 g) is shown in Fig. 14, where the stress level in the center position is more serious than others. Considering the symmetry of the board, the stress curves of a quarter elements in the center of the board are extracted and illustrated in Fig. 15. From Table 2, it can be known that the yield stress of the loading board is 473 MPa.In Fig. 15, the element No.1607 at the center of the loading board has the maximum stress value 433.77 MPa, less than the yield stress. Therefore, the stress of the loading board is still within in the elastic range. At the same time, the analysis above indicates that the stress level aroused by 52.7 g explosive is approximate to the yield stress of the loading board. If the amount of the explosive continues to be increased, it may exceed the yield strength of the material of the loading board,resulting in local plastic properties of the material. And the relationship between the SRS peak and the amount of the explosive is no longer linear. Eq. (4) needs to be further corrected.
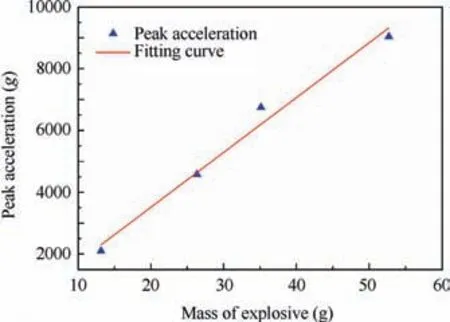
Fig. 13 Fitting relationship curve of amount of explosive and amplitudes.
3.4. Effect of thickness of resonant board
Combining the conception of the SRS, it can be known that the natural frequency of the resonant board has a larger effect on the SRS of the measure point.In order to explore the effect of the thickness of the resonant board on the three factors of SRS, five cases with different thickness of the resonant board are simulated in this section. The SRS of the measure point for five cases are shown in Fig. 16. From the figure, it can be seen that thickness of the resonant board has an obvious effect on the break frequency of the SRS. At the same time, the amplitudes and the slopes of the SRS are also changed along with the thickness of the resonant board. But this effect is small and can be ignored.
Similar to the amount of the explosive,in order to give the quantitative relation between the thickness of the resonant board and the break frequency of the SRS, the thickness of the resonant board is taken as the abscissa and the break frequency is taken as the ordinate. And then the least squares method is used to fit the relation curve which is illustrated in Fig. 17. The relationship is displayed as

where xtis the thickness of the resonant board, and yfis the break frequency of the SRS. When the break frequency of the SRS is given, the corresponding thickness of the resonant board can be calculated from the equation above.
3.5. Effect of locations of connectors
The locations of the connectors between the resonant board and the loading board will affect the boundary condition of the resonant board, which will change the natural frequency of the resonant board eventually. In this section, three cases with different connection distances which are 2 cm, 4 cm and 6 cm are simulated respectively. The SRSs of three cases are shown in Fig.18,where the slope at low frequency of the SRS is gradually up-warping as the connectors move inward.At the same time, it is not difficult to find that the locations of the connectors will also have an effect on the break frequency and the amplitude at high frequency. But these effects are not obvious.
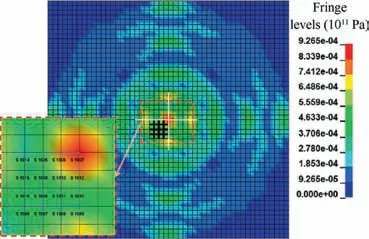
Fig. 14 Stress color plot of loading board.
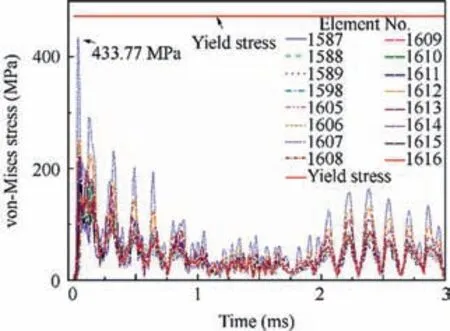
Fig. 15 von-Mises stress curves of selected elements.

Fig. 16 SRSs for different resonant thickness.
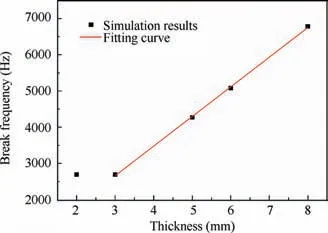
Fig. 17 Fitting relationship curve of thickness and break frequency.
3.6. Maximum Expected Flight Environment
The rules discussed above are all obtained based on the analysis of the measure point at the resonant board. But this measure point is not necessarily the installation location of the devices needed to be tested.In fact,the SRS of different points at the resonant board tends to vary greatly due to the location changing. Therefore, it is necessary to divide the resonant board into several zones, and the responses of all the points in each zone are basically consistent. In other words, the responses of all points can be represented with one SRS,which includes the values of SRS of most of all points in the zone.This SRS is called the ‘‘Maximum Expected Flight Environment (MEFE)”22in the zone.
There are two steps for the calculation of the MEFE:
(1) The division of the zones which have similar SRS for the points at each zone, referred to as ‘‘zone”;
(2) The selection of a conservative upper bound on the SRS values in each zone, referred to as a‘‘zone limit”,which constitutes the MEFE of that zone.
There are several ways to calculate the MEFE in a zone.The simplest procedure is to take the maximum of SRS of all points in this zone.However,the results of this method prefer to be conservative. Another method which is popular in engineering is to compute a normal tolerance limit that covers the SRS the magnitudes for at least 95 % of the locations in the zone with a confidence coefficient of 50 %, referred to as the P95/50 limit.
When the random variable obeys normal distribution, the tolerance limit is easy to compute. Generally, the response at the structures arousing by the pyroshock is not normally distributed. However, there is empirical evidence that the logarithm of the response from pyroshock as well as random vibration does have an approximately normal distribution.Therefore, transforming the response x with the logarithm is as follows:
y=lg x (6)
where x is the value of SRS of a point within a zone.The transformed variable y can be assumed to have a normal distribution. For n samples of y, the normal tolerance limit Lycan be obtained by

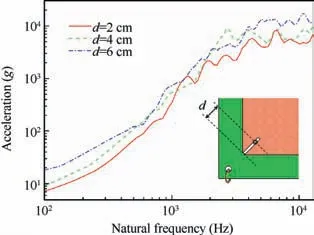
Fig. 18 SRSs for cases of three locations of connectors.

Table 6 Tolerance factors for P95/50 normal tolerance limit.22

where k is the normal tolerance factor and can be selected according to Table 6.22The tolerance limit of original variable x can be obtained by

Since the shape of the resonant board in this paper is square, its structure has one-eighth symmetry. Therefore,one-eighth area is extracted to make an analysis.And this area is simply divided into three zones that are expressed as A1,A2 and A3,which is shown in Fig.19.The MEFE of each zone is computed by the SRSs of 6-7 points selected randomly in the zone. The SRSs of the selected points and the corresponding MEFE of the three zones are illustrated in Fig. 20(a)-(c)respectively. The comparison of MEFE of three zones is displayed in Fig. 21. From the figure, it can be seen that the MEFE at A3 zone has the maximum, while the MEFE at A1 zone has the minimum.This phenomenon can be explained as follows. The pyroshock response of resonant board comes from the four connectors, which means that the four connectors are the pyroshock sources for the resonant board. The A3 zone is the nearest to the four sources and has the largest response, while the A1 has the longest distance away from the sources and its response is minimal.The A2 zone is located between the A1 and A3,so its response is also between the values of them.
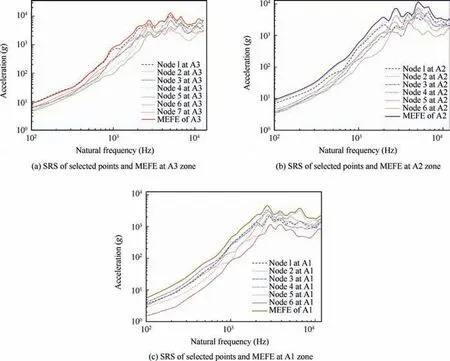
Fig. 20 SRS of selected points and MEFE at three zones of resonant board.
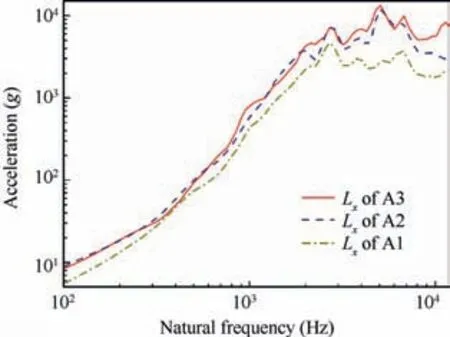
Fig. 21 MEFE of three zones.
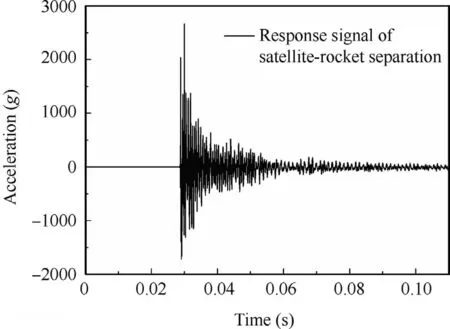
Fig. 22 Typical pyroshock signal.
4. Rapid realization of pyroshock test condition
Generally, the shape of the SRS which is obtained and transformed by the data of test or flight telemetry measurement is irregular.In this section,a typical pyroshock signal in the process of satellite-rocket separation is taken as an example to introduce a method to standardize the SRS. In addition, the three factors of the standard SRS are obtained and the effect rules got in Section 3 are used to accurately set the parameters of the simulator to quickly realize the standard pyroshock environment at the resonant board, verifying the reliability of the rules.
4.1. Standardization of SRS
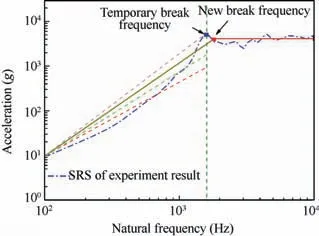
Fig. 23 Original SRS and standard SRS.
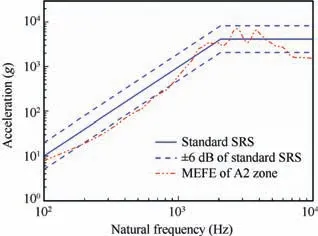
Fig. 24 Comparison between MEFE of A2 zone and standard SRS.
Fig. 22 is a typical pyroshock response signal, which reflects the real shock environment of the devices during the satellite-rocket separation process. The SRS of the signal is shown as the blue line in Fig.23.It can be known from the figure that the shape of the SRS is irregular.The process of standardization of the SRS is conducted as follows. First, a temporary break frequency is determined. Then, the peak value of high frequency of the standard SRS can be obtained by computing the average value of the original SRS from the temporary break frequency to the end frequency.What’s more,a straight line is determined from the start point of the original SRS to any point on the vertical line where the temporary break frequency is located. The position of any point on the vertical line is adjusted until the mean square deviation between the points on the straight line and the values of the original SRS in this frequency range is minimal. The straight line is thought to be the slope of the standard SRS at low frequency. Finally, the intersection point got by extending the low-frequency slope line and the peak value line respectively is the new break frequency.Thus the three factors of the standardized SRS are all obtained.
4.2. Rapid realization of SRS
In Section 4.1, the three factors of the standard SRS are all obtained. And the peak value of the SRS is 4132 g, the break frequency is 1612 Hz and the slope of the SRS is also known.According to Eqs.(4)and(5),the parameters of the simulator corresponding to the amplitude and the break frequency can be calculated, so the amount of the explosive is 23.48 g, and the thickness of the resonant board is 0.25 cm.
When the parameter adjustments of the simulator in finite element model are completed,the model is solved with explicit dynamic code LS-DYNA again.The MEFE of A2 zone where the measure point is located is given as the red curve in Fig.24.Although the MEFE is out of the tolerance range at some frequency ranges, the MEFE at most frequency ranges is still within the range of±6 dB of the standard SRS,indicating that the rules discussed in Section 3 are reliable and the simulator has the ability to simulate the true pyroshock environment.
5. Conclusions
A simulator for pyroshock environment with multiple adjustment parameters is proposed in this paper. And the working process of the simulator is simulated with explicit dynamic code LS-DYNA. In addition,the effect rules of the adjustable parameters on the three factors of the SRS of the resonant board are also revealed. A method to standardize the SRS is introduced and the effect rules got in this paper are verified through a typical pyroshock signal. Some conclusions can be drawn as follows:
(1) The simulator of the pyroshock environment excited by explosive can produce a complex oscillation wave which is quite similar with the true pyroshock environment.
(2) By the design of protective cover, this simulator can fully utilize the advantage of explosive excitation and avoid the disadvantage of dangerous accompanying with explosive.
(3) The amount of the explosive only has an effect on the amplitude of the SRS of the resonant board, while the thickness of the resonant board mainly has an influence on the break frequency of the SRS. The location of the connectors will change the slope of the SRS in lowfrequency range.
Acknowledgements
This study was co-supported by the National Natural Science Foundation of China (No. 11602073) and Natural Science Foundation of Heilongjiang Province of China (No.QC2018005).
 CHINESE JOURNAL OF AERONAUTICS2020年2期
- CHINESE JOURNAL OF AERONAUTICS的其它文章
- Delaying stall of morphing wing by periodic trailing-edge deflection
- Optimization and verification of free flight separation similarity law in high-speed wind tunnel
- Non-intrusive reduced-order model for predicting transonic flow with varying geometries
- Consideration on aircraft tire spray when running on wet runways
- Aeroelastic simulation of the first 1.5-stage aeroengine fan at rotating stall
- Experimental study on NOx emission correlation of fuel staged combustion in a LPP combustor at high pressure based on NO-chemiluminescence
