Fatigue life research and experimental verification of superalloy thin-walled structures subjected to thermal-acoustic loads
Jin WANG, Fengtong ZHAO, Yundong SHA, Song GU
a Department of Aircraft Maintenance Engineering, Chengdu Aeronautic Polytechnic, Chengdu 610100, China
b Liaoning Key Laboratory of Advanced Test Technology for Aeronautical Propulsion System, Shenyang Aerospace University, Shenyang 110136, China
KEYWORDS Experimental verification;Fatigue life;Improved rain-flow counting method;Rain-flow cycle matrix;Rain-flow damage matrix;Thermal-acoustic load;Thin-walled structures
Abstract Rapid alternating stress is formed in structure subjected to harsh thermal-acoustic loads,which will affect fatigue performance and reduce fatigue life seriously. First, fatigue experiment of superalloy thin-walled structure was carried out to obtain fatigue damage location and failure time of the experiment specimen,and S-N curves of superalloy thin-walled structure at 723 K were fitted.Then, dynamic response simulation of superalloy thin-walled structure under the same load as experiment was implemented, and fatigue life was estimated based on the fatigue life prediction model which mainly included: improved rain-flow counting method, Morrow average stress model and Miner linear cumulative damage theory. Further, comparisons between simulation solutions and experimental results achieved a consistency,which verified the validity of the Fatigue Life Prediction Model(FLPM).Moreover, taking a rectangle plate as the analysis object,the distributions of Fain-low circulation blocks and damage levels of the structure were discussed respectively.Finally,current research indicates that in pre-buckling the structure is in softened area and fatigue life decreases with the increase of temperature; in post-buckling the structure is in hardened area and fatigue life increases with the increase of temperature within a certain range.
1. Introduction
With continuous strengthening of national defense requirements and the rapid development of the aviation industry in most countries of the world,the performance of modern aeronautical vehicles and engines has been constantly enhanced.In order to meet high standards of performance requirements and guidelines,superalloy thin-walled structures are widely used in aircraft parts, such as nacelle structure, flame tube and nozzle of engine,aircraft’s lapel/aileron,cavity structure,and rectifier foreskin.Once aircraft keep the state of high-speed flight,these superalloy thin-walled structures mentioned previously will show common features such as thermal buckling under ultrahigh thermal load,1rapid alternating stresses inside the structure under strong noise excitation,2,3and snap-through motion under thermal-acoustic load.4-6Such large deflection nonlinear dynamic response will seriously affect mechanical properties of structures, weaken the fatigue performance of structures and further reduce the fatigue life of the metal thin-walled structure.7-9Therefore, in order to improve structural strength design requirements of aeronautical superalloy thin-walled structures and enhance mechanical properties of superalloy thin-walled structures under severe loads, it is of significance to carry out pre-research on fatigue tests and related simulation analysis of metal thin-walled structures subjected to thermal-acoustic load.
In the last century, NASA Langley Research Center, United States Air Force, McDonald Douglas Company and Germany IABG had performed experimental research on the superalloy structure under harsh thermal-acoustic load. Mei and Wentz carried out the acoustic excitation test on the aluminum alloy plate and measured the strain response of aluminum plate at different Sound Pressure Levels (SPL).10Ballentine et al. studied the influence of composite loads including thermal load, noise load and low-frequency vibration load on the fatigue life of the structure.11Schneider presented structural acoustic fatigue design criteria at high temperatures.12Maekawa expounded the sonic fatigue life estimation of skin structures at room and elevated temperatures.13In addition,the German Space Research Center also began its thermal-acoustic experiment study to test the space shuttle’s Thermal Protection System(TPS).Since 2000,NASA has proposed the Next-Generation Launch Technology (NGLT)research project, and the structure design of aircraft has also been gradually shifted from thermal protection to thermal structures.14
Due to high cost and the fact that reliable data acquisition is difficult in experimental test for severe thermal-acoustic loads, in structural design process, theoretical and numerical studies have received particular attention. Besides, predicting the response and life of complex structures under thermalacoustic conditions has become a huge challenge for experts.Based on the Galerkin method, Lee obtained the singlemode equations of motion of a rectangular isotropic plate under thermal-acoustic loads, and calculated the mean and effective values of stress and strain responses by using Equivalent Linearization (EL) method.15,16With the improvement of calculation ability, Finite Element Method (FEM) that can analyze nonlinear response analysis of complex structures has gradually become a mainstream method. Alaimo et al.extended FEM to the simulation of multilayered magnetoelectro-elastic plates.17. Besides, on the basis of a Damage Curve (DC), Chaboche and Lesne investigated a fatigue estimation method.18Lukas and Kunz discussed the effect of average stress on stress life and strain life,and introduced different fatigue damage models, such as Goodman, Morrow, Smith-Watson-Topper (SWT) and Walker models.19Chilakamarri and Lee focused on fatigue damage accumulation model for structures in snap-through regions,20and through assuming that the occurrence process of snap-through obeys the Poisson process and the structure jumps between two locations with equivalent absolute values of stress, life calculation formula was derived, which was expressed by jumping rate. Przekop et al. developed several high-cycle fatigue models which are suitable for fatigue life estimation of metal structures under thermal-acoustic loads.21
In this paper, high-temperature acoustic fatigue test of superalloy thin-walled structure was carried out for the first time in China,obtaining damage positions, peak response frequencies, axial dynamic stress, fatigue lives and fatigue cycle numbers.Furthermore,finite element method22and fatigue life prediction model were respectively adopted to obtain simulation solutions under the load conditions that were the same as test. The mentioned fatigue life prediction model included improved rain-flow counting method, Morrow average stress model and Palmgren-Miner linear cumulative damage theory,which will be elaborated in theory basis below.Then this paper presented comparison between simulation results and experimental results to verify the validity of the calculation method of thermal-acoustic response and fatigue life prediction model.Finally, nonlinear dynamic response calculation and fatigue life prediction of superalloy rectangle thin-walled structures with four clamped edges in thermal-acoustic environment were implemented, and the feasible and effective analysis methods5were referenced to analyze the calculation results in detail.
2. Theory basis
In order to estimate fatigue life of superalloy thin-walled structures, this paper would count response peaks based on improved rain-flow counting method.And then combined with Morrow average stress model,Palmgren-Miner linear cumulative damage theory and the S-N curve of the material,the fatigue life would be predicted.In the estimation process of fatigue life, fatigue life prediction model is mainly divided into four steps:
(1) Obtaining a S-N curve of the material.The fatigue problem of metal thin-walled structures under thermalacoustic loads was considered to be high-cycle fatigue.Ref.23shows that the Basquin formula has a good fitting effect. Therefore, based on Basquin formula, the least squares method was adopted to fit the S-N curve in this paper.
(2) Determination of fatigue cycle by rain-flow cycle counting method. Selecting an appropriate peak count method to calculate fatigue cycles of structure damage in the response time history is an important part of the life estimation method in time domain. Dowling’s research24shows that fatigue life is the most accurate by rain-flow cycle counting method.
(3) Converting a non-zero mean cycle to a zero-mean cycle by average stress model. Although the general fatigue experiments are based on symmetric cyclic loads, the average stress level of the actual fatigue cycle has a great effect on the fatigue behavior of engineering materials.Therefore, Morrow average stress model was used in the calculation of fatigue life to convert non-zero mean stress cycle to zero-mean equivalent stress cycle.
(4) Based on fatigue cumulative damage theory, rain-flow cycle damage will be calculated, and the fatigue life will be estimated. Response of metal thin-walled structures under thermal-acoustic loads is a large deflection nonlinear response, and equivalent linearization method is an approximate method for solving nonlinear problems.Therefore, the typical linear cumulative damage‘Palmgren-Miner theory’ was applied in the calculation of fatigue life.
Besides, the following is a derivation process for key formulas.
On the basis of the constant amplitude and zero mean loads, a relationship between stress and life is expressed by Basquin equation as

where Sasais an amplitude of symmetrical alternating stress,σfis a fatigue strength coefficient,and b is the material constant.
Morrow average stress model can be easily written as

where Saand Smcorrespond to amplitude and average of stress cycle respectively.
Based on Morrow average stress model,fatigue life calculation formula is established as

Miner linear cumulative damage is

where Nidenotes the number of cycles at Sistress level, and(Nf)iis expressed as fatigue failure cycles in Sistress level.
By Morrow average stress model equation, damage expectation of a random vibration response can be expanded as follows:

where E(P) is a peak expectation of the stress load in unit time, T is an analysis time, Smaxis the maximum stress,and Sminis the minimum stress. The two-dimensional probability density function P(Smix,Smax) is obtained by rainflow circulation matrix RFM, and the following formula is satisfied.

where NRFis a total number of rain-flow cycle, and RFM is rain-flow circulation matrix,as presented in Fig.1.Obviously,the minimum stress is always less than the maximum stress,and therefore, taking the ratio of stress cycle R=Smin/Smax=1 to be a dividing line, the upper left half of RFM is used for calculation and analysis. Where Mean=C and Amp=C represent that mean value and amplitude value of stress cycle are constants.
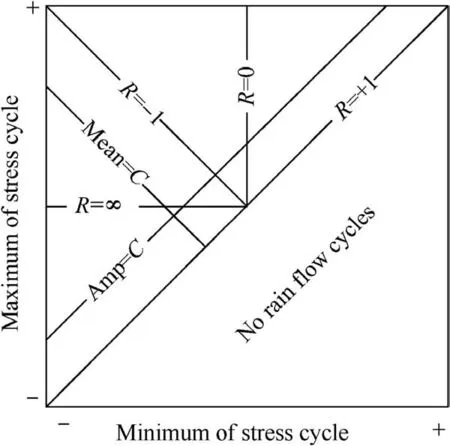
Fig. 1 Rain-flow cycle matrix.
In terms of the magnitude and mean of stress, damage expectation Eq. (6) can be transformed into the following form:

In a given finite time Tg, damage expectation of random vibration response is expressed as the following form by rain-flow circulation matrix (RFM) and rain-flow damage matrix (RFM).

When Eq. (9) equals 1, namely E(D)=1, the structure damage will occur. Moreover, based on two-dimensional rain-flow damage matrix (RFD(Sa, Sm)), the fatigue life of the structure is expressed as

3. Experimental verification of fatigue life prediction model
3.1. Fatigue experiment
(1) Description for experiment
Through the thermal-acoustic fatigue experiment of a new type of superalloy thin-walled structure whose material parameters are shown in Table 1, the damage location, peak frequency, dynamic stress and the failure time (fatigue life) of the structure were obtained,and the acoustic fatigue S-N curve of the material at high temperature was fitted.It was noteworthy that due to harsh environments with high temperature and strong noise and the difficulty of obtaining reliable data,some invalid data needed to be removed during data extraction and fitting processes.

Table 1 Material parameters at different temperatures.
The thermal-acoustic fatigue experiment specimen was similar to a tongue plate whose dimension is presented in Fig. 2.The experiment was performed in a traveling wave tube. A square fixture was used to realize the clamped constraint at root of experiment specimens.The square fixture was installed on one side of the traveling wave tube, and quartz tube was mounted on the opposite side. Then seven experiment specimens were in staggered distribution on the fixture.This experiment was divided into two groups (group A, group B),through a quartz lamp heating. Based on double-sided asymmetric heating and a high-temperature closed-loop control cabinet, the surface temperature of structures would be maintained at 723 K. Moreover, the given temperature and measured temperature from the feedback system are depicted in Fig. 3. In addition, the sound pressure levels of group A and group B were 151.5 dB and 154.5 dB, respectively. In order to cover the first-order resonance frequency, one-third octave bands of 80 Hz and 100 Hz were controlled mainly.The Over-All Sound Pressure Level (OASPL) load control spectrum 154.5 dB is shown in Fig. 4.
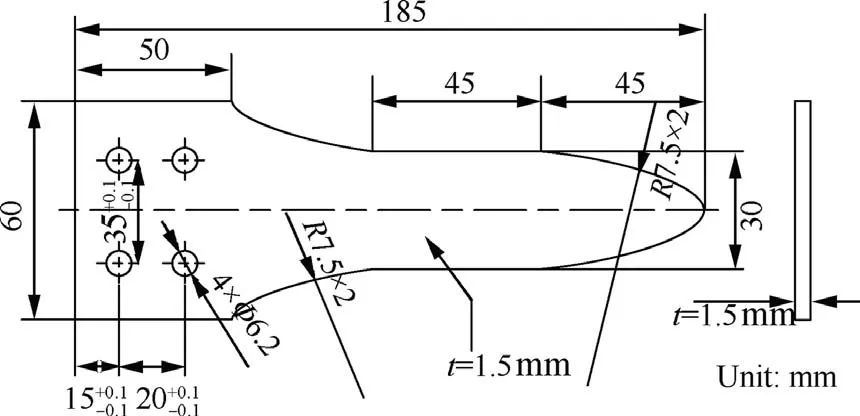
Fig. 2 Dimension of experiment specimen.
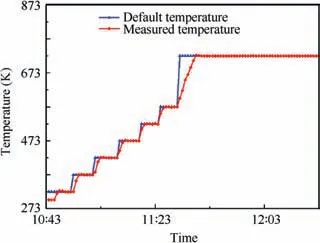
Fig. 3 Given temperature and measured temperature from feedback system.
(2) A fitting process of S-N curve
The visual inspection method was adopted to judge the fatigue life of experiment specimens.The first-order resonance frequency begins to drop significantly when the macroscopic crack initiates on the surface of experiment specimens. Furthermore, when it falls below the lower limit of a narrowband frequency, the amplitude of the experiment specimens will be significantly reduced. These phenomena are used to determine whether experiment specimens are destroyed.When the amplitudes of experiment specimens are found to be significantly reduced,the current time is recorded as the failure time,namely fatigue life.
The peak response frequency, dynamic strain/stress response,and fatigue life results of experiment specimens were extracted by this experiment. Based on these results, stress responses and failure positions of superalloy thin-walled structures were analyzed under a given thermal-acoustic load.Then the least square method was selected to fit the S-N curve of the material at 723 K by the obtained fatigue life data. As seen from Fig. 5, the upper limit fitting curve is lg Ss=-0.10704lg Ns+3.0814, the lower limit fitting curve is lg SX=-0.11495lg NX+2.9394, and the geometric fitting curve is lg S=-0.10824lg N+2.9811.
3.2. Verification for simulation and experiment
(1) Simulation and analysis
Geometry model and material parameters in simulation were consistent with experiment.Based on finite element calculation method, shell181 element type in commercial software of Ansys APDL was adopted to calculate finite element model presented in Fig.6,where clamped boundary constraints were imposed on the root position. The thermal load was uniform temperature field 723 K. According to the noise load applied in the experiment, the total sound pressure levels were 151.5 dB and 154.5 dB, respectively, in simulation by extracting the 1/3 octave of the noise load, which was equivalent to each band. Moreover, the results show that the dangerous points of the structure are in root position and neck position,as depicted in Fig. 6.

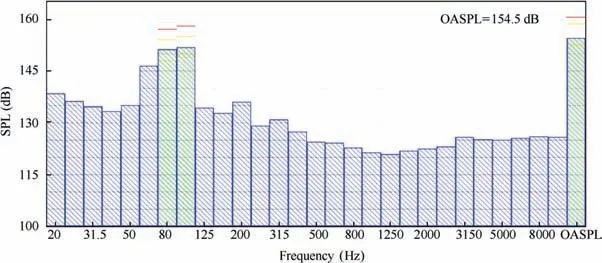
Fig. 4 Noise load control spectrum in 154.5 dB.
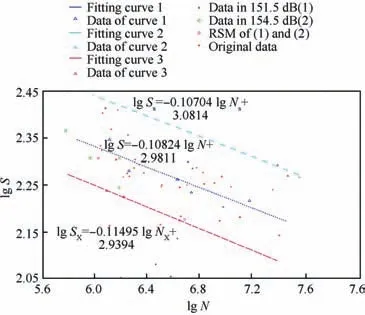
Fig. 5 S-N curves of superalloy thin-walled structures at 723 K(Logarithmic coordinates).
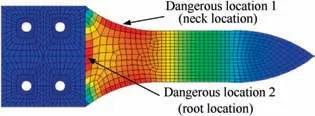
Fig. 6 A stress response contour of one experiment specimen at 151.5 dB.
Based on the extracted dynamic stress response results, the fatigue life of the dangerous points of experiments was estimated by combining improved rain-flow counting method,Morrow average stress model,Miner linear damage accumulation theory and the S-N curve obtained from the experiment.The results showed that fatigue lives were 1.46×10⁴s and 2.66×10³s at 151.5 dB and 154.5 dB, respectively.
(2) Result comparison of simulation and experiment
Comprehensive comparison results are illustrated in Table 2. The results show that the response peak frequency is consistent,the peaks of dynamic stress achieve a good agreement, and the thermal-acoustic fatigue life keeps the quite magnitude. The experiment specimens S-1 and S-5 are shown in Fig. 8.
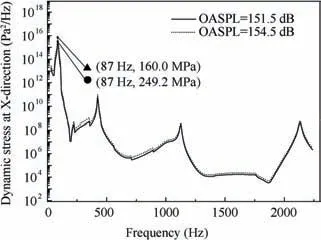
Fig. 7 Power spectral densities of X-direction dynamic stress at different sound pressure levels.
Analytical conclusion: comparisons between simulation and experiment include the dangerous positions, the peak frequency of response, the peak of dynamic stress response and the fatigue life, which show that damage locations are the same, response peak frequencies are consistent, the peaks of dynamic stress achieve a good agreement, and the fatigue life keeps the quite magnitude. It validates the feasibility of thermal-acoustic fatigue life prediction model.
4. Case analysis of fatigue characteristics
4.1. Thermal modal analysis of superalloy thin-walled structure
In order to further analyze the fatigue behavior of superalloy thin-walled structures under thermal-acoustic loads, a geometry model as shown in Fig. 9 was chosen for simulation. The clamped constraint was imposed on shadow part of a superalloy thin-walled structure.Thermal load was a uniform temperature field in a steady state.Acoustic load was Gaussian white noise with limited bandwidth (0-1500 Hz). Then through calculating dynamic responses of the structure in pre-buckling,critical buckling and post-buckling regions, the response results of unit 126 of the structure were mainly extracted for analysis. Importantly, based on fatigue life prediction model that was stated and verified in this paper,the response analysis was carried out using rain-flow circulation matrix and rainflow damage matrix. And fatigue life was predicted.

Table 2 Comprehensive comparison results.
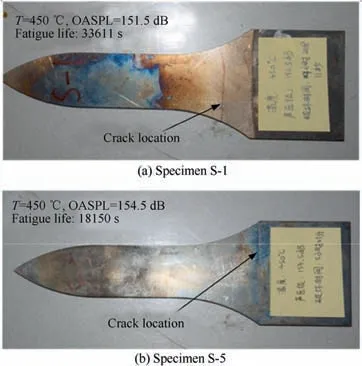
Fig. 8 Specimens after experiment.
In order to clearly illustrate the response results,a buckling coefficient S indicates the temperature change trend, where S=T/Tα.For example,(1.3,172)represents that the buckling coefficient is 1.3 and the sound pressure level is 172 dB.
The critical buckling temperature Tcr=341.61 K of the structure, and the first-order thermal-mode frequencies at different temperatures are listed in Table 3 and depicted in Fig. 10. In pre-buckling, the structure is in a softened region,and the fundamental frequency decreases as the temperature increases; in critical buckling, the fundamental frequency approaches the lowest value; in post-buckling, the structure is in hardened region and the fundamental frequency gradually increases.
4.2. Stress analysis and fatigue life prediction
Time-domain stress results of unit 126 under different thermalacoustic loads were extracted, as depicted in Fig. 11.It can be seen that with the increase of buckling coefficient in prebuckling region, the nonlinear response increases; in critical buckling region,the non-linearity of stress response is obvious;in post-buckling region S=1.3,acoustic load is stronger,and stress response shows a persistent snap-through motion.When S=1.6, thermal-acoustic load is comparable, and stress response shows intermittent snap-through motion. When S=1.8,thermal load plays a leading role,and stress response appears as a linear random vibration around a new balanced position in post-buckling region.
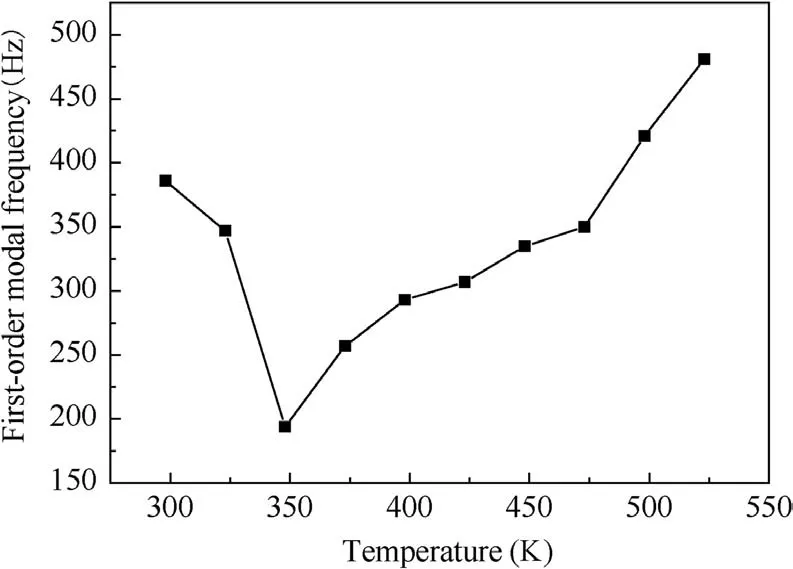
Fig. 10 First-order thermal modal frequency change with increase of temperature.

Table 3 First-order thermal modal frequencies of thin-walled structure at different temperatures.
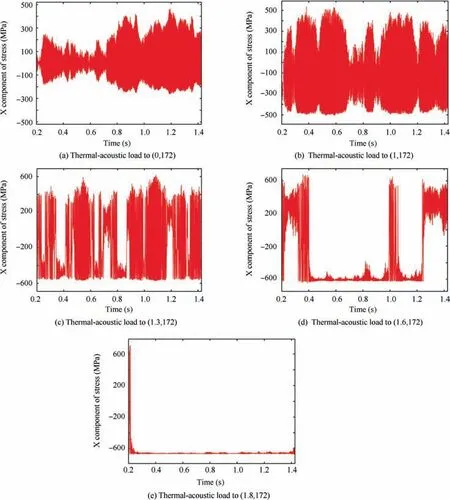
Fig. 11 Time history of stresses in different loads.
Rain-Flow cycle Matrix (RFM) and Rain-Flow Damage matrix (RFD) of stress response were plotted, through using improved rain-flow cycle counting method to count stress cycles, as shown in Fig. 12(a)-(h). Distribution and the damage degree of stress cyclic blocks are discussed in detail as follows.
At room temperature, stress cyclic blocks are mainly distributed in the main diagonal; absolute value of response is smaller and amplitude is larger; the damage is larger, which is caused by a large-amplitude stress cyclic block in upper left corner, as presented in Fig. 12(a) and (b).
In critical buckling, stress response non-linearity is significantly enhanced, stress cyclic block is offset to the lower left,and absolute values of stress response mean and amplitude increase,as depicted in Fig.12(c).Furthermore,the stress cyclic block denotes an increasing damage magnitude on the structure from 10-5in pre-buckling to 10-4in critical buckling, as shown in Fig. 12(b) and (d).
In post-buckling region, snap-through motion is determined with a relative strength of thermal loads and acoustic loads. When S=1.3, acoustic load is stronger than thermal load, and stress response shows a persistent snap-through motion. Moreover, the stress cyclic block becomes decentralized, but mainly concentrates in three areas including the upper left corner,the lower left corner and the upper right corner, as presented in Fig. 12(d).
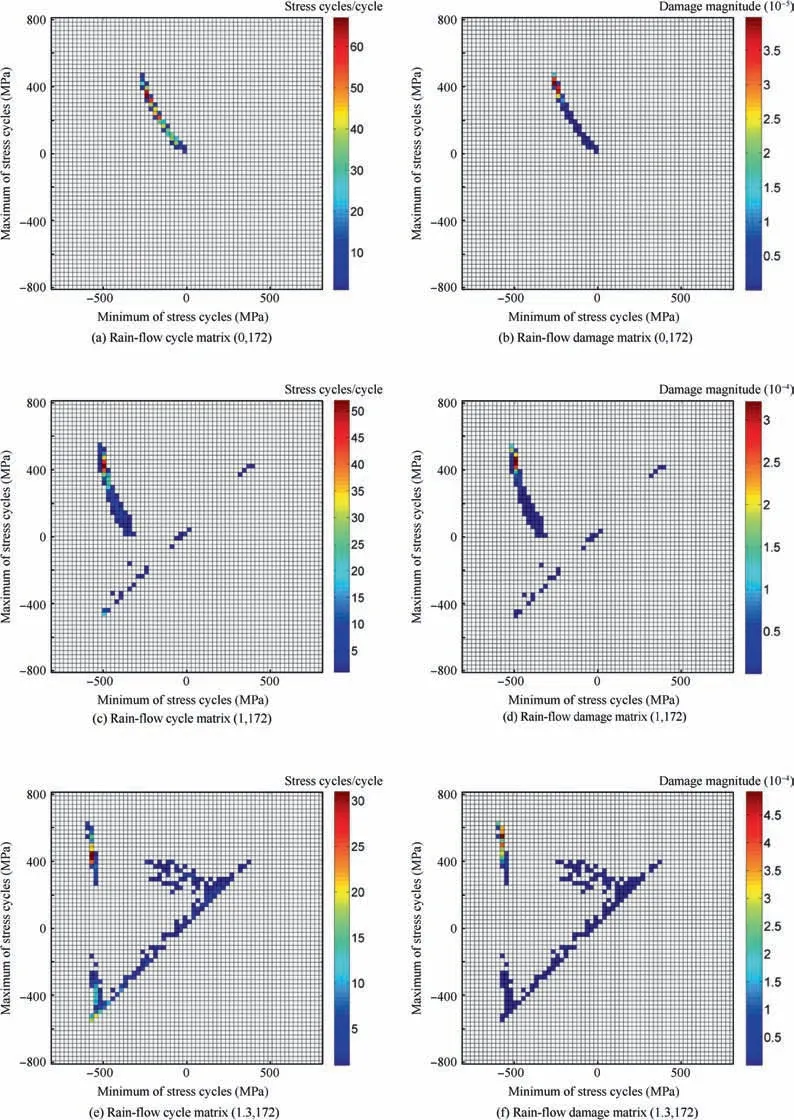
Fig. 12 Rain-flow cycle matrix and Rain-flow damage matrixes at different loads.
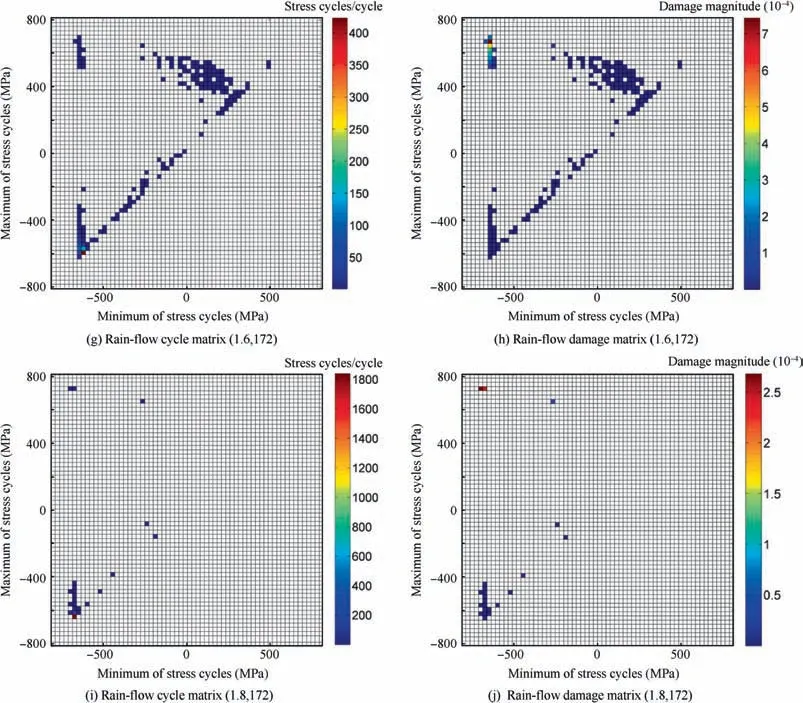
Fig. 12 (continued)
First,stress cyclic blocks in the upper left region correspond to a complete snap-through motion,stress response amplitude is large,and mean absolute value is small.Second,stress cyclic blocks in the upper right region correspond to a nonlinear random vibration around the upper convex equilibrium position.Because the structure stretching bending stress that is caused by upward vibration and compressive thermal stress are reduced mutually, the average value of stress cyclic becomes small.Third,stress cyclic blocks in the lower left region correspond to a nonlinear random vibration around the concave balance position. As the structure compressive bending stress caused by downward vibration and compressive thermal stress are superposed mutually,the absolute value of the stress cyclic mean achieves to be the maximum, as shown in Fig. 12(f).
With the increase of temperature until S=1.6, thermal loads and acoustic loads are suitable, and stress responses are intermittent snap-through motions, whose stress circulation blocks are mainly distributed in upper right corner and lower left corner respectively corresponding to a vibration around convex balance position and concave balance position.Moreover, the increase of thermal stress contributes to the increase of the mean absolute value of stress cyclic blocks in two regions as shown in Fig. 12(f)-(h) show that as temperature increases, the structure transits from persistent snapthrough to intermittent snap-through, and the mean value of stress response has a significant effect on the structure,causing the increase of damage. When S=1.8, thermal load is stronger than acoustic load,and stress cyclic blocks are mainly distributed in lower left area. Since the structural stress response performs a linear random vibration around a concave balance position, the mean value of response is the largest and the amplitude is the smallest, which reduces the damage degree to the structure as shown in Fig. 12(i) and (j).
Based on random fatigue life prediction model proposed in this paper,fatigue life of the structure under different thermalacoustic loads was calculated. Fig. 13 shows the change trend of the fatigue life with the increase of buckling coefficient at three different sound pressure levels. The results show that(A) for a given buckling coefficient, fatigue life decreases with the increase of sound pressure level;(B)for a given sound pressure level,fatigue life first decreases and then increases with the increase of buckling coefficient,reaching the minimum of fatigue life in post-buckling region. And the position corresponding to the minimum value shifts to the right as the sound pressure level increases. Because the pre-buckling structure is in a softened region, fatigue life is reduced, the structure is in a hardened region after buckling, and fatigue life is increased;as the sound pressure level increases,the range of the jumping response is expanded,so that the minimum life value is shifted to the right.
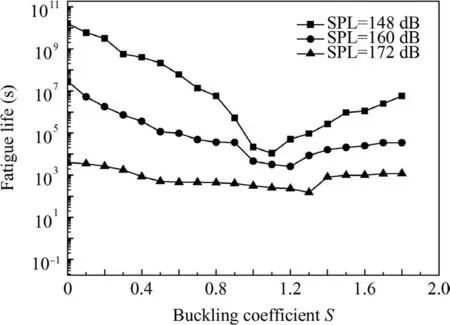
Fig.13 Fatigue life curve under different thermal-acoustic loads.
5. Conclusions
(1) Thermal-acoustic fatigue experiment of superalloy thinwalled structure was carried out to measure the basic data for fitting the S-N curves at 723 K based on the least square method. The results show that S-N curves are divided into upper limit fitting curve, lower limit fitting curve and geometric mean square fitting curve,which successively correspond to the formulas lg Ss=-0.10704lgNs+3.0814, lgSX=-0.11495lgNX+2.9394,and lgS=-0.10824lgN+2.9811.
(2) Through making result comparison comprehensively between simulation and experiment in dangerous positions, the peak frequency of response, the peak of dynamic stress response and the fatigue life, the results show that damage locations were the same, response peak frequencies were consistent, the peaks of dynamic stress achieved a good agreement, and fatigue life kept the quite magnitude, which validated the feasibility of thermal-acoustic fatigue life prediction model. Furthermore, the calculation methods will provide references to dynamic strength design of aerospace engine thinwalled structures.
(3) The snap-through response types of superalloy thinwalled structure in post-buckling region determine the distribution of stress circulation block. Once the temperature reaches a given value and thermal load plays a leading role in structures, the snap-through motion will disappear. But the structure will make the linear random vibration around an equilibrium position in post-buckling region, which will reduce the structural damage degree. Improved rain-flow counting method was used to calculate structure stress response results, and the fatigue life of the structure under different thermal-acoustic loads was estimated.The results show that for a given acoustic load, in pre-buckling the structure is in softened area and fatigue life decreases with the increase of temperature; in post-buckling the structure is in hardened area and fatigue life increases with the increase of temperature within a certain range.
Acknowledgements
This study was co-supported by Aviation Basic Science Fund Project of China (No. 20151554002), Natural Sciences Key Project of Chengdu Aeronautic Polytechnic in China (No.061754),and Natural Sciences General Project of Sichuan Province Education Department in China(No.18ZB0057).In the meantime,the authors thank Aeroengine Research Institute in China for providing thermal-acoustic test data.
 CHINESE JOURNAL OF AERONAUTICS2020年2期
- CHINESE JOURNAL OF AERONAUTICS的其它文章
- Delaying stall of morphing wing by periodic trailing-edge deflection
- Optimization and verification of free flight separation similarity law in high-speed wind tunnel
- Non-intrusive reduced-order model for predicting transonic flow with varying geometries
- Consideration on aircraft tire spray when running on wet runways
- Aeroelastic simulation of the first 1.5-stage aeroengine fan at rotating stall
- Experimental study on NOx emission correlation of fuel staged combustion in a LPP combustor at high pressure based on NO-chemiluminescence
