Assessment of converting approach to eきcient design of micro-turboprop engines
Hmed GOLCHIN, Fthollh OMMI,*, Zoheir SABOOHI
a Department of Mechanical Engineering, Tarbiat Modares University, Tehran 14115-111, Iran
b Aerospace Research Institute (ARI), Ministry of Science, Research, and Technology, Tehran 14115-111, Iran
KEYWORDS Axial turbine;Blisk;Gas generators;Micro-turboprop;Power unit
Abstract The design, manufacture and experiment of a shaft power unit for converting a microturbojet engine to a micro-turboprop in the class of less than 20 kW with the aim of obtaining maximum shaft power were described in this study.For this purpose,a Wren100 micro-turbojet engine was used as the gas generator,and the specifications of its outflow were measured.The optimal configuration of the inter-stage diffuser,which was an annular S-type diffuser,was selected based on its small total pressure drop and outlet flow uniformity.The power turbine was a single stage axial turbine that was designed based on the fixed nozzle angle assumption without any taper or twist in its stator.The turbine rotor was a bladed disk(Blisk)in which its unique blade profiles were designed based on the Wilson method. Subsequently, the shaft power unit was completed by designing and manufacturing an exhaust complex and gearbox. Finally, the micro-turboprop engine was tested with an overloading propeller. The results show a significant increase in the extracted power, an acceptable efficiency of the power turbine,and a significant reduction in the Specific Fuel Consumption (SFC) compared to other engines that use similar gas generators.
1. Introduction
Micro Gas Turbine (MGT) engines are a relatively new category of turbine engines that have gained attention concurrently with the widespread use of Unmanned Aerial Vehicles(UAVs) in the last two decades. Their characteristics include a high power to weight ratio,trivial vibration,reliability,much better performance in high altitudes and capability to use heavy fuels.1Such characteristics have made this class of engines an appropriate option for the propulsion of UAVs.2Therefore, micro-turboprop and micro-turboshaft engines have a special status among turbine engines due to the adaptation of their performance characteristics to the requirements of a large number of UAVs.
Various studies have been conducted on the development of micro gas turbines regarding the propulsive power required for a large group of lightweight drones with a maximum take-off weight lower than 300 kg. Rodgers3focused on an engine architecture using the recuperator and targeted the promotion of total engine efficiency to compete with highly turbocharged piston engines through accepting some penalties like increased weight and mechanical complexity.Vick et al.4investigated the application of the recuperator and a newly designed 3 kW micro-turboshaft engine based on two stages of a centrifugal compressor and two stages of an axial turbine; then, they showed that it was possible to achieve the thermal efficiency of about 23%using this design.Nevertheless,other such studies still prefer the application of the simple architecture of the gas turbine engine (without the recuperator) to avoid the mechanical complexity and increased weight. The study of Kro¨ger et al.5,6is among the most outstanding works done in this area in which a highly efficient 80 kW turboshaft engine was designed. These researchers have shown that in spite of relatively high errors in the manufacturing process of the turbine and compressor components, it is possible to attain an 80% isentropic efficiency through a three-stage compressor that includes two axial and one mixed flow stages.In addition,the total isentropic efficiency of the turbine can approach to 87%when dividing the expansion ratio between the two stages in the axial flow turbine.
The aforementioned works are basically design-based researches7in which the design process of an engine has been investigated for a special class of UAVs. Albeit, such an approach logically results in the appropriate engine design for specified UAVs. It should be noted that for inexpensive aerial vehicles such as small and/or lightweight drones that require a wide range of propulsion capabilities due to their assorted applications, choosing a design-based approach can be costly and non-operational. On the other hand, it is worth noting that a wide range of micro-turbojet engines with a thrust of about 20 N up to 1,600 N are available in the existing markets,8,9and the design and manufacturing costs can be reduced significantly if these engines are used as the gas generator for a micro or small turboprop or turboshaft engine.Due to the variety of micro-turbojet engines that are currently being produced, it is possible to select the target microturbine engine according to any required power level. A small number of micro turbine manufacturers now use this approach, which is known as the converting approach.
Generally, scaling is a common technique to define smaller geometries with similar characteristics.However,a simple scaling of a high-performance large gas turbine would not result in a good micro turbine.The main factors perturbing such a scaling were10: large decrease in Reynolds number and so increased viscous losses,heat transfer between the hot and cold components due to their close proximity and the compact architecture of the micro turbines,and geometrical restrictions related to the material and manufacturing of miniaturized components(for example impossibility of reaching to the same levels of rotor tip clearance compared to the large turbine engines). Also, the turbine blades of MGTs are difficult to cool because of their small size. So, these engines are designed for a low turbine inlet temperature. Thus, a lower design pressure ratio is used than in large gas turbines.Consequently,this low turbine’s inlet temperature and low pressure ratio lead to low thermal efficiency.11For quantifying the effects of the above factors on the performance of MGTs, Vick7has calculated thermal efficiency of three less than 10 kW commercial micro turboprop engine and has shown that it is only between 3%and 5.5%. But, although by reducing the dimensions and power level of the turbine engines, their efficiencies decrease and the loss values of the engine’s components increase.12It seems that the performance of the commercially offered micro-turboprops that are based on the converting approach is lower than the expected level. Therefore, the present study attempts to demonstrate the feasibility of converting a micro-turbojet engine into a micro-turboprop engine in a power class of less than 20 kW with increased performance and efficiency using a simple and inexpensive approach. The performance test of the newly designed micro-turboprop engine and the use of axial configuration for designing the power turbine are the main points that distinguish this study from similar researches.13
For this end,a Wren100 micro-turbojet engine was used as the gas generator. The appropriate design point of the axial power turbine was selected based on the objective of this study(maximum extractable power) using the collected data of the Wren100 experiments at different rotational speeds. A road map of the design procedure of the micro-turboprop engine is presented in Fig.1.For the sake of abbreviation,the phases of the flowchart that are highlighted in pink are not described in this manuscript.It should be noted that the geometry of the inter-stage diffuser, which directs the high-energy outflow of the gas generator to the power turbine, was adopted based on the results of the CFD simulations. Consequently, the single stage axial turbine was designed with the application of the fixed nozzle angle assumption, and for the loss prediction, the proposed method of Aungier14was employed. Subsequently,the Wilson method15was used for designing the turbine blade profiles.Based on the results and after modeling the real geometry of the turbine, the other components of the power unit such as the exhaust complex and gearbox were designed. The next step included manufacturing all of the designed components. Finally, after connecting the gas generator, the performance of the designed micro-turboprop engine was evaluated using a specially designed torque and thrust test rig.
2. Case study
The Wren100 engine is a micro-turbojet engine with the maximum thrust of 100 N at 1.6×10⁵r/min. Like most other micro-turbojet engines in this thrust class, it uses a simple architecture including a single-stage centrifugal compressor,an annular reverse flow combustion chamber using the concept of stick vaporizers, and a single-stage axial turbine(Fig.2).The pressure ratio of the Wren100 compressor is only about 2.3, which may be the lowest pressure ratio among the other micro-turbojet engines with nearly the same thrust(Table 116-20). Theoretically, a gas turbine can be used as the core of a turbojet engine or the gas generator of a turboprop when the value of the total pressure at the turbine exit would be sufficient for accelerating the hot flow in the nozzle or for driving a second (power) turbine at the downstream of its turbine.Having the lowest pressure ratio means most probably that the Wren100 has the lowest remaining total pressure level after its turbine. This clearly means that in the case of having relatively the same mass flow rate, the Wren100 has the lowest potential among its counterparts for use as the gas generator of a micro-turboprop engine.
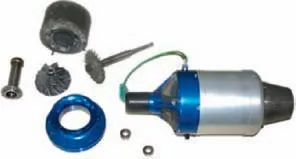
Fig. 2 Wren100 micro-turbojet engine and its components.
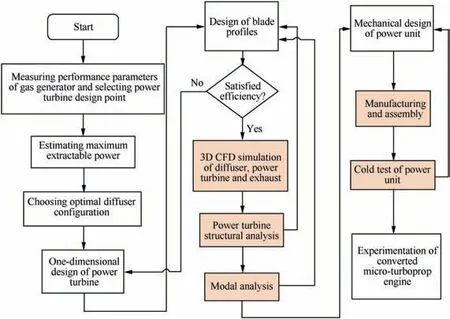
Fig. 1 Roadmap of design procedure of micro-turboprop engine.

Table 1 Specifications of Wren100 and some other micro-turbojet engines with relatively the same thrust level.16-20
One of the goals of the present study was to demonstrate the poor performance of commercially available microturboprop engines that use engines similar to the Wren100 for their gas generators. The Wren100 was used intentionally as the gas generator to evaluate the amount of maximum shaft power that could be extracted, even in the case of such a lowpressure gas generator. Table 1 shows a comparison between some of the performance parameters and specifications of the Wren100 and some other micro-turbojet engines in its class. It can be seen that the engines outside diameter had a direct relationship with the pressure ratio. This was due to the fact that a bigger engine outside diameter meant that it had a bigger compressor.
3. Architecture of designed micro-turboprop
3.1. Gas generator
As previously mentioned, a Wren100 micro-turbojet engine was used for the gas generator. The key parameters necessary for designing and matching the power turbine with the gas generator included the total pressure after the gas generator turbine, mass flow rate, total temperature, and the exiting Mach number. The values of these parameters could be calculated by cycle analysis if the efficiency of the engine’s components were known, but given that there was no valid data for the mentioned values, another approach was utilized. In this approach,rather than calculating the aforementioned parameters in Station 5 (after the gas generator turbine), their values were measured directly under a wide range of gas generator working conditions.A summary of these measurements,which were done using a test rig(Fig.3)other than those used for the experiments of the designed micro-turboprop engine, is given in Table 2 and Fig. 4. Based on these results, it could be observed that there was a high dependency between the total pressure and mass flow rate of the gas generator with its rotational speed.It was such that about 13%decrease in the maximum speed of the gas generator led to 14% and 15.5%decrease in the total pressure and outlet mass flow rate from the gas generator turbine,respectively.This issue has also been reported by other researchers21and it appears to be a part of the classic specifications of micro-turbine engines. Since one of the objectives of this study was to obtain a high value of shaft power along with an acceptable efficiency from the designed power unit, the design point of the power turbine was chosen in accordance with the performance conditions of the gas generator at 157,500 r/min.This was achieved using the data of Table 2 and the trend of changes in the main parameter of Fig. 4.
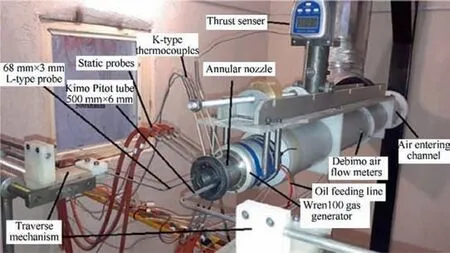
Fig. 3 Gas generator (Wren100 engine) on its data capturing test rig.

Table 2 Wren100 performance parameters resulting form tests.
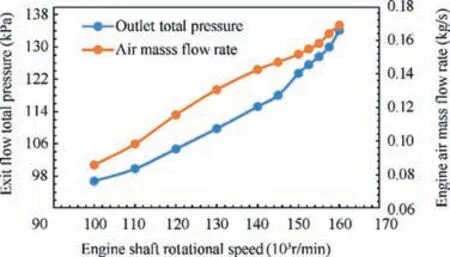
Fig. 4 Air mass flow rate and exit total pressure of Wren100 engine.
The value of the outflow’s swirl at the gas generator exit is a parameter that significantly affects the proper design of the power turbine.22-24Generally, the velocity field of the fluid flow is measured using such means as three components hot wires or multi-hole Pitot probes.25,26However, since the temperature of the turbine outflow at the design point was higher than 700°C in this study, it was not practical to use the hot wire sensor.On the other hand,it was not possible to measure the velocity field of the outflow of the gas generator due to the inaccessibility of a miniature multi-hole pressure probe that works under such high temperatures. Hence, the components of the flow field were determined with acceptable accuracy by conducting a simple and special experiment. So, by using a short nozzle (especially manufactured for this experiment),a steel wire with a 0.9 mm diameter and 35 mm length was placed 5 mm away from the gas generator turbine on a blade mean radius. Since this wire could move freely in directional and azimuthal orientations, it was an appropriate index for measuring the angle of the outlet flow with respect to the axis of the gas generator. Accordingly, it replaced the original nozzle of the Wren100 engine, and the deviation angle of the exiting hot flow was examined by doing two experiments.The results showed that the index wire deviated 2.6° at 156,000 r/min from the gas generator axis(Fig.5).In addition,the amount of deviation in the radial direction was less than 1.5°. Concerning these results, the assumption of a zero swirl for the outlet of the gas generator turbine was applied in the preliminary and one-dimensional designs.
3.2. Power unit
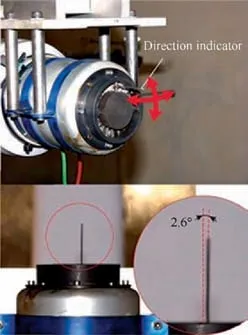
Fig.5 Experimental nozzle and swirl indicator at 156,000 r/min.

Fig. 6 Main components and structure of converted microturboprop engine.
The shaft power unit, in fact, converts and transforms the Wren100 micro-turbojet engine into a micro-turboprop engine of which the Wren100 is used as the gas generator. The structure of the converted micro-turboprop can be observed in Fig.6.In such a structure,the hot gas exiting the gas generator(I)passes through the single stage axial power turbine(III)via an inter-stage diffuser (II). After its energy is converted into shaft power, it is discharged through the exhaust (IV) into the environment. The generated power enters the gearbox(VI) by the turbine shaft (V) at a high speed. As its rotational speed is converted into torque,the propeller shaft(VII)rotates creating the thrust force.
3.2.1. Inter-stage diffuser
The duty of the inter-stage diffuser was to guide the outlet gas from the gas generator to the power turbine.Two main objectives were considered in the diffuser design27: the minimized total pressure loss of the flow and the uniformity of its outflow profile. In this study, a third limitation was considered in designing the inter-stage diffuser in which the diffuser length should not be more than 60 mm due to limitations in the total dimensions of the engine. Because of the composition of the gas generator, and as the power turbine was an axial turbine,the diffuser geometry was annular. In addition, because of the subsonic speed of the flow that entered into the diffuser(about Mach number 0.65) as well as the simplicity and manufacturability of its design,conical-annular and S-type annular configurations were taken into account.In the conical-annular configuration, the two internal and external walls of the diffuser were linear and parallel to each other; in fact, each one was a part of a cone,while in the latter,two circular arcs were used at the beginning and end parts of both the internal and external walls;in each of the walls,two straight lines connected these two arcs to each other. The need to minimize the losses and also what is called the optimal increased ratio for interstage diffusers28,29resulted in choosing 1.93 as the area ratio of the outlet to the inlet of the diffuser. Applying this ratio and based on the two aforementioned generic configurations,four geometries including two conical-annular and two Stype annular diffusers with a 45 and 60 mm length (Fig. 7)were simulated by CFD using 3D viscous assumption.In these simulations, the inlet flow conditions to the diffusers were equal to the real outlet condition of the Wren100 engine at 157,500 r/min, and the swirl component was equal to 2.6°.The results showed that as the diffusers were shortened, due to the more intense deviation of the flow, the outlet velocity profile became non-uniform, while the total pressure loss remained nearly the same. The simulations also showed that although the total pressure losses were much closer to each other in both the 60 mm conical and S-type diffusers, when the uniformity of the outlet velocity profiles was taken into account, the S-type got a higher score. Fig. 8 shows the axial speed profiles of the flow exiting the above diffusers along their outlet radius.Also,Table 3 summarizes the total pressure drop of the flow in these diffusers.Therefore,the 60 mm S-type diffuser was selected as the optimal design. It is noteworthy that the blades of the power turbine’s stator were practically the only connecting elements of the internal and external casings of the diffuser.
He got suspended for two days and had two days of in- school detention5 after that. I sometimes wonder if I had not told, would he have done what he said he was going to do? The guys in Colorado seemed pretty normal to a lot of people. The bottom line is, you should never joke around about something as serious as killing6 people. If you do, responsible people have no choice but to have you checked out to ensure everyone else s safety.
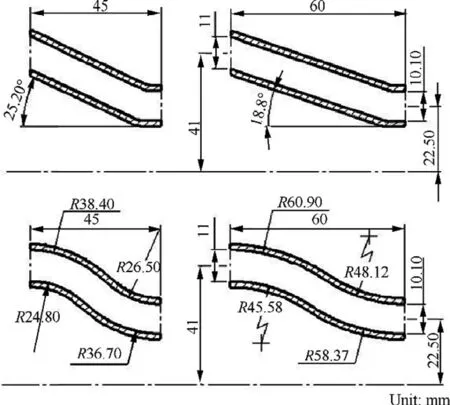
Fig. 7 Four simulated configurations for inter-stage diffuser.
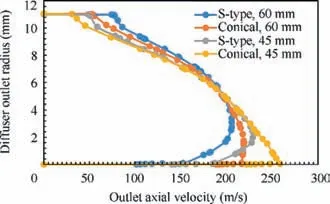
Fig. 8 Outlet axial velocity profiles of four simulated diffusers.

Table 3 Total pressure difference between inlet and outlet of diffusers.
3.2.2. Power turbine
The power turbine could be considered as the heart of the shaft power unit of a twin spool turboprop engine.As mentioned,in the present work the experimentation of the designed turbine and shaft power unit was planned. However, it should be noted that manufacturing and testing under real conditions could lead to considerations and even constraints that should be regarded in the design phase. In this work, concerning the configuration of the gas generator and its outlet total pressure value, the designed power turbine was a single-stage axial turbine. The following constraints were taken into consideration for the turbine design.First,the rotational speed of the power turbine should not exceed 60,000 r/min due to problems with manufacturing, stress considerations and its interaction with the gearbox design. Second, the degree of reaction should never become less than zero in any radius. Third, the turbine stator should be designed in such a way that its manufacturing does not require complicated and expensive processes and at the same time, its exit angle (α6.5) should not exceed 70°.Fourth, the absolute velocity of the flow at inlet and outlet was assumed in an axial direction. Fifth, the mean radius was fixed from the beginning to the end of the stage. Sixth,the outer diameter of the turbine rotor should not be bigger than 100 mm. Accordingly, the turbine design process started with the design at the mean radius by using the values of the mass flow rate, total temperature and total pressure of the gas generator at 157,500 r/min, as well as considering the aforementioned constraints. The next step included selecting the initial values for the degree of reaction,loss values in rotor and stator, and efficiency. During this process, as the flow angles and velocity triangles were determined,the main parameters of the gas and also the work and flow coefficients in the mean radius were calculated. Then, the annular cross-section at the beginning of the stator (cycle Station 6), entering to the rotor(cycle Station 6.5),and exiting of the rotor(cycle Station 7) was specified. To calculate the changes in the radius direction, the radial equilibrium assumption was applied to the momentum equation (Eq. (1)).

In view of the manufacturability of the turbine nozzle using simple techniques,the assumption of the fixed nozzle angle was applied for finding the tangential and axial changes in the velocity distributions (Eqs. (2)-(4)).

In Eq. (4), subscript "m" refers to mean radius location.Therefore, the twist of the rotor blade was computed based on this assumption.Then,the values of the pitch to cord ratio(Sp/Cd) and aspect ratio (h/Cd) were determined in regard to the height of the rotor and stator blades in their entrance and exit;upon this,the number of rotor and stator blades were determined. Subsequently, the loss values were evaluated based on the Aungier method. Finally, the stage efficiency was specified via Eq. (5).

The process explained above was iterated until the assumed initial efficiency and final efficiency became nearly equal. On the other hand, as this was an experimental study, it was possible to calculate turbine total to static efficiency by Eq. (6)based on the thermodynamic properties captured from the experiments. By using a similar approach, the power of the designed turbine can be calculated via Eq. (7) when the mass flow rate of the hot flow and the total temperature difference across the power turbine are known.

The novelty of this study includes the rotor blade profiles from the root to tip that are designed using the data obtained from the turbine design process and based on the Wilson technique. The outcome of this process is the creation of unique rotor blade profiles that are in accordance with the requirements of the power turbine in this study. Presently, no such sample exists or has been used in other studies. The algorithm introduced by Wilson is a technique for designing axial turbine blades based on empirical data and special geometric relations.It should be noted that the relative rapidity of this technique and the lack of valid data regarding the profile shapes of the appropriate blades for small axial turbines have influenced the selection of this method. Meanwhile, the proficiency and effectiveness of the Wilson method in designing the small axial turbines will be revealed accordingly.
The priorities in the design of the shape of the stator blades include their geometrical simplicity, low manufacturing costs,and acceptable efficiency. This is reached when any taper or twist in the stator blades is prevented and a fixed airfoil profile with a fixed chord and thickness (from root to tip) is considered for them. When combined with the fixed angle in the blade outlet, these constraints create a very simple shape; the mean line of the stator blade is only composed of a circular arc on the leading edge side and a straight line tangent to this arc. This straight line is in line with the blade outlet angle(α6.5). Then, a fixed thickness is distributed along both sides of the blade from the root to the tip. The circular arc of the stator blade composes about 54% of the cord length and makes the beginning of the blade in line with the engine axis.The tangential line on the extension of this arc, which forms 46% of the remaining cord, makes the hot gas inflow deviate from the engine axis with a pre-calculated angle of α6.5. The cord length, thickness and number of stator blades are 16.7 mm, 1.5 mm and 19, respectively. To smooth the flow streamlines in the blade inlet and outlet, its beginning and end are formed like a half-oval with a ratio of small to large diameter of 1/4. Also the number of rotor blades is 26. Fig. 9 shows the stator blade profile and also the rotor blade profiles in various radii. Tables 4 and 5 respectively show the special dimensional ratios of the rotor blade,which are the end output of the Wilson design method, and the stations, gas angles,degree of reaction and work,and flow coefficients of the power turbine.It should also be noted that 1D calculations show that the design speed of the power turbine is 57,640 r/min.For evaluating the final shapes and dimensions, Fig. 10 shows a 3D CAD model of the designed rotor.
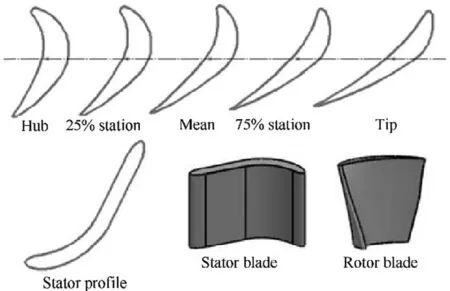
Fig. 9 Profiles of rotor and stator blades.
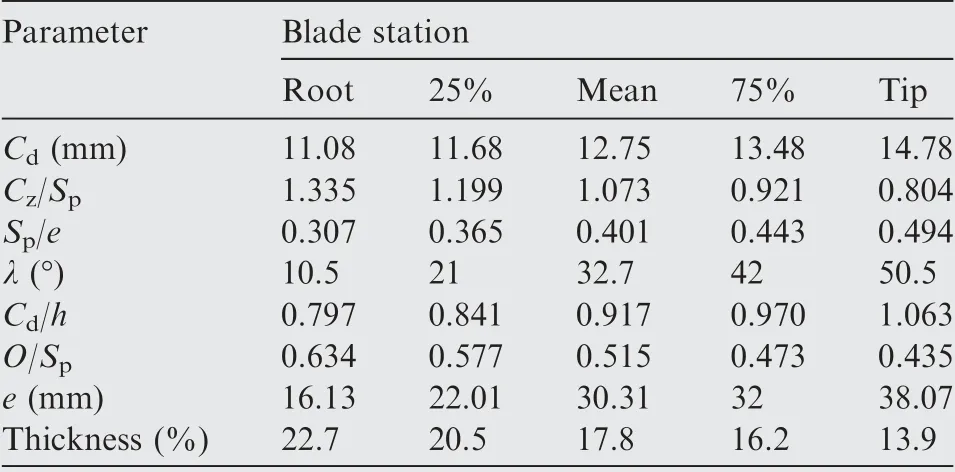
Table 4 Final geometrical ratios of rotor blade resulting from Wilson method.
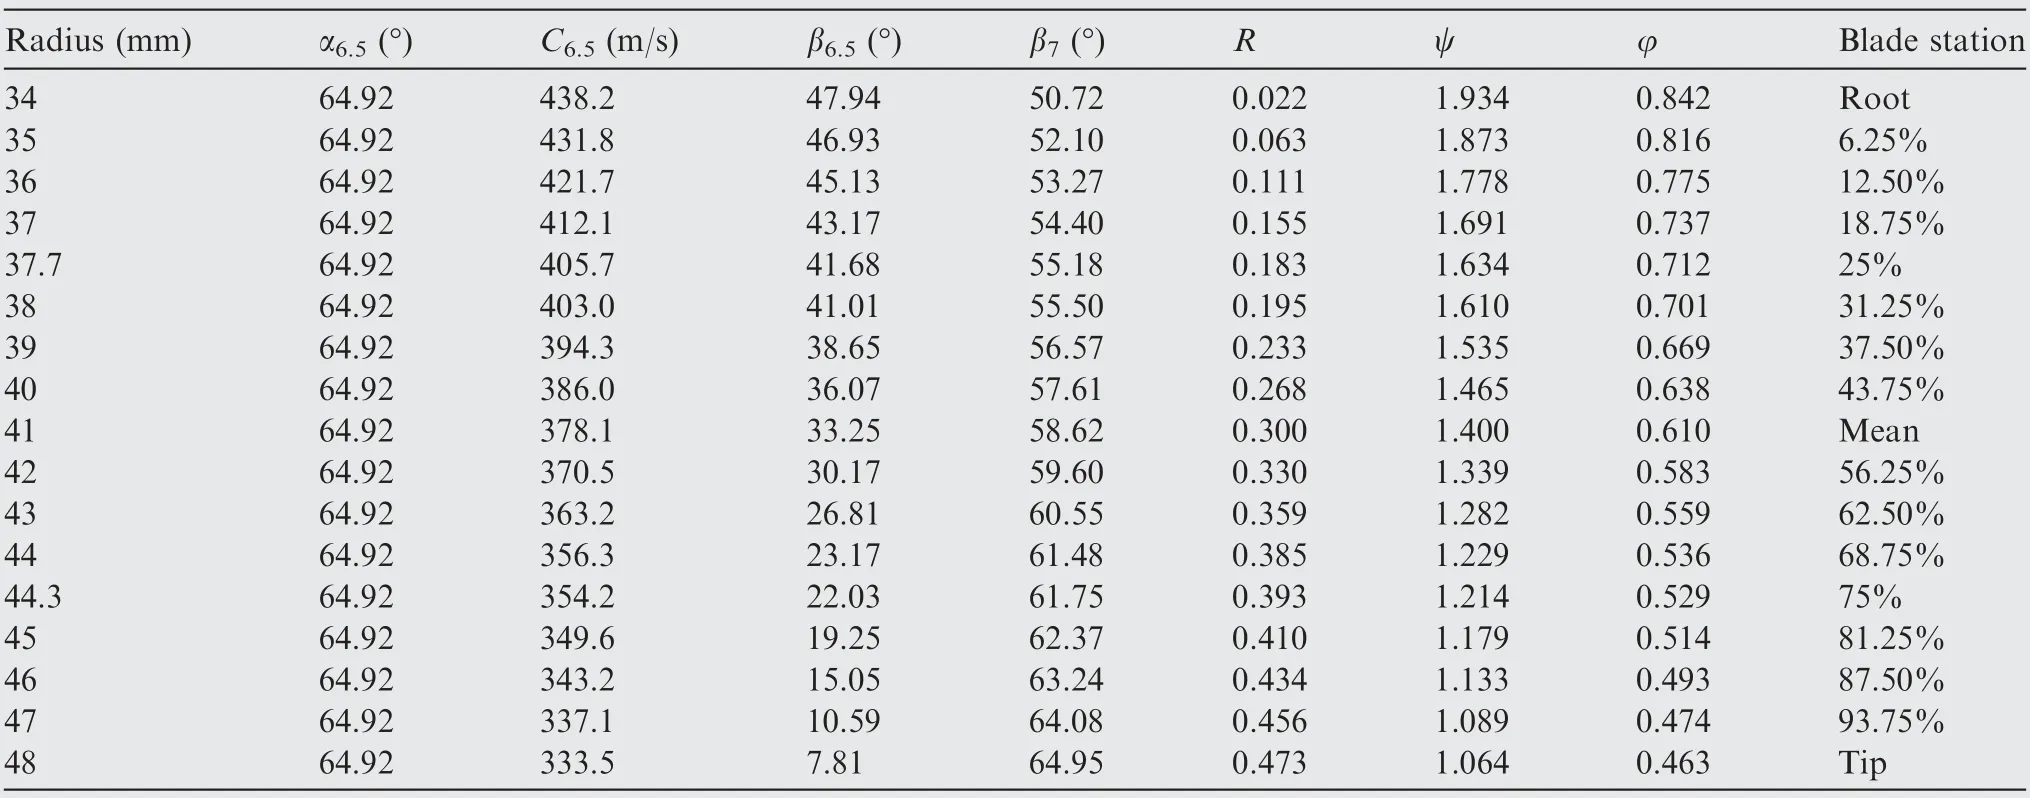
Table 5 Gas angles and performance coefficients of designed power turbine.
4. Mechanical design of power unit
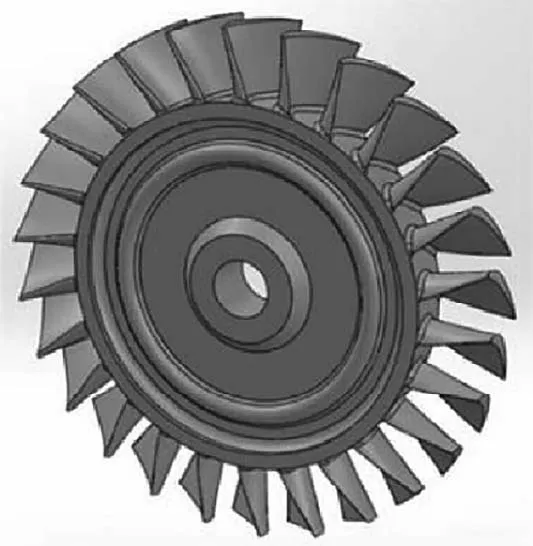
Fig. 10 Final shape of power turbine rotor.
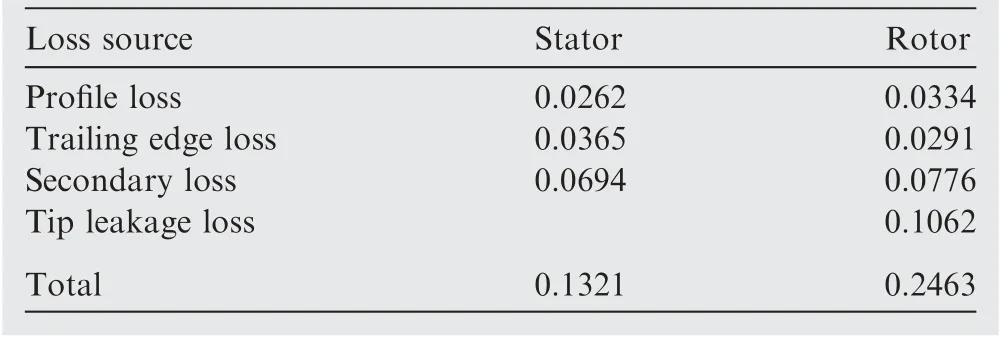
Table 6 Breakdown of loss sources in designed turbine stage(resulting from proposed method of Aungier).
One of the main phases of this research was the testing of the designed shaft power unit. Since there was no planned flying experiment, minimizing the component’s weights was not a priority, and attempts were made to prevent the length and diameter of the engine from exceeding 550 mm and 140 mm,respectively, as the design constraints. The structure of the designed shaft power unit can be seen in Fig. 11. All the components, except the special and complicated turbine rotor(Blisk) part, were designed in such a way that they could be manufactured by simple and inexpensive techniques.
4.1. Stator
The direct results of this simplified approach can be observed in the architecture of the turbine stator. As Fig. 11 shows, the turbine stator and S-type diffuser are an integrated part. The stator blades, other than their aerodynamic role in deviating the outflow of the diffuser with the angle of α6.5to the rotor,were the only structural members that connected the inner and outer shells of the diffuser. Due to the lack of any taper or twist in the stator blades, manufacturing the diffuser was such that after machining the internal and external casings,the slots related to the stator blades (as their seats) were created at the end of these two by Computer Numerical Control(CNC) machining. Then, the internal and external casings of the diffuser were located properly to each other using a fixture and by inserting the stator blades in the slots already created for them; then, the blades were welded to both casings. The blades themselves could be formed easily by machining or even sheet metal forming. Due to the accessibility of facilities equipped with CNC machining and the laser welding, the blades made of stainless steel 316L were machined and welded from the outside to the diffuser’s casings by laser.
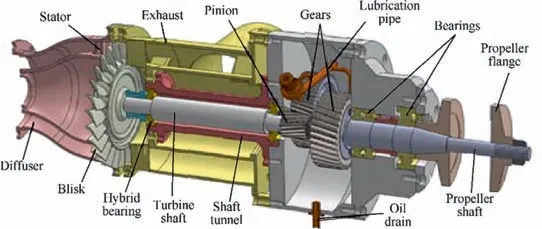
Fig. 11 Detailed structure of designed shaft power unit.
4.2. Rotor (Blisk)
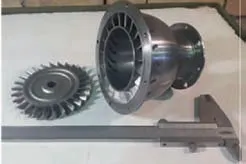
Fig. 12 Diffuser-stator and Blisk of present study.
Undoubtedly, the most important challenge in the manufacturing process of the shaft power unit is the construction of the turbine rotor (the Blisk). There are severe technical challenges because of its material, complicated shape and small dimensions. Due to difficult working conditions and high stress, the manufacture of the Blisk part requires a special material. The Inconel family are well-known super-alloys which are used in manufacturing the hot parts of gas turbines.31The manufacturers of micro-turbine engines generally employ investment casting to produce the Blisk part, but the nature and costs of using such a technique are only acceptable for mass production.Due to the lack of such conditions in this study, 5-Axis CNC machining is used to produce the Blisk.The Inconel 718 alloy is selected for its accessibility and suitable characteristics such as high creep strength and high yield strength in high temperatures.But,it should be mentioned that this super-alloy has weak machining properties.32When this characteristic is added to the small dimensions, complicated shape and high accuracy needed to make the Blisk, the problems are doubled. In such a situation, it is hard to find an appropriate milling cutter and at the same time, the chipping speed is considerably decreased. These limitations increase the machining time to 84 hours.To remove the milling cutter’s trace, the blades are sand blasted using a very fine grain abrasive at the end of the machining process.Fig.12 shows the final Blisk part after the machining and sandblasting processes alongside the finished part of the diffuser-stator. Also,Fig. 13 clearly shows the difference between the dimensions and shapes of the Blisk designed in this research with that of the gas generator (Wren100 engine) Blisk and the Wren54 micro-turboprop engine.
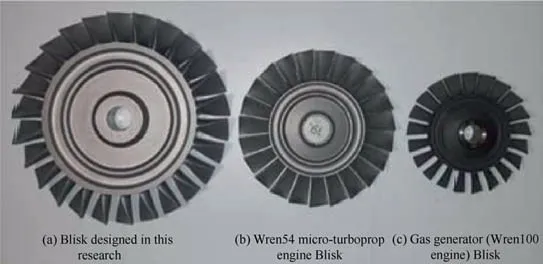
Fig.13 Comparison among Blisk designed in this research,Wren54 micro-turboprop engine Blisk and gas generator(Wren100 engine)Blisk.
4.3. Exhaust complex
The exhaust portion of a micro-turboprop engine was responsible for discharging the gas exiting from the power turbine into the environment. Design of this part of the shaft power unit was conducted keeping in mind that there was a structural similarity between the designed exhaust and the exhaust of similar engines. So, two pipe-shaped gas outlets were used instead of one big outlet.The structure of the designed exhaust complex was such that at its beginning, immediately after the power turbine, the annular area increased to 1.9 times more than that of the annular area of the rotor outlet. This section of the exhaust, which was a divergent part, had the same wall gradient as that of the rotor in its hub and shroud. Then, the flow entered to a completely annular section.At the end of this annular section, there were two pipe-shaped outlets with anangle distance of 180° and a total outlet area of more than 2.07 times that of the rotor outlet area. This area ratio caused the hot outflow of the rotor to be discharged to the environment with a Mach of about 0.1-0.15. Furthermore, it should be taken into account that the exhaust was structurally a very important part. In addition to connecting the diffuser to the gearbox, it encompassed the Blisk and shaft tunnel in which the power turbine’s shaft was accommodated.The two internal and external casings of the exhaust were connected by 10 struts with a semi-oval cross section,which were 12 mm and 3 mm in length and thickness, respectively. Six of these struts were located at the divergent section after the power turbine, and the others were near the end wall of the annular area.

Table 7 Specifications of gears.
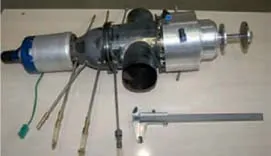
Fig.14 Final configuration of designed micro-turboprop engine.
4.4. Gearbox
Initially,a planetary configuration for the gearbox was chosen due to its compactness and capability in offering high ratios and high torque capacity.Since it was not possible to manufacture the internal helical gears, a simple ordinary double-shaft configuration with two sets of helical gears was selected; the technical specifications are given in Table 7. This simple gearbox used only four gears within two involved pairs of which the inlet and outlet shafts were collinear. The helix angle of all of these gears was 12°. As a design limit, the allowable speed for the inlet pinion pitch line was 100 m/s. The gears were made of steel DIN1.7131, and their surface hardness reached to about 55-56 HRC (Hardness Rockwell C) by heat treatment. No grinding was made on the teeth of gears. Also,ordinary off-the-shelf ball bearings were used for supporting the gear shafts. Fig. 14 shows the completed engine before the tests.
5. Experiments of shaft power unit
5.1. Test rig
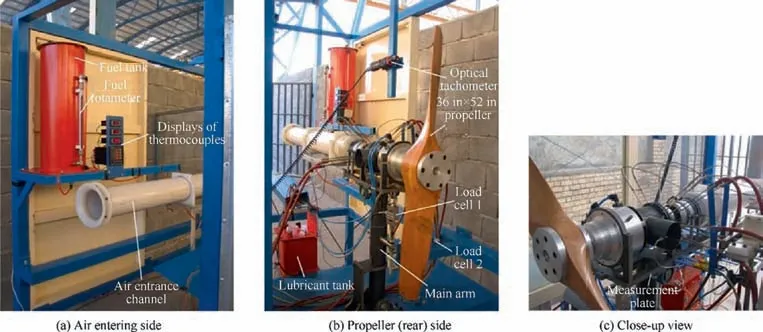
Fig. 15 Designed turboprop test rig and its components (1 in = 2.54 cm).
In the present experiment, a new test rig was developed to simultaneously measure the torque and thrust. The designed test rig (Fig. 15), which is different from that of other similar works,33,34was capable of measuring and logging the thrust force, the torque applied by the propeller, the flow rate of the air entering gas generator, the mass flow rate of fuel, and the rotational speeds of the gas generator and propeller. Also,it could simultaneously measure the static and total pressure and the total temperature of hot gas in Stations 5, 6 and 7(beginning of diffuser, before power turbine and after power turbine, respectively). In this test rig, the designed microturboprop engine was mounted on a measurement plate on the top of the main arm. The main arm itself was connected to the bed of the test rig by a joint connection allowing it to rotate freely by the torque imposed by the propeller.The measurement plate was also connected to the main arm by a joint connection and could rotate freely around its bearing axis which was, in fact, the torque axis resulting from the engine thrust. The generated thrust force was measured by a FG-6100SD Lutron force gauge (Load cell 1) with the maximum measurement of 980 N and an accuracy of 0.5%. The torque imposed by the propeller was also measured by one FG-5020 Lutron force gauge (Load cell 2) with the maximum measurement of 196 N and an accuracy of 0.5%through connecting to the middle of the main arm(Fig.16).In this figure,the ratio of R4/R3and the value of R2and R1were 0.833, 204 mm and 612 mm, respectively. Also, the rotational speed of the propeller was measured by one Kimo CT 110 optical tachometer.In this way, the engine power was simply the product of the Load cell 2 measurement, R2and the rotational speed of the propeller in rad/s. The air entered the gas generator through a channel with an internal diameter of 120 mm and a circular cross-section connected to the thrust measurement plate; its flow rate was measured and logged simultaneously by two Kimo Debimo125 blade flow meters with the accuracy of 4%.35All the Kimo instruments were connected to a Kimo MP210G thermo-anemo-manometer measuring module. The flow rate of the spent fuel, which was a mixture of 95% kerosene and 5%turbine oil,was measured by a calibrated rotameter with accuracy of 1% as it exited the fuel tank. Also it should be noted that a 36 in ×52 in propeller (Fig. 15 (b)) is a propeller that its diameter and its pitch are 36 in and 52 in, respectively.
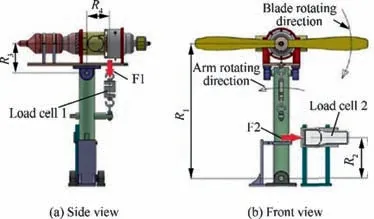
Fig. 16 Schematic of side view and front view of micro turboprop test rig and its main dimensional parameters.
The thrust measurement plate on which the inlet air channel and the whole of the micro-turboprop engine (including gas generator and shaft power unit) were mounted was fully capable of being balanced around its bearing axis. The total temperature in Stations 5, 6 and 7 was measured using eight similar K-type thermocouples that were 2 mm in diameter and 100 mm in length. All the thermocouples used in Stations 5 to 7 were mounted vertically and entered 5-6 mm perpendicular to the hot flow. In Station 8 (end of two exhaust outlet pipes), two K-type thermocouples that were 6 and 8 mm in diameter and length, respectively, were used to measure the temperature. The temperature measured by these 10 thermocouples was displayed simultaneously by digital monitors with 1°C accuracy.Also,the total and static pressures in Stations 5 to 7 were measured using calibrated probes. Three of these probes were special rod-type total pressure probes (Fig. 17)which had been calibrated up to Mach number 0.7. Fig. 18 shows the positions of all the temperature and pressure measuring points.All of the pressure probes were connected to calibrated U-type mercury manometers. The free turbine power could also be calculated by Eq.(7). In this way, the calculated power could be compared to the measured power when the difference of the total temperature across the power turbine was known.In all the conducted experiments,the micro-turboprop engine was mounted on the stand in pusher configuration status,and the propeller rotating direction was counter-clockwise while facing the inlet air channel. To control the performance of the micro-turboprop engine and prevent it from functioning in adverse or dangerous conditions, four controlling parameters were used: gas generator speed (maximum 161,000 r/min), power turbine speed (maximum 60,000 r/min), propeller speed (maximum 5,500 r/min) and total temperature after the gas generator turbine (maximum 820°C).
5.2. Test rig calibration and uncertainty analysis
In order to evaluate the accuracy of the designed test rig, two series of uncertainty analysis were planned whereas each series was repeated two times.In the first series,the test rig functioning in thrust measurement was simulated using a variable exciting force in the range of 50-300 N. This variable force was applied precisely along the longitudinal axis of the engine in the direction of its thrust force. Then simultaneously, the reaction and response of thrust force gauge (Load cell 1)were logged. In the second series of analysis, a similar method was used to simulate the engine torque measurement.In these simulations,a variable exciting force in the range of 10 N to 60 N was applied precisely along the engine lateral axis in the direction of the propeller torque and simultaneously the reaction of Load cell 2 was logged (Fig. 19).
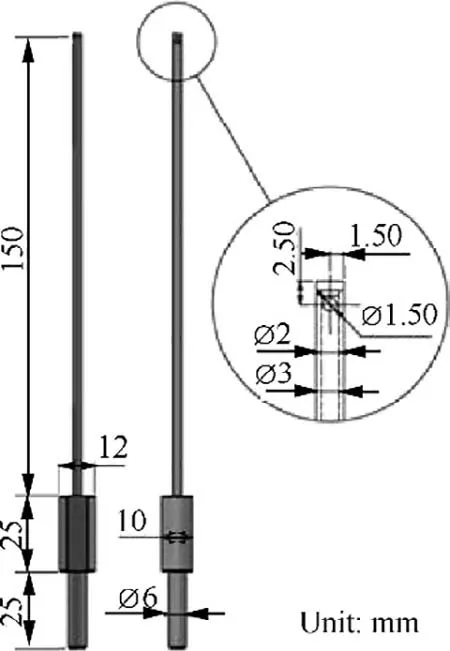
Fig. 17 Calibrated rod-type total pressure probe.
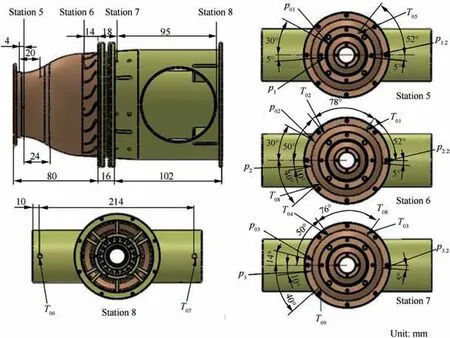
Fig. 18 Positions of temperature and pressure measuring points.
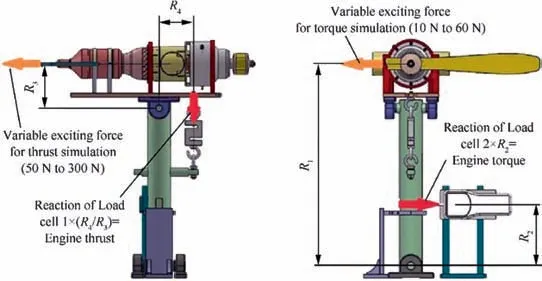
Fig. 19 Simulations of engine’s thrust and torque generation.
In both series of simulations, a Mecmesin AFG 500 digital force gauge36with the accuracy of 0.1%was used for applying the variable exciting force. Table 8 shows the results of these simulations. In this table, the last row shows the difference between the theoretical reactions of the thrust and torque load cells with their corresponding measured quantities. These differences included both the accuracy of load cells and the perturbing friction of the test rig. The average values of these differences were 1.7%and 1.1%for thrust and torque simulations,respectively.This meant that the engine’s real thrust and torque respectively were 1.7% and 1.1% higher than the measured values of the test rig.So the test rig correction factors for thrust and torque were 1.017 and 1.011. Also, based on the data sheet of Kimo CT110 optical tachometer, its accuracy in the range of 60-10,000 r/min is ±0.3%. Therefore, because of the relation between the engine power with its torque and itsangular shaft speed (P=Tqω), this directly meant that the uncertainty of the measured engine power (after applying the torque correction factor) was ±0.3%.

Table 8 Results of test rig uncertainty simulation for thrust and torque measurement.
On the other hand,the uncertainty of the calculated power(which was calculated based on Eq. (7)) was directly equal to the product of the uncertainties of the engine mass flow rate( ˙m), Cpof the hot gases and the total temperature difference across the power turbine (ΔT067). However, the value of Cpwas adopted precisely by comparing the results of the CEA software37and the work of Jones et al.38and Banes et al.39according to the average temperatures of the two sides of power turbine and the ratio of air to fuel. Also because of using six K-type thermocouples with the accuracy of 1°C across the power turbine,the uncertainty of ΔT067was negligible.So it could be said that almost all of the uncertainty of the calculated power was related to ˙m. But since the amount of engine’s fuel to air ratio was less than 2.5%,and the high accuracy of the fuel rotameter was better than 1%,the effect of fuel flow uncertainty on the amount of the engine’s mass flow rate was inappreciable. So the calculated power uncertainty was nearly equal to the Debimo flow meters accuracy. However,the data sheet of these flow meters shows that this is about±4%.
5.3. Results of experiments
In order to extract the maximum power, the designed shaft power unit was tested using a two-bladed wooden propeller with the diameter and pitch of 36 and 52 in (1 in=2.54 cm),respectively. To ensure the obtained results, two tests were conducted. In the first test, the engine running time was 9′46′′and the second was 8′57′′. These tests were conducted in a test cell with the height of 1761 m from sea level in an environment with a pressure of 82.45 kPa-82.6 kPa, temperature of 19-23°C,and relative humidity of 34%up to 37%.In these tests, after starting the Wren100 engine (as the gas generator),its rotational speed reached 80,000 r/min using a hand controller.Then,the main stage of the test was started by increasing the speed of the gas generator in the form of 10 or 15 103r/min steps and continued to 160,000 r/min. The engine operation time in each of these steps was 50 s to ensure the complete stability of its performance state and the accuracy of the data.The results of both tests are presented in Table 9.In this table,the values of the total temperatures in Stations 5-8 are equivalent to the mean results measured by the thermocouples of each station. Also the engine air mass flow rate ( ˙mair) and fuel mass flow rate ( ˙mfuel) are presented in two different columns.As seen, the maximum measured power was obtained at the propeller speed of 4906 r/min (equivalent to 160,910 r/min of gas generator) and was 16,213 W, which could be considered as a new record.In Table 9,thrust and torque columns include the correction factors resulting from the test rig uncertainty analysis. Table 1040,41makes a comparison between the micro-turboprop engine designed and manufactured in this study with some other micro-turboprop engines with less than 20 kW that are present in the market.In this table,Rows 1 and 3 show the performance parameters of two engines which used gas generators with similar capabilities like that of the Wren100. The SPT15-RX engine used a much more powerful gas generator compared to the Wren100 and still produced less power than the designed engine in this study.This comparisonobviously showed the poor performance of the commercially available engines in this power class. At the maximum rotational speed of the gas generator, the maximum calculated powers were 16,315 W and 16,346 W, respectively. These were based on Eq.(7)and the mass flow rate and total temperatures difference across the power turbine for Tests 1 and 2. These quantities were very close to the measured powers in the first and second tests.
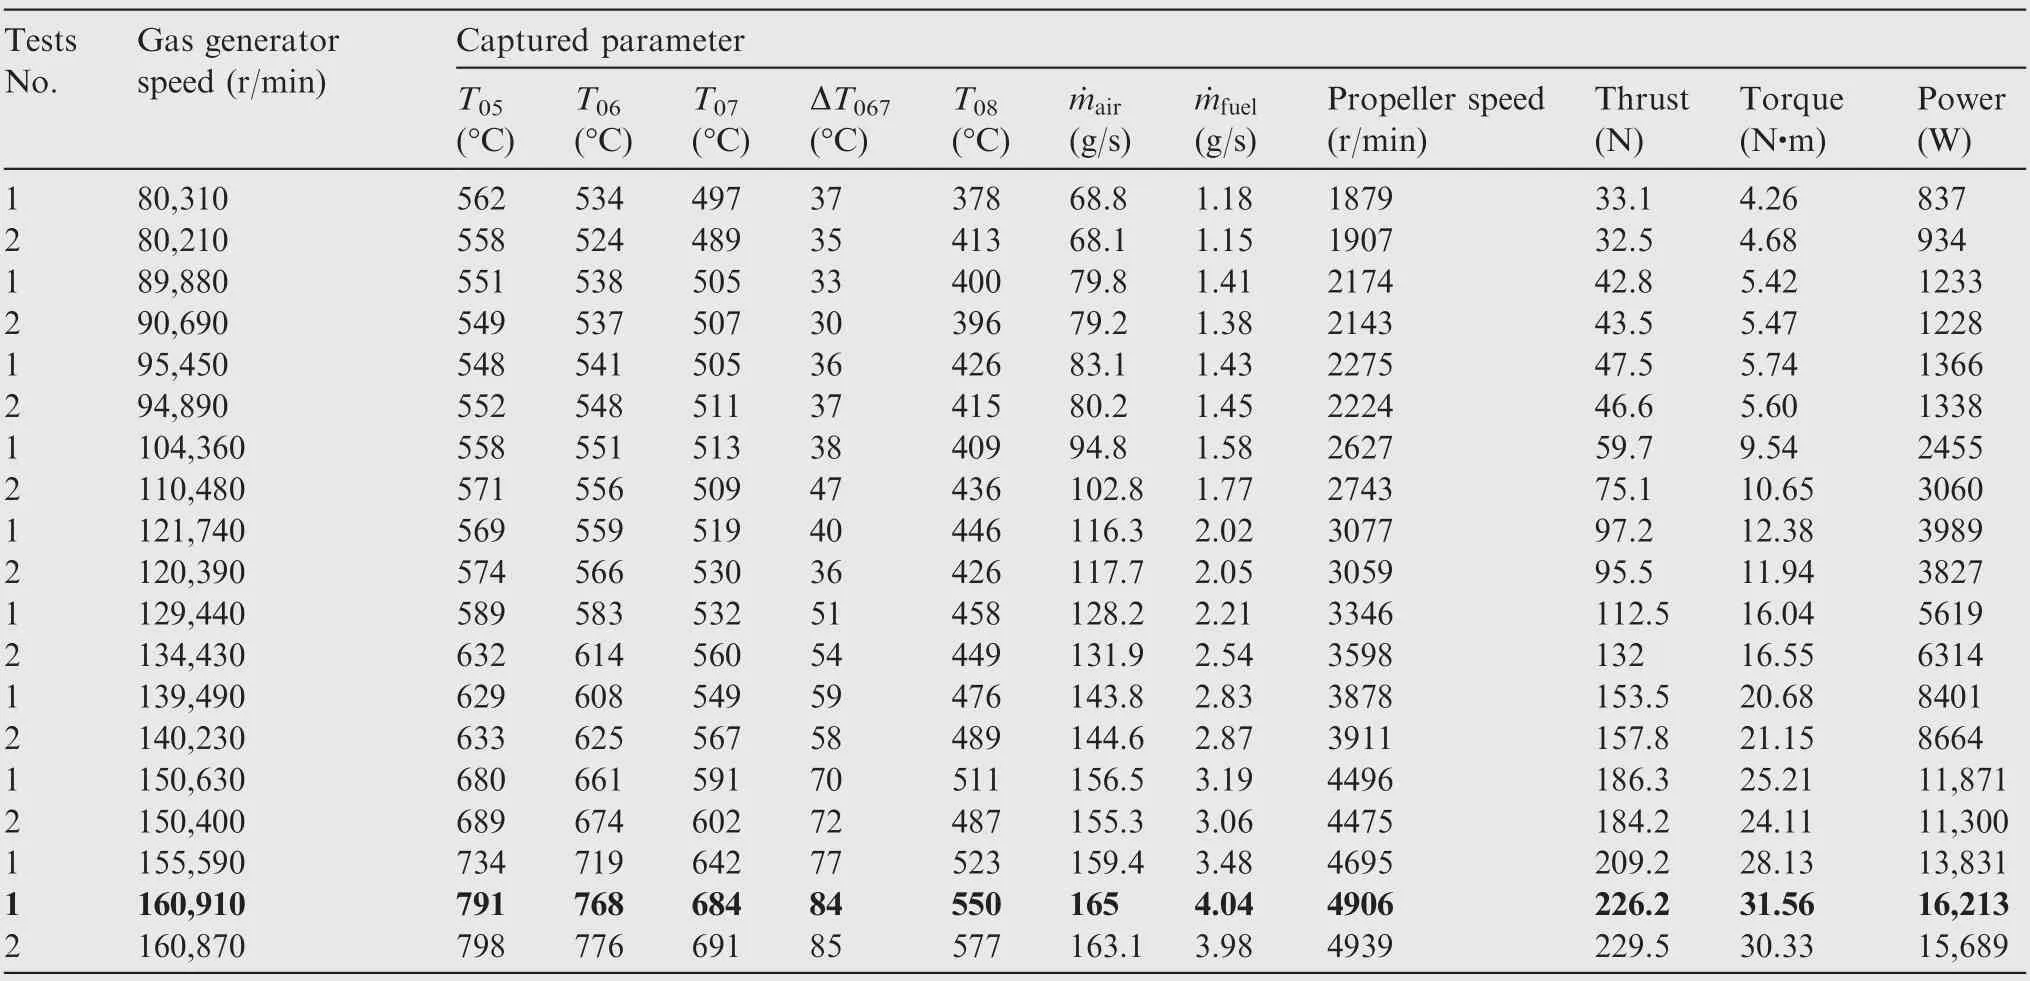
Table 9 Results of experiments with 36 in×52 in overloading propeller.
Fig. 20(a) and (b) respectively show the measured and calculated power curves and thrust and the SFC in terms of gas generator rotational speed. Also, Figs. 21 and 22 show the relation between the propeller speed and T06to the gas generator speed. As seen in Fig. 20(a), there is a significant dependence between the rotational speed of the gas generator and the engine power,so that a decrease in the gas generator speed from 160,000 to 150,000 r/min leads to an approximately 28%decrease in engine power.This occurs because of the total pressure available after the gas generator turbine and the value of air mass flow rate that increases steeply with the increase of the gas generator speed. Moreover, this figure shows that the difference between the measured and calculated power significantly increased by the reduction of the gas generator speed.This can be the proof that in such micro-turboprops, the prediction of off-design performance based on the thermodynamics parameters of hot gas flow should be done cautiously,especially when the main goal is the prediction of the power.
Furthermore, the results indicated an acceptable efficiency of the designed power turbine, especially in the range of the maximum power.Table 11 displays limited results for the total and static pressures at Stations 6 and 7;also,the total to static efficiency of the power turbine was calculated using Eq. (6).42As seen, the maximum attained efficiency was 81.5% at 160,870 r/min in the second test. At this speed, considering the propeller rotational speed and the ratio of the gearbox,the speed of the power turbine was 46,497 r/min, while its design rotational speed was 57,460. Hence, it appeared that in the case of using a master propeller that produced the maximum power at the turbine’s design speed,the efficiency would probably be higher than the above value.43
For supporting the results of experiments, a gas turbine cycle analysis was conducted for the designed engine using the kerosene as the fuel, and the results are presented in Table 12. There was not corresponding experimental result for some parameters like compressor efficiency, burner (combustion chamber) efficiency, total temperature at the exit of the burner, total pressure decrease across the burner and gas generator turbine’s efficiency. However, the predicted values of these parameters were obtained from an iterative calculation process and seemed to be reasonable.44-46In this table, ηbis defined as the ratio of actual heat of reaction of kerosene to its ideal heat of reaction. Also the environment conditions at the entrance to the compressor are p02=82.7 kPa and T02=293 K.The ratio of heat capacities(γ)for gas generator turbine and the power turbine are also 1.315 and 1.322,respectively. It is worth noting that in Table 12 the subscript 3 describes the station after compressor and the subscript 4 refers to the station after combustion chamber.
Comparison of Tables 11 and 12 shows a total pressure difference of about 4.7 kPa (less than 4%) between experiments and cyclic analysis at Station 6. Also a difference of about 1.5 kPa(less than 2%)can be seen between the static pressures at Station 7.These differences lead to about 1.3%difference in the predicted total to static efficiency and about 4% in the power of free turbine in cyclic analysis with those of the experiments.However,the more correct judgment seems to be when it is possible to increase the number of pressure probes and their accuracy at Stations 5 to 7.For this reason,the word‘‘limited”was deliberately chosen to explain the results of Table 11.

Table 10 Comparison of designed micro-turboprop in present study and some other less than 20 kW engines.40,41
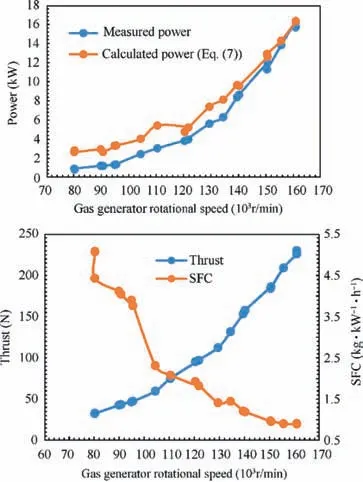
Fig. 20 Power vs gas generator rotational speed and thrust and SFC vs gas generator rotational speed.
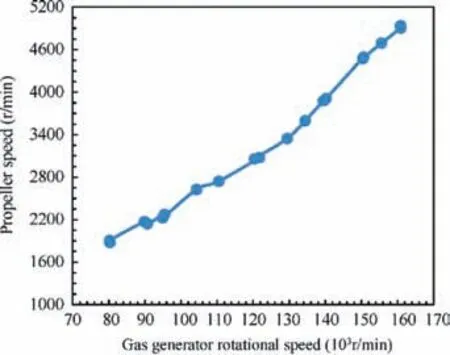
Fig. 21 Propeller speed vs gas generator speed.
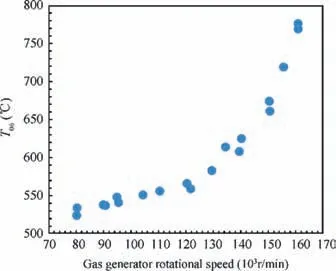
Fig. 22 Total temperature at Station 6 vs gas generator speed.

Table 11 Total to static efficiency of free turbine at maximum power.
6. Conclusions
This paper describes the design and manufacturing of a microturboprop engine via a converting approach in a class less than 20 kW with the objective of extracting maximum shaft power.The results show that by choosing the correct micro-turbojet engine as the gas generator of a micro-turboprop, it was possible to achieve a targeted level of shaft power along with an acceptable efficiency in a fast and low-cost design process.These were the main advantages of the converting approach over the design-based approach. Thus, the converting approach allowed for the design of a micro-turboprop engine with acceptable performance, even when there was no plan for mass production. The most important points and achievements of this research are presented below.
(1) Attaining a 16.2 kW shaft power not only confirmed the accuracy of the initial design in estimating the power of the engine,but it could also be considered as a new power level for a micro-turboprop engine with a gas generator such as the Wren100. Therefore, the shaft power and SFC of the designed engine respectively were 25%higher and 54%lower than the most powerful contender engines.Moreover,reaching the maximum thrust of 229 N,despite using an overloading propeller, showed that the thrust produced by the converted engine was 2.4 times more than the thrust of the Wren100 engine. This clearly showed a jump in increasing the thrust.Also,in the case of using a master propeller,which allowed for the maximum power at the design speed of the power turbine, it was possible to attain higher levels of thrust.In this case,the rotational speed of the propeller would be about 6,000 r/min.These issues showed that the commercial micro-turboprops available in the market were weaker than expected.
(2) Despite the simple structure of the designed power unit,it demonstrated proper performance. In addition, the low cost and feasible time span for the manufacture of the Blisk (as the most complicated part) indicated that the initial predictions concerning the cost and efficiency of the converting approach were correct.
(3) The steep gradient of the engine power curve showed that the increase in engine power was in accordance with the accessible total pressure value at Station 5 (gas generator exit). This meant that if various operating conditions needed a high power level,it would be necessary to choose a gas generator where a wider range of its shaft rotational speed could provide an acceptable (or high)total pressure after its turbine. In the presented case study, this criteria was achieved in the vicinity of the maximum rotational speed of Wren100 engine.
(4) The results showed that in spite of the small dimensions of the power turbine and the relatively high quantities of tip leakage, viscosity and thermal losses in such dimensions, it was possible to achieve an efficiency of at least 80.4% using the algorithm proposed by Wilson for designing turbine blades. This indicated that using this technique was appropriate for cases such as simple and inexpensive micro-turboprop engines, where the costbenefit issue was a factor and yielded appropriate results.
Since flight tests were not taken into account for the scope of this research, the total weight of the engine was 5.74 kg, which included the weight of the gas generator. This weight could be reduced to 3.7 kg by changing the structure and size of the gearbox as well as decreasing the thickness of the casings of the shaft power unit elements. As a result, the weight index of 4.38 kW/kg is achievable, which is considered as an appropriate index for engines at such a technical level.
Acknowledgements
The authors would like to thank Mr. Mike Murphy (Technical Director of Wren Power Systems Ltd.) for his guidance and technical recommendations during this research.Also, the authors wish to thank Mr. Rasul Arabnezhad for his help in manufacturing the parts of the designed power unit.

Table 12 Results of cycle analysis for designed engine.
 CHINESE JOURNAL OF AERONAUTICS2020年2期
- CHINESE JOURNAL OF AERONAUTICS的其它文章
- Delaying stall of morphing wing by periodic trailing-edge deflection
- Optimization and verification of free flight separation similarity law in high-speed wind tunnel
- Non-intrusive reduced-order model for predicting transonic flow with varying geometries
- Consideration on aircraft tire spray when running on wet runways
- Aeroelastic simulation of the first 1.5-stage aeroengine fan at rotating stall
- Experimental study on NOx emission correlation of fuel staged combustion in a LPP combustor at high pressure based on NO-chemiluminescence
