Improving EGT sensing data anomaly detection of aircraft auxiliary power unit
Linsheng LIU, Yu PENG, Lulu WANG, Yu DONG, Dtong LIU,*,Qing GUO
a School of Electronics and Information Engineering, Harbin Institute of Technology, Harbin 150080, China
b China Southern Airlines Company Limited Shenyang Maintenance Base, Shenyang 110169, China
c China Southern Airlines Engineering Technology Research Center, Shenyang 110169, China
KEYWORDS Anomaly detection;Auxiliary power unit;Condition-based maintenance;Data-driven framework;Exhaust gas temperature
Abstract The reliability of the on-wing aircraft Auxiliary Power Unit(APU)decides the cost and the comfort of flight to a large degree. The most important function of APU is to help start main engines by providing compressed air. Especially on the condition of sudden shutdown in the air,APU can offer additional thrust for landing. Therefore, its condition monitoring has drawn much attention from the academic and industrial field.Among the on-wing sensing data which can reflect its condition,Exhaust Gas Temperature(EGT)is one of the most important parameters.To ensure the reliability of EGT,one kind of data-driven anomaly detection framework for EGT sensing data is proposed based on the Gaussian Process Regression and Kernel Principal Component Analysis.The situations of one-dimensional and two-dimensional input data for EGT anomaly detection are considered, respectively. The cross-validation experiments are carried out by utilizing the real condition data of APU, which are provided by China Southern Airlines Company Limited Shenyang Maintenance Base. The anomalous stuck condition of EGT sensing data is also detected. Experimental results show that the proposed EGT sensing data anomaly detection method can achieve better performance of false positive ratio, false negative ratio and accuracy.
1. Introduction
The aircraft Auxiliary Power Unit(APU) belongs to one kind of gas turbine engine. For the application in the aircraft, its main function is to supply the compressed air for starting main engines. On the other hand, it can offer the air conditioning and the electrical power during the power off of the main engines. For the application in the more electric and allelectric aircraft, APU can provide some additional thrust by generating electricity.1,2Therefore, APU has become one of the most important subsystems to enhance the reliability and operation of the aircraft. The airlines company carries out the APU inspection after each flight.
During the routine maintenance,three strategies are usually adopted,including corrective maintenance, preventive maintenance and Condition-Based Maintenance (CBM).3In the mode of corrective maintenance, the repair action is implemented when an operational failure occurs. However, it may bring unnecessary repair event and cannot prevent potential failures. In the mode of preventive maintenance, the periodic inspection is implemented, and the reliability of APU can be met to a large degree. But, the duration of the interval period is difficult to be determined.In the mode of CBM,the maintenance and repair activities can be implemented more reasonably which relies on the working condition of APU.4The CBM is mainly carried out by the technology of condition monitoring to determine whether the object is healthy.
At present, the condition data of the monitored object are relatively easy to be collected and many methods have been proposed to process the condition data to achieve system health monitoring of many objects.To realize the system diagnosis, Song et al.5propose a step-by-step fuzzy diagnostic method based on frequency domain symptom extraction and trivalent logic fuzzy diagnosis theory.Statistic filter and wavelet package transform are combined with a moving-peak-hold method to extract signal features for fault diagnosis in the lowspeed machinery.6To realize the system prognostics, the Lebesgue-sampling-based prognostics is improved to achieve the online model parameter adaptation scheme to enhance performance.7The charge status and on-line health assessment of lithium-ion battery have been studied considering different working conditions.8,9The iteratively updated relevance vector machine fused with the Kalman Filter algorithm is proposed to improve the prognostics performance.10One kind of Bayesian least-squares support vector machine method is proposed to realize the improvement of prognostics.11Guo et al.12implement the anomalous detection of unmanned aerial vehicle sensor data using the local regulated optimization method.Zhang et al.13propose the data-driven model for estimating the system condition monitoring data. The multiple dependent features based on Bayesian dynamic linear model and Copulas are utilized to mine the potential information to realize the degradation assessment.14Meanwhile,the reliability and accuracy of sensing data have attracted the attention of researchers.The anomaly detection on sensor data has been studied in Refs.15-17and how to reduce this influence is also researched in Refs.18-20.In fact,the anomaly detection refers to recognize patterns in data which do not meet the expected behavior.21
In recent decades,some existing studies have paid attention to predict the fault and failure in APU. And, some traditional methods have been utilized to enhance its failure prediction,e.g., support vector machine.22In addition, some available methods include classification, clustering, regression-based,and particle filter are performed for Remaining Useful Life(RUL)prediction of APU.23,24The data mining,Failure Mode and Effect Analysis (FMEA) are adopted to realize the fault isolation of APU.25For predicting the failure parameters of APU, the linear regression and neural networks can be adopted.26To assess the health state of APU,the classification tree has been used to formulate different levels of its health condition.27In addition, APU performance deterioration is formulated by the Generalized Renewal Process (GRP) and its failure is predicted by Weibull-based GRP.28
The studies mentioned above indeed help enhance the reliability of APU and can help realize the CBM at some degree.However, one key problem is that these studies are based on the normal condition data of APU. Although Wang et al.29implement the Exhaust Gas Temperature(EGT)data anomaly detection, the proposed method has the deficiency of sparse reference data(i.e., required by the feature of relevance vector machine). If the utilized sensing data become anomalous, not only the desired results cannot be achieved, but also bring the wrong decisions. The condition data of on-wing APU are collected by the Aircraft Communication Addressing and Reporting System (ACARS). The wireless technology is utilized to build the transmitting data link between the aircraft and the data center of the airlines.30In ACARS report, the condition of APU is contained in the operation report,including APU-self starting, starting main engines, and APU idle.These condition data can reflect the anomalous, degradation,fault and failure trending information in APU, which have not been utilized adequately. But, if these sensing data are anomalous,they cannot reflect the condition of APU correctly.
Therefore, the anomaly detection on these data is considered in this study. In operation report, N1 segment records APU condition during the first main engine starting and N2 segment indicates its condition during the second main engine starting. Based on these sensing data, one kind of data-driven framework for EGT data anomaly detection is formulated,which is based on Gaussian Process Regression (GPR) and Kernel Principal Component Analysis(KPCA).The historical condition monitoring data of APU are used to calculate the model parameters. Then, the determined model can be used to decide whether the new EGT data are anomalous. The related experiments are carried out by using the real APU on-wing sensing data from China Southern Airlines Company Limited Shenyang Maintenance Base(SYMOB).Experimental results are discussed in detail to verify the effectiveness of the proposed data-driven framework.
The rest of this article is illustrated as follows. Section 2 presents the proposed method and the utilized theories,including GPR, KPCA and the metrics of data anomaly detection.Section 3 introduces the utilized data for experiments.Section 4 gives the evaluation experiment in detail and discusses experimental results. Section 5 draws a conclusion and provides the future work.
2. Methodology
2.1. Data-driven framework for detecting EGT sensing data
To achieve the anomaly detection on EGT sensing data, one kind of data-driven framework is proposed,as shown in Fig.1.
The condition monitoring data of on-wing APU are collected during itself starting, helping the main engines starting,working in the environment control, and idle status. During these working conditions, its sensing data are recorded.Among the recorded on-wing sensing data, there are aircraft ID, Date, the condition of APU subsystem (e.g., air temperature, speed, inlet guide vane angle). After receiving these sensing data,the anomaly detection on EGT data is carried out in terms of single input and multiple input.

Fig. 1 Data-driven framework of anomaly detection on EGT sensing data.
As illustrated in Section 1,the target sensing data for implementing anomaly detection is EGT, which can reflect the condition of APU to the largest degree.Two kinds of typical datadriven anomaly detection are utilized in the framework.Inspired by the similarity of EGT sensing data in N1 and N2, these two-dimensional data detect each other. For the practical application, if one-dimensional EGT sensing data become anomalous, the detection results are influenced directly. On the other hand, inspired by the idea in Ref.31,the other kind of on-wing sensing data will be also utilized to detect the EGT sensing data.
To achieve better anomaly detection results, two kinds of typical anomaly detection algorithms are fused in the framework. The first is to utilize GPR algorithm which has the potential capability of mining the features contained in the training data. The second is to utilize KCPA algorithm which can take advantage of multiple-dimensional training data.The detailed mathematical theories will be illustrated in the following Sections 2.2 and 2.3. In addition,three metrics are used to measure the performance of anomaly detection,including false positive ratio, false negative ratio and accuracy. Their definitions will be given in the following Section 2.4.
2.2. Gaussian process regression


where k(xi,xj)refers to the covariance function and m(x)represents the mean function.
In the practical application, f(x) is usually affected by noise. The equation for indicating this situation is given by

where ε ∈N(0,σ2n)represents the white noise.If f(x)is utilized,the corresponding observation y could follow GP, as given by

where δijis Dirac function.


where C(X,X) is the covariance matrix and it is also denoted by C(X,X)=K(X,X)+δijI. I ∈RN×Nindicates to the unit matrix. K(X*,X*) is the covariance.

The f*posterior conditional distribution is given by In this study, GPR utilizes the input data for determining the confidence range to implement anomaly detection. If the test data processed by GPR are not in the scope of this confidence range, these test data are detected anomalously. If the test data processed by GPR are in the scope of this confidence level,they are detected as normally.Therefore,the key point in this method is that the input data should be reliable.This rule is also required for other anomaly detection methods.
2.3. Kernel principal component analysis
KPCA belongs to one kind of unsupervised learning methodology.34,35During the process of this algorithm, the data are firstly mapped into the high-dimensional space by the nonlinear tool. Then, the linear Principal Component Analysis(PCA) is utilized for extracting the related features in this high-dimensional space. For example, Xn=[x1, x2, ... ,xn]∈Rm×nare supposed to be training data,which are mapped by φ:x ∈Rm×1→φ(x)∈F.Finally,the vector f is determined by the linear PCA to finish the following transformation

In this way,the maximal variance can be determined.In the practical application, φ(xi) is supposed to be mean centered and variance scaled. In this condition, the optimization problem can be transformed into

s.t. fTf=1
In Eq. (11), f stands for the loading vector and t=[t1, t2,..., tn]Trepresents the score vector. The coefficients αj,1 ≤j ≤n can be utilized to depict the loading vector by

By using Eqs. (11) and (12), the optimization problem can be expressed by

where α=[α1, α2, ..., αn]∈Rn×1. Some of the utilized kernel functions are sigmoid kernel, polynomial kernel, and radial basis kernel.
2.4. Anomaly detection metrics
Three metrics are utilized to measure the performance of anomaly detection, including False Positive Ratio (FPR),False Negative Ratio (FNR) and Accuracy (ACC). To weight the performance of normal data detected, FPR metric can be used, which indicates the percentage of normal data detected falsely and its definition is given by

where FN is the total number of normal data detected falsely and TP+FN refers to the amount of all normal data.
To weight the performance of anomalous data detected,FNR metric can be utilized, which indicates the percentage of anomalous data detected falsely and its definition is given by

where FP refers to the total number of anomalous data detected falsely and FP+TN denotes the number of all anomalous data.
The two metrics mentioned above can measure the performance in terms of normal data detection and anomalous data detection. Those two metrics are expected to be small values,which mean that two kinds of data are detected rightly. To weight the performance of all detected data (i.e., the normal data and the anomalous data), ACC metric can be employed and its definition is given by

where TP+TN denotes the number of the normal data and the anomalous data both detected rightly and FP+FN+TN+TP represents the amount of all data detected.
3. Data description
The on-wing sensing data of the utilized aircraft APU are provided by SYMOB. These data are recorded by the operation report, which is a critical segment of ACARS report. In general, there are 11 segments in operation report, which are CC,C1,CE,E1,N1,S1,N2,S2,N3,S3 and V1.Each segment is consisted of several parameters and indicates the condition of APU during different working processes. The detailed explanations of these segments are illustrated in Table 1.
Some parameters in Table 1 are explained as follows.When APU helps start the main engine #1, its condition is recorded by N1 and S1.When it helps start the main engine#2,its condition is recorded by N2 and S2. Among these four segments,there are the serial number of the main engine, EGT, speed,control word, etc. As illustrated in Table 1, when APU is in the idle mode, its condition can be represented by N3 and S3. V1 indicates APU condition during its previous starting,e.g., peak EGT and the corresponding speed.
As introduced in Section 1,although some works have paid attention to realize fault and failure prediction of APU, theseworks are based on the normal sensing data of APU.The four segments in operation report (N1, S1, N2, and S2) have not been utilized well enough to realize condition monitoring of APU. And they are carried out the proposed anomaly detection to enhance the reliability of EGT.For the following evaluation experiments, the real data of APU are utilized, which are provided by SYMOB. It is expected to help enhance the fault and failure prediction of APU to some degree.

Table 1 Parameters of operation report.
In the following experiments, the duration of acquiring those data are from October 1, 2014 and September 30,2015.Among these data,there are two main engines assembled in the aircraft.Therefore,the EGT sensing data consist of two parts for starting these two engines.The collected EGT sensing data for starting engine #1 and engine #2 are illustrated in Fig. 2.
In the above two figures, the variation trend of EGT sensing data is similar due to the similar APU working condition.In general, two main engines are started one after the other and APU works in 100% condition to provide compressed air and electricity.But,the numerical values of two EGT sensing data are not exactly same, especially from the cycle 400 to 450. One cycle denotes that operation report is recorded once from APU starting to APU shutdown.
4. Experimental results and discussion
In this section,the evaluation experiments with normal sensing data and anomalous sensing data are carried out respectively.
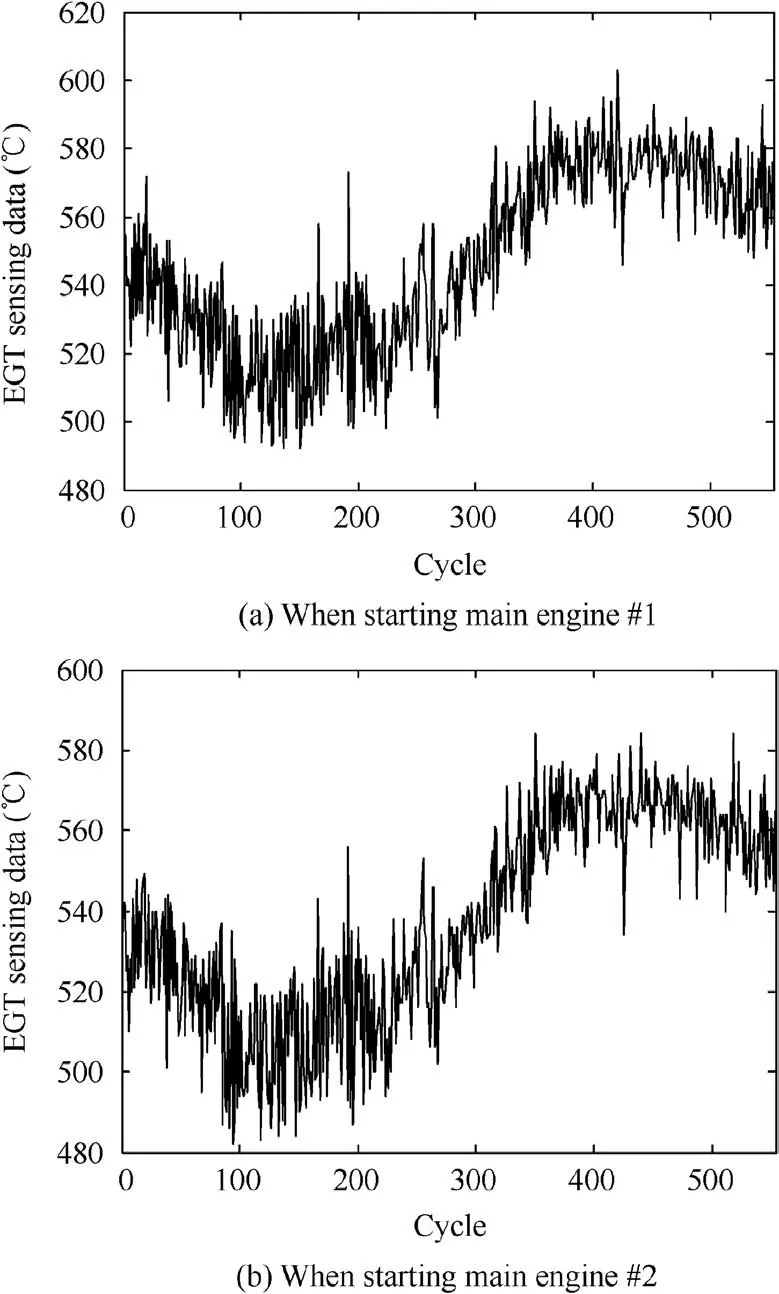
Fig. 2 EGT sensing data when starting main engine #1 and #2.
Then, experimental results are presented and discussed in detail.
4.1. Experiments using GPR
As illustrated in Section 3, the EGT data of two main engines are utilized to detect each other.In this sub-section,two experiments are implemented with the normal EGT data.The first is to utilize EGT sensing data of the main engine #1 to detect EGT sensing data of the main engine#2.The second is to utilize EGT sensing data of engine#2 to detect EGT sensing data of the main engine #1. The number of test data is 254, and these two experimental results are shown in Fig. 3.
In Fig. 3, the star line indicates the test EGT data. If the data points are out of the confidence level interval, they are detected as the anomalous data. Since these data are all normal, those data points which are out of the confidence level interval are false negative. In Fig. 3(a), the number of false negative data is 21.The corresponding FPR is given as follow.

In Fig.3(b),the number of false negative data is 6.The corresponding FPR is given as follow.

In the following experiments with GPR, the EGT data are injected with the stuck anomaly, which means that the output of the sensing data keeps the constant value. In this experiment, the last 50 EGT data are set to be the same value. Two experimental results with EGT data when APU helps start engine #1 and engine #2 are shown in Fig. 4.
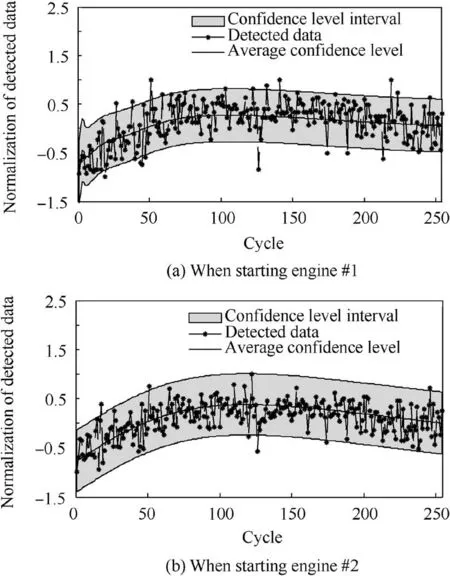
Fig. 3 EGT data detection results with GPR when starting engine #1 and #2.
In Fig. 4,the 50 anomalous data are from 204 cycle to 253 cycle. By observing these two figures, it can be seen that all anomalous data are out of the confidence level interval,which means that all the stuck anomalous data are detected correctly.In Fig. 4(a), there are 13 normal sensing data detected as anomalous data. Therefore, FPR and ACC are calculated as follows.

In Fig. 4(b), there are 5 normal sensing data detected as anomalous data. Therefore, FPR and ACC are calculated as follows.
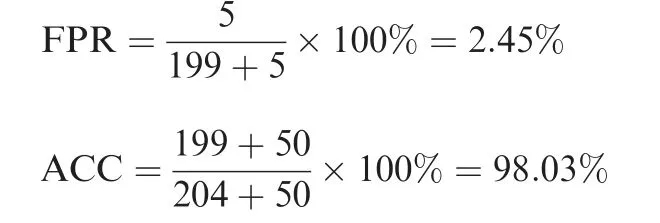
In the above four experiments, the anomaly detection results using GPR have relatively excellent performance. The worst FPR value is only 8.27%, and the best FPR value is 2.36%. The two ACC values are both larger than 90%. In the domain of data anomaly detection,if FPR value is smaller than 10% and ACC value is larger than 90%, they mean that this approach has a great performance. Therefore, it can be seen that this method is meaningful for the EGT data anomaly detection.
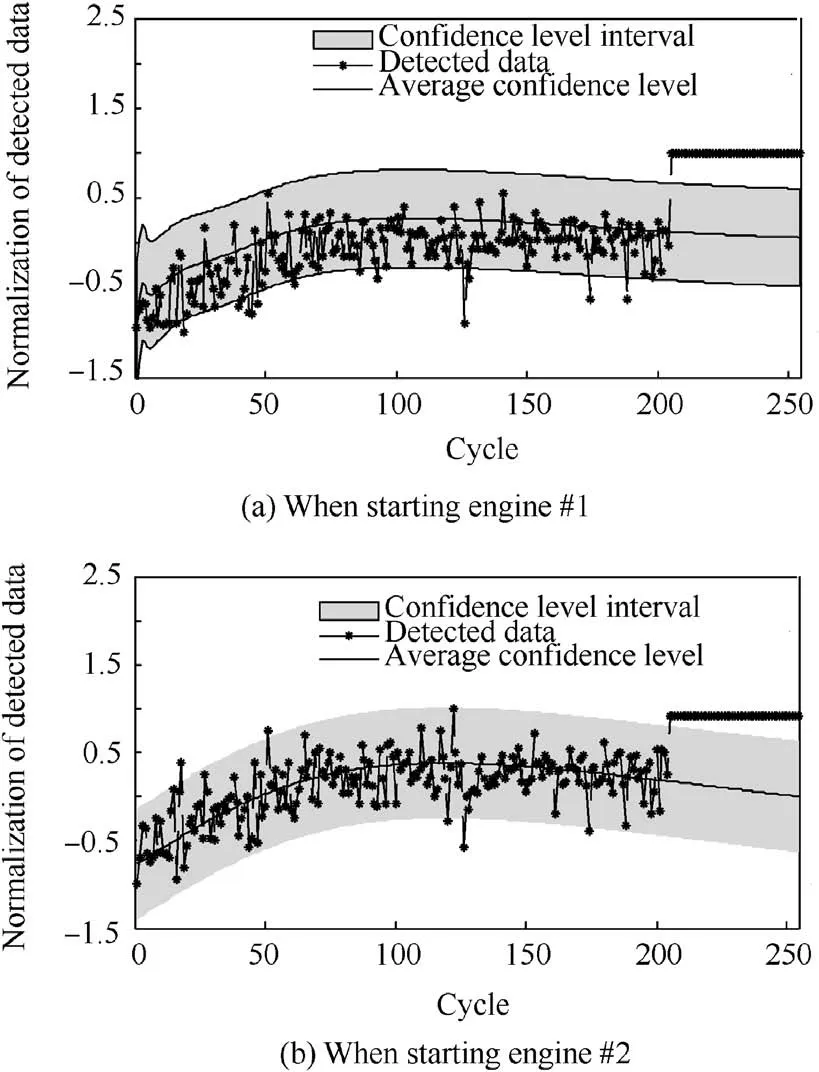
Fig. 4 Anomalous EGT data detection results with GPR when starting engine #1 and #2.
4.2. Experiments using KPCA
In this sub-section, the experiments using KPCA are implemented with the normal EGT data. For the input data, the bleed air pressure is selected, which has the maximal relevant with EGT,as depicted in Ref.28.The first experiment is to utilize EGT data of the main engine #1 and bleed air pressure data to detect EGT data of the main engine #2. The second is to utilize EGT data of the main engine#2 and bleed air pressure data to detect EGT data of the main engine #1. Two experimental results are given in Fig. 5.
In the above two figures, the star line is the test EGT data.If the Squared Prediction Error(SPE)value of test data is larger than that of training data, it is detected as the anomalous data. For the normal data detection, FPR is utilized as the metric to measure the anomaly detection result. According to this metric, the number of false negative data is 3 in Fig. 5(a) and the FPR is given as follow.

In Fig.5(b),the number of false negative data is 1.The corresponding FPR is given as follow.

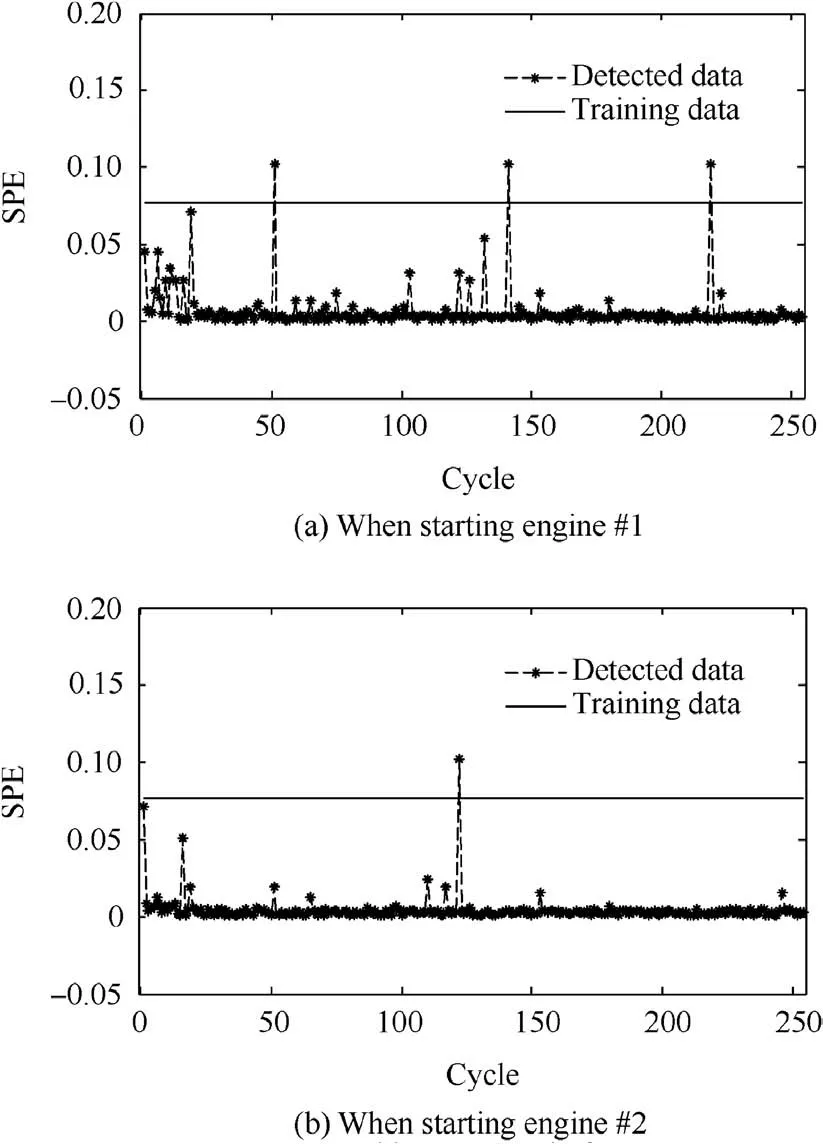
Fig. 5 EGT data detection results with KPCA when starting engine #1 and #2.
In the following two experiments with KPCA, the EGT data are also injected with the stuck anomaly, which is set to the same condition with the GPR experiments. The last 50 EGT data are set to be the same value, which means that the EGT data have the stuck anomaly. Two experimental results with anomalous EGT data are given in Fig. 6.
In the above two figures, there are 50 anomalous from 204 cycle to 253 cycle. It can be seen that all SPE values of the anomalous data are larger than those of the training data,which mean that all the stuck anomalous data are detected correctly.In Fig.6(a),there are 9 normal sensing data detected as anomalous data. Therefore, FPR and ACC are calculated as follows.
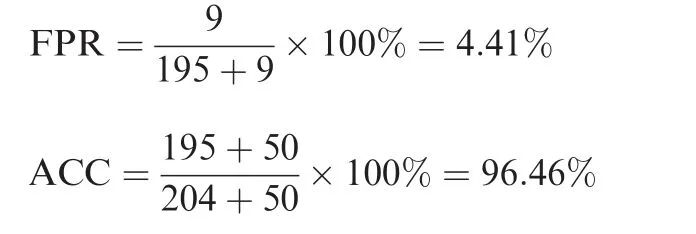
For the second experiment, there are 3 normal data detected as anomalous data in Fig. 6(b). Therefore, FPR and ACC are calculated as follows.
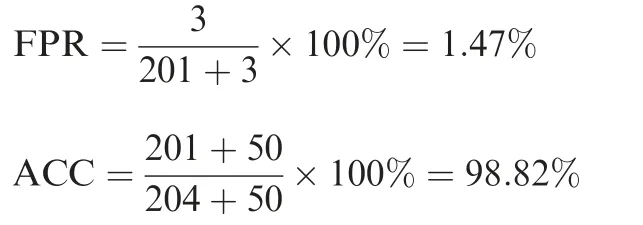
In the four experiments using KPCA, the anomaly detection results of EGT data are much better. The worst FPR value is only 4.41%, and the best FPR value is 0.39%. Two ACC values are both larger than 95%. These experimental results mean that two-dimensional input data with KPCA can achieve relatively good anomaly detection on EGT sensing data.
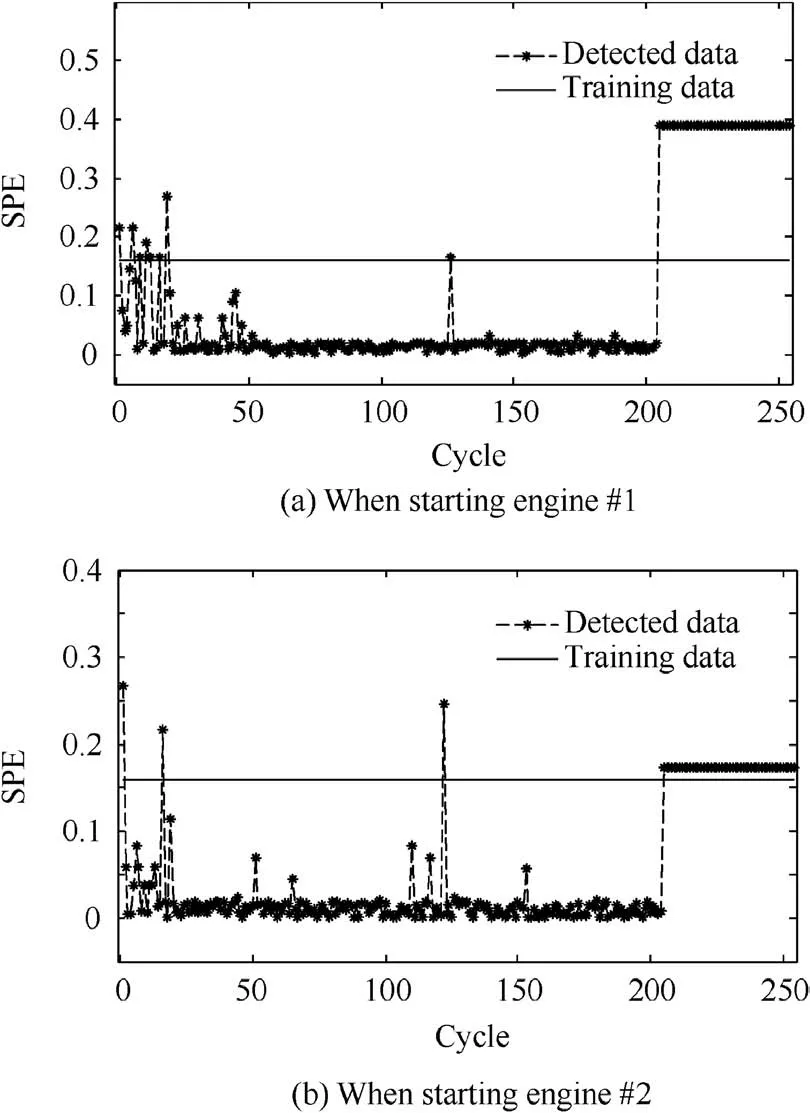
Fig.6 Anomalous EGT data detection results with KPCA when starting engine #1 and #2.
To summarize the above experiments, the results using GPR and KPCA are both relatively excellent. Especially,KPCA using two input data can get much better anomaly detection results. The reason is that two-dimensional data may contain much useful information for feature extraction,and KPCA utilizes this feature to achieve better results. This is a valuable insight for the practical application of EGT sensing data anomaly detection.
5. Conclusions and future work
The data anomaly detection framework for EGT sensing data of aircraft APU is proposed in this study. The objective is to enhance the condition monitoring of APU to some degree.This framework includes two general algorithms which can utilize single-dimensional data and two-dimensional data as input.By utilizing the real on-wing sensing data of APU from SYMOB, the effectiveness of the proposed data-driven framework can achieve relatively good performance of EGT sensing data anomaly detection.
In the future, three kinds of study will be carried out. The first is to evaluate the proposed method by using more real sensing data of APU. The second is to utilize more datadriven algorithms to evaluate the proposed framework.Finally, we will try to utilize optimization methods to determine the specific dimensionality for realizing the optimal anomaly detection results.
Acknowledgements
This work was partially supported by the National Natural Science Foundation of China(No.61803121)and China Postdoctoral Science Foundation (No. 2019M651277).
 CHINESE JOURNAL OF AERONAUTICS2020年2期
- CHINESE JOURNAL OF AERONAUTICS的其它文章
- Delaying stall of morphing wing by periodic trailing-edge deflection
- Optimization and verification of free flight separation similarity law in high-speed wind tunnel
- Non-intrusive reduced-order model for predicting transonic flow with varying geometries
- Consideration on aircraft tire spray when running on wet runways
- Aeroelastic simulation of the first 1.5-stage aeroengine fan at rotating stall
- Experimental study on NOx emission correlation of fuel staged combustion in a LPP combustor at high pressure based on NO-chemiluminescence
