
Thermal influence of ponding and buried warm-oil pipelines on permafrost:a case study of the China-Russia Crude Oil Pipeline
2020-05-31 10:49YanHuMuMingTangChaiGuoYuLiWeiMaFeiWangYaPengCao
YanHu Mu,MingTang Chai*,GuoYu Li*,Wei Ma,Fei Wang,2,YaPeng Cao,2
1. State Key Laboratory of Frozen Soil Engineering, Northwest Institute of Eco-Environment and Resources, Chinese Academy of Sciences,Lanzhou,Gansu 730000,China
2.University of Chinese Academy of Sciences,Beijing 100049,China
ABSTRACT Buried pipelines are widely used for transporting oil in remote cold regions. However, the warm oil can induce considerable thermal influence on the surrounding frozen soils and result in severe maintenance problems. This paper presents a case study of the thermal influence of ponding and buried warm-oil pipelines on permafrost along the China-Russia Crude Oil Pipeline (CRCOP) in Northeast China. Since its operation in 2011, the operation of the warm-oil pipelines has led to rapid warming and thawing of the surrounding permafrost and development of sizable ponding along the pipeline route,which,in return,exacerbates the permafrost degradation.A field study was conducted along a 400-km long segment of the CRCOP in permafrost regions of Northeast China to collect the location and size information of ponding.A two-dimensional heat transfer model coupled with phase change was established to analyze the thermal influence of ponding and the operation of warm-oil pipelines on the surrounding permafrost. In-situ measured ground temperatures from a monitoring site were obtained to validate the numerical model.The simulation results show that ponding accelerates the development of the thaw bulb around the pipeline.The maximum thaw depth below the pipeline increases from 4 m for the case without ponding to 9 m for the case with ponding after 50 years of operation, and ponding directly above the pipe induces the maximum thaw depth. Engineering measures should be adopted to control the size or even eliminate surface water-rich ponding for the long-term performance of buried warm-oil pipelines.
Keywords:ponding;heat transfer modeling;oil pipeline;permafrost;thaw depth
1 Introduction
Buried pipelines have been widely used to transport oil economically in remote cold regions. However, the thermal interaction between the pipeline and surrounding permafrost poses significant challenges to the design,construction,and maintenance of a pipeline system. Dependent on the operating temperature range, the pipeline in cold regions may experience substantial amounts of frost heave and thaw settlement (Seligman, 2000; Nixon and Oswell, 2010; He and Jin, 2010; Oswell, 2011; Liet al., 2019). For a buried warm-oil pipeline,heat losses can thaw the sur-rounding frozen soils and develop a thaw bulb around the pipeline (Burgess and Harry, 1990; Smithet al.,2003; Wanget al., 2018; Dumais and Konrad, 2019).The consequent uneven settlement along the pipeline will induce bending and may even damage it during operation(Abdallaet al.,2016).
The China-Russia Crude Oil Pipeline (CRCOP)was constructed from 2009 to 2010 to transport Siberian crude oil from Skovorodino, Russia, via Mohe to Daqing, China, using a conventional burial method(Figure 1). The northern part of the CRCOP within China traverses 441 km in permafrost regions, of which 119 km is ice-rich, warm (> -1.0 °C) permafrost (Jinet al., 2010). The operation of the CRCOP officially started on January 1, 2011. Since then, the oil temperature at the inlet of Mohe remained above 0 °C year-round,with an annual mean as high as 7 °C(Wanget al., 2018a). The significant heat losses from the pipeline have led to rapid warming and thawing of the surrounding warm permafrost (Wanget al., 2015;Wanget al.,2018a;Wanget al.,2018b).Considerable pipeline settlement and ground surface subsidence have been observed along the CRCOP within warm,ice-rich permafrost zones (Liet al., 2016; Fanet al.,2017; Wanget al., 2018b). Following the ground surface subsidence, surface water accumulation and ponding widely developed in the vicinity of the pipeline route. From 2016 to 2017, a second line was constructed in parallel to the first one at a distance of only 10 m in most sections. Since then, more and more ponding developed either outside the two lines or between them and has become the most significant problem needed to be addressed. In permafrost regions,surface water can significantly affect the ground thermal regime, due to its large heat capacity and latent heat of freezing, and is known to play a vital role in geotechnical issues in permafrost regions (De Grandpréet al., 2012; Périeret al., 2015; Huet al., 2018).Infiltration of surface water can also significantly decrease foundation bearing capacity, leading to instability of structures (Yoshikawa and Hinzman, 2003;Youet al., 2017; Muet al., 2018; Wenet al., 2018;Selrooset al., 2019). However, the thermal influence of both ponding and buried warm-oil pipelines on the surrounding frozen soils has not been adequately addressed.
This paper investigates the thermal influence of the joint action of ponding and operation of warm-oil burial pipelines on the surrounding frozen soils through a case study of the CRCOP in Northeast China. A systematic field investigation was carried out for the CRCOP segment within permafrost regions to collect data for analyzing the condition, size, location,and source of ponding. Ponding was categorized into four types according to its relative position to the two lines. A two-dimensional heat transfer model was built to simulate the long-term thermal regime of the surrounding frozen soils and analyze the thermal impact of both ponding and the two buried warm-oil pipelines with types of ponding considered. In-situ measured temperatures of the surrounding permafrost were used to validate the numerical simulation results.Both the field investigation and numerical simulation results are of significant practical value for the long-term maintenance of buried warm-oil pipelines in permafrost regions with abundant surface water.
2 Permafrost and field investigation along the CRCOP
2.1 Permafrost conditions along the CRCOP
The weather along the CRCOP is cold and dry in winter due to the influence of continental and monsoonal climate and is warm and rainy in summer. The mean annual air temperature varied between -4.0 °C to -0.3 °C and the mean annual precipitation between 442 mm to 526 mm along the pipeline from Xing'an to Jiagedaqi during 1959-2012 (Figure 1) (Jinet al.,2008; Wanget al., 2016). Permafrost along the pipeline,of Xing'an-Baikal type,can be divided into three regions, including discontinuous permafrost region with isolated taliks from Mohe to Walagan, discontinuous permafrost region with extensive taliks from Walagan to Jinsong, and sporadic permafrost region from Jinsong to Jiagedaqi (Jinet al., 2010). Warm(>-1.0 °C) and ice-rich permafrost accounts for 119 km, or 27% of the permafrost region, along the pipeline. The active layer thickness varies between 2.0 m and 2.5 m in mountainous regions and between 1.0 m and 2.0 m in marsh regions. The main vegetation along the pipeline is coniferous with a forest coverage varying from 70% in discontinuous permafrost region to 50%-60% in sporadic permafrost region(Wanget al., 2016). The typical soil along the pipeline is gravelly with organic clay commonly occurring near the ground surface, which helps to form a waterresisting surface layer. Furthermore, dense river network, wetlands, and marshes exist extensively. Notably,50 km of the pipeline was buried in the wetland.
2.2 Field investigation of ponding along the CRCOP
A detailed field study was performed in August,2018, along the 400-km long pipeline segment in permafrost regions between Xing'an and Jiagedaqi.The location (longitude and latitude) and size (length,width, and depth) of ponding were recorded, and its causes and sources were analyzed according to local factors. The ponding can be categorized into four types based on its location relative to the pipelines,including between the two lines, outside of the sec-ond line, on both sides of the second line, and on top of the second line, as illustrated in Figure 2. In other words, ponding mainly occurred alongside the second line with little on top or outside of the first line.A total of 102 ponding sites were identified in the study region.
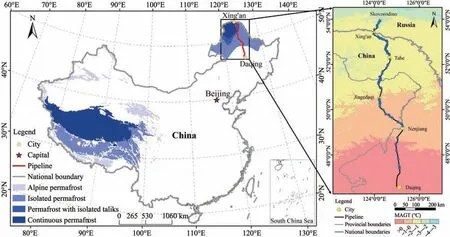
Figure 1 Location of the China-Russia Crude Oil Pipeline and Permafrost Distribution in China
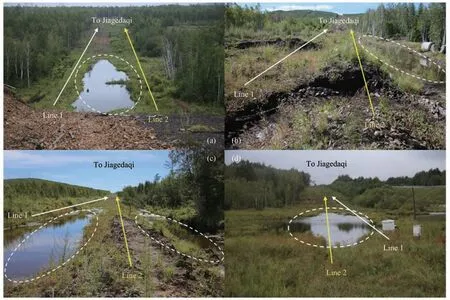
Figure 2 Four types of ponding based on its location relative to the pipelines:(a)between the two lines,(b)outside of the second line,(c)on both sides of the second line,and(d)on top of the second line
2.3 Distribution and characteristics of ponding
Ponding mainly developed when the pipelines cross wetlands or marshes with groundwater, drainage paths, or intermountain valleys. The distribution of position of ponding occurrences is shown in Figure 3a. Many rivers traverse the pipelines in permafrost regions.The shape of ponding is mainly dependent on embankment height and local topography.Ponding appeared as a strip parallel to the pipelines. In the study region, 41.2% of ponding formed at the intersections between the pipelines and rivers,and 22%formed outside the second line. The width of ponding varied between 3 m and 5 m, and the depth was less than 1 m.The length varied significantly,from several meters to hundreds of meters. By dividing the length into four segments,i.e., less than 10 m, 10-20 m, 20-100 m,and more than 100 m, the frequency of each segment was obtained and shown in Figure 3b.The majority of ponding (62.9%) had a length of less than 10 m. Besides, the length of ponding was usually larger in marshes along the pipelines.
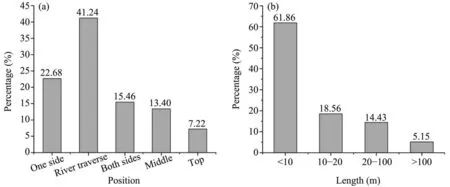
Figure 3 Distribution of ponding occurrences based on the position(a)and length(b)
2.4 Monitoring site
Since the operation of the first line in 2011,a monitoring site(50°28′14.23″N,124°13′31.75″E)was established along the pipeline at KP 391 km+600 m or 0.6 km north of Jiagedaqi pump station. The site has an altitude of 484 m,a mean annual air temperature of-1.2 °C, and mean annual precipitation of 524 mm.The permafrost at the monitoring site was warm and ice-rich, with the permafrost table located approximately 2.0 m below the ground surface and a mean annual ground temperature of -0.7 °C. The site had good vegetation cover, which was underlain by peat,silty clay, gravel, and well-weathered granite (Wanget al., 2018a). Two temperature boreholes (T1 and T2) of 20 m deep were drilled nearby the pipeline, as illustrated in Figure 4.Two thermistor cables (with an accuracy of±0.05 °C),made by the State Key Laboratory of Frozen Soil Engineering (SKLFSE), were used for ground temperature monitoring starting in March 2014. Ponding was assumed to occur by borehole T1 in model calibration.
3 Heat transfer model with phase change and seepage
3.1 Model scenarios
Four model scenarios were considered based on the observed types of ponding, as depicted in Figure 5.The width and depth of ponding were assumed to be 5 m and 0.8 m,respectively,based on the average sizes obtained from field investigation. Ponding was assumed to occur at the center between the two lines, or right on top of the second line. When ponding was outside of the second line, the distance from the center of ponding to the center of the pipe was assumed to be 4.5 m. The diameter of the pipe in both lines was 813 mm with a burial depth(from the ground surface to the top of the pipe wall)of 3.0 m and a centerto-center distance of 10 m. Notably, there was a thermal insulation layer(8-mm thick)around the pipe.
3.2 Governing equations
The soil was assumed to be homogeneous and isotropic,and there was no convection or mass migration inside the soil. Only heat conduction and phase change were considered. The heat transfer process within the subgrade soil experiencing freeze-thaw can be expressed as follows (Anet al., 1990; Laiet al.,2004),
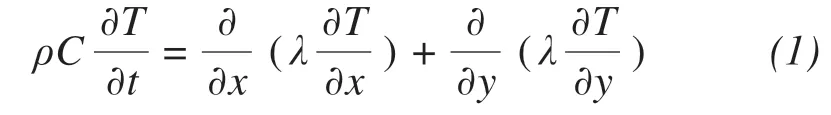
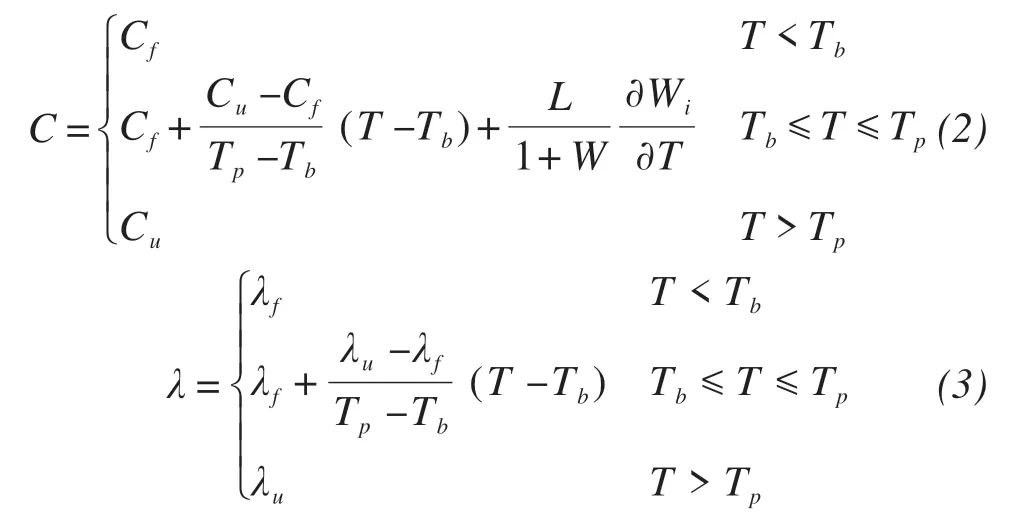
where,ρis the soil density (kg/m3);CfandCuare the respective specific heat capacity of frozen soil and unfrozen soil (J/(kg⋅K));λfandλuare the thermal conductivity of frozen soil and unfrozen soil (J/(m⋅h⋅K));Lis the latent heat of phase change(i.e.,334.56 kJ/kg);WandWiare the total gravimetric water content and ice content,respectively;TpandTbare the temperature range for phase change(°C);andtis the time(h).
3.3 Initial and boundary conditions
The left and right boundary (AE and FJ) were assumed to be adiabatic. The temperature gradient of the bottom boundary (EJ) was 0.06 °C/m. The initial soil temperature was assumed to the same as measured from borehole T2, which is relatively farther away from the pipeline and can be considered as undisturbed ground temperature. The initial simulation time was set on October 15, 2014. Ponding was simulated as heat transfer in fluid, compared with heat transfer in solids in the soil domain. The relationship between water temperature and air temperature can be expressed as follows(Erickson and Stefan,2000),

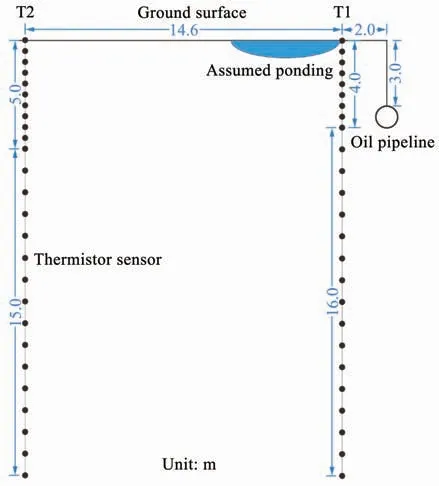
Figure 4 Layout of boreholes(T1 and T2)and thermistor cablesat the monitoring site and assumed ponding
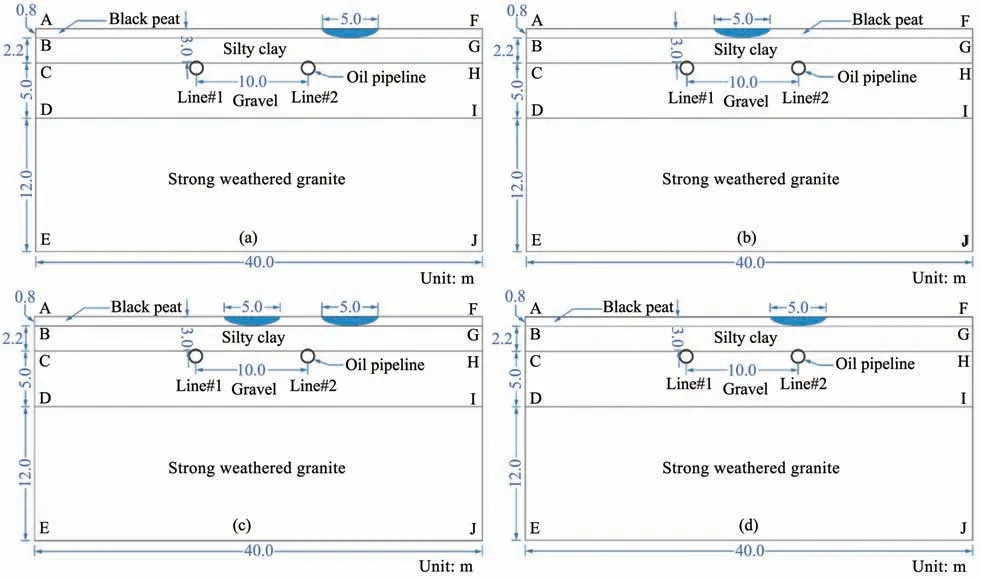
Figure 5 Schematic diagram of four physical model scenarios:(a)outside the second line,(b)between the two lines,(c)on both sides of the second line,and(d)on top of the second line
where,Twis water temperature(°C);Tais air temperature (°C);aandbare coefficients. The range ofais 0.6-0.8 in general.The water temperature in the calculation was correlated to the air temperature observed at Jiagedaqi meteorological station (Liet al., 2010). The upper boundary condition can be expressed as follows:
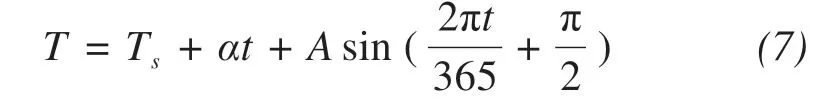
whereTsis the average annual ground surface temperature;αis the air temperature increase rate (°C);tis the time (d);Ais the annual amplitude of ground surface temperature (°C); π/2 is the initial phase.αandAwere found to be 0.048 and 18.5,respectively.The average annual ground surface temperature was -3 °C(Liet al.,2010).
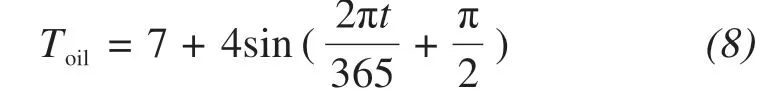
The temperature of the pipe wall was set to be the same as the oil temperature measured at Jiagedaqi pump station(Wanget al.,2018a),as shown in Figure 6. The data measured from 2011 to 2017 show that the oil temperature remained above 0 °C during the entire period, with the average, minimum, and maximum temperature of 7 °C,2 °C,and 13 °C,respectively.The temperature data can be described as follows
The thermo-physical parameters of each layer in the model were adopted from Xuet al. (2001) and Zhanget al.(2010)and are listed in Table 1.
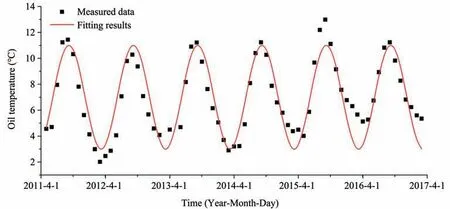
Figure 6 The measured oil temperature and the fitting result
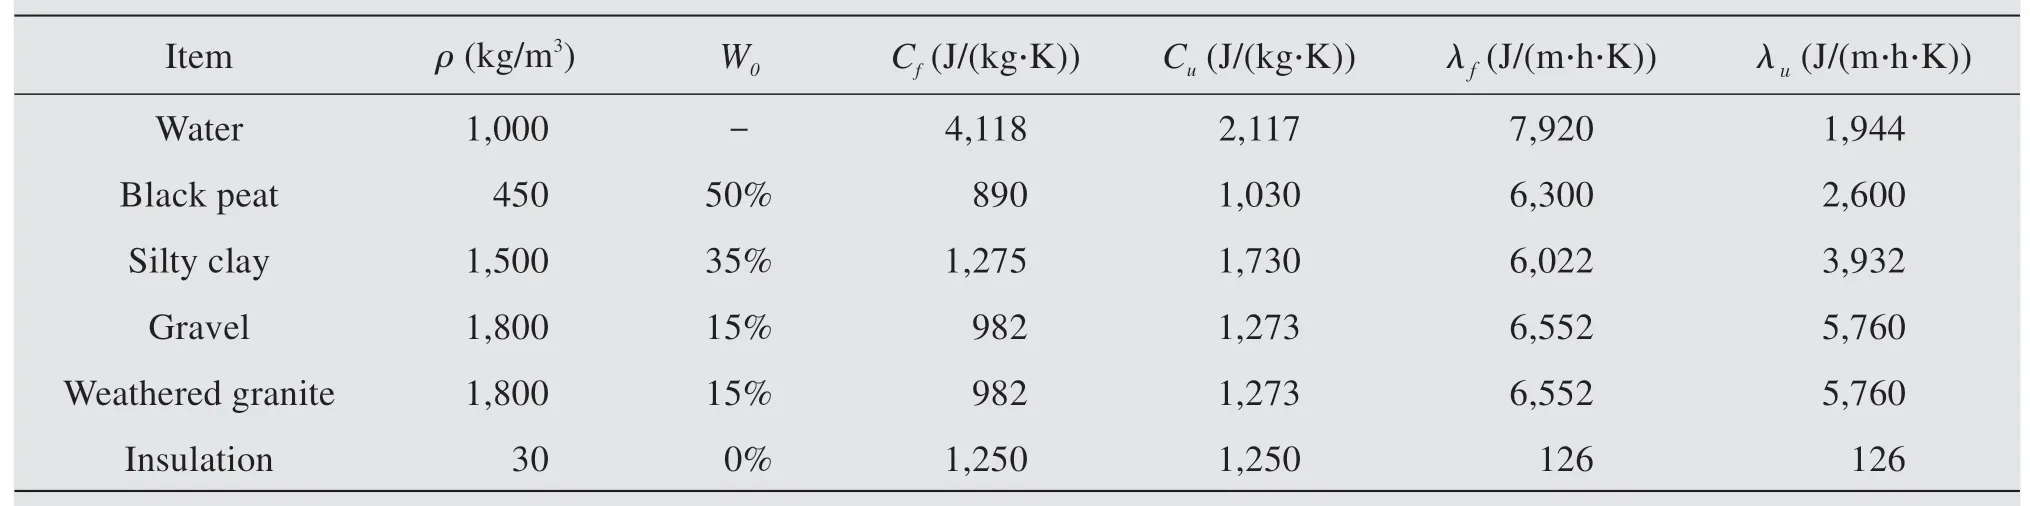
Table 1 Thermo-physical parameters used in thermal modelling
4 Simulation results
4.1 Temperature in borehole T1 and T2
The model-simulated soil temperatures at different depths were validated by the measured data from boreholes T1 and T2, as depicted in Figure 7.A good agreement can be found between the model results and the measured data, indicating that the established model is capable of capturing the salient features of thermal interaction between the pounding and operation of warm-oil pipelines and the surrounding permafrost. This model was then used to predict the soil temperature field around the pipe during the operation of the pipelines.
The temperature field of subgrade soil around the pipe was analyzed with and without ponding.The soil temperatures of borehole T1 for the first 20 years of operation were extracted and shown in Figure 8.Without ponding, the thaw depth remains stable during the first eight years of operation and then increases steadily afterward under the thermal influence of warm oil and climate change. The permafrost table at T1 drops from 2.0 m deep during the initial operation to 4.5 m after 20 years of operation. Notably, a talik of 1.5 m thick develops between the active layer and underlying permafrost at the 13thyear and becomes as thick as 3.0 m after 20 years of operation. With ponding near the pipe,the thaw depth is similar to that without ponding during the first six years of operation. After that, the thaw depth increases steadily and reaches 6.0 m after 20 years of operation. Besides, a talik of 1.5 m thick occurs as early as in the 10thyear, and its thickness grows to almost 4.0 m after 20 years of operation. Ponding nearby borehole T1 accelerates the degrading of permafrost, increases the maximum thaw depth, and prevents the freezing back of part of the thawed permafrost.
The evolution of permafrost temperature in borehole T2 with and without ponding is shown in Figure 9. Figure 9a and b show that ponging does not have a significant influence on the thermal regime of the permafrost at borehole T2. By comparison of Figure 9 with Figure 8, it can be seen that the thermal influence of warm oil to permafrost at T2 is minimal.Thus, it can be concluded that ponding and warm oil carried by the pipelines almost have no thermal influence on the permafrost near T2.
4.2 The maximum thawing depth of two lines
The evolution of the maximum thaw depth around the two pipelines without ponding in 50 years are shown in Figure 10. The thaw depth of permafrost around the pipes increases with operation time under the effects of climate warming and warm oil. During the first ten years, the change of thaw depth is not obvious, except for the permafrost directly below the pipes, where a semicircular thaw zone develops under each pipe and progresses downward with operation time. After ten years, the thaw zone continuously extends deeper and wider with operation time. By the 50thyear, the semicircular zones under the two pipes merge, and the zero isotherm becomes flat, resulting in a maximum thaw depth of approximately 9 m.
Figure 7 Comparison between the measured data and model results for boreholes T1 and T2
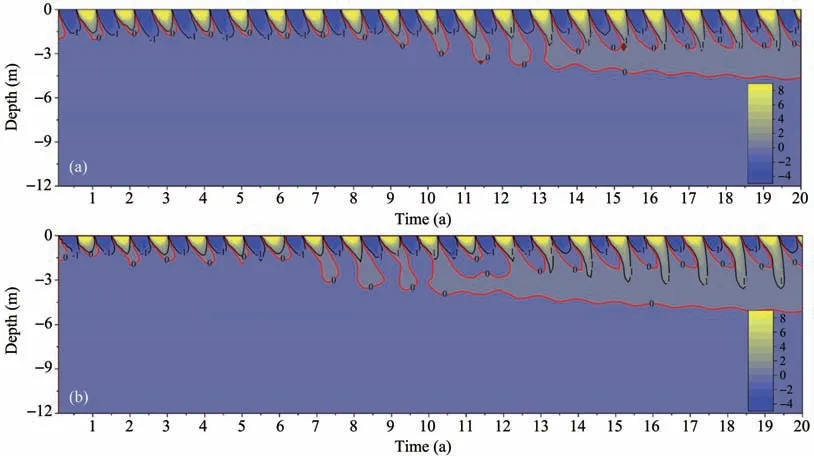
Figure 8 Evolution of permafrost temperature in borehole T1 without(a)and with(b)ponding
When ponding is outside of the second line, the thermal regime results shown in Figure 11 reveals that the thaw depth is smaller than that without ponding in the first ten years. After that, the thaw depth and the increase rate are almost the same as those without ponding. The thaw region directly below ponding is larger than the other side(e.g.,below line 1)at the same operation time.The maximum thaw depth reaches 10 m after 50 years of operation.
When ponding occurs between the two lines, the change of temperature field is similar to that of ponding outside the pipe (Figure 12). Compared with the results without ponding, the thaw depth for permafrost between the two lines decreases during the first ten years of operation and then increases rapidly due to ponding and warm oil.After 20 years of operation,ponding enhances ground thawing and accelerates the degradation of permafrost between the two lines, with the maximum thaw depth reaching 11 m after 50 years of operation.
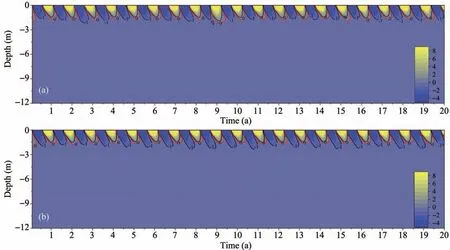
Figure 9 Evolution of permafrost temperature in borehole T2 without(a)and with(b)ponding
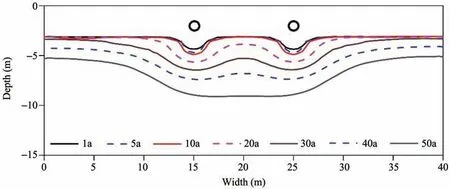
Figure 10 Evolution of the maximum thaw depth around the pipelines without ponding
The characteristics of thaw depth with ponding on both sides of the second line are similar to those for the previous two types of ponding (Figure 13).In the initial operation, the maximum thaw depth below ponding is smaller than that without ponding. Then the thaw depth increases, and the increase rate is larger than that without ponding. After 50 years of operation, the maximum thaw depth also reaches 11 m.
When ponding happens on top of the second pipeline,the evolution of the thaw zone and thaw depth increase rate is similar to those without ponding (Figure 14). Together with warm oil, ponding accelerates the expansion of permafrost thaw zone year by year, and the maximum thaw depth increases faster than without ponding.
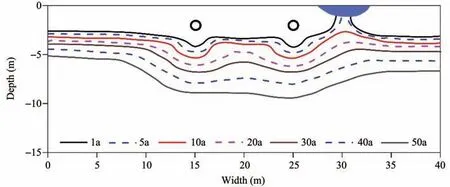
Figure 11 Evolution of the maximum thaw depth around the pipelines with ponding outside the second line
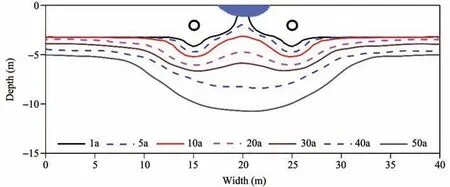
Figure 12 Evolution of the maximum thaw depth around the pipelines with ponding between the two pipelines
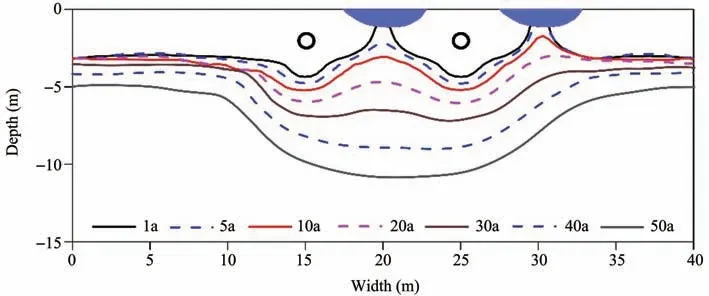
Figure 13 Evolution of the maximum thaw depth around the pipelines with ponding on both sides of the second line
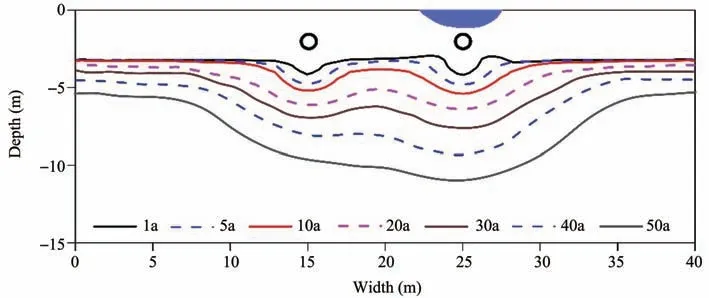
Figure 14 Evolution of the maximum thaw depth around the pipelines with ponding on top of the second line
5 Discussions
The installation of the second line further disturbed the ground surface conditions and its thermal balance. Trees were removed in the narrow pipeline corridor, and the origina soil around the pipe was excavated and replaced with borrowed backfill, resulting in decreased ground surface gradient and hence less drainage diversion. The flow path was altered,and ponding subsequently developed on the top and both sides of the pipe. Except for engineering disturbance, ponding is closely related to the topographic factors. The mass migration, energy conversion, and landscape pattern near the ground surface can all affect the development of ponding. Ponding alongside the pipeline will also considerably weaken the foundation soil in warm seasons.
Ponding will help enlarge the thaw region of the permafrost around the pipe. Different types of ponding induce distinct patterns of thermal influence on permafrost. Ponding on top of the pipe will result in settlement of the embankment and increase the risk of frost heave due to an abundant supply of water, hence potentially exposing the pipe gradually. Ponding outside the pipe will erode the embankment and increase the settlement, while ponding on both sides of the pipe will change the thermal conditions and accelerate permafrost degradation.
Generally,an embankment of 0.5 m to 1.0 m thick was constructed above the CRCOP, which helps raise the permafrost table(Zhanget al.,2010).Therefore,it is conservative for the simulation model to ignore the embankment and its effects on preserving the permafrost. Variation of the maximum thaw depth of each type of ponding with time is shown in Figure 15. The thaw depths in all cases increase with the operation time. Among all cases, the maximum thaw depth is 11 m with ponding on top of line 2.The permafrost thaw depth around the pipeline without ponding after 50 years from this study is greater than that (e.g., 6 to 7 m) reported Liet al. (2010). The primary reason is that the pipe burial depth used in this study was deeper, as determined based on the field survey near Jiagedaqi pump station.
In permafrost regions, the thaw depth reaches the maximum around October 15, when of ground surface temperature normally drops below 0 °C (Brownet al.,2000;Wu and Zhang,2010).Based on field survey, most of the ponding was found to be shallow.Therefore, the ponding in the simulation model is totally frozen when the thaw depth reaches the maximum. Ponding increased the soil freezing depth since the thermal conductivity of ice is larger than water and soil surrounding the pipe.There is a thawed interlayer in borehole T1 resulted from the thermal influence of warm oil. Because borehole T1 is next to the ponding, the freezing depth of soil around the pipe is larger with ponding than without ponding. The depth of ponding was assumed to be constant in this study.However, if no drainage is allowed, ponding would expand considerably, leading to increased maximum thaw depth and ground surface subsidence. The expanded ponding could exert more thermal influence on the permafrost around the pipe. Thus, engineering measures should be adopted to prevent the development of new ponding and provide drainage and ground surface repair for existing ponding alongside the pipelines.
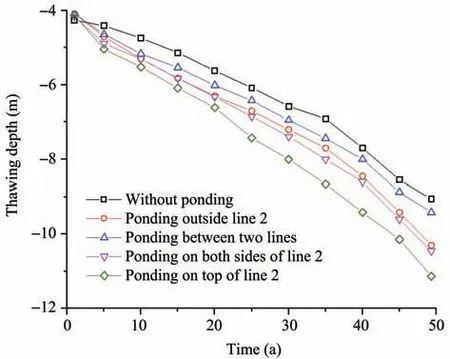
Figure 15 Variation of the permafrost thaw depth below the second line with time
The simulation in this paper did not consider the settlement of the pipe due to thaw of permafrost around the pipe and heat convection due to ponding.Therefore, thaw zone development is underestimated.In reality, especially in ice-rich regions, permafrost thaw will increase the settlement of the pipe and aggravate the formation of ponding alongside the pipe,which in return increases the thaw rate of permafrost around the pipe. Besides, the first line had operated for seven years before the operation of the second line, which was not considered in this study, and its impact could be considered in the future study.Except for the temperature field near the pipes,the hydrothermal balance of pipe and terrestrial/underground is essential for reflecting the thermal conditions of the pipes and underlying permafrost. Also, the evolution of ponding size during operation is worthy of analyzing. In the future, a three-demensional thermal model coupled with hydrological,ecological models,and terrestrial process model could be considered. Step functions or dynamic meshing can be adopted in simulation models to account for the change of ponding size during operation.
6 Conclusions
This paper describes a detailed case study of ponding and its thermal impact on the permafrost along the CRCOP. A total of 102 ponding sites were identified and were categorized into four groups based on their location relative to the pipeline.A heat transfer model was established to evaluate the thermal influence of different types of ponding and operation of warm-oil pipelines on the surrounding permafrost. The following conclusions are drawn:
(1) The simulated results show that warm-oil pipeline can exert significant thermal influence on its surrounding permafrost.A talik forms nearby due to the operation of the warm-oil pipelines. Ponding accelerates the formation of the talik by three years and increases its thickness from 3.0 m to 4.0 m after 20 years of operation.
(2)Two semi-circular thaw zones form directly below the two pipelines due to climate change and the operation of warm-oil pipelines. These two semi-circles will expand deeper and merge to form a relatively flat thaw front after 50 years of operation.The maximum thaw depth without ponding increases from 4 m after 2-5 years of operation to 9 m after 50 years of operation. Ponding increases the thaw depth below the pipelines, with the maximum thaw occurring when it occurs on top of a pipe.
(3) Ponding nearby the pipeline helps accelerate permafrost thaw after ten years of operation. However, within the initial ten years of operation, the shallow ponding freezes in winter and helps raise the zero isotherm below the ponding by allowing more heat to be extracted.
(4) Engineering measures should be adopted to control the scale of ponding and even eliminate ponding. The height of the pipe embankment should be raised in the sections with poor geological conditions.More studies need focus on the ponding alongside the warm-oil pipelines in the future.
Acknowledgments:
This work was supported by the Strategic Priority Research Program of Chinese Academy of Sciences(Grant No. XDA2003020102), the China Postdoctoral Science Foundation (No. 2019M653797), the National Natural Science Foundation of China (No. 41630636 and No. 41772325), and the Major Program of the Bureau of International Cooperation, the Chinese Academy of Sciences(131B62KYSB20170012).
 Sciences in Cold and Arid Regions2020年2期
- Sciences in Cold and Arid Regions的其它文章
- Estimating interaction between surface water and groundwater in a permafrost region of the northern Tibetan Plateau using heat tracing method
- Quantitative estimation of the influence factors on snow/ice albedo
- Spatial and temporal transferability of Degree-Day Model and Simplified Energy Balance Model:a case study
- The heterogeneity of hydrometeorological changes during the period of 1961-2016 in the source region of the Yellow River,China
- Distribution patterns of planted-shrubs of different restoration ages in artificial sand-fixing regions in the southeastern Tengger Desert