
Distribution patterns of planted-shrubs of different restoration ages in artificial sand-fixing regions in the southeastern Tengger Desert
2020-05-31 10:50MeiLingLiuNingChenRuiQingZhu
MeiLing Liu,Ning Chen,RuiQing Zhu
1. Key Laboratory of Stress Physiology and Ecology in Cold and Arid Regions, Northwest Institute of Eco-Environment and Resources,Chinese Academy of Sciences,Lanzhou,Gansu 730000,China
2. Shapotou Desert Research & Experiment Station, Northwest Institute of Eco-Environment and Resources, Chinese Academy of Sciences,Lanzhou,Gansu 730000,China
3.School of Life Science,Lanzhou University,Lanzhou,Gansu 730000,China
4. Key Laboratory of Microbial Resources Exploitation and Application of Gansu Province, Institute of Biology, Gansu Academy of Sciences,Lanzhou,Gansu 730000,China
ABSTRACT Plant density and spatial distribution in artificial vegetation is obviously initialized at the planting stage. Plant dynamics and spatial pattern may change over time as the result of interactions between individual plants and habitats, but whether it's applied for desert shrubs in artificial sand-fixing regions remains unknown. Here we examined changes in plant density and distribution patterns of three shrubs (Artemisia ordosica Krasch, Caragana korshinskii Kom, and Hedysarum scoparium Fisch.) in different regions, which have been restored for 27, 32 and 50 years (R27, R32, R50), respectively. The vegetation analysis shows that A.ordosica was the dominated species across the 3 restoration regions.The density of A.ordosica and H. scoparium show a significant increase from R27 to R32, then decreased in R50.The density of C. korshinskii was low in R32 and R50, lower in R27.The variance-to-mean ratio (VMR) was used to characterize spatial distribution patterns to fit the observed densities of the three shrubs by frequency.A.ordosica and C.korshinskii both show significantly clumped distributions in three restoration regions.H.scoparium show a uniform distribution in R27 and R50,but a clumped distribution in R32. These results show that A. ordosica seems to be more adaptable in revegetated desert areas compared to C.korshinskii and H.scoparium.Pattern analysis suggests a successive replacement of C.korshinskii,which had low proportions of survived shrubs, by the dominant A. ordosica. This study contributes to the understanding of the distribution patterns of shrubs plants in revegetation projects in arid desert areas.
Keywords:restoration;shrubs;density;spatial pattern
1 Introduction
Desertification is not only a major obstacle to the country's regional economic development but also poses a serious threat to biodiversity. Consequently,vegetation restoration is important to mitigate desertification and to promote sustainable development. Revegetation is a common and effective method to combat sand encroachment into adjacent areas in many arid desert regions (Le and Henry, 2002). The reintroduction of woody or shrub species in plantations has become increasingly important in arid and semiarid lands(Castilloet al.,1997).The plant spatial distribution is obviously initialized at the sowing or planting stage. The survival and establishment of introduced vegetation is the result of interactions between individual plants and habitats (Liet al., 2013).Thus, vegetation spatial patterns(species composition and structure) of artificial vegetation change after long-term vegetation successions. Vegetation spatial patterns in arid desert regions can be either periodic or random(Borgognoet al., 2009), but studies on successional mechanisms of artificial vegetation in a long-term and systematic monitoring of desert environments available are meager.
A series of ecological engineering projects has been established to reduce and prevent desertification in arid and semiarid lands(Wanget al.,2007).The establishment of sand-binding vegetation in the Shapotou region is considered a successful example of the control of shifting sand (Xiaoet al., 2003). Xerophytic shrubs were planted in the Shapotou region at the southeastern fringe of the Tengger Desert in order to protect the Baotou-Lanzhou Railway line from sand burial by mobile dunes. Long-term monitoring indicates that stabilization of the windblown sand benefits from the establishment of grasses and cryptogam,while shrubs began to retreat after about 20 years of re-vegetation. After 50 years of succession, the mobile dune-dominated desert landscape changed into a complex modified natural desert ecosystem. Studies demonstrate that the biodiversity increased, soil physical and chemical properties was improved (Liet al., 2011), and biological soil crusts was also developed (Liet al., 2010). However, little information has been obtained on spatial pattern changes of planted shrubs in vegetation succession process in arid desert areas.
In this paper, we selected three revegetation bands constructed in 1964, 1982 and 1987 respectively as sample plots to investigate number, sizes and spatial positions of shrubs. Based on existing evidence, the aim of this study is to select suitable species for revegetation, and understand vegetation patterns for its succession mechanisms.We expect to provide a strategy for the conservation and restoration of desert ecosystems,and further expand our knowledge of ecological restoration in arid zones.
2 Material and methods
2.1 Study site
Our study site was in Shapotou area, located at southeastern fringe of the Tengger Desert(37°28'07"N,105°00'06"E; Shapotou Desert Research and Experiment Station). Before 1956, natural vegetation coverage was below 1%, with psammophytes (Hedysarum scopariumFisch andAgriophyllum squarrosumMoq)as the dominant native species.To protect the Baotou-Lanzhou Railway from wind erosion and sand burial in this desert region,a 16-km-long sand-binding vegetation protective system was built along the railway in 1956 by the Chinese Academy of Sciences and the Department of Railways. Two-year-old xerophytic shrubs (Artemisia ordosicaKrasch,Caragana korshinskiiKom, andH. scoparium) were planted, the density was 25.0, 12.5, and 12.5 plants/100 m2in row and line spaces (Figure 1). No further interventions(e.g.,planting,grazing,fire)were done after these initial manipulations. Subsequently, re-vegetation was further developed in 1964, 1982, and 1987 by the same methods. More information about the revegetation project, including details on the abiotic variables,are available in Shapotou Desert Research and Experiment Station(1991).After several decades,the re-vegetated zone formed a stabilized sand-binding vegetation community with a width of 500-1,000 m to the north and width of 200-1,000 m to the south of the railway.
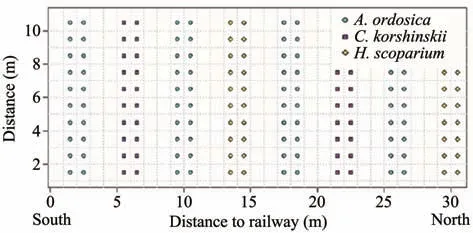
Figure 1 Sketch of planting distribution in artificial sand-fixed regions
2.2 Methods
This research was conducted in July 2014.A transect of 300m×20m which consists of 15 quadrats(20m×20m) was set cross revegetated belts on the north side of the railway. In this transect, we chose three re-vegetation sites that were initially established in 1964, 1982, and 1987 (50, 32, and 27 years old, respectively), and the three sites are referred to as R50,R32, and R27, respectively (Figure 2). The numbers,height,and crown diameters(east to west and north to south) were recorded or measured.The shrub cover in each restoration region was calculated as the sum of the cumulative canopy projected area of all shrubs by assuming that crowns have an elliptical shape.In addition, each shrub species was labelled and positioned with RTK (Real-time kinematic, The South S86 GPS receiver). The time series for annual rainfall was ob-tained from the Shapotou Meteorological Station(Chenet al.,2018).
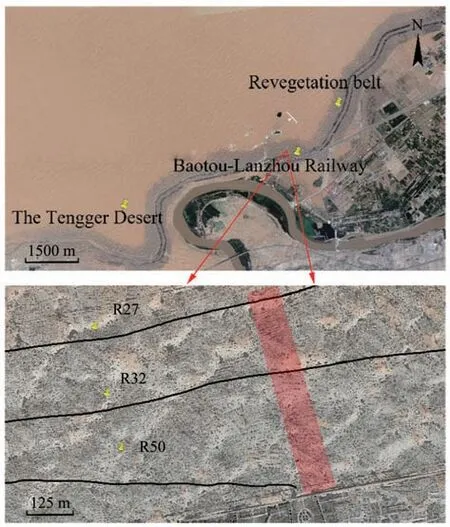
Figure 2 The location of studied area,and three restoration sites(R50,R32 and R27 site)in Shapotou region.The red marked region denotes the location of sampling plots where the data are obtained
The variance-to-mean ratio (VMR) was used to characterize the spatial distribution patterns of vegetation variables on the dunes.

whereS2is the variance of plant number,andmrepresents mean number of species.These values were calculated in Microsoft Office Excel 2016.VMR>1.0 indicates a clumped distribution, VMR <1.0 indicates a uniform distribution, and VMR = 1.0 indicates a random distribution(Greig-Smith,1964).
3 Results
3.1 Distribution and variability of precipitation in the Shapotou region
Rainfall is one of the most important abiotic factors determining survival rate and growth of plants in a plantation. During our experimental period from 1964 to 2014, annual rainfall averaged 174.0 mm(Figure 3). Rainfall was not uniform in different years, and the inter-annual variability ranged from 77.1 mm to 284.7 mm. The precipitation of 1964,1982 and 1987 is 198.1 mm,109.1 mm,and 119.8 mm,respectively.
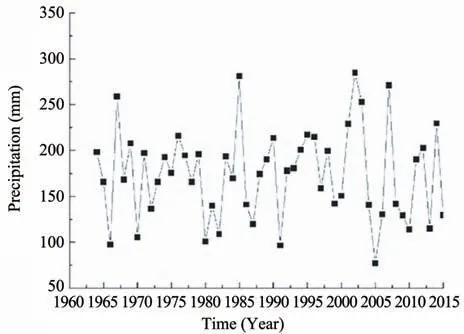
Figure 3 1964-2014 mean precipitation
3.2 Survey of shrubs in different restoration regions
The vegetation analysis shows thatA. ordosicawas the dominated species across the 3 restoration regions(Table 1).The density ofA.ordosicashow a significant increase from 29.5 (R27) to 91.4 (R32), then decreased to 48.0 in R50. There was a similar trend observed inH.scopariumover the time of succession,increasing significantly from 3.8 (R27) to 6.9 (R32),decreasing to 2.8 (R50). However,C. korshinskiidid not survive in R27. In R32, the density ofC. korshinskiiwas 1.1, and then increased to 2.5 in R50. The density of total shrubs also show a consistent trend as previously, increased from 33.3 (R27) to 99.4 (R32),then decreased to 53.4 (R50). The quantity ratio ofA.ordosica,C. korshinskiiandH. scopariumwas 7.7:/:1 in R27, 83:1:6.3 in R32 and 19.2:1:1.1 in R50. The coverage ofA. ordosicaincreased from 9.9 in R27 to 19.5 in R32,then decreased to 13.1 in R50.InH.scoparium, the coverage decreased from 14.0 (R27) to 7.6 (R32), and maintained at 7.6 (R50). The coverage ofC. korshinskiiincreased significantly from 1.1 in R32 to 2.5 in R50. The total coverage show an increasing trend from 23.8 (R27) to 35.7 (R32) to 39.3(R50).
3.3 The distribution patterns of shrub plants in different restoration regions
The distribution patterns show unique characteristics for different shrubs in different restoration regions (Figure 4). The VMR ofA. ordosicaall show significantly clumped distribution in three restoration regions (Table 2). Similarly,C. korshinskiialso show clumped distribution in R32 and R50. ForH. scoparium,the VMR show differences in three restoration regions, with uniform distribution in R27 and R50, and clumped distribution in R32. In total, the vegetation show significantly clumped distributions in three restoration regions. Despite these findings, the three shrubs VMR indicated the same trends: the highest values in R32.
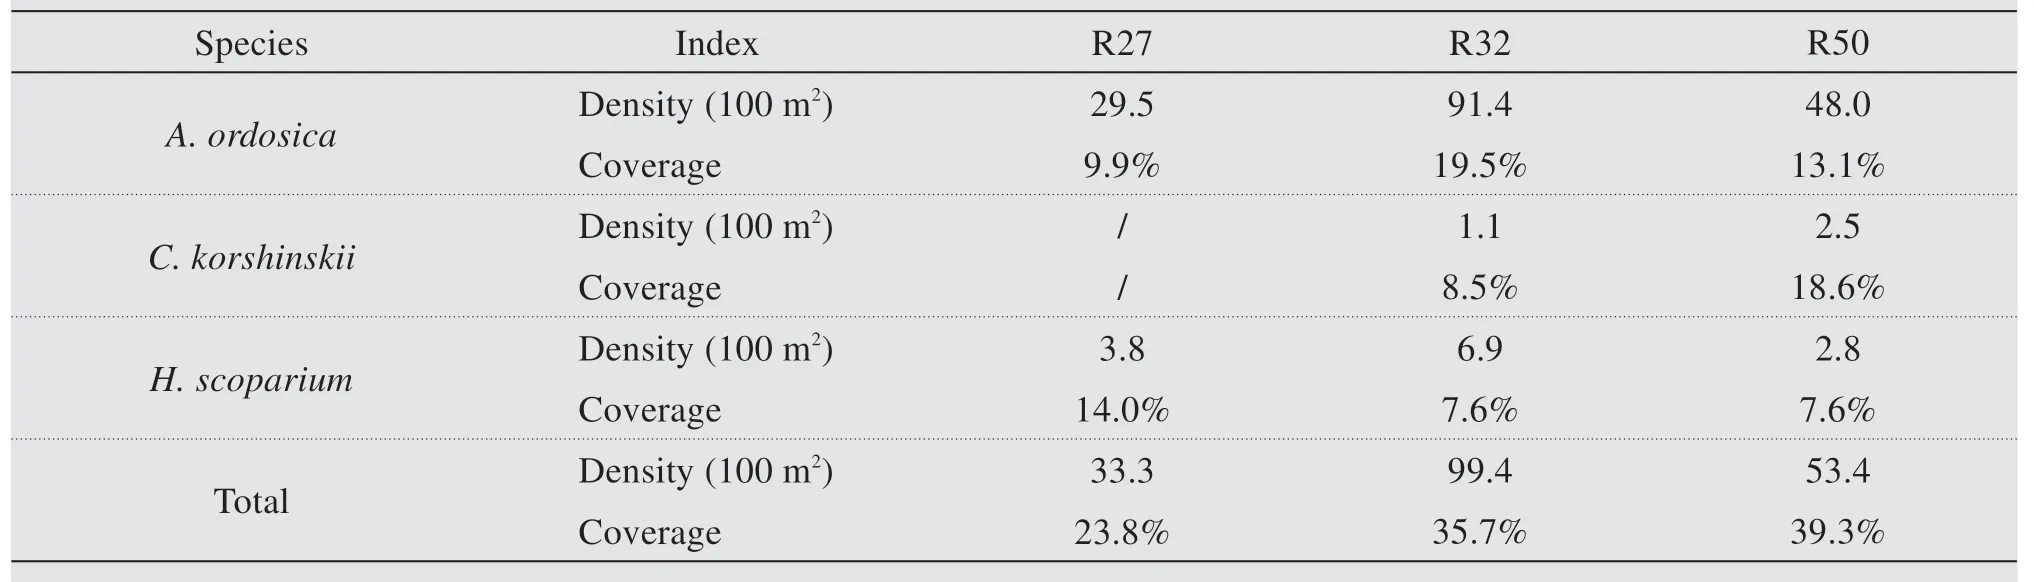
Table 1 Vegetation properties of the study sites(mean±se)/denotes that no shrubs were found
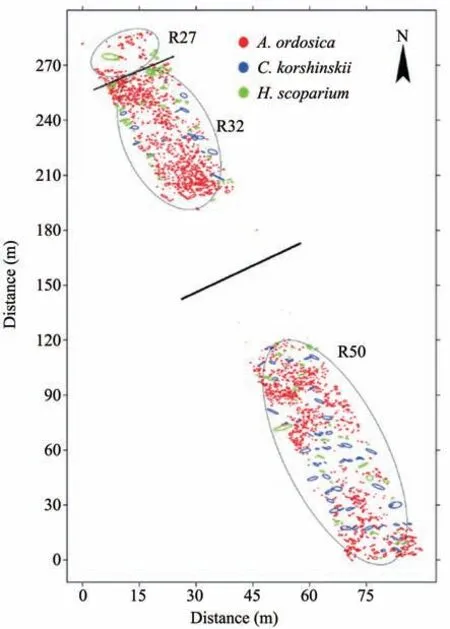
Figure 4 Spatial distributions of three shrub species(A.ordosica,C.korshinskiiin,H.scopariu)in the experimental region.The circles represent the cover of shrub crowns.Each shrub cover was calculated by assuming that crowns have an elliptical shape
4 Discussion
Precipitation, as the sole source of water replenishment in arid and semiarid areas, plays an important role in sustaining the desert ecosystem. In this area, average precipitation during 1964 to 2014 was 174.0 mm, and ranged from 77.1 mm to 284.7 mm.Precipitation in this region may indicate more competitions for survival and growth of plants. Re-introduction of environmental favorable species may be a useful tool to restore a typical, and more diverse ecosystems. In this study, the vegetation analysis shows thatA. ordosicawas the dominated species across the 3 restoration regions (Table 1).H. scopariumwas distributed with lower density and coverage thanA. ordosica. However,C. korshinskiiwas rarely distributed in the study area, with no survival in R27. These results suggest thatA. ordosicawas the most favorable species in this region. The competitive strength ofH.scopariumseems to be relatively poor.C. korshinskiiwas the most disadvantaged species in this region.Zhanget al.(2008)found thatA.ordosicahad a greater proportion of its root distribution in the shallow soil layers and therefore made better use of the limited precipitation. Previous research (Li and Zhao,2006) shows thatH. scopariumhad higher seedling establishment under drought conditions compared toC. korshinskii. Meanwhile, the large transpiration and excessive soil drought induce the degradation ofC.korshinskiiin vegetation succession, which represented a disadvantage when compared withA. ordosicaandH. scoparium(Zhanget al., 2008). Thus,A. ordosicaseems to be more adaptable compared toH.scopariumandC. korshinskii, in re-vegetated desert areas. Previous research also indicated that, in a long time scale,during the ecosystem succession,the vegetation evolved from multi sand-stabilized shrubs to steppe desert vegetation dominated byA. ordosica(Liet al., 2013). Notably, it contained 91.4 plants/100 m2(A.ordosica)in R32 with the highest density,then decreased to 48 plants/100 m2in R50.A possible explanation for the decrease is that because of the high shrub density in R32, it failed to provide necessary habitats for establishment and growth of seedlings.We therefore postulate that even under most favorable environmental conditions, a density of approximately 1/m2may post a maximum density for revegetation.This knowledge will help restoration managers to manipulate factors that they should place emphasis on the estimated output of a specific restoration, like selection of suitable species.
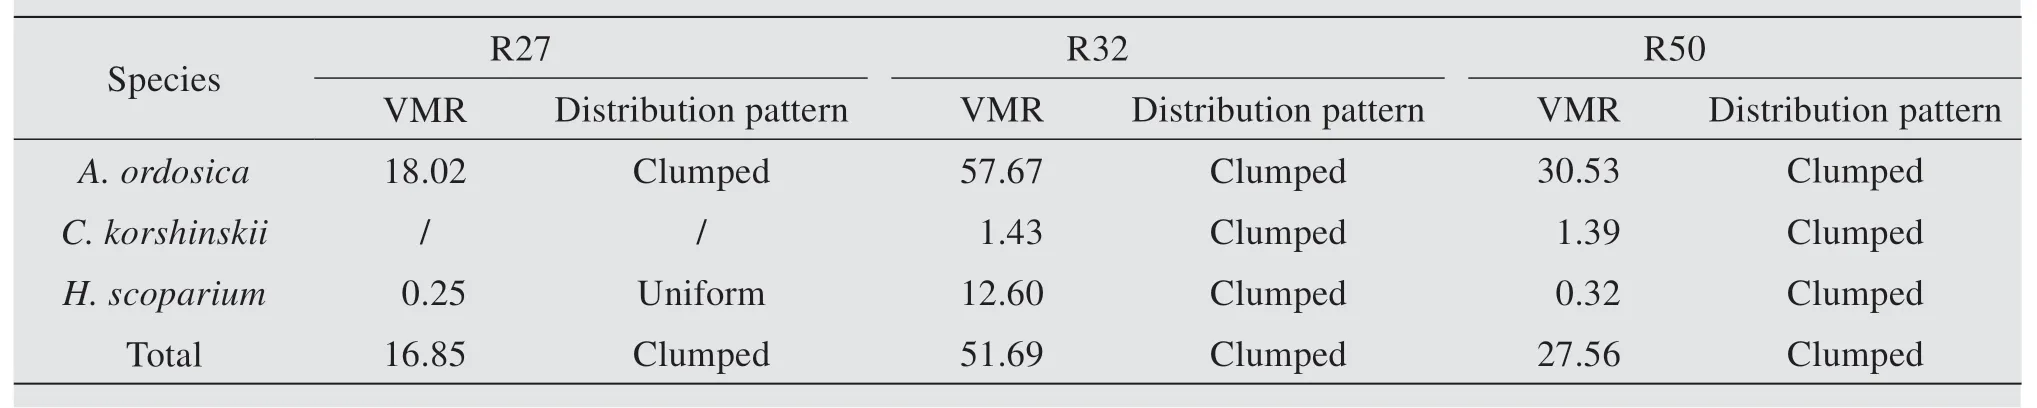
Table 2 Distribution patterns of three shrubs in different restoration regions
Spatial ecology is fundamental in studying population and community dynamics as well as the functioning of ecosystems (Crist and Wiens, 1996). In general, a population will have one of three basic spatial patterns:(1)uniform pattern in which individuals within this population are uniformly spaced; (2)random pattern in which all individuals have an equal chance of living anywhere within an area; and (3)clumped pattern in which individuals have a higher probability of being found in some areas than in others (Molles, 1999). The floristic composition, stand density and spatial distribution patterns of shrubs are expected to change with time which will be the consequences for the hydrological balance. Cayloret al.(2003) stated that the classification of spatial patterns can be a continuum moving from highly clumped to uniform pattern, with the random pattern in the middle. In this study, all shrubs were either clumped distributed or uniform. The VMR ofA. ordosicaall show significantly clumped distributions in three restoration regions. Similarly,C. korshinskiialso show clumped distribution in R32 and R50. This result was inconsistent with previous conclusions that individuals of most species are seldom uniformly or randomly but commonly clumped distributed through space in nature (Conditet al., 2000; Jiaoet al., 2008).A large number of studies have shown that the clumped distribution is the stable distribution pattern of the vast majority of natural populations (Munguiaet al., 2007). For plants, due to the characteristics of their irremovability, the spatial scope of reproduction and dispersion is limited. Seeds are often scattered around the parent plants, and the expansion of the population is always centered on the mother plant, inevitably forming a mother-centered clumped distribution (Albrecht and McCarthy, 2009). For plants with short individuals, the distance and range of seed dispersal are limited, the seed number is large, and consequently, it is easier to form the clumped distribution. The sexual reproduction ofA.ordosicamay be one important factor for its clumped distribution. ForC. korshinskii, due to low germination rate limited by water conditions, sexual reproduction is difficult to maintain in this area. Population regeneration was through vegetative propagation. The spatial range of asexual propagation is smaller than seed dispersion, which is more conducive to the formation of clumped distribution on a small scale. The observation of clumped patterns among desert plants suggests that factors other than water-mediated plant-plant interactions are important in in fl uencing the spatial distribution of desert plants.The most important single factors may be history and longevity, including a history of facilitation in the very early stages of plants which helps large cohorts establish near adult plants (Robroedet al.,2009).We expect that conspicuous clumped distributions of shrubs reflect leftover individuals of diminished demographic in fl uence in populations largely driven by isolated adults. ForH. scoparium, the VMR show differences in three restoration regions,with uniform distribution in R27 and R50, and clumped distribution in R32. The pattern presented byH. scopariumshrubs alone changed from uniform to clump with increasing density, then changed to uniform with decreasing density during restoration process. This may suggest that the three regions represent at least two different stages of colonization.A trend towards uniformity in the spatial pattern is usually explained in terms of the increasing importance of competition for resources with increasing shrub size (Yinet al., 2005). Competition among plants tends to exclude neighbors, and, in time, can promote uniform spatial patterns (Sunet al., 2016). The apparent uniform spatial distribution may indicate more competition forH. scopariumwithin and among neighbor shrub species.
Acknowledgments:
This study was supported by the National Natural Science Foundation of China (31600332, 31700373), the CAS "Light of West China" Program, and funds of Gansu Academy of Science (2019CX004-01, CY04,2018JK-04).
 Sciences in Cold and Arid Regions2020年2期
- Sciences in Cold and Arid Regions的其它文章
- Thermal influence of ponding and buried warm-oil pipelines on permafrost:a case study of the China-Russia Crude Oil Pipeline
- Estimating interaction between surface water and groundwater in a permafrost region of the northern Tibetan Plateau using heat tracing method
- Quantitative estimation of the influence factors on snow/ice albedo
- Spatial and temporal transferability of Degree-Day Model and Simplified Energy Balance Model:a case study
- The heterogeneity of hydrometeorological changes during the period of 1961-2016 in the source region of the Yellow River,China