
Spatial and temporal transferability of Degree-Day Model and Simplified Energy Balance Model:a case study
2020-05-31 10:50HuiLinLi
HuiLin Li
1. State Key Laboratory of Cryospheric Science, Northwest Institute of Eco-Environment and Resources, Chinese Academy of Sciences,Lanzhou,Gansu 730000,China
2.Tianshan Glaciological Station,Chinese Academy of Sciences,Lanzhou,Gansu 730000,China
ABSTRACT Glacier mass balance, the difference between accumulation and ablation at the glacier surface, is the direct reflection of the local climate regime. Under global warming, the simulation of glacier mass balance at the regional scale has attracted increasing interests.This study selects Urumqi Glacier No. 1 as the testbed for examining the transferability in space and time of two commonly used glacier mass balance simulation models: i.e., the Degree-Day Model (DDM) and the simplified Energy Balance Model (sEBM). Four experiments were carried out for assessing both models' temporal and spatial transferability.The results show that the spatial transferability of both the DDM and sEBM is strong,whereas the temporal transferability of the DDM is relatively weak.For all four experiments,the overall simulation effect of the sEBM is better than that of the DDM.At the zone around Equilibrium Line Altitude (ELA), the DDM performed better than the sEBM.Also, the accuracy of parameters, including the lapse rate of air temperature and vertical gradient of precipitation at the glacier surface,is of great significance for improving the spatial transferability of both models.
Keywords: Degree-Day Model; Simplified Energy Balance Model; temporal and spatical transferability; Urumqi Glacier No.1
1 Introduction
Glacier mass balance, defined as the net difference between the accumulation and ablation of glaciers,is the most direct response of glaciers to climate change. It is also one of the main factors influencing the advance or retreat of glaciers. Knowledge of the changes in the glacier mass balance at the regional scale is of great significance for understanding the spatial and temporal distribution of water resources and the process of water cycling. Model simulation is one of the primary means of obtaining glacier mass balance on the regional scale. At present, there are mainly three types of glacier mass balance models,i.e., the Degree-Day Model (DDM), the Simplified Energy Balance Model (sEBM), and the full-component Energy Balance Model (EBM), ranked with increasing complexity. Because of the many input parameters, complicated calculation, and time demand,the EBM is mostly used for mass balance simulation and energy quality analysis at specific locations on individual glaciers (Azamet al., 2014; Giesenet al.,2014). The DDM and sEBM have been widely used in watersheds,regions,or even on larger spatial scales(Gaoet al., 2010; Gaoet al., 2011; Giesen and Oer-lemans,2012;Huss and Hock,2018).
The terminology "spatial-temporal transferability"of a model means that the model and parameters calibrated on an object in a certain period can be directly applied to other objects at different times to yield reliable simulation results. For the mass balance model,the spatial-temporal transferability is an important indicator of whether the simulation can be extended from "point" to "surface" (e.g., from "single glacier"to "flow" or "regional scale"), or from "known" to"unknown"(e.g.,from"current"to"future"or"past").Although the DDM and sEBM have the potential to be used in a watershed or regional scale, both contain empirical parameters, which increase the possibility that the simulation results deviate from the actual values when they are generalized to different times and locations.There are very limited studies of the spatialtemporal transferability of these two models(Macdougallet al.,2011).A previous study discussed the transferability of the DDM and sEBM based on the observed mass balance data of Urumqi Glacier No.1(referred to as UG1 hereafter) (Liet al., 2017). However, the data series used was quite short, and the algorithm itself was imperfect.
This study presents a detailed case study on the spatial-temporal transferability of the DDM and sEBM by using UG1 as the testbed, as it is the one with the most abundant and systematic observation in China. Four experiments were set up to simulate the mass balance of the east and west branches of UG1 by both models.This study aims to analyze the spatial and temporal transferability of the two models on the continental and sub-continental glaciers in China. It discusses the problems arising from the application of these two models and makes recommendations for improving their transferability. The study provides a valuable reference for the development of glacial mass balance simulation at the regional scale.
2 Study site and dataset
2.1 Overview of the study area
UG1 (43°06′N,86°49′E),the source of the Urumqi River, is located on the northern slope of the Karaucheng Mountains in the central Tianshan Mountains and 120 km from Urumqi. Figure 1 depicts the topography and mass balance observation network. It is a typical cirque valley glacier facing the northeast. According to a GPS survey conducted in 2012, the east branch, with an area of 1.02 km2, was about twice as large as the west (0.57 km2), and the glacier's highest and lowest elevations were 4,484 m, and 3,760 m, respectively. Most of the glacier surface was debrisfree. UG1 is a summer-accumulation type glacier,with 90% of the annual precipitation occurring at the highest frequency in the forms of wet snow, hail, and maggots concentrated in May through September(Wang and Zhang, 1985). This period is also accompanied by high air temperature and intense glacier melting.According to observation data collected since 2000,the equilibrium line altitude(ELA)of UG1 fluctuated between 4,050 m and 4,250 m,and the ablation at the snout of the glacier was quite strong.The maximum negative value of the mass balance was around-4,000 mm/a.
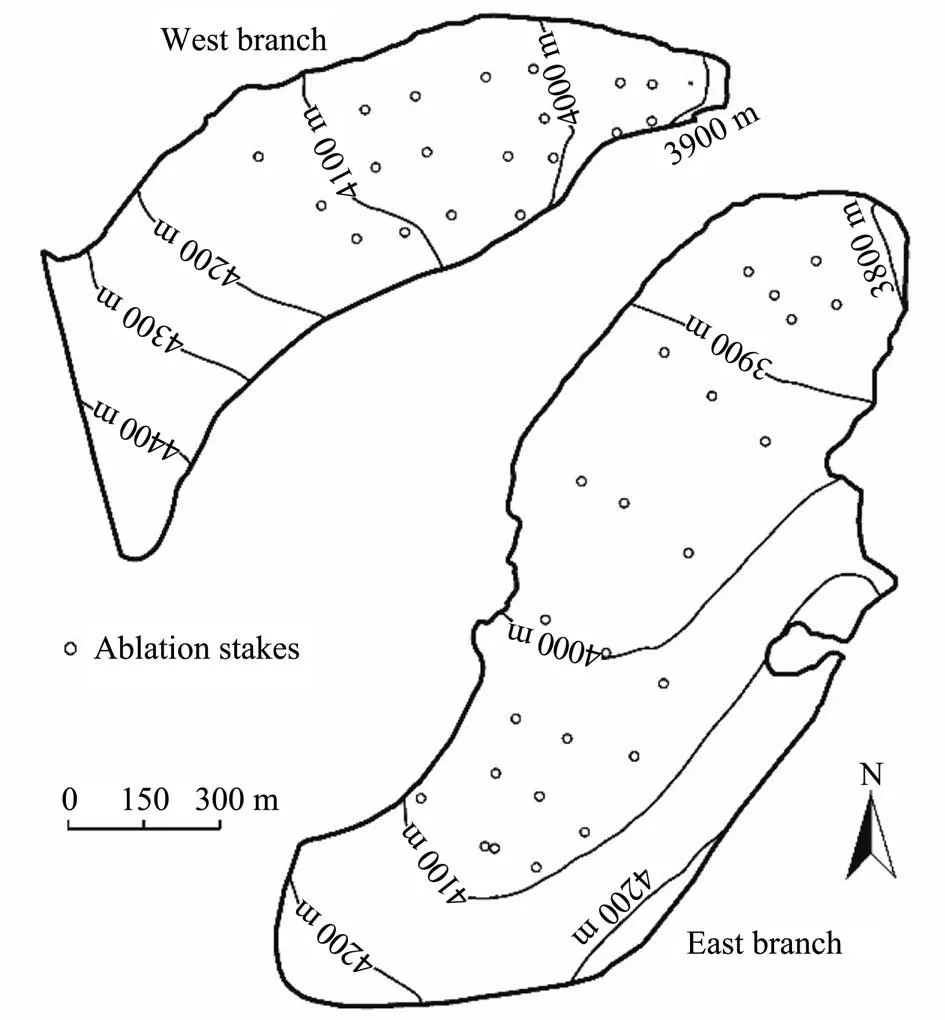
Figure 1 Topography and mass balance observational network of UG1
2.2 Datasets
The observed mass balance data from 2001 to 2018 was selected for parameter calibration and model verification. All mass balance data were obtained using the traditional glaciological method (i.e., the stake/snowpit method) (Xie, 2010). On average, 23 stakes/snowpits were set up on the surface of the east branch and 18 stakes/snowpits for the west. The principle was to distribute them as evenly as possible on the surface of the glacier (Figure 1). Observation results show that, from 2001 to 2018, the mass balance at the snout of the glacier was between -2,000 mm/a and -4,000 mm/a, indicating a strong ablation. The outlines and digital elevation models (DEM) of UG1 used in the simulations as boundary conditions were surveyed by GPS or 3D terrestrial laser scanning in 2001, 2006, 2012, and 2018, respectively. Meteorological data obtained from the Daxigou Meteorological Station (3 km from the snout of UG1) was used as the model force.
3 Methodology
3.1 Degree-Day Model
The DDM is a temperature index model.The model consists of two simple modules,i.e., Equations(1)and(3), for calculating the snow and ice melting and accumulation, respectively (Braithwaite and Olesen,1989; Braithwaite and Zhang, 2000). The model inputs include only temperature and precipitation.

wheremis the ablation of ice and snow,DDFis the degree-day factor(mm/(d·°C))for glacier ice or snow,andPDDis the accumulated positive temperature.

whereTa(°C) is the daily average temperature. Only the contribution of solid precipitation is taken into account in the calculation of glacial accumulationC. In this study, the critical temperature of 0 °C and 2 °C was used to distinguish between solid and liquid precipitation as in Equation(3).
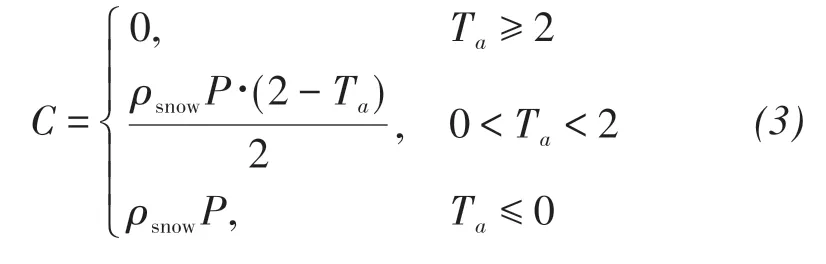
whereρsnowis the density of fresh snow, andPis the amount of precipitation.Glacier mass balanceBis calculated by integrating Equations(1)and(3)and considering the refreezing of meltwater(r)by:

3.2 Simplified Energy Balance Model
The energy balance in terms of the physical processes of energy transfer at the glacier surface-air interface can be expressed as:

whereQSRis the net short-wave radiation,QLRthe net long-wave radiation,QHthe sensible heat flux,QLthe latent heat flux,QGthe ground heat flux (i.e., the heat change of a vertical column from the surface to the depth at which vertical heat transfer is negligible),QRthe sensible heat flux supplied by rain, andQMthe energy consumed by melting.QHandQLare referred to as turbulent heat fluxes, whileQRis always ignored in energy balance models.As commonly defined in glaciology,a positive sign indicates an energy gain to the surface,a negative sign an energy loss.
All components except for short-wave radiation,including the long-wave radiation, sensible heat, and latent heat in the energy balance equation (Equation(5)), are related to the temperature or its gradient of air and/or ice. Therefore, the energy balance equation can be simplified as follows(Oerlemans,2001):

whereGis the total daily radiation, andαthe albedo of the snow and ice surface. The left end of Equation(6)is the sum of the energy received by the glacier,while the first term on the right end is the short-wave radiant energy. The second termQTon the right end represents all temperature-dependent energy budgets and can be represented as a function ofTa:

wherec0is related to the altitudeΓand can be evaluated as follows:

c01,c02,c1, andc2are energy coefficients depending only on temperature and, therefore, also referred to as temperature parameters orTPsfor short. The amount of energy introduced into the glacier can be assessed by the following formula:
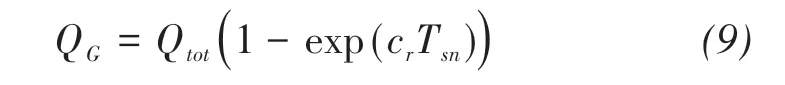
whereQtotis the total income energy (i.e.,G(1-α)+QT),Tsnis the average temperature of the glacier surface, andcris a parameter describing the rate of runoff generation. WithQMobtained by Equations(6)-(9),the ablation amount m can be evaluated as:
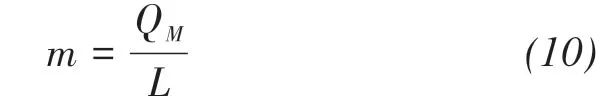
whereLis the latent heat of ice melting. The same method as that in theDDFcan be used to calculate the accumulation and mass balance (refer to Equations(3)and(4)).
3.3 Framework for assessing model transferability
Figure 2 depicts the overall framework for the assessment of the spatial and temporal transferability of DDM and sEBM.A total of four experiments were designed for assessing the transferability of the DDM and sEBM by using data from the east and west branches of UG1. Experiments 1 and 2 were for the DDM. In Experiment 1, the parameters of the DDM were calibrated using the observed data of the east branch from 2001 to 2005. The calibrated parameters were then applied to simulate the mass balance of the west branch from 2001 to 2005 by the DDM. The DDM is deemed spatially transferable if the simulated results match well with the observed data from the west branch. In Experiment 2, the model calibration was the same as Experiment 1.The calibrated parameters were then applied to simulate the mass balance of the same branch from 2006 to 2018. If the simulated results match well with the observed data, then the model parameters did not change significantly with time, even if the geometry of the glacier surface and the climatic conditions changed over time, and the DDM is deemed temporally transferable. Experiments 3 and 4, similar to Experiments 1 and 2, respectively,were designed for assessing the transferability of the sEBM.
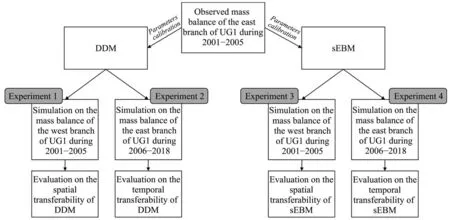
Figure 2 Schematics of the framework for assessing model temporal and spatial transferability
4 Results
4.1 Mass balance simulation by DDM
The parameters of the DDM were calibrated using observed annual mass balance data of the east branch from 2001 to 2005, as listed in Table 1, for assessing its temporal (Experiment 1) and spatial (Experiment 2)transferability.
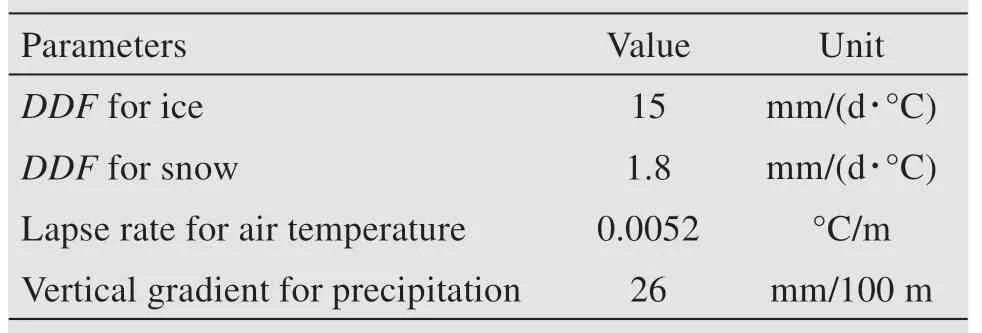
Table 1 Calibrated model parameters of the DDM
(1) Mass balance simulation—West branch(Experiment 1)
The DDM and the calibrated parameters in Table 1 were used to simulate the mass balance at the observation sites on the west branch from 2001 to 2005, and the results are presented in Figures 3a-3e.According to the observed data, the ELA fluctuated between 4,100 and 4,200 m a.s.l.from 2001 through 2005.The mass balance increased rapidly as the altitude rises from the glacier snout to the ELA; above the ELA, it was relatively stable. The simulated mass balance results can reproduce the above characteristics. Compared with the measured mass balance data,the simulation results for 2003 were generally higher, and that for 2004 were generally lower. The RMSE of the simulated and measured data fell between 409 and 596 mm w.e. with a mean of 470 mm w.e. for 2001 through 2005. The correlation analysis results shown in Figure 3f indicate that the simulation results can explain 82% of the change in the measured data (R2=0.820,P<0.01).The slope of the trend line is 0.96,indicating that the model slightly underpredicts the observed mass balance.
(2) Mass balance simulation—East branch(Experiment 2)
Similarly, the calibrated parameters in Table 1 were used to simulate the mass balance at each stake or altitude of the east branch from 2006 through 2018, and the results are shown in Figures 4a-4e.Only the annual average results are illustrated in Figure 4 for clarity.According to the observed data, the ELA of the east branch remained consistently higher than 3,980 m in this period. The mass balance at the snout of the east branch varied from around -2,000 mm/a (2014, 2017)to -4,000 mm/a (2016). The simulated data can reproduce the spatial and temporal changes in the observed data, though generally, the simulated data is smaller than the observed. From 2006 through 2018, the RMSE of the simulated and measured data were between 427 mm w.e.and 1,300 mm w.e.with an average value of 640 mm w.e. and a correlation coefficientRgreater than 0.77 (Figure 4c;R2= 0.599,P<0.01).The trend line for the scatter plot in Figure 4c has a slope of 0.85, indicating that the DDM moderately underpredicts the observed mass balance.In general,the simulation effect of Experiment 2 is not as good as that of Experiment 1, and the systematic deviation between the simulated and the measured data is relatively higher.
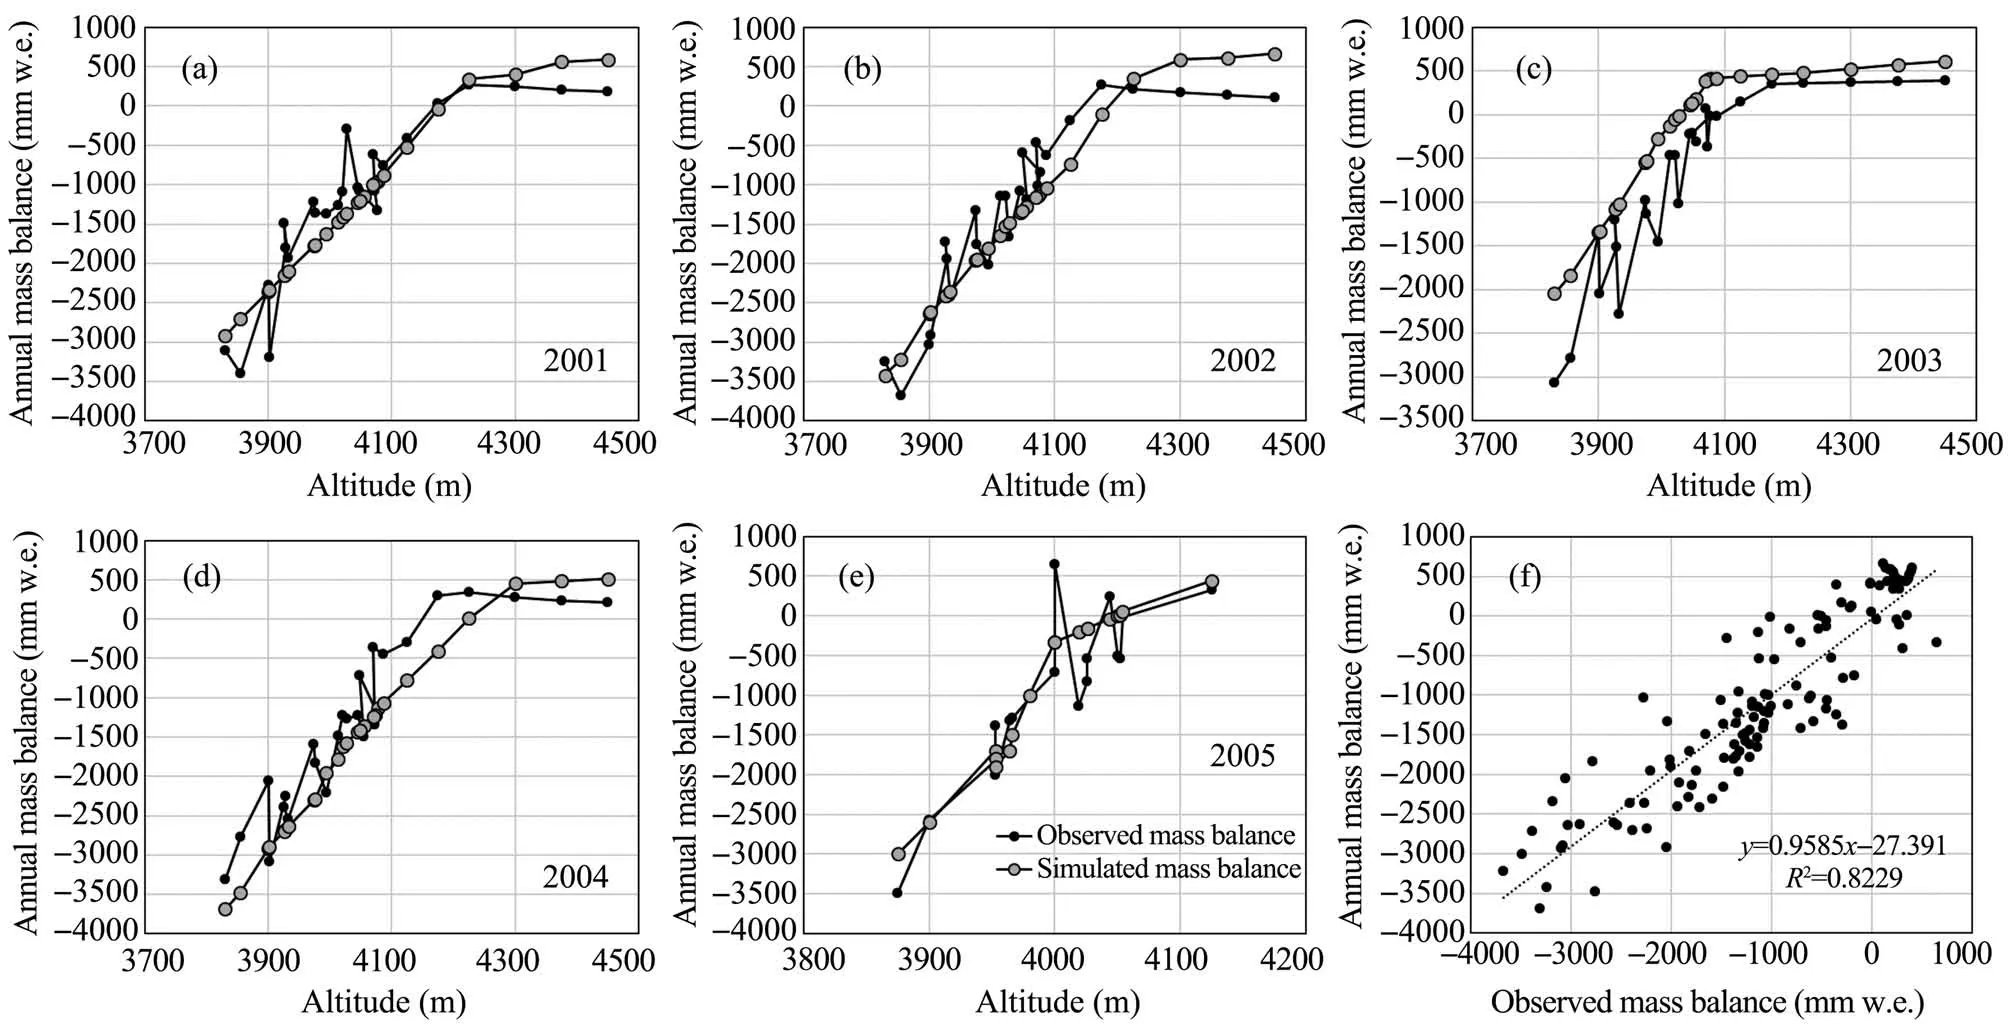
Figure 3 (a-e)Comparison between the observed and DDM-simulated mass balance of the west branch from 2001 through 2005;(f)Correlation between the observed and simulated data
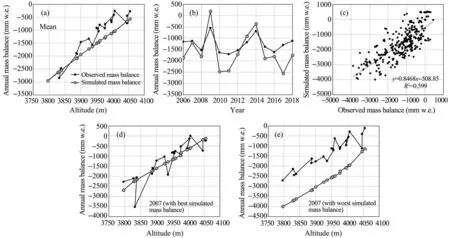
Figure 4 Comparison between the observed and DDM-simulated mass balance of the east branch from 2006 through 2018:(a)at each stake or altitude;(b)for each year;(c)correlation for the data in the entire period;(d)for 2007 when the simulated annual mass balance was the closest to the observed;and(e)for 2017 when the discrepancy between the simulated and observed was the highest
4.2 Mass balance simulation by sEBM
The model parameters of the sEBM were calibrated by using the observed data of the east branch from 2001 through 2005, as listed in Table 1, for assessing its temporal (Experiment 3) and spatial (Experiment 4)transferability.
(1) Mass balance simulation—West branch(Experiment 3)
The sEBM and the calibrated parameters in Table 2 were used to simulate the mass balance of the west branch from 2001 through 2005, and the results are shown in Figures 5a-5e. For the entire period, the simulated results reproduce the trend of change in the measured data well.The RMSE of the simulated and measured data varied from 429 mm w.e. to 605 mm w.e. with an averaged value of 496 mm w.e.The correlation analysis results as shown in Figure 5f indicate that the simulation results can explain 83% of the change in the measured data (R2= 0.830,P<0.01).The slope of the trend line is 1.065, implying a slight overprediction by the sEBM. TheR2(0.830) of the sEMB is slightly higher than that of the DDM (0.820), indicating a little better or almost the same performance of the sEBM than that of the DDM(Experiment 1).(2) Mass balance simulation-East branch(Experiment 4)
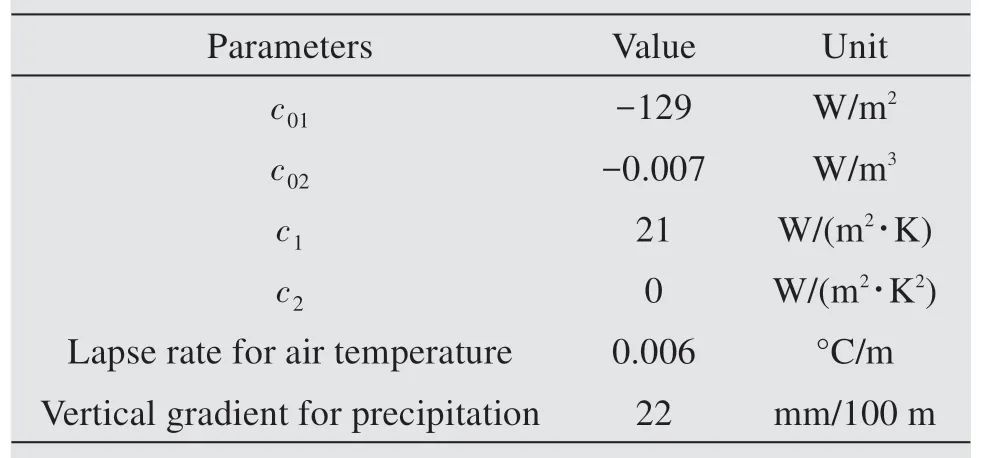
Table 2 Calibrated model parameters of the sEBM
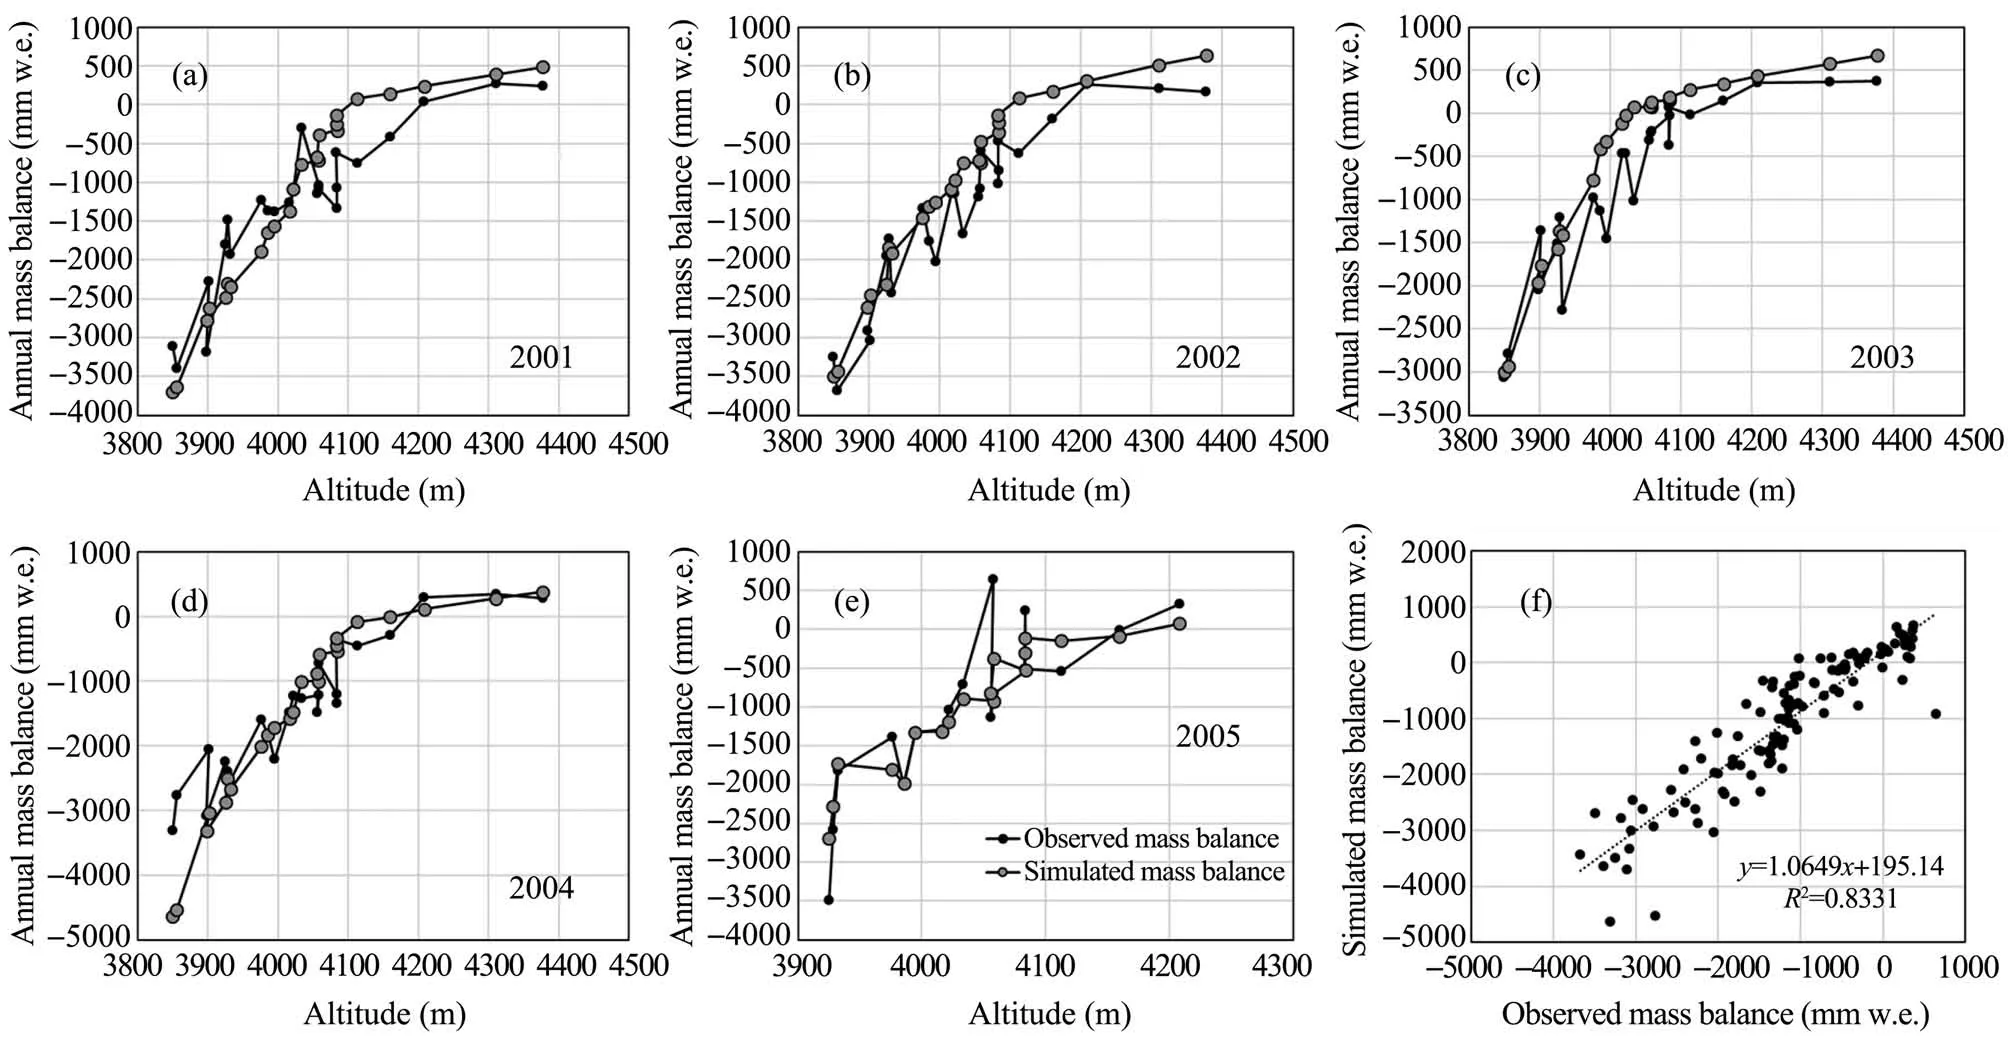
Figure 5 (a-e)Comparison between the observed and sEBM-simulated mass balance at each stake of the west branch from 2001 through 2005;(f)Correlation between the observed and simulated mass balance
The calibrated parameters in Table 2 were used to simulate the mass balance of the east branch from 2006 through 2018, and the results are shown in Figures 6a-6e. The simulated mass balance is in good agreement with the observed data. For 2006 through 2018, the RMSE of the simulated and measured data at each stake varied between 462 mm w.e. and 927 mm w.e. with an average value of 633 mm w.e. and a correlation coefficientRlarger than 0.8 (Figure 6c;R2= 0.695,P<0.01).The trend line of the scatter plot has a slope of 0.9755, indicating a slight underprediction by the sEMB. TheR2(0.6953) in this experiment is considerably higher than that of the DDM (0.599)(Experiment 2), indicating a better performance of the sEMB than the DDM.
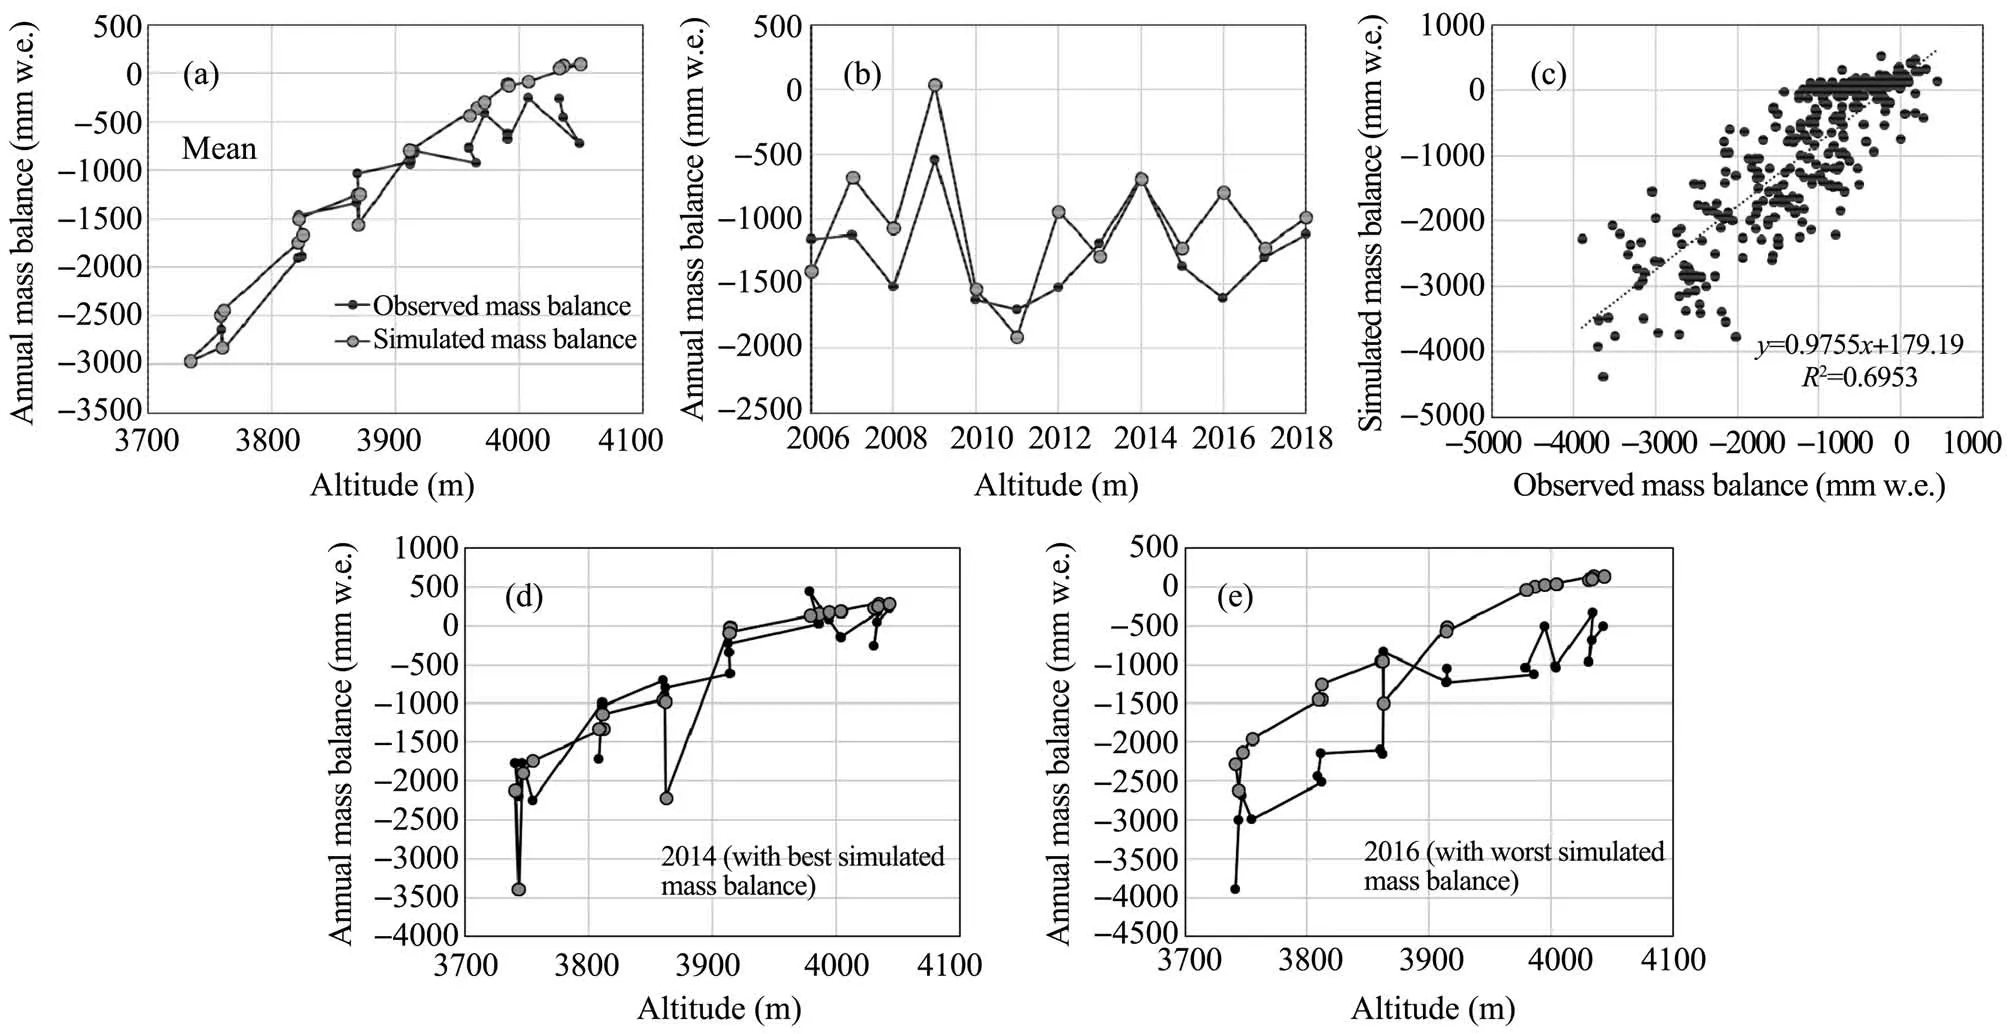
Figure 6 Comparison between the observed and sEBM-simulated mass balance of the east branch from 2006 through 2018:(a)at each stake or altitude;(b)for each year;(c)correlation for the data in the entire period;(d)for 2014 when the simulated annual mass balance was the closest to the observed;and(e)for 2016 when the discrepancy between the simulated and observed was the highest
5 Discussions
5.1 Evaluation of spatial and temporal transferability
The stability of the simulation error when space or time changes provides an assessment of the spatial and temporal transferability of a model. The unsatisfactory simulation results in the east branch (refer to Figure 4c) indicate a weak temporal transferability of the DDM. The linear relationships between the measured data and the simulated data for all simulation experiments (i.e.,y= ax+ b) were obtained from correlation analyses (refer to Figures 3f, 4c, 5f, and 6c).According to those linear equations,the simulation errorErrcan be calculated according to the following formula:

wherexandyrefer to the observed and simulated mass balance, respectively, andaandbare regression constants depending on each experiment.
Figures 7a and 7b show the possible simulation error, including both absolute and relative errors, per Equation(10)for mass balance ranging from -5,000 to 1,000 mm/a.According to the results, the absoluteerror line corresponding to Experiment 2, as shown in Figure 7a, has the largest slope, indicating that the error would increase rapidly with the increase of the observed mass balance and hence a weak temporal transferability of the DDM. The same conclusion can be made from the relative error shown in Figure 7b. The slopes of the absolute-error lines corresponding to Experiments 1 and 3 (Figure 7a) are lower, and both are close toy= 0. These results show that both the DDM and sEBM have good spatial transferability, and the simulation effect of the DDM is slightly better than that of the sEBM.The error line corresponding to Experiment 4 is closer toy= 0 than that of Experiment 2, indicating that the temporal transferability of the sEBM is significantly better than that of the DDM.
Besides, it can be found that when simulating the mass balance near the ELA, only the DDM can produce satisfactory results when the period of the observed data for parameter calibration is similar to that for simulation. Conversely, there is a high possibility for the sEBM to yield large errors near the ELA, regardless of how the period of the observed data is selected for parameter calibration.
5.2 Factors affecting model spatial and temporal transferability
The DDM itself has no special requirements on the climatic background and the glacier types. It can theoretically simulate the glacier mass balance in various time and space. There are four empirical parameters in the model,i.e.,DDFsof ice and snow, lapse rate for air temperature, and vertical gradient of pre-cipitation, which need to be calibrated by the observed data.As theDDFreflects the proportion of various components in the energy balance at a glacier surface, any change in the meteorological elements will result in its variation.Therefore,it is difficult to evaluate whether the set ofDDFscalibrated from data of a specific time and location can be extended to a different time and space. Under the assumptions of annual variation in theDDF(i.e.,ignoring daily and seasonal variations of theDDF) and the air temperature to be simulated being in the same range as those used for calibration and only the effects of short-wave radiation and air temperature considered, one can presume that the DDM would not introduce significant errors by using the same set ofDDFsin different times or locations.That is to say that the change inDDFwill not affect the spatial and temporal transferability of the model. Regarding the other two empirical parameters,i.e.,lapse rate for air temperature and vertical gradient of precipitation, the local topography is an important influencing factor. Since little change is expected to occur in the local terrain of the same glacier in a short period, these two parameters would only impact the model's spatial transferability.
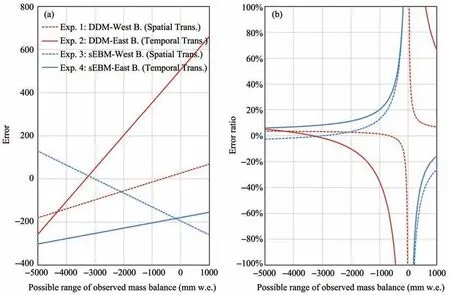
Figure 7 Error analyses for all four experiments in this study:(a)absolute error,and(b)relative error
Theoretically, the sEBM is applicable to various space and time conditions. Compared with the DDM,this model has a more explicit physical base. Parameters that need to be calibrated includeTPs (c01,c02,c1,andc2in Equations(6)and(7)), albedo, temperature lapse rate, and vertical gradient of precipitation. As the sEBM accounts for the energy contributed by the short-wave radiation and temperature-related components separately,theTPs are not affected by solar radiation and changes in albedo. TheTPs describe the relationship between the temperature and the three energy components, including long-wave radiation, sensible heat, and latent heat, with the long-wave radiation being dominant. Once the glacier surface melts, the temperature of the glacier surface remains constant at 0°C,resulting in a relatively stable outgoing long-wave.The incident long-wave is related to the atmosphere and ambient temperature. Therefore, the relationship between the temperature and the sum of the long-wave radiation, sensible heat, and latent heat can be deemed as relatively stable, implying that the value ofTPsis not affected by air temperature and is relatively stable as well in the ablation season.For the same reason discussed during the analysis of the spatial transferability of the DDM, the temperature lapse rate and vertical gradient of precipitation also have important effects on the spatial transferability of sEBM.
The temporal transferability of the DDM generally depends on the air temperature range in the simulation period. In contrast, its spatial transferability not only depends on the air temperature range but also on the accuracy of parameters, including the lapse rate of air temperature and vertical gradient of precipitation.However,the temporal transferability of the sEBM is hardly affected by parameter changes.Theoretically,this model can be used to reconstruct or predict the mass bal-ance of an individual glacier, as long as its parameters are calibrated by the observed data from the same glacier in a given period. Both Figures 6 and 7 demonstrate that the sEBM has good temporal transferability.The spatial transferability of the sEBM is only related to the air temperature lapse rate and vertical gradient of precipitation. Thus, the accuracy of the air temperature lapse rate and vertical gradient of precipitation is a key precondition for reliable extension of the DDM and sEBM to different times and locations.
In this study, the measured mass balance data from the east and west branches of UG1 from 2001 through 2018 were used for parameter calibration and model verification. It is important to recognize the limitations on the results as only data of limited time from UG1 was used, and error exists in the observed data. In addition, four DEM datasets were used to extract the coordinates of the stakes for mass balance observation in each year, which likely introduced systematic errors into the simulation results. Even with the limitations mentioned above, there is no doubt that the results of this paper are of value for glacial mass balance simulation on a regional scale.
6 Conclusions
This paper takes Urumqi Glacier No. 1 as the testbed for assessing the temporal and spatial transferability of the DDM and sEBM commonly used for glacier mass balance analysis.Four simulation experiments using field observation data from 2001 through 2018 were conducted, and the results were statistically analyzed.The specific conclusions obtained are as follows:
(1) Both the DDM and sEBM have strong spatial transferability within the study period and have the potential to be generalized to other glaciers and other duration.
(2) The sEBM has good temporal transferability,whereas the DDM does not.
(3) The overall simulation performance of the SEBM is better than that of the DDM.
(4) When simulating the mass balance near the equilibrium line altitude, the error produced by the DDM is likely less than that by the sEBM.
Acknowledgments:
This research was supported by the Key Research Program of Frontier Sciences of Chinese Academy of Sciences(Grant No.QYZDB-SSW-SYS024)and National Natural Science Foundation of China (Grant Nos.41771081 and 41761134093).
 Sciences in Cold and Arid Regions2020年2期
- Sciences in Cold and Arid Regions的其它文章
- Thermal influence of ponding and buried warm-oil pipelines on permafrost:a case study of the China-Russia Crude Oil Pipeline
- Estimating interaction between surface water and groundwater in a permafrost region of the northern Tibetan Plateau using heat tracing method
- Quantitative estimation of the influence factors on snow/ice albedo
- The heterogeneity of hydrometeorological changes during the period of 1961-2016 in the source region of the Yellow River,China
- Distribution patterns of planted-shrubs of different restoration ages in artificial sand-fixing regions in the southeastern Tengger Desert