
Quantitative estimation of the influence factors on snow/ice albedo
2020-05-31 10:50ZhongMingGuoNingLianWangBaoShouShenZhuJunGuHongBoWuYuWeiWuAnAnChenXiJiang
ZhongMing Guo,NingLian Wang,BaoShou Shen,ZhuJun Gu,HongBo Wu,YuWei Wu,AnAn Chen,Xi Jiang
1.Shaanxi Key Laboratory of Earth Surface System and Environmental Carrying Capacity,Xi'an,Shannxi 710127,China
2. Institute of Earth Surface System and Hazards, College of Urban and Environmental Sciences, Northwest University,Xi'an,Shannxi 710127,China
3.School of Environmental Science,Nanjing Xiaozhuang University,Nanjing,Jiangsu 211171,China
4.School of History and Tourism,Shaanxi Sci-Tech University,Hanzhong,Shannxi 723000,China
5. Key Laboratory of Meteorological Disaster of Ministry of Education, Nanjing University of Information Science &Technology,Nanjing,Jiangsu 210000,China
ABSTRACT Quantitative estimation of the influence of various factors,such as black carbon,snow grain, dust content,and water content on albedo is essential in obtaining an accurate albedo. In this paper, field measurement data, including snow grain size, density, liquid water content, and snow depth was obtained. Black carbon and dust samples were collected from the snow surface. A simultaneous observation using ASD (Analytical Spectral Devices) spectral data was employed in the Qiyi glacier located on Qilian Mountain.The measurements were compared with results obtained from the Snow,Ice,and Aerosol Radiation(SNICAR)model.Additionally,a HYbrid Single-Particle Lagrangian Integrated Trajectory (HYSPLIT)air mass backward trajectory model was used to track the source of black carbon. The simulation was found to correlate well with observed data.Liquid water content was the most influential factor of albedo among the several influencing factors, followed by black carbon content and snow grain size. Finally, snow density change had the least toward albedo.HYSPLIT atmospheric trajectories model can only approximately show the source of black carbon and not clearly indicate the source region of black carbon.
Keywords:albedo;black carbon;snow grain size;quantitative estimation
1 Introduction
Aside from playing a key role in the snow/ice mass ablation process, snow/ice albedo is an important feedback factor on the close coupling of snow/ice and the climate. Snow/ice albedo is much larger than other underlying surfaces;hence,a small change in albedo could cause a significant influence on the energy balance, which would then affect the snow/ice ablation condition and ultimately result in a significant climate change. Major factors that influence albedo include black carbon,snow grain size,dust,liquid water content,and density.
Black carbon in snow/ice is an important tool in understanding the changes regarding paleoclimate and palaeoenvironment in human history (Minget al., 2005). Black carbon aerosol is an essential element of the atmospheric aerosol that could decrease the snow/ice albedo when deposited in the snow/ice.Such mechanism accelerates the ablation process of snow/ice, thereby causing global and regional climate change (Liuet al., 2006). Black carbon significantly affects the hydrological cycle because it accelerates snowpack melting and alters streamflows, which could eventually result in the occurrence of drought or flood(Qianet al.,2009).
Based on its optical properties,carbonaceous aerosol can be divided into organic carbon (OC) and element carbon (EC)/black carbon (BC). Black carbon,which is also called "soot" is a product of the incomplete combustion of biofuel (e.g., wood, dung, and crop residue), fossil fuel (e.g., petroleum, diesel, and charcoal), and open biomass burning (wild fire) (Andreae and Crutzen, 1997). The structure is commonly shown as a black particle or flocculant material condensed by a particle.
Black carbon aerosol has gradually attracted the attention of experts ever since the London smog events during the 1950s. Studies show that black carbon directly and indirectly affects climate, changes in the ozone, and presence of chemical smoke in the stratosphere, and that it takes part in global biogeochemical cycles. Such findings encouraged scientists to conduct more extensive research regarding black carbon (Menonet al., 2002; Wuet al., 2005). Research on black carbon in snow/ice and on snow grain size started during the 1980s. Although non-domestic research on black carbon and snow grain size have made great progress, domestic research is still at the beginning stage. Both the aerosol generated by sand and dust weather processes and human activity, and soot material accumulated on the surface caused by the snow/ice melting, can contribute to the variation of snow/ice albedo. The reflectance of contaminated snow/ice is reduced depending on the increase of debris and dust content despite the difference between contamination and snow/ice properties (Bai and Tetsuo, 1989). Wiscombe and Warren (1980a) found that a concentration of 15 μg/kg of black carbon in snow may reduce snow albedo by about 1%. The contrast test performed by Conwayet al.(1996) showed that a concentration of 500 µg/kg of soot on the snow surface may decrease the albedo by about 30%. Lightet al. (1998) demonstrated that 150 μg/kg of black carbon embedded in sea ice could reduce the albedo of sea ice by about 30% at its maximum. Hansen and Nazarenko (2004) estimated the effect of soot on snow and ice albedos (1.5% in the Arctic and 3% in Northern Hemisphere land areas) that would yield a climate forcing of +0.3 W/m2in the Northern Hemisphere.The"efficacy"of this forcing is about 2,i.e.,a given forcing is twice as effective as CO2in altering global surface air temperature. Fujita (2007) found out through sensitivity analysis of the effect of dust event timing on the Tibetan glacier runoff that the lowering of surface albedo due to the appearance of the dust layer leads to a drastic increase in glacier runoff even under the same meteorological conditions.The rough estimation made by Minget al.(2009) for reduced albedos in certain glaciers in west China suggested that black carbon deposited on the surface may accelerate the melting of these glaciers, and that the reduced albedos of certain glaciers that were severely contaminated by black carbon on their surfaces exceeded 5%due to the black carbon deposits.
Snow grain size is the main parameter influencing broadband albedo, so it plays a key role in the Earth radiation balance as well (Caoet al., 2006). Wiscombe and Warren (1980b) indicated that a decrease in spectral reflectance corresponds with an increase in snow grain size. Roughly stated, a photon has a chance to be scattered (or a ray to be bent) when it crosses an air-ice interface. The albedo of new snow is at its maximum. However, as time passes, new snow will experience firnification accompanied by continuous crystal particle deformation and densification. The increase in snow grain size and contamination would then lead to an incessant decrease in albedo, which consequently reduces the albedo of new snow, old snow, firn, glacier ice, and contaminated glacier ice (Jiang, 2006). Currently, several studies have focused mainly on using the relationship between snow grain size and albedo to retrieve snow grain size (e.g., Lyapustinet al., 1976; Dozier and Marks, 1987; Hyvärinen and Lammasniemi, 1987;Nolin and Dozier, 1993, 2000; Jinet al., 2008),among which several researchers have established the influence of surface grain size on albedo (e.g., Wiscombe and Warren, 1980b; Warren, 1982; Marshall and Oglesby, 1994; Wang and Zeng, 2008; Lee and Liou, 2012). However, quantitative estimations of the effects the snow grain size on albedo remain scarce.
Quantitative estimation of the influence of various factors, such as black carbon, snow grain, dust content,and liquid water content,on albedo is essential in obtaining an accurate albedo. In this paper, field measurement data, including snow grain size, density, water content, and snow depth was obtained. Black carbon and dust samples were collected from the snow surface.A simultaneous observation using ASD (Analytical Spectral Devices) spectral data was employed in the Qiyi glacier located on Qilian Mountain. The measured spectral reflectance was then verified, and the daily variation of the characteristics of the albedo were analyzed. The measurements were compared with results obtained from the SNICAR model, and the simulation was found to correlate well with the observed data. However, the simulated albedo may be about a factor of 0.96 higher than the measured albedo, so the other factors were assumed to be constant using the SNICAR model to estimate the influence of black carbon and snow grain size on albedo. Field measurements were controlled to fit the relationship between the single factor and snow/ice albedo in order to quantitatively estimate the influence of these factors on the snow/ice albedo.Additionally, a Hybrid Single-Particle Lagrangian Integrated Trajectory air mass backward trajectory model was used to track the source of black carbon.
2 Study area
Qiyi Glacier (39°14.22′N, 97°45.34′E, numbered 5Y437C18) is located in the Tuolai Range of the Qilian Mountains(Figure 1).Its melt water feeds into the Liugouquan Creek, which is a tributary of the Beida River (Puet al.,2005).This glacier was the first to be subjected to modern Chinese glaciological studies in 1958 (Snow and Ice Research Team of Chinese Academy of Sciences, 1958), and its name, Qiyi Glacier(literally,July 1st Glacier),commemorates the day the Chinese glaciologists climbed the glacier. The glacier is a cirque-valley glacier classified as a sub-continental type based on its physical properties. Digital stereophotogrammetry determined the area of the Qiyi Glacier to be 2.817 km2and its length to be 3.8 km in 1975.Its terminus altitude was 4,304 m a.s.l.,whereas its summit altitude was 5,158.8 m a.s.l..
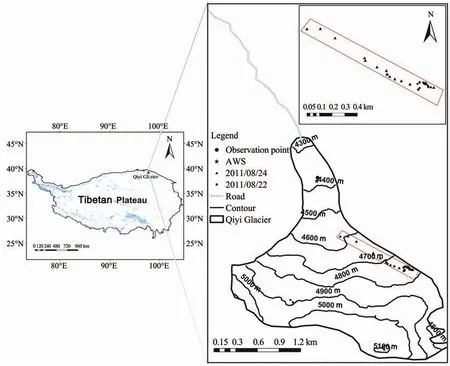
Figure 1 Locations of the Qiyi Glacier and the sampling sites
Primary observation was performed from a single-point and sampling was carried out on the surface of the Qiyi Glacier. The relatively flat and wide observation point (39°14.921′N, 97°45.215′E, 4,401 m in height) was located near the Automatic Weather Station (AWS); hence, the temperature data can be used to estimate the influence of temperature on the snow grain size. Surface observations, which were repeated twice, revealed an increase from 4,760 m a.s.l.to 4,787 m a.s.l. and 4,602 m a.s.l. to 4,896 m a.s.l..A total of 32 points were measured and sampled.
3 Methods and data
3.1 Black carbon sample collection and analysis
The snow samples for measurement of black carbon were collected from the surface layer and kept frozen until analysis. Black carbon in the snow manifested a ng/g magnitude order (Hansen and Nazarenko, 2004), approximately 100-200 g of snow sample in common.
The procedure for sample preparation involves snow melting and filtering. The samples were melted at a certain temperature in a class 100 cleanroom.An ultrasonic wave concussion container was used to shake the sample for about 10-15 minutes in order to reduce the residual sample in the sample bottle/bag.The sample was weighed and then filtered using a stainless steel unit(volume 400 mL)(Xuet al.,2006),which can prevent the inner surface of the container from absorbing the particles in the sample. Pre-fired quartz fiber filters (Whatman Quartz Filters QMA,47 mm) were used for analysis. Each 4.7 cm filter was cut into six smaller pieces measuring 1.5 cm in diameter. After being cut from the large filter, the smaller pieces were then heated in an oxygen stream for 5 h in a tube oven (800 °C) to minimize possible contamination (Xuet al., 2009). The filter efficiency of this method is approximately 95% (Chýleket al.,1987; Cachier and Pertuisot, 1994; Lavanchyet al.,1999a). This resulted in a circle with a diameter of 1.0 cm on each of the quartz fiber filters, which were dried in the class 100 clean table. To avoid possible positive black carbon artifacts, carbonates were removed prior to analysis by dripping 50 mL of 0.1 mol/L HCl into the sample spot three times, as suggested by Lavanchyet al.(1999b). Black carbon content in the filter was analyzed using a Desert Research Institute Model 2001 Thermal/Optical Carbon Analyzer (Atmoslytic Inc., Calabasas, California). The reliability of this analysis system was verified through the comparative study of the carbonaceous aerosol test method(Schmidet al.,2001).The measure theory and procedure of analysis of black carbon were provided by previous literature (Caoet al., 2003; Chowet al.,2004; Minget al., 2005; Wanget al., 2010). Surface snow samples were collected using a shovel at a fixed point and on the glacier surface on September 15 and August 22 and 24 in 2011.
3.2 Measuring snow grain size
The snow grain sizes were measured using a handheld lens with a scale on the surface of the snow. The accurate calculation of the single scattering properties of a snow grain can be a challenge because of the complexity of each particle shape. Mugnai and Wiscombe (1987) demonstrated that a collection of unoriented non-spheroids produce the same scattering results as spheres.Grenfellet al.(1999)showed that the radius of a non-spherical particle was equal to that of a spherical particle that has the same volume-to-surface-area (V/A) ratio. V/A ratio was used to transfer the measured snow grain size into an optical grain size.On this basis of field measurements,two assumptions are proposed: 1) The snow particle is an inequilateral spheroid; and 2) The major axis, minor axis,and height of the inequilateral spheroid is denoted bya,b, andc, respectively, in such a way that the relationshipa= 2b= 3cexists. Therefore, the optical grain size can be calculated using the following equation(Hao,2009):
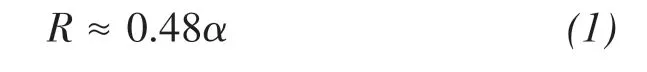
Equation(1)was employed to calculate the optical snow grain size on September 15, 2011. To avoid random error and to evaluate the accuracy of the data,the mean snow grain and its standard deviation was calculated at 30-minute intervals(Figure 2).
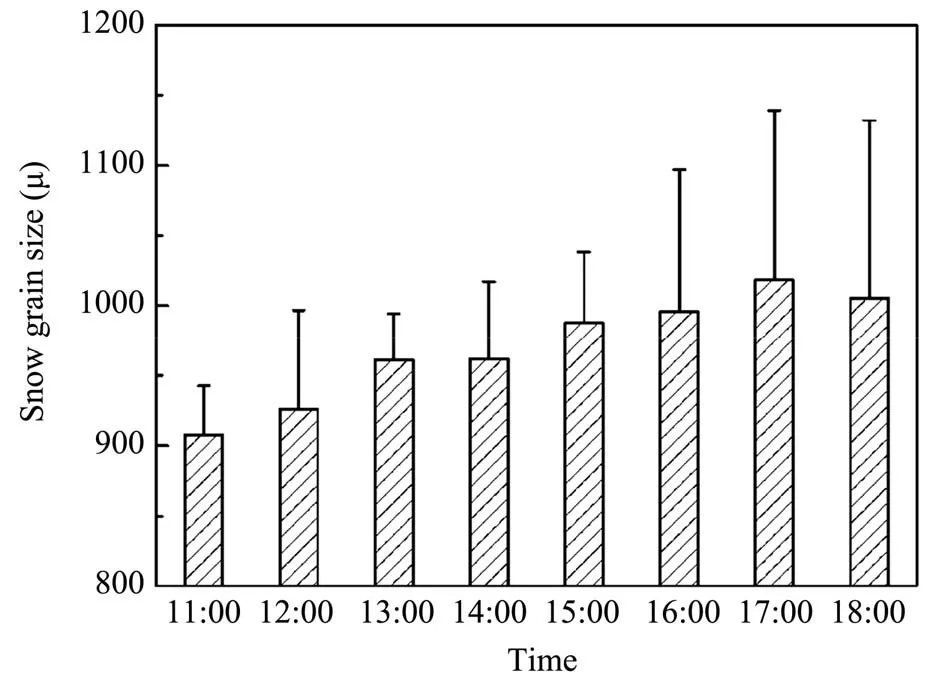
Figure 2 Mean snow grain size on September 15,2011 at 30 min intervals.The error bars represent±one standard deviation from the mean
3.3 Observing the spectrum data
Spectrum data were observed using the Analytical Spectral Devices (ASD) Spectroradiometers Field-Spec Pro (United States). The FieldSpec Pro can quickly scan surface features which may be obtained by the fibre-optics probe in milliseconds. It offers superior signal-enhancing features and a high resolution with a 350-2,500 nm spectral range. Sampling time can be as quick as 10 times/s and wavelength accuracy is ±1 nm. FieldSpec Spectroradiometer is a general-purpose spectrometer useful in for several applications in areas requiring the measurement of reflectance, transmittance, radiance, or irradiance. Surface observation was performed at 10:00-14:00 on August 22 and 24 in 2011 to reduce the influence of the solar altitude angle, whereas point observation was implemented at 11:00-17:00 on September 15,2011 to analyze the daily changes in albedo features.The spectrograph sensor probe was positioned perpendicular to the snow surface at a distance 0.3 m from the snow surface.At least three spectrums were collected at every point, which were then used to calculate the mean value at each point. The locations of the sampling sites are presented in Figure 1.
3.4 Measuring dust content, snow depth, density,and liquid snow water content data
The snow samples for measuring dust content were obtained from the snow surface at a depth of 1 cm;about 35 snow samples was collected.Dust content on the snow surface was analyzed using a Beckman Multizier 3 Particle Counter (Beckman Coulter,Inc., United States).The Coulter Principle is the leading technology in high resolution and accuracy, which is further enhanced in the Multisizer 3 by using a Digital Pulse Processor. This instrument provides number, volume, mass, and surface area size distributions in one measurement, with an overall sizing range of 0.4 µm to 1,200 µm. Moreover, the snow depth was measured near the observation point by digging a snow pit.
Snow density and content was measured using the snow fork (radio wave sensor) developed by the Helsinki University of Technology (Finland). The snow fork is based on the measurement of the dielectric properties (real and imaginary part) of snow around 1 GHz(Tiuri and Sihvola,1986).The snow fork is explicitly designed for field use; it is light, quick, and easy to use. It is designed to operate under extreme conditions, ranging from rainy weather to as low as 40°C below zero.
4 Results and discussion
4.1 Verifying the measured spectral reflectance
In processing the Fieldspc 3 spectrum data (Vane and Goetz, 1988), the solar zenith angle, azimuth angle, and atmospheric condition during the observation time are needed to conduct atmospheric correction (Liet al., 2011) and topographical correction. Then, the surface features reflectance is calculated using the ratio between the surface features spectrum and the reference white board,such as:

whereRs(λ) andRw(λ) is the reflectance of the surface features and the reference white board, respectively;Ds(λ) andDw(λ) is the radiance of the surface features and the reference white board, respectively; andλis the central wavelength of the spectrum sample site.
The response function of the Landsat data is then employed in order to convert the ASD spectrum data into albedo. The reflectance of surface features corresponding to every wavelength can be calculated using Equation(2). However, the unit of measure of the Landsat data is band. Therefore, in order to compare results,the reflectance of wavelength must be translated into the reflectance of band; the formula for which is as follows:
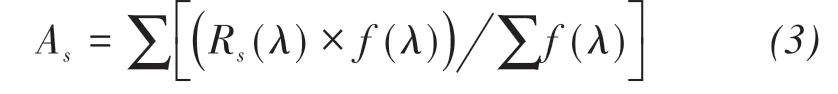
whereAsis the albedo andf(λ) is the band response function of the Landsant.
The Landsat image taken on August 22 and 24 in 2011 cannot be downloaded because of the temporal resolution of the Landsat sensor. Hence, the Landsat image taken on August 25, 2011 was used as an alternative in retrieving the albedo. The acquisition flow of the Landsat TM/ETM+ albedo can be described in three steps: 1) radiometric calibration, which is the conversion of the digital numbers of 8-bit satellite images digital numbers (DN) to the top of atmosphere reflectance or at-sensor spectral radiance; 2) atmospheric correction through FLAASH (Fast Line-ofsight Atmospheric Analysis of Spectral Hypercubes),which provides an accurate, physics-based derivation of apparent surface reflectance through the derivation of atmospheric properties such as surface albedo, surface altitude, water vapor column, aerosol and cloud optical depths, surface and atmospheric temperatures from the HSI data (Kruse, 2004); and 3) conversion of narrowband albedo into broadband albedo. The spectral albedo should be converted into the broadband albedo because the Landsat data was collected from the discontinuous narrow band. Greuellet al.(2002) used the data sets from Iceland and Greenland,as well as data sets with ground-based albedo measurements from Switzerland and Antarctica, to set up equations for narrowband-to-broadband conversion for glacier ice and snow.The equations have a residual standard deviation of 0.011 for TM and 0.008 for AVHRR and can be applied without the need to classify the surface.The equation is given as follows:

whereαis the broadband albedo, andρ2andρ4is the albedo of the Landsat TM band 2 and band 4,respectively.
Equations(2)and(3)were used to convert the measured spectrum data into albedo in order to obtain the measured albedo. To verify the response function of the Landsat data to convert the measured spectrum into albedo, the measured albedo was compared with the retrieved albedo from the Landsat TM/ETM+ image taken on August 25, 2011. Seven points in the measured albedo on August 22 and 24 in 2011 were selected (Table 1). The maximum difference of the measured and retrieved albedo is-0.0549,and the difference among the other points is relatively small.The maximum error is -11.5%. Therefore, this method is highly robust.
The substantial downward trend of the reflectance with the increase of the black carbon content shows that black carbon is the primary factor affecting the reflectance of the visible region. However, it has little impact near the infrared spectral region (Figure 3).Moreover,albedo does not simply decrease with an increase in black carbon content because albedo is not controlled by a single factor.
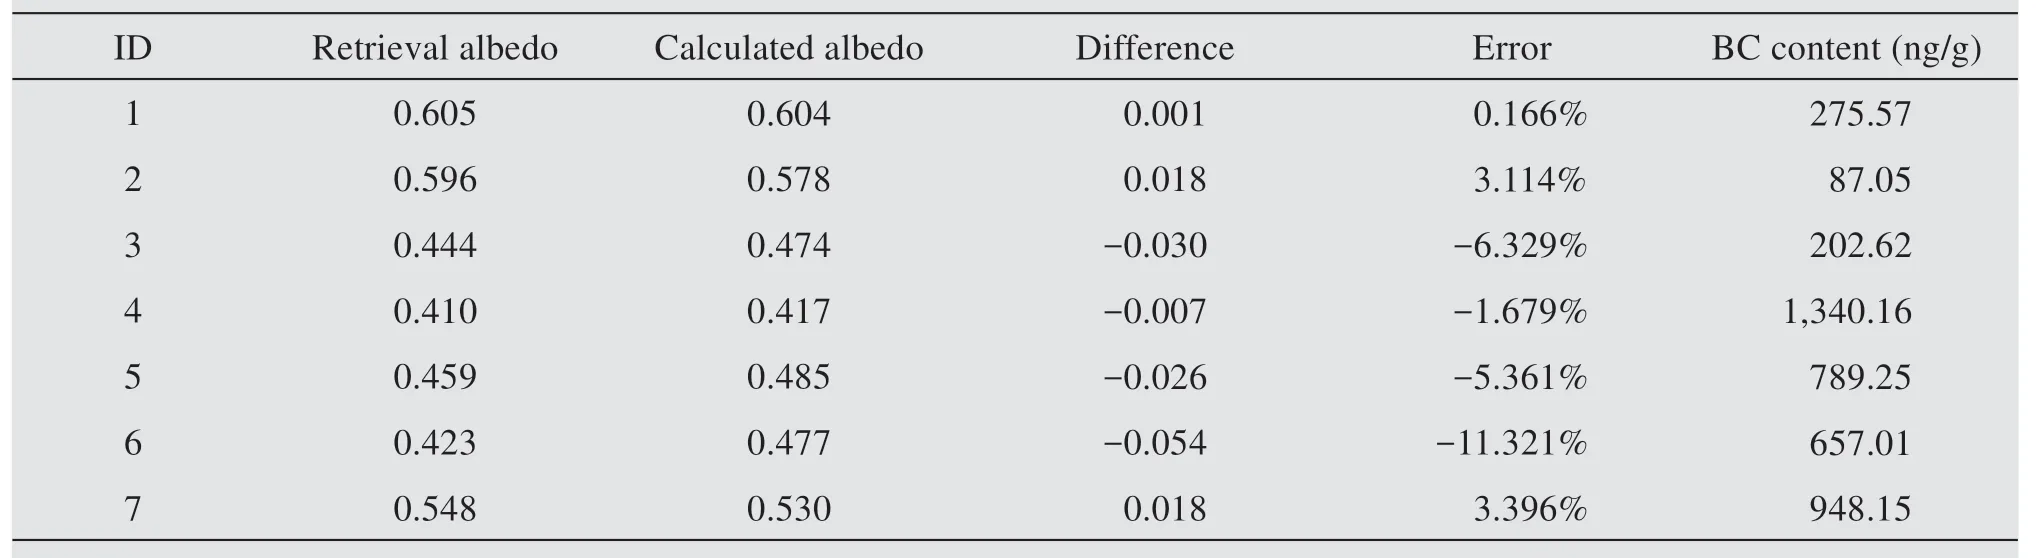
Table 1 Comparison of the retrieved albedo with the measure albedo in 2011 and black carbon content
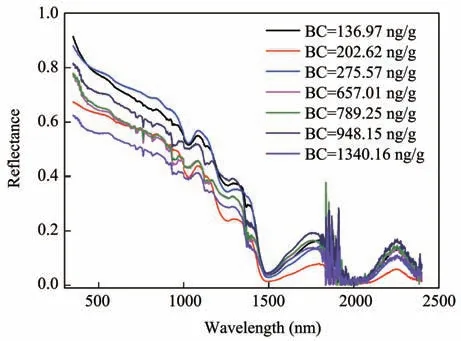
Figure 3 Spectral reflectance of snow for different black carbon content
Table 1 shows the relation between measured albedo and black carbon content based on the measured spectral reflectance.An abnormal phenomenon can be observed in three points (5#, 7#, 1#) where albedo increased with an increase of black carbon content.However, acquisition time of the 7 spectrum is fundamentally the same,and the time difference is less than 20 minutes, so the influence of solar zenith angle was ruled out. Variation of temperature data from the AWS is small; therefore the influence of snow grain size can be excluded because snow grain size is a function of temperature. Meanwhile, the sky condition image was taken simultaneously with the spectrum observation(Figure 4).
4.2 Diurnal variations of reflectance
Figure 5 shows the spectrum in the fixed point observation at 11:00-17:00 on September 15, 2011.The influence factors can be observed to affect primarily the visible region. The reflectance of snow is very high in the visible region, approximately 0.61 µm to 0.97 µm, whereas a major decrease is exhibited in the range of 750 nm to 2,500 nm in the near-infrared band. Particularly near the 1,350 nm, the reflectance displayed a nearly linear descending trend. In general,the spectral reflectance of the snow initially increased, then decreased. The maximum of the reflectance is 0.93-0.97 at 14:00 and 15:00, whereas the spectral reflectance is minimal at 17:00.The peak value is 0.85, which is mainly attributed to the effect of the solar altitude angle on the reflectance of the snow surface, that is, the reduction of the reflectance of snow caused by an increase in the solar altitude angle.
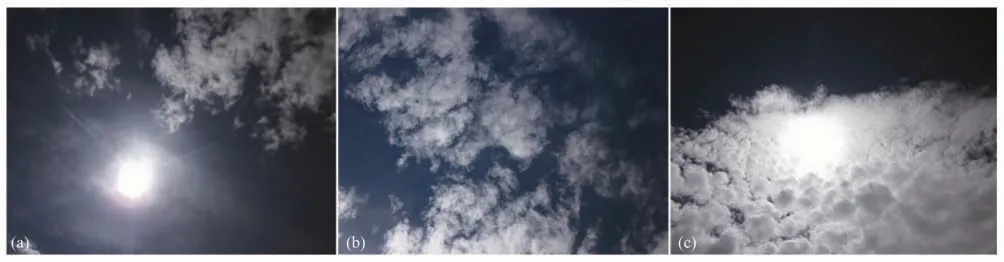
Figure 4 The sync photos of the sky condition with ASD spectral observation
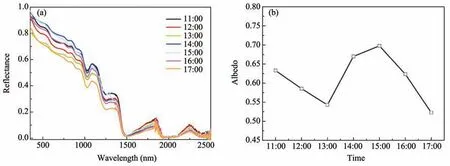
Figure 5 Variation of spectral reflectance of a fixed point during the time of 11:00-17:00 on September 15,2011(a);and the calculated albedo at the corresponding time(b)
The range of albedo is 0.52-0.70 at 11:00-17:00 on September 15, 2011. By calculating the broadband albedo of the spectral reflectance, the variation range can be obtained. Several parameters influence the albedo of snow, such as snow grain size, black carbon content, snow density, dust content, liquid water content, solar zenith angle, and atmospheric condition.However, the sky was basically cloudless on September 15, and only 3 snow samples for analyzing the black carbon content and dust content were collected:before, during, and after ablation. Consequently, the influences of the atmospheric condition, black carbon content, and dust content on albedo were ignored and not discussed here. Instead, the influences of measured snow grain size, density, liquid water content,and solar zenith angle on albedo were estimated using linear fitting. Such estimations demonstrated that the variation of snow grain size, snow density, liquid water content,and solar zenith angle could change the albedo of snow by 2.9%, 8.9%, 19.8%, and 4.0%, respectively. This conclusion is inconsistent with previous research that suggested that snow grain size and contamination are the key influence factors on albedo.However, this inconsistency may be caused by: 1) the two occurrences of snowfall before September 15; 2)good weather conditions in the study area; and 3) the average temperature was higher, about 7.3 °C, which resulted in a stronger melt and melt water does not completely flow right away.
4.3 Quantitative estimation the influence of factors on snow albedo
Snowpack heating and reflectance were predicted using the two-stream, multi-layer SNICAR model(Flanner and Zender, 2005) based on Wiscombe and Warren (1980b) and Toonet al.(1989), which treats snow as a collection of ice spheres. It obtains Mie parameters (single scattering albedo, extinction coefficient, and asymmetry parameter) for any lognormal size distribution from a lookup table computed offline.The model depends on vertically resolved effective radius (re), solar zenith angle, snow depth and density, direct and diffuse incident radiation, bare surface reflectance, and concentrations of absorbing impurities. Figure 6 shows the relationship between the simulated spectral reflectance by a SNICAR model and the measured spectral reflectance at 11:00-17:00 on September 15.The effect of the fitting curve is better except in the visible band.
A scatter diagram (Figure 7) was used to analyze the relation between the simulated reflectance and the measured reflectance, which proved a significant correction between the two values(R2=0.96,P<0.01).As the reflectance of snow is higher in the visible band and mostly distributed in the range of 0.7-1.0 µm,this phenomenon can be shown as a circle partially overlapping a parallel distribution on a graph. The simulated reflectance is lower than the measured reflectance in some near-infrared range,whereas the former is generally greater than the latter in the visible range. Therefore, the SNICAR model needs a correction factor of 0.96.
Quantitative estimation of the effect of black carbon content on snow albedo was achieved using the SNICAR model by inputting the black carbon content data collected on August 22 and September 15 and setting the other parameters as constants. Figure 8 illustrates that albedo is reduced significantly with an increase in black carbon content. However, the albedo was maintained when the black carbon content was in the range of 109 ng/g to 200 ng/g.Therefore, at noon,when the snow effective grain size ref =1,000 µm, an increase in black carbon content by 1 ng/g can lead to a decrease in albedo by 4.2%.
Similarly,the influence of snow grain size on albedo can be drawn. The variation of snow grain size was not particularly remarkable after one day, and was basically of the same order of magnitude.For instance,the measured average of half an hour of snow grain size varied between 916 µm and 1,033 µm at 10:30-17:00 on September 15. To discuss the influence of snow grain size on albedo, we inputted the range of 100-1,000 µm of snow grain size at 100 µm intervals in the SNICAR model. In addition, the average value of snow depth, density, and black carbon content were used as input parameters as well because changes in these factors are rare. Figure 9 shows that albedo is significantly reduced with an increase in snow grain size. In particular, the albedo dramatically declined when snow grain size increased from 100µm to 500 µm. However, the variation of albedo became relatively flat when the snow grain size exceeded 500µm.Therefore,when the sky is cloudless,variation of snow grain size from 100-1,000 µm can lead to a decrease in albedo by 16%.
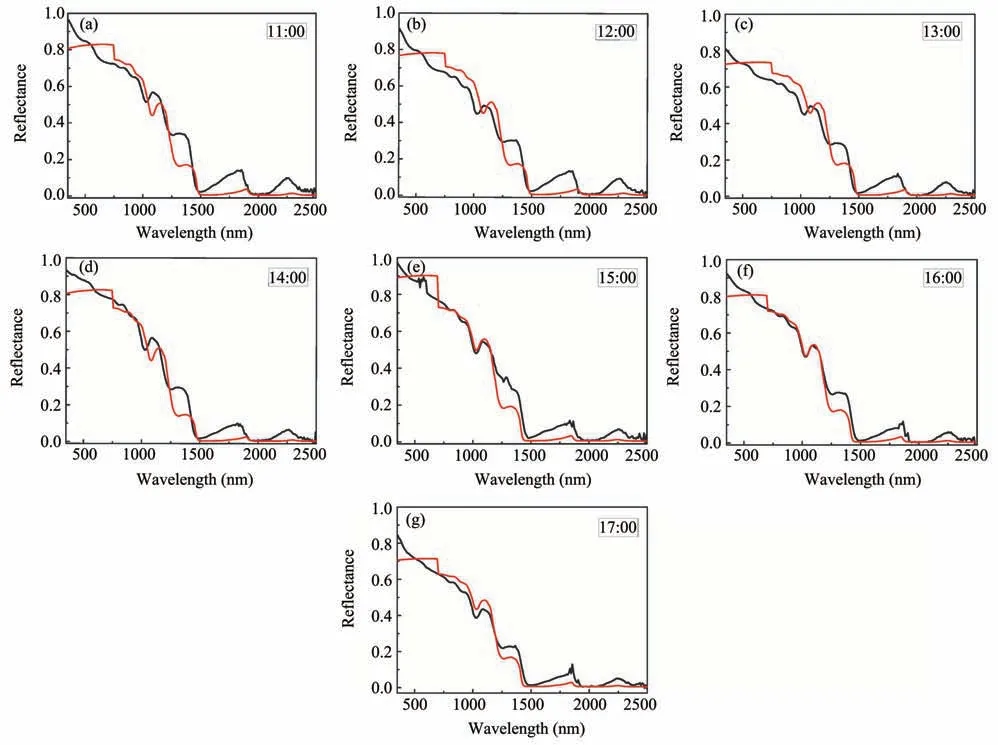
Figure 6 Measured and simulated spectral reflectance using the SNICAR model at 11:00-17:00 on September 15,2011(Red line represent the simulated reflectance;black line represent the measured reflectance)
Figure 10 shows the quantitative estimation of the effects of the measured black carbon content, snow grain size, snow density, dust content, and liquid water content on albedo at 10:00-14:00 (in order to reduce the influence of solar altitude angle) on August 22, 24 and September 15. Data analysis revealed that snow depth and albedo exhibited a positive correction,whereas snow grain size and snow depth exhibited a negative correction with albedo.This implies that albedo increases with snow depth, but decreases with snow grain size, snow density, and liquid water content. Moreover, snow albedo and contaminate content(including black carbon content and dust content) displayed a power exponent relationship, that is, albedo declined sharply with an increase in contaminate content. However, the decrease trend of albedo starts to level off when the contaminant content is increased to a certain extent.Liquid water content was the most influential factor among the several influencing factors of albedo. The variation of liquid water content may result in an about 48.5% change in albedo. Such a reaction is probably caused by the high temperature at noon, which resulted in a stronger melt, and melt water does not completely flow right away. The reflect-ing property of snow, which has the similar average grain size as a snow particle, depends on the liquid water content. When the void between snow particles was filled by the melt water with rather low albedo,the scattering ability of snow particles is significantly weakened because the melt water strongly absorbed the incident radiation. For coarse snow with a larger void, when the incident radiation was increased and scattering ability was decreased, the reflecting property exhibited a linear decline as liquid water content increased. Alteration of black carbon content can cause the albedo to change by 30.7%. Similarly, variation of snow grain size, snow depth, and dust content may cause the albedo to change by 24.2%, 19.4%, and 12.75%, respectively. In addition, the minimum contribution of snow density toward albedo change is approximately 4.4%. Research shows that snow albedo is a function of snow density (Bergen, 1975). An increase in density results in the reduction of albedo.Density is often associated with other phenomena such as snow aging and snow depth, which, similar with snow density, also influences the albedo through the variation of the snow grain size.
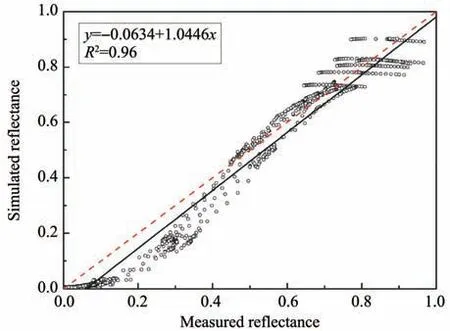
Figure 7 The relationship between the measured reflectance and simulated reflectance
Finally,atmospheric trajectories were computed using a HYSPLIT(HYbird Single-Particle Lagrangian Integrated Trajectory) model, which was developed by the NOAA Air Resources Laboratory to identify the source location of an unidentified pollutant. The HYSPLIT model employs gridded meteorological data to drive the trajectories and concentrations either forward or backward in time at regular time intervals.Our research targeted to obtain backward trajectories in 4 days at 1-day intervals; lever height was set at 500,1,000, and 3,000 m, respectively. Figure 11 shows the air parcel migration trajectories on August 24 and September 15 in 2011 over the Qiyi Glacier on Qilian Mountain.The trajectories indicated the route of the air parcel migration. Black carbon and dust were observed to originate from an air parcel brought about by westerlies during August 21 to 24 and September 12 to 15.
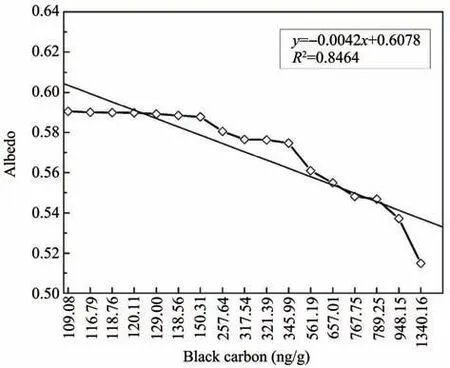
Figure 8 Simulated the influence of black carbon content on albedo when the other parameters are controlled through the SNICAR model
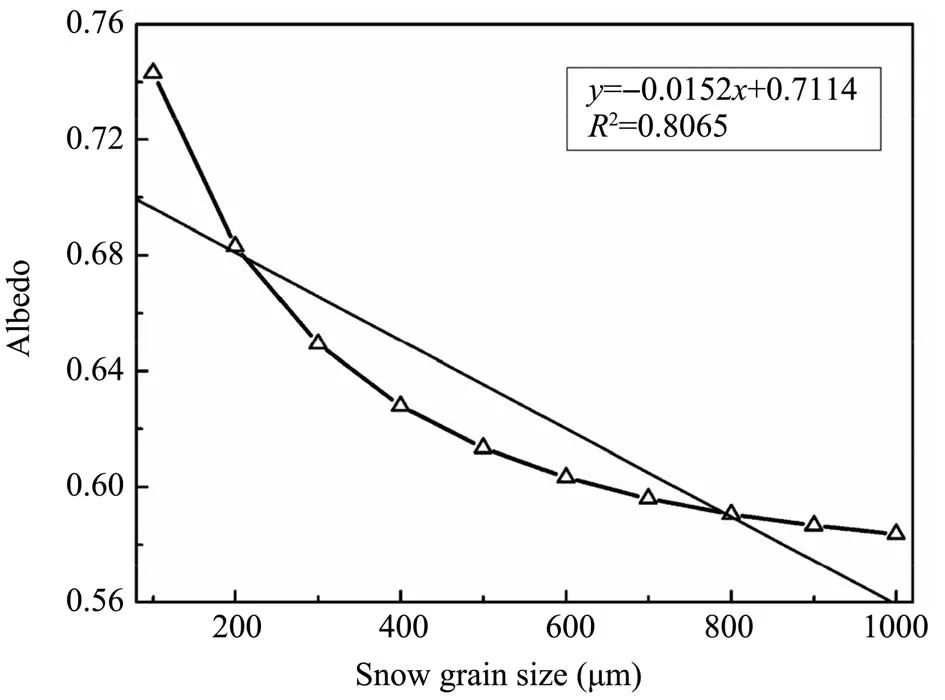
Figure 9 Simulated the influence of snow grain size on albedo when the other parameters are controlled through the SNICAR model
5 Conclusion
To quantitatively estimate the individual factors affecting albedo, the other factors must be fixed. The ideal state in the model can be achieved by controlling the other factors as demonstrated by the simulation of the influences of black carbon and snow grain size on albedo using the SNICAR model in this paper.However, field observations are often complicated and variable, so the albedo was assumed to be affected by singular factors. Hence, the impacts of black carbon, snow grain size, density, snow depth, and liquid water content on albedo were analyzed separately.Conclusions are drawn as follows:
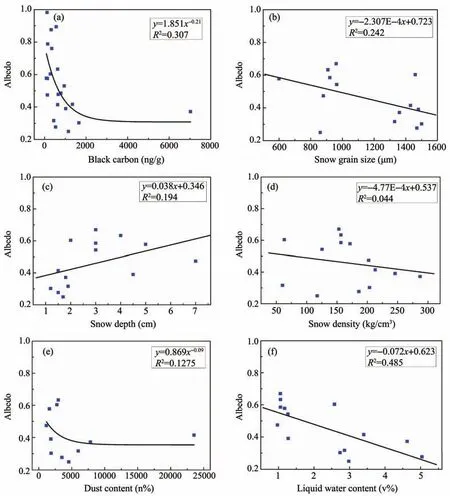
Figure 10 Quantitative estimation the influence of factors on snow albedo using measured data
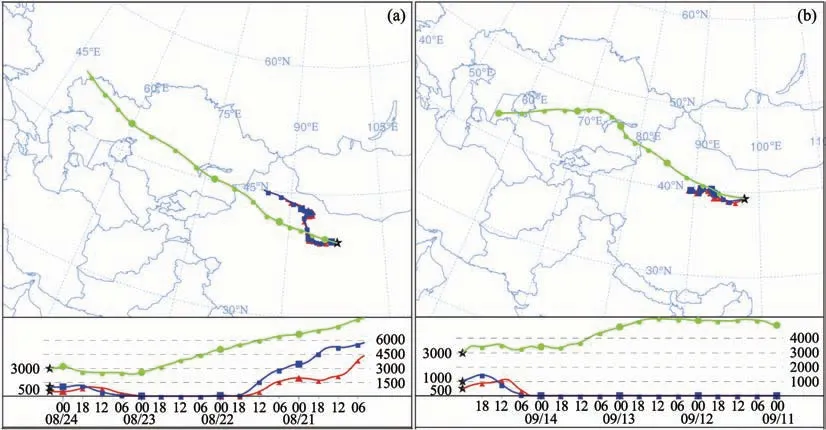
Figure 11 The backward air mass trajectories on August 24 and September 15 in 2011
Error, which may affect the accuracy of subsequent research, existed in the process of converting spectral reflectance into broadband albedo by using the empirical formula. SNICAR model was verified using measured data. The simulation was found to correlate well with observed data, although the simulated albedo may be about a factor of 0.96 higher than the measured albedo. Liquid water content was the most influential factor of albedo among the several influencing factors, followed by black carbon content and snow grain size.Finally,snow density change had the least toward albedo.HYSPLIT atmospheric trajectories model can only approximately show the source of black carbon and not clearly indicate the source region of black carbon.
Finally, contamination (black carbon and dust)and snow grain size are not the most important influencing factors on albedo under any condition. Specific circumstances, such as new snowfall events and temperature, must still be considered. Moreover,black carbon content increased to a certain degree will influence albedo (i.e., greater than 200 ng/g). In addition, cloud and solar zenith angle affect the albedo as well.
Acknowledgments:
Funding for this research was provided by the National Natural Science Foundation of China (Grant Nos.41501069, 41571415), the Strategic Priority Research Program of the Chinese Academy of Sciences (Grant Nos. XDA20060201, XDA19070302), Science &Technology Basic Resource Investigation Program of China(Grant No.2017YFC0404302).
 Sciences in Cold and Arid Regions2020年2期
- Sciences in Cold and Arid Regions的其它文章
- Thermal influence of ponding and buried warm-oil pipelines on permafrost:a case study of the China-Russia Crude Oil Pipeline
- Estimating interaction between surface water and groundwater in a permafrost region of the northern Tibetan Plateau using heat tracing method
- Spatial and temporal transferability of Degree-Day Model and Simplified Energy Balance Model:a case study
- The heterogeneity of hydrometeorological changes during the period of 1961-2016 in the source region of the Yellow River,China
- Distribution patterns of planted-shrubs of different restoration ages in artificial sand-fixing regions in the southeastern Tengger Desert